Article

Electrochemical DNA Sensor Based on Poly(proflavine) Deposited from Natural Deep Eutectic Solvents for DNA Damage Detection and Antioxidant Influence Assessment

1
A.M. Butlerov’ Chemistry Institute, Kazan Federal University, 18 Kremlevskaya Street, Kazan 420008, Russia
2
Interdisciplinary Center of Analytical Microscopy, Kazan Federal University, 18 Kremlevskaya Street, Kazan 420008, Russia
3
Analytical Chemistry Department, Chemical Technology Institute, Ural Federal University, 19 Mira Street, Ekaterinburg 620002, Russia
*
Authors to whom correspondence should be addressed.
Chemosensors 2024, 12(10), 215; https://doi.org/10.3390/chemosensors12100215
Submission received: 2 September 2024 / Revised: 27 September 2024 / Accepted: 1 October 2024 / Published: 16 October 2024
(This article belongs to the Special Issue Electrochemical Biosensors: Advances and Prospects)

Abstract

:
Electrochemical DNA sensors for DNA damage detection based on electroactive polymer poly(proflavine) (PPFL) that was synthesized at screen-printed carbon electrodes (SPCEs) from phosphate buffer (PB) and two natural deep eutectic solvents (NADESs) consisting of citric or malonic acids, D-glucose, and a certain amount of water (NADES1 and NADES2) were developed. Poly(proflavine) coatings obtained from the presented media (PPFLPB, PPFLNADES1, and PPFLNADES2) were electrochemically polymerized via the multiple cycling of the potential or potentiostatic accumulation and used for the discrimination of thermal and oxidative DNA damage. The electrochemical characteristics of the poly(proflavine) coatings and their morphology were assessed using cyclic voltammetry (CV), electrochemical impedance spectroscopy (EIS), and scanning electron microscopy (SEM). The working conditions for calf thymus DNA implementation and DNA damage detection were estimated for all types of poly(proflavine) coatings. The voltammetric approach made it possible to distinguish native and chemically oxidized DNA while the impedimetric approach allowed for the successful recognition of native, thermally denatured, and chemically oxidized DNA through changes in the charge transfer resistance. The influence of different concentrations of conventional antioxidants and pharmaceutical preparations on oxidative DNA damage was characterized.

1. Introduction

An emerging tool in DNA damage detection is the use of electrochemical biosensors due to their low cost, ease of manufacturing, fast response, excellent reproducibility, and sensitivity [1]. Damage to double-stranded DNA (dsDNA) structures can be caused by different factors, i.e., chemical oxidative damage from drugs [2], nucleases, or reactive oxygen species (ROS) [3]; ionizing radiation [4]; ultrasound [5]; temperature [6]; or electric field action [7]. During oxidative stress, the processes caused by high levels of different ROS cellular antioxidant systems cannot be fully neutralized. As a result, ROS cause harm to proteins, lipids, nucleic acids, and cell structures. These disruptions can strongly affect the cell state up to cell death [8]. Generally, oxidative DNA damage can be the cause of mutations, premature aging, and the initiation of serious diseases such as different forms of cancer, diabetes, neurological disorders [9], asthma, atherosclerosis [8], and even Alzheimer’s disease [10]. Therefore, the development of precise sensors for DNA damage detection is a pressing challenge.
Electrochemical DNA sensors can be used for complementary chain hybridization detection [11], intercalator determination [12], and DNA damage registration [13]. Often, DNA sensors contain electropolymerized monomers that constitute the layer responsible for redox signal generation and a DNA layer as a biorecognizing element. Differently charged polymers (positive) and DNA molecules (negative) ensure the electrostatic immobilization of the bioreceptor. Various conductive (polyaniline, polypyrrol, poly(3,4-ethylenedioxythiophene)) and electroactive (polyphenothiazines, polyazines, polyphenoxazines, polyacridines) polymers can be used in DNA sensor assembly [14]. Proflavine acridine dye with two primary amino groups is of interest, among other substances (Figure 1).
Proflavine can intercalate dsDNA and is often used as an electrochemical indicator to investigate hybridization events by means of electrochemical impedance spectroscopy (EIS) or voltammetry measurements [15,16]. Dye electropolymerization leads to the formation of an electroactive polymer coating that can be used in electrochemical sensors and biosensors [17].
However, there are some disadvantages of electropolymerization that should be overcome to broaden the application of electrochemical biosensors in medicine, food safety, and ecology. Organic monomers have low solubility in aqueous media and could reduce the efficiency of electropolymerization. To solve this problem, natural deep eutectic solvents (NADESs) can be used. NADESs are formed from hydrogen bond acceptor (HBA) and hydrogen bond donor (HBD) molecules; their combination results in a decrease in the mixture’s melting point compared to that of the initial components. NADES components, e.g., sugars, organic acids, amino acids, polyols, urea, and choline chloride, widely occur in cells [18]. Organic molecules (rutin, paclitaxel, ginkgolide B) and even macromolecules (DNA, albumin, starch) show much better solubility in NADESs compared with water [19]. The electropolymerization from NADESs can be used to obtain polymeric layers with diverse morphologies and promising electrochemical characteristics [20]. The majority of NADES media previously used for electropolymerization are based on choline chloride as a conventional HBA. Mixtures of other perspective components such as organic acids, amino acids, polyols, and sugars have been used as media for prosperous metal nanoparticle synthesis [21] and in numerous extraction applications in food analysis [22] and medicine [23]. However, there have only been a few cases of their use as electropolymerization media for DNA sensor development [24,25,26].
In this work, we describe the determination of DNA thermal and oxidative damage with a DNA sensor based on poly(proflavine) electropolymerized from natural deep eutectic solvents containing citric or malonic acids, glucose, and water. Impedimetric DNA sensors were developed, allowing us to distinguish native, thermally denatured, or chemically oxidized DNA by changes in the charge transfer resistance. The antioxidative effect of three different antioxidants—ascorbic acid, quercetin, and hydroquinone—were evaluated. It was shown that they can exert either a pro-oxidative or an antioxidative influence on oxidative mixtures depending on their concentration.

2. Materials and Methods

2.1. Reagents

3,6-diaminoacridine hydrochloride (proflavine) (dye content 95%) and DNA from calf thymus were purchased from Sigma-Aldrich (Saint Louis, MO, USA). D-glucose was obtained from Fischer Chemical (Loughborough, UK), citric acid monohydrate was from Tatchimproduct (Kazan, Russia), and malonic acid was from Acros Organics (Geel, Belgium). Other reagents were used without additional purification due to their being of analytical grade. Millipore Q deionized water was used for all working solutions. Voltammetric and impedimetric investigations were carried out in 0.025 M phosphate buffer (PB), pH 7.0, which contained 0.1 M KCl. The pH value range changed from 2.0 to 9.0 in the pH dependence experiments.

2.2. Apparatus

The potentiostat–galvanostat AUTOLAB PGSTAT 302N (Metrohm Autolab b.v., Utrecht, The Netherlands), with an FRA2 module, was used to conduct voltammetric and EIS investigations. A three-electrode system was designed as a screen-printed carbon electrode (SPCE). A DEC 248 printer (DEK, London, UK) was utilized for SPCE printing on Lomond PE DS Laser Film (thickness 125 µm, Lomond Trading Ltd., Douglas, Isle of Man). Conductive tracks were created using PSP-2 silver paste (Delta-Paste, Moscow, Russia) and carbon/graphite paste C2030519P4 (Gwent group, Pontypool, UK). Dielectric paste D2140114D5 (Gwent group, Pontypool, UK) was applied for printing an insulating layer. The SPCEs were treated at 80 °C until full solidification. The dimensions of the three-electrode system were 11 × 27 mm and the working electrode area was equal to 3.8 mm2. A Ag/AgCl pseudo-reference electrode was a part of screen-printed system and all potentials were given versus this one. The boxed connector (DropSens, S.L., Asturias Llanera, Spain) provided the SPCEs contact with the potentiostat. The PPFL layers were characterized using cyclic voltammetry (CV) and EIS approaches.
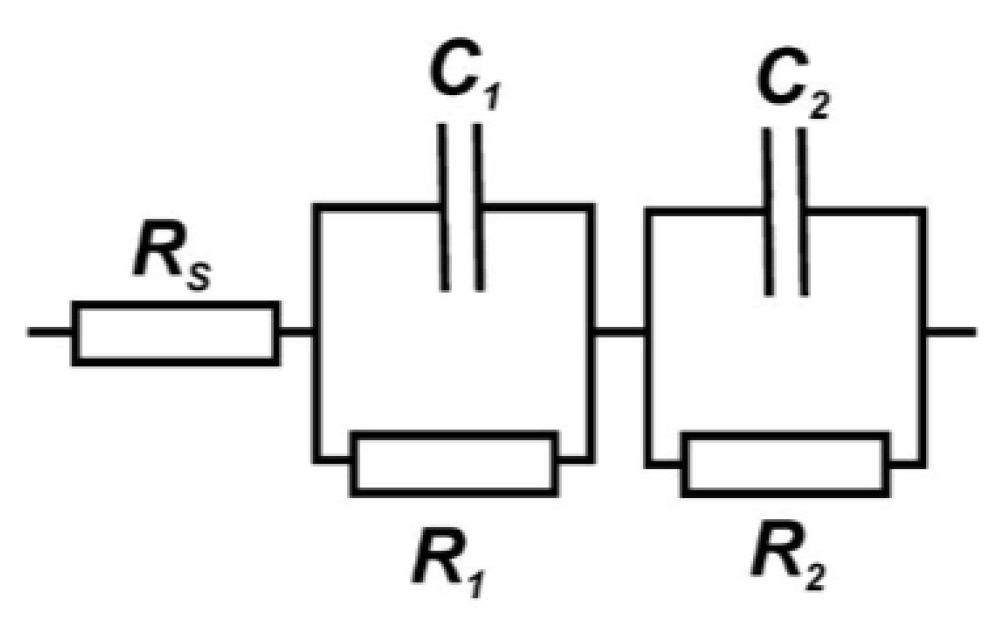
The EIS measurement parameters were established as follows: potential frequency from 100 kHz to 0.04 Hz; amplitude of the applied sine potential—5 mV. The half-sum of the peak potentials for 0.01 M [Fe(CN)6]3−/4−redox probe in 0.025 M PB was accepted as the equilibrium potential. Nyquist diagrams were recorded using the conventional Randles equivalent circuit Rs(C[RW]), where Rs is the resistance of the solution, R is the charge transfer resistance, C is the capacity, and W is the Warburg impedance. The impedance parameters were further calculated from the Nyquist diagram fitting corresponding to the Rs(R1C1)(R2C2) equivalent circuit using NOVA 1.11.2 software (Metrohm Autolab b.v., Utrecht, The Netherlands).
Metrohm DropSens DRP-110 SPCEs (DropSens, S.L., Asturias Llanera, Spain) were used as a substrate for modifying coatings to obtain scanning electron microscopy (SEM) images with the help of a Merlin™ high-resolution field-emission scanning electron microscope (Carl Zeiss AG, Oberkochen, Germany) and ZeissSmartSEM software (V05.06).
ImageJ 1.54g free software was used for polymer particle size assessment based on the SEM images.
Statistical data treatment was performed using OriginPro 8.1 software (OriginLab Corp., Northampton, MA, USA).

2.3. Proflavine Electropolymerization and DNA Sensor Assembling

NADES1 was prepared by mixing 0.21 g of citric acid monohydrate and 0.18 g of D-glucose with 90 µL of deionized Millipore Q® water (Simplicity® water purification system, Merck-Millipore, Mosheim, France). The molar ratio of NADES1 was equal to 1:1:6 for citric acid, D-glucose, and water, respectively. NADES1 containing 0.085 M proflavine was prepared by adding 6.6 mg of proflavine to the NADES1 components listed above.
NADES2 was prepared as a mixture of 0.1 g malonic acid and 0.18 g D-glucose with the addition of 108 µL of deionized Millipore Q® water. The molar ratio of NADES2 corresponded to 1:1:6 for malonic acid/D-glucose/water. NADES2 containing 0.085 M proflavine was prepared by adding 6.6 mg of proflavine to the NADES2 components listed above.
All components of NADES1 and NADES2 were homogenized by vortexing for 1 min, followed by sonication for 30 min. The ultrasound-assisted approach was successfully used as a fast and safe method for the synthesis of NADES1 [24] and reline [27] deep eutectic solvents in previous work carried out by our group.
After the synthesis, 100 µL of the NADES1 or NADES2 containing 0.085 M proflavine was drop-casted onto the three-electrode system to obtain full coverage of the electrodes’ surface. Three variants of electropolymerization were used to obtain the polymer layers: potentiodynamic, potentiostatic, and mixed modes. In potentiodynamic mode, the potential was cycled 20 times between −1.2 and 1.2 V at a scan rate of 0.1 V/s. In potentiostatic mode, a potential of 1.2 V was applied for 300 s. In mixed mode, a potential of 1.2 V was applied for 300 s followed by 20 cycles between −1.2 and 1.2 V at a scan rate 0.1 V/s. The appropriate coatings are denoted below as PPFLNADES1 and PPFLNADES2.
As a reference, PPFLPB was also obtained from the 0.5 mM proflavine solution in 0.025 M PB. A lower proflavine concentration in aqueous solution was associated with worse solubility in water against NADESs. SPCE was covered with 100 µL of proflavine solution and the potential of the electrode was cycled 20 times between −0.6 and 1.2 V at a scan rate of 0.1 V/s. The resulting layer was denoted as PPFLPB.
After the electropolymerization, the electrodes were washed with deionized water and dried in air at ambient temperature. Before the DNA immobilization, the electrochemical stabilization of the polymer layers was carried out to remove all unbound components of the coverings. There were several approaches that were tested for the best stabilization effect: stabilization in open circuit mode (100 µL of working PB buffer drop-casted onto the SPCE, 30 min), multiple scanning in 100 µL of working PB buffer with or without changing the solution after each cycle (10 cycles between −0.6 and 0.6 V, 0.1 V/s), and polarization at anodic potential followed by multiple scanning (1 V, 300 s, and then 10 cycles between −0.6 and 0.6 V, 0.1 V/s). Different stabilization approaches were chosen as optimal methods for each electropolymerization medium used: stabilization in open circuit mode for PPFLPB, multiple scanning in one drop of working PB buffer for PPFLNADES1, and multiple scanning in one drop of working PB buffer with previous polarization for PPFLNADES2.
To immobilize DNA from calf thymus, a 2 µL aliquot of 1 mg/mL DNA solution in deionized water was dried or incubated at the working electrode surface from 10 to 40 min under Eppendorf tube. DNA samples were either native or thermally denatured or chemically oxidized. The DNA stock solution was heated at 95 °C for half an hour and then sharply cooled in ice crumbs for 5 min to perform thermal denaturation. The oxidative mixture consisted of 0.9 mL of 4 mM CuSO4 and 1.3 μL of 30% H2O2 and was used for oxidative DNA damage after 1 h of treatment. To remove cupric ions from the resulting layer, 4 mM ethylenediaminetetraacetic acid disodium salt (EDTA) solution was used. Another variant of DNA oxidation was performed by its treatment with Fenton reagent consisting of 0.4 mM EDTA, 2 M NaOH, 0.1 mM FeSO4, 0.4 mM ascorbic acid, and 0.9 mM H2O2.

2.4. Antioxidative Effect Assessment and Real-Sample Analysis

To evaluate the antioxidative effects of commonly used antioxidants—ascorbic acid, quercetin, and hydroquinone—standard solutions (1 mM–0.1 µM) were added to the oxidative mixture based on CuSO4 and H2O2 within its interaction with DNA. Furthermore, the antioxidative effects of pharmaceutical preparations containing ascorbic acid (sachet and tablets with glucose) were investigated. All pharmaceutical preparations were bought at local pharmacies.

3. Results

3.1. Electropolymerization of Proflavine and Estimation of Poly(proflavine) Electrochemical Characteristics

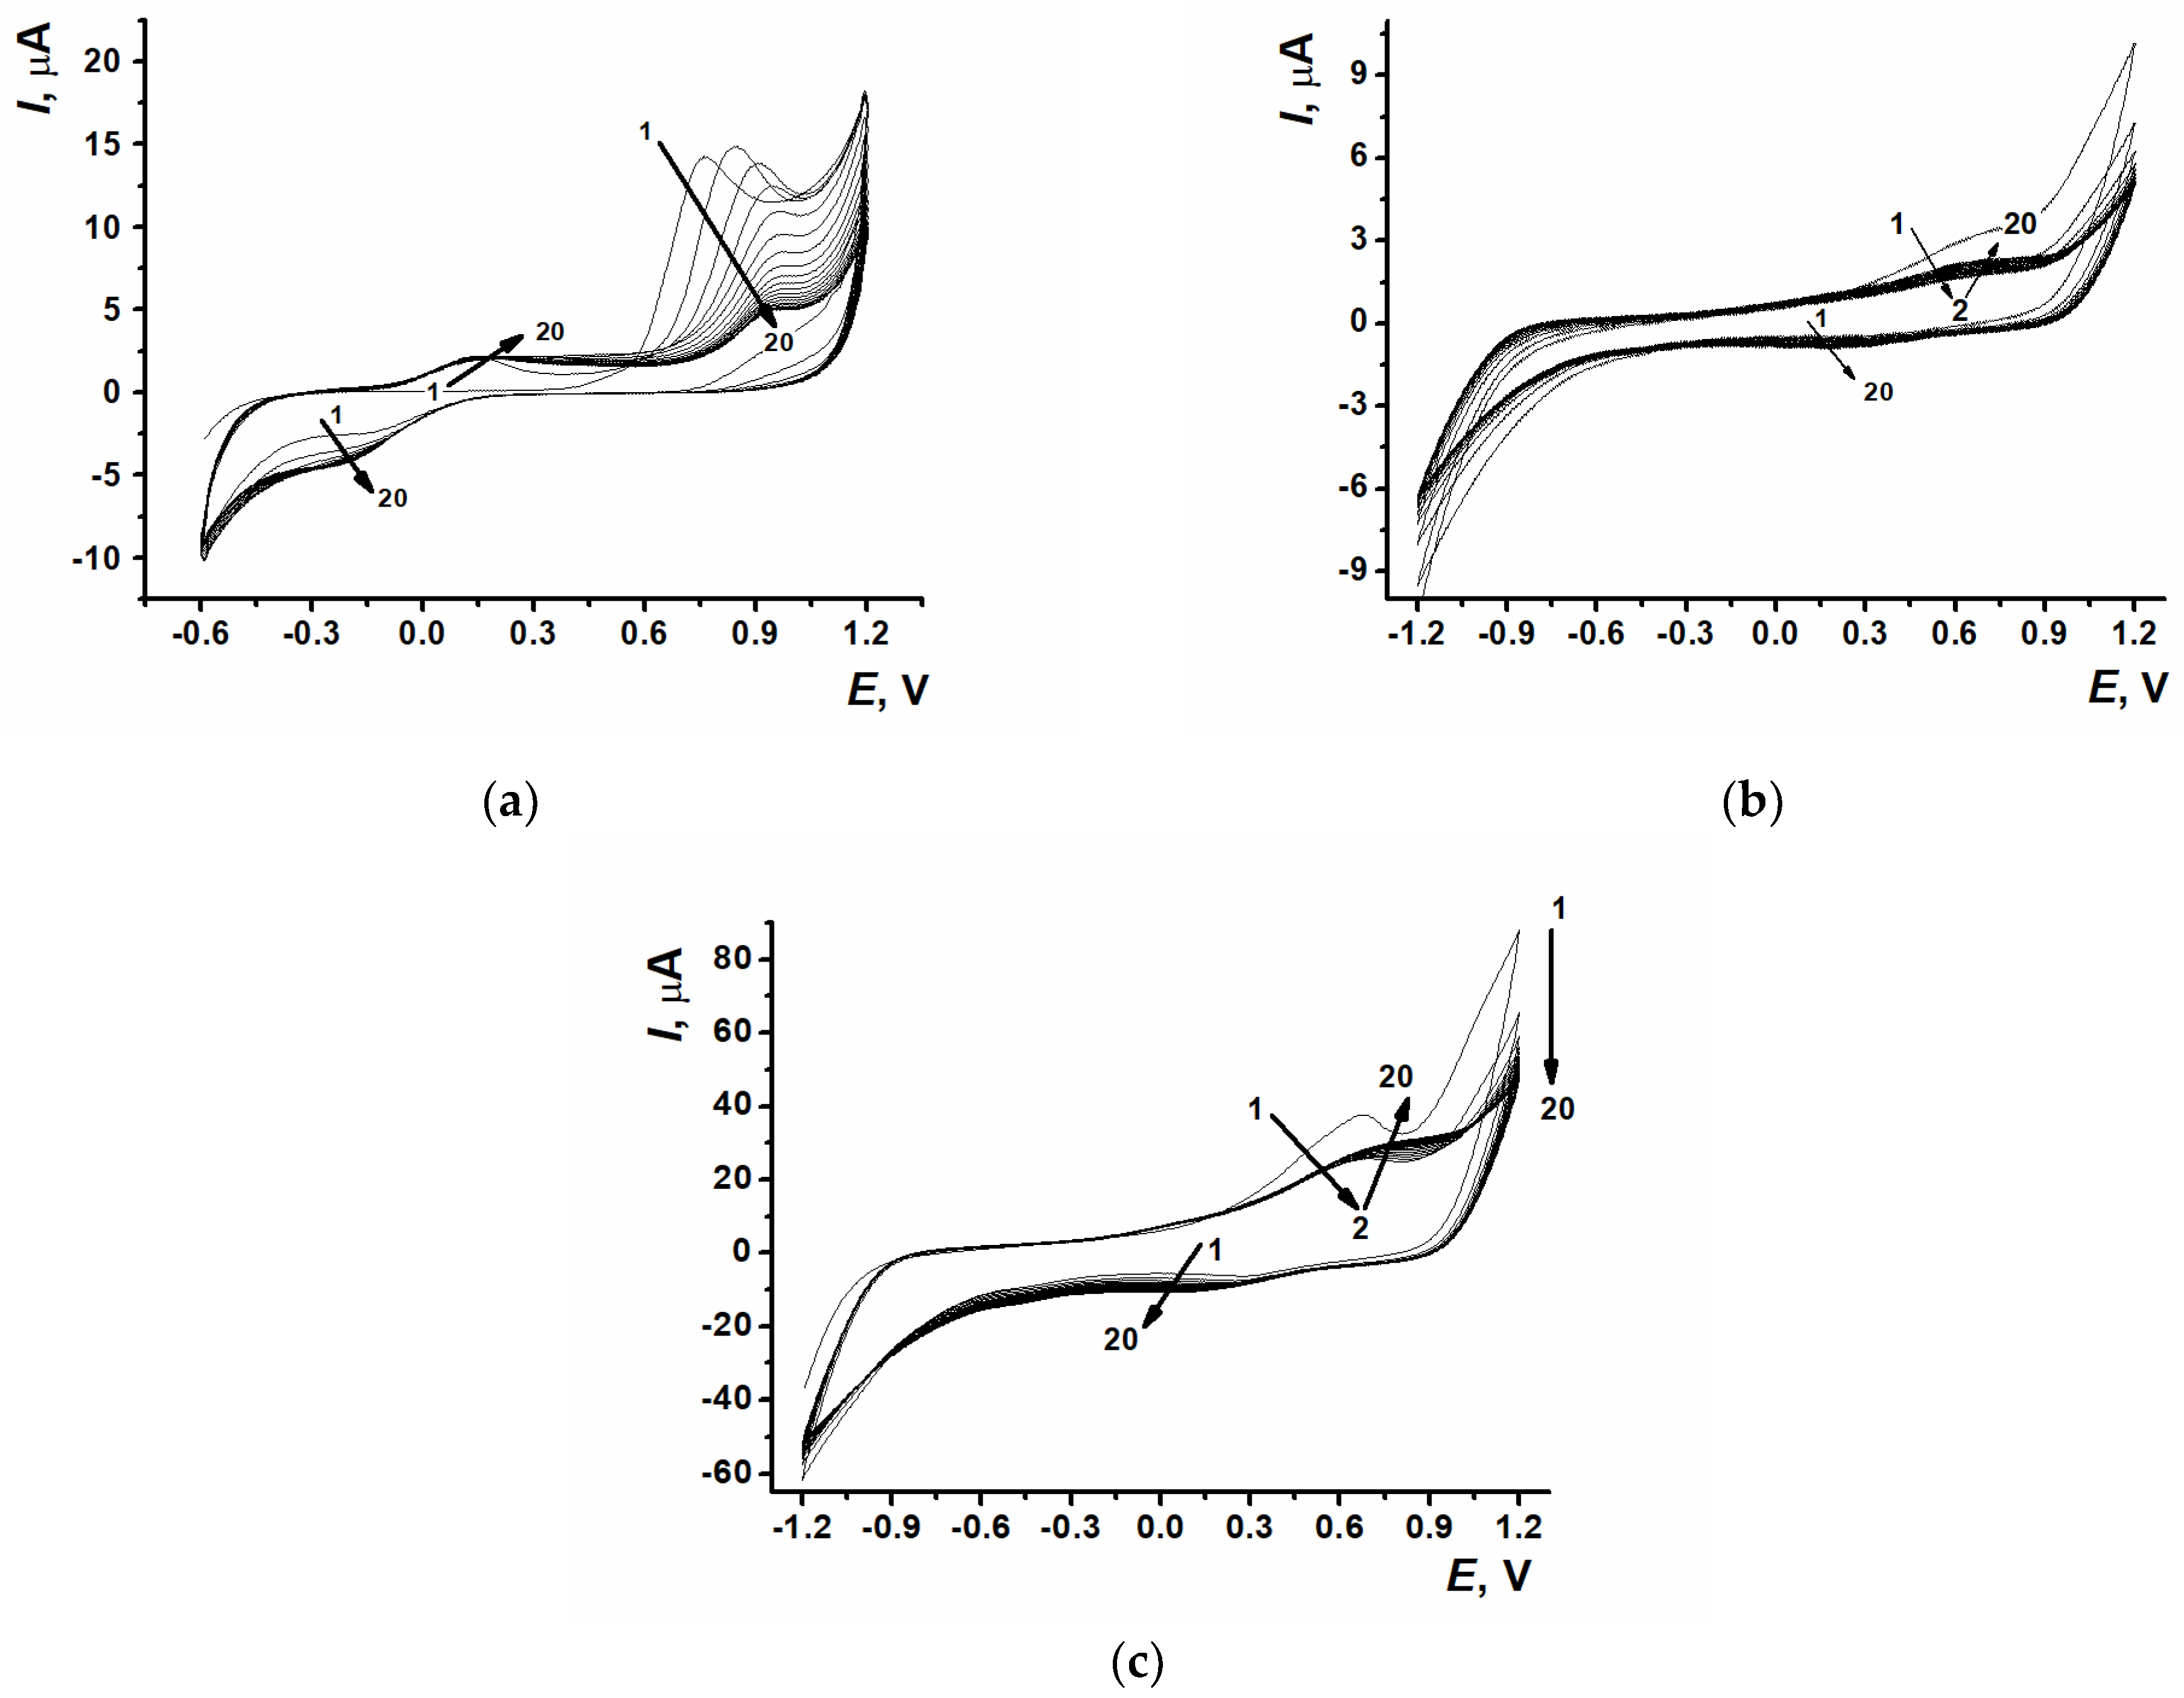
The multiple scanning of the potential in 0.5 mM proflavine solution in 0.025 M PB, pH 7.0, highlighted characteristic changes in the redox peaks on voltammograms (Figure 2a). At the first scan, the irreversible oxidation wave at about +0.75 V was detected, corresponding to the cation radical formation. The sufficiently low potential of cation radical formation could be attributed to the presence of two primary amino groups in the dye molecule [28]. This peak decreased with the scan number, indicating the involvement of the cation radicals into the chain growth processes. The potential shift of the redox peaks on the voltammograms was attributed to the accumulation of oligomeric and polymeric products on the SPCE surface, leading to minor electron transfer hindrance due to an increase in the layer thickness. The pair of redox peaks at +0.15 and −0.27 V was attributed to the poly(proflavine) layer formation on the SPCE surface. The increase in these peaks proved the successful deposition of the polymer. The peak positions on the potential axis differ slightly from those formed on the GCE surface shown in Ref. [17].
Multiple cycling voltammograms recorded for NADES1 containing 0.085 M proflavine are presented in Figure 2b. The redox peaks of the polymeric form in the viscous NADES1 were less resolved and shifted to the anodic area (+0.6 and +0.15 V), which indicated that electron transfer was hampered. Cation radical formation signals appeared at potentials of approximately 1.1 V and consequently reduced with the scan number. The decay of the signal from the first to the second scan could be attributed to the filling of the sensor surface with the deposited electropolymerization product and the transfer from the bare to the modified surface. From the second to the twentieth cycle, the currents grew because of the deposition of the conductive product, which acts as a mediator system and promotes redox processes. As the NADES2 viscosity was less than that of NADES1 and the diffusion of the monomer was less hindered, the peaks on voltammogram 2c (at +0.6, +0.1, and +1.1 V) were much higher and better resolved. The appearance and behavior of the polymer peaks and cation radical signals in NADES2 were similar to those in NADES1.
Together with the potentiodynamic mode of electropolymerization in NADES1 and NADES2, potentiostatic and mixed modes were tested (Figure S1). In the case of 0.085 M proflavine in NADES1 solution, the use of the mixed mode led to the better expressiveness of the redox peaks that could be attributed to the greater accumulation of polymeric product onto the SPCE surface during the two polymerization steps (potentiostatic + potentiodynamic). The accumulation of the electroactive polymer resulted in larger potential differences between the poly(proflavine) redox peaks. The current drop in the potentiostatic mode for the 0.085 M proflavine in NADES2 (Figure S1c) was less rapid than in NADES1 (Figure S1a).
The SPCE modified with PPFLPB, PPFLNADES1, and PPFLNADES2 demonstrated a pair of peaks on the cyclic voltammogram (Figure S2) when transferred to the working buffer with no monomer. The potentiostatic mode was chosen for PPFLNADES1 as it had demonstrated higher redox current values and good signal reproducibility. For PPFLNADES2, in spite of higher currents in the mixed regime, potentiodynamic electropolymerization was preferred as it showed better signal reproducibility.
Three types of polymeric layer signal stabilization were used in this investigation (see Section 2.3). The stability of the redox signals was assessed for six electrodes modified using the same set of reagents. All three stabilization approaches gave the same average redox signal for PPFLPB, but better signal reproducibility was obtained after stabilization in the open circuit mode. For PPFLNADES1, multiple cycling led to an increase in redox currents during stabilization, which required the additional treatment of polymer coating. Changing the working buffer solution after each scan resulted in the partial degradation of the coating and the poor reproducibility of the redox signal; hence, multiple scanning with no working buffer change was chosen as the optimal stabilization technique. This technique was also preferable for the PPFLNADES2 coating.
The slope of the bilogarithmic dependence of the peak current (Ip) on the scan rate (ν) for PPFLPB indicated the mixed diffusion–adsorption control of the polymer conversion (d(logIpa)/d(logν) = 0.769 ± 0.012 and d(logIpc)/d(logν) = 0.857 ± 0.008, respectively). The use of natural deep eutectic solvents instead of aqueous solutions resulted in a higher contribution of adsorption in the limiting step of the redox conversion. The slopes were equal to d(logIpa)/d(logν) = 0.900 ± 0.005 and d(logIpc)/d(logν) = 0.893 ± 0.004 and d(logIpa)/d(logν) = 0.881 ± 0.006 and d(logIpc)/d(logν) = 0.887 ± 0.005 for PPFLNADES1 and PPFLNADES2, respectively. Typical voltammograms of SPCEs covered with PPFLPB, PPFLNADES1, and PPFLNADES2 are shown in Figure S3.
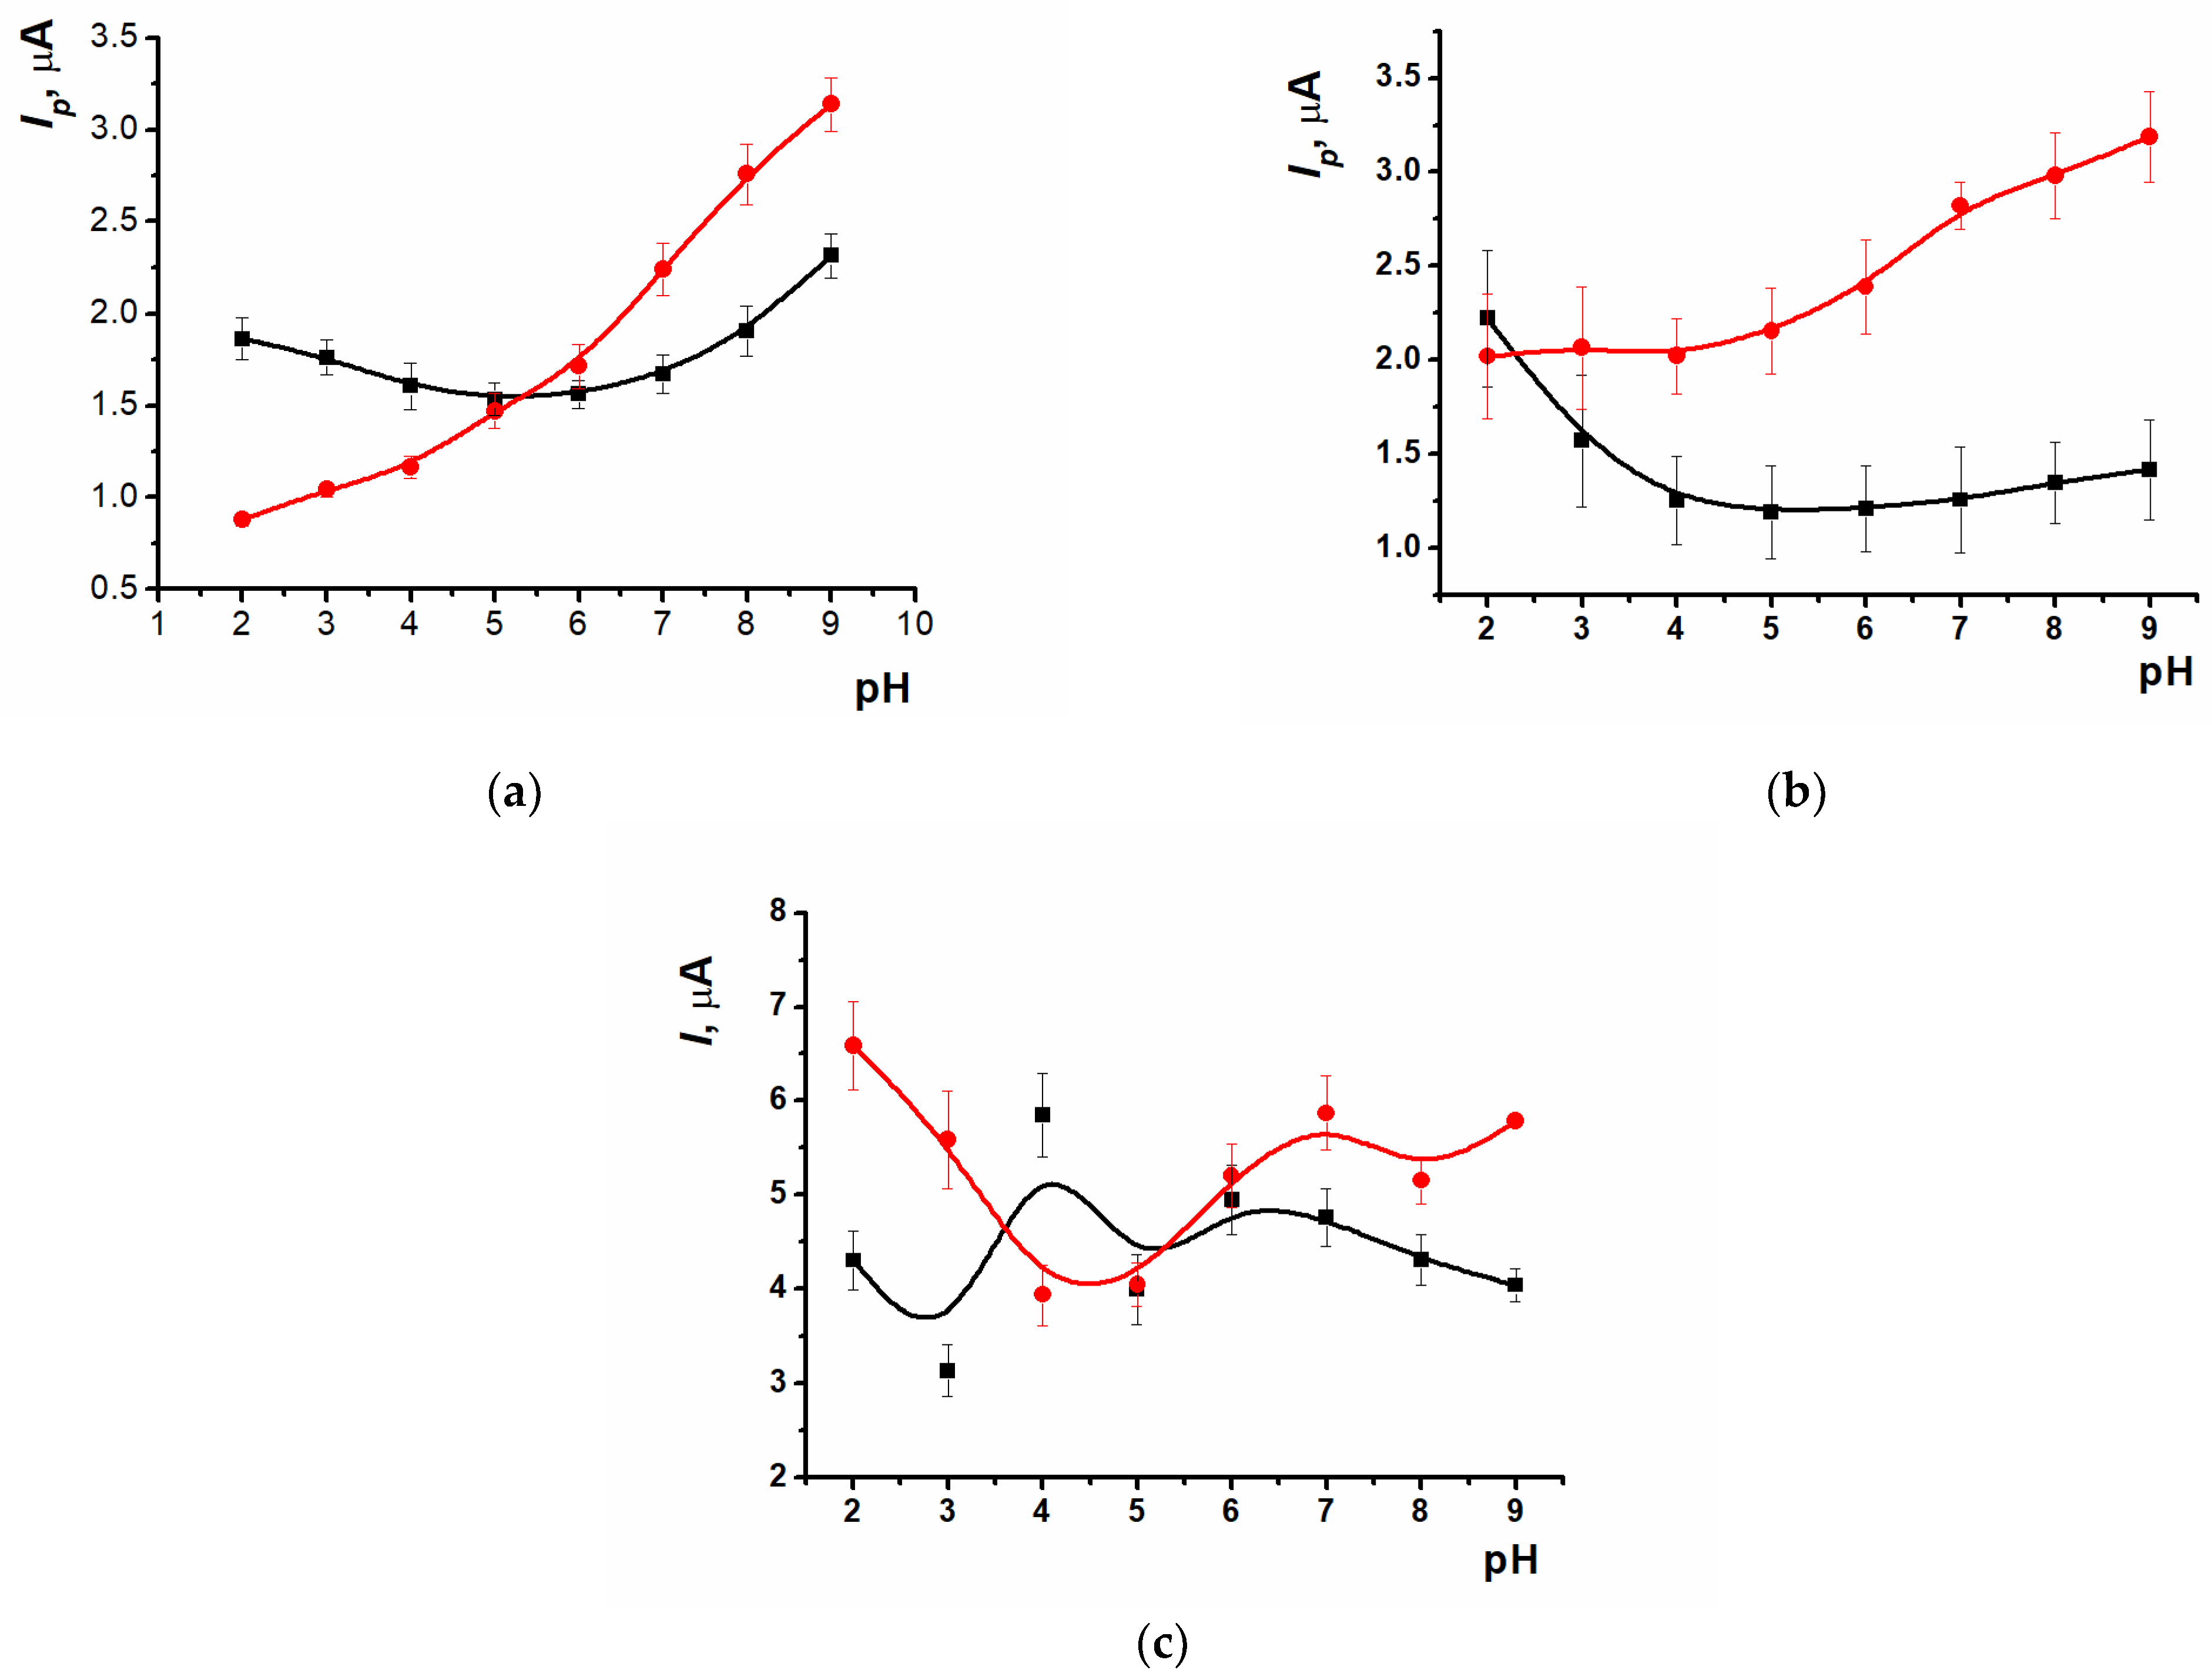
The pH dependences for the obtained poly(proflavine) coatings were also compared and the relevant electrochemical characteristics were calculated. Typical voltammograms for PPFLPB, PPFLNADES1, and PPFLNADES2 in 0.025 M PB in pH ranging from 2.0 to 9.0 are presented in Figure S4. The oxidation peak current of PPFLPB decreased in pH ranging from 2.0 to 5.0, stabilized in weakly acidic areas, and increased from neutral to alkaline media. The reduction peak current of PPFLPB increased with the pH across the entire range studied (Figure 3a) whereas its value for PPFLNADES1 was stable in strongly acid media and demonstrated an increase with the transfer from weakly acidic to alkaline solutions. On the contrary, PPFLNADES1 showed a reduction in the oxidation peak current in pH ranging from 2.0 to 5.0 and then remaining unchanged up to pH 9.0 (Figure 3b). The oxidation peak current of PPFLNADES2 changed irregularly in pH, ranging from 2.0 to 6.0 with a slight decrease up to pH 9.0. The reduction peak current of PPFLNADES2 decreased in strongly acidic and alkaline solutions, with the maximum observed at pH ranging from 5.0 to 7.0 (Figure 3c).
The half-sum of the peak potentials on the voltammograms was used as an estimate of the equilibrium potential Em. The appropriate slopes of the linear range (2–9) of the Em-pH dependencies for all poly(proflavine) coatings are presented in Table 1.
The closest value to the theoretical Nernstian slope value was achieved with the PPFLNADES2 layer, corresponding to the transfer of an equal number of electrons and protons in the electrode reaction. The small deviation from the Nernstian slope detected for two other coatings could be attributed to the non-equilibrium state of the polymeric coatings.

3.2. Scanning Electron Microscopy and Particle Size Evaluation

SEM was used to estimate the morphology of the poly(proflavine) coatings synthesized from different media. In the absence of polymer, the bare SPCE showed carbon nanoparticles with a well-defined structure, with an average size of 35 ± 5 nm (Figure 4a). As can be seen from Figure 4, electropolymerization in phosphate buffer and NADESs was carried out on carbon nanoparticles, and different efficiencies were observed. After proflavine electropolymerization from phosphate buffer, PPFLPB exhibited a microgranular layer consisting of microspheres with an average size of approximately 57 ± 9 nm (Figure 4b). In contrast to this, the coatings obtained from the natural deep eutectic solvents demonstrated a uniform layer consisting of smaller polymer granules with average sizes of 46 ± 8 nm and 42 ± 4 nm for PPFLNADES1 and PPFLNADES2, respectively (Figure 4c,d).
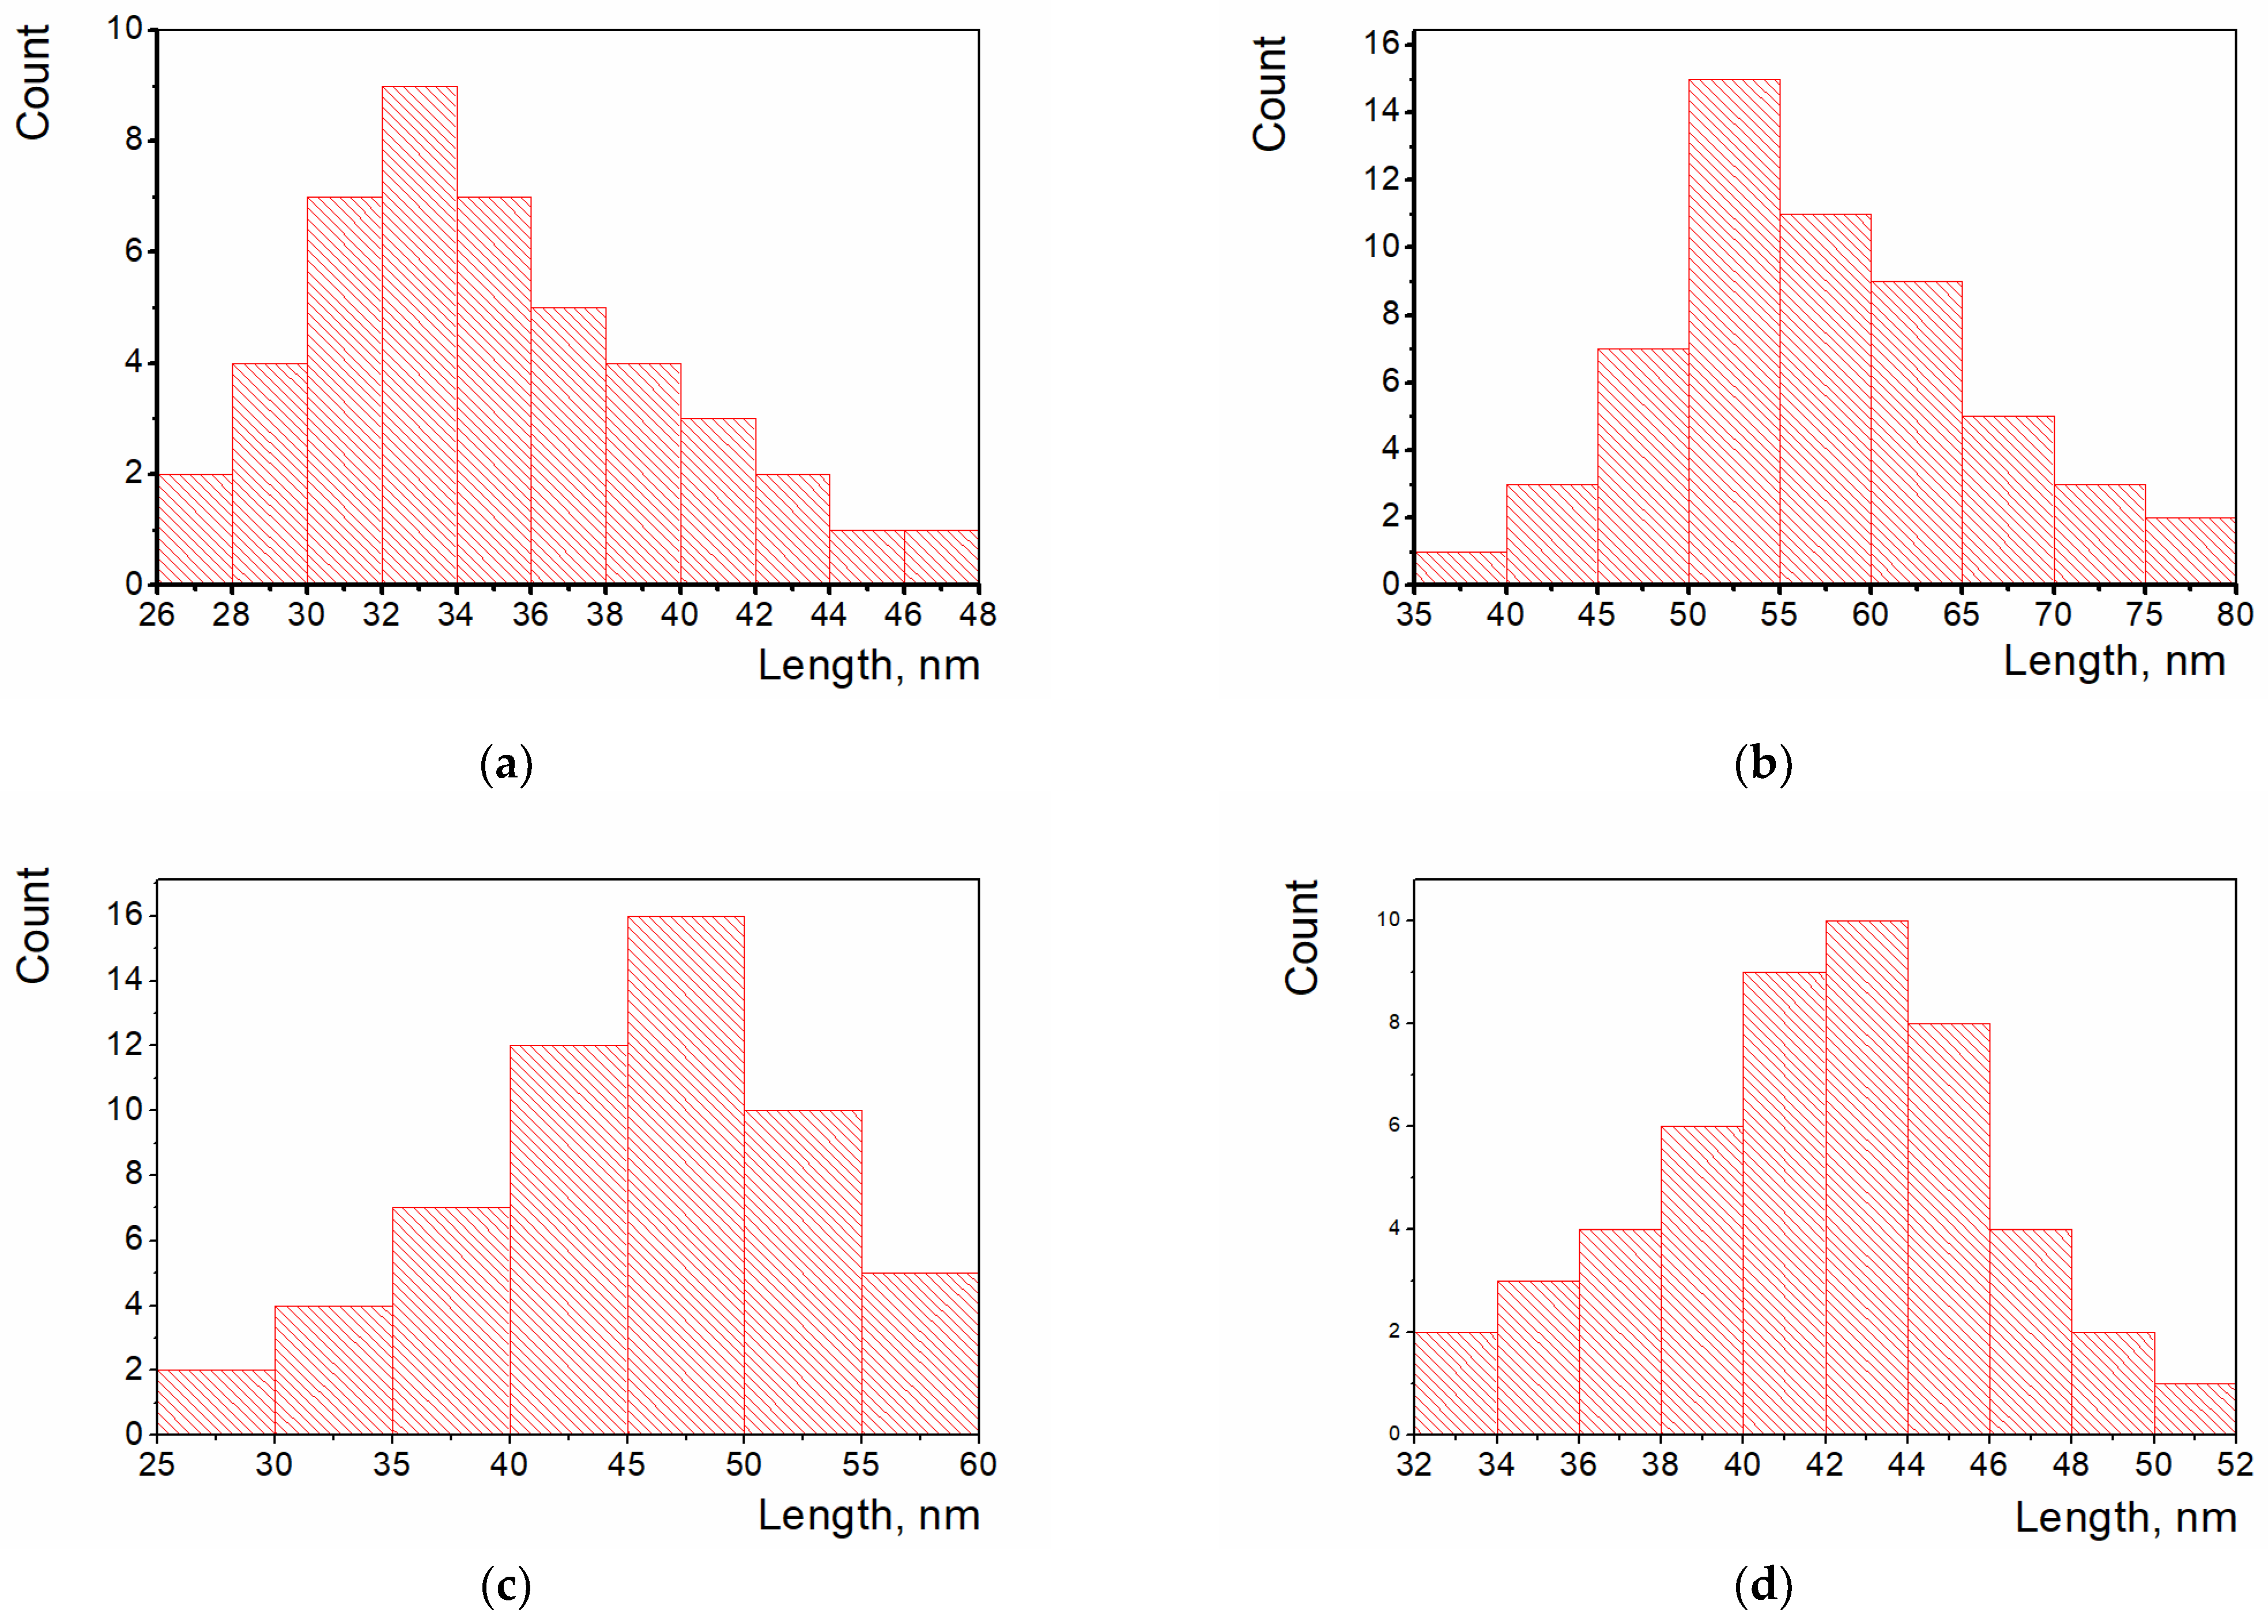
SEM data were also used for the assessment of the poly(proflavine) particle size distribution (Figure 5).
This information is crucial for sensor development as the distribution of particles strictly affects the reproducibility and electrochemical behavior of the modifying layer. Approaches based on SEM or TEM image processing for particle size evaluation have been widely used in the literature [29]. This method is rather accurate and reliable as it relies on the absolute length values. There are several commercial image-processing software products (National Instruments—Vision Builder, Image Pro, EPIX-XCAP) suitable for the investigation of particle morphology and area or length calculations. In our work, we used the free open-source software ImageJ 1.54g to carry out SEM image analysis. The obtained histograms describe the dependence between the size of the particles and their number. The particles were close to the normal Gaussian distribution with the maximum value at the length approximately corresponding to the calculated average size of the particles. This type of distribution proved the relative uniformity of the polymer layers.

3.3. DNA Implementation in Surface Layers

To include the DNA molecules into the modifying electropolymerized layer, several methods are available, including adding the aliquot of DNA solution or an exact quantity of DNA powder/fibers to the electropolymerization media [30] or using the drop-cast approach based on placing the DNA solution onto the electrode surface, followed by drying or incubation [17]. In addition, the covalent binding of the DNA molecule to the components of the modifying layer is also possible [31]. The drop-cast approach is easier and usually leads to satisfactory results. DNA immobilization should provide the target analyte access to the DNA, and a DNA sensor response with an adequate lifetime and good reproducibility is desired [32]. The physical adsorption of negatively charged DNA on the positively charged electroactive polymers is driven by electrostatic forces. Therefore, DNA implementation into the modifying layer should lead to changes in voltammograms or Nyquist diagrams. Moreover, DNA damage caused by high temperatures or chemical oxidants will lead to further changes in the electrochemical parameters.
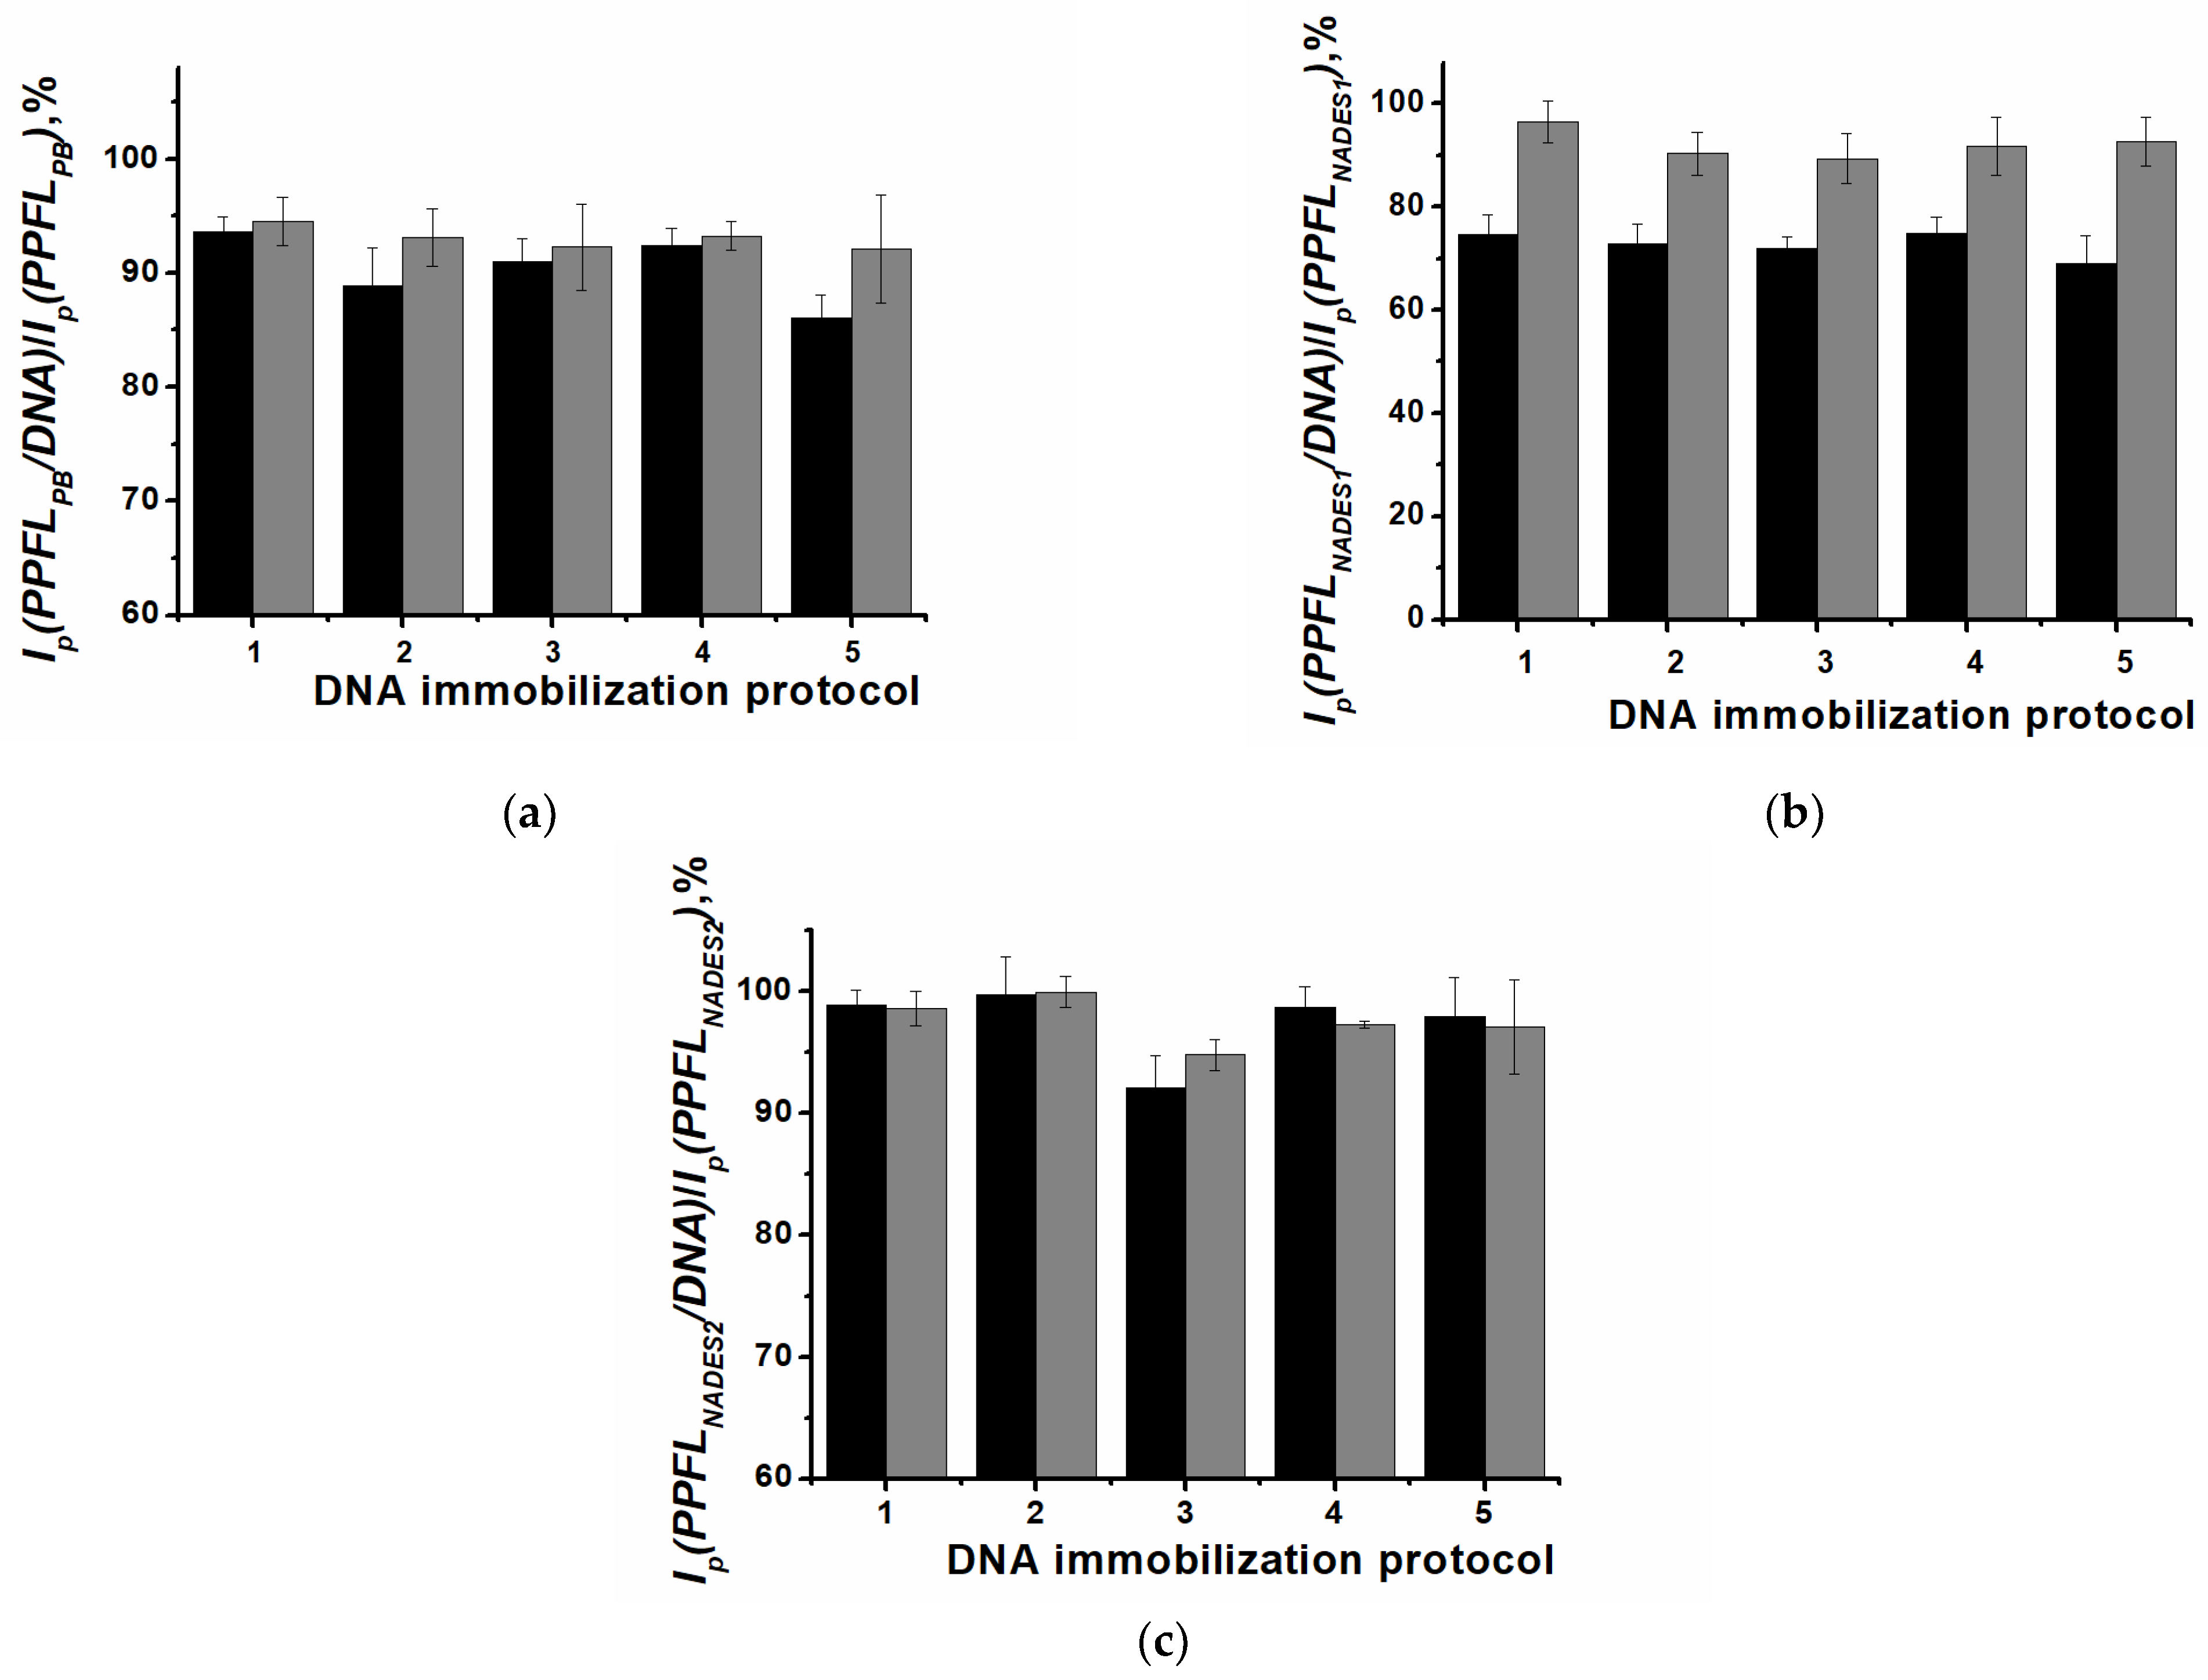
The dsDNA from calf thymus was physically adsorbed onto the PPFLPB, PPFLNADES1, and PPFLNADES2 coatings. Here, a 2 µL aliquot of 1 mg/mL DNA solution was drop-casted onto the SPCE surface and either dried or incubated under the Eppendorf tube for 10–40 min at ambient temperature. As DNA molecules are large and non-conductive, their successful implementation leads to a decrease in the current (Figure 6). The changes in the currents were more evident for the oxidation currents. In general, the DNA implementation effect was independent of the DNA immobilization protocol for the PPFLPB and PPFLNADES1 coatings. For these sensors, 10 min of immobilization was chosen as the optimal procedure. For PPFLNADES2, maximal changes were detected after incubation for 20 min. For the further experiments with PPFLNADES2/DNA, incubation for 20 min was chosen as the optimal DNA immobilization procedure.

3.4. Voltammetric Detection of Oxidative DNA Damage

DNA structure damage can be caused by chemical oxidation with ROS and exogenous genotoxic chemicals [33]. ROS are a group of reactive and unstable reduced oxygen derivatives including hydrogen peroxide (H2O2), superoxide anion (O2), hypochlorous acid (HClO), singlet oxygen (1O2), and hydroxyl radical (·OH) [34]. Normally, ROS are the byproducts of different cellular processes. In cancer cells, ROS levels are higher due to an imbalance between oxidant and antioxidant species. High levels of ROS can cause damage to different biomolecules and cell structures, even up to apoptosis. Different concentrations of ROS in cancer cells lead to various disease forecasting. At low levels, ROS play the role of intracellular second messengers. Moderate levels of ROS increase cancer metabolism and activate cancer cell growth, migration, and drug resistance. Moreover, high levels of ROS can lead to cell death because of DNA damage [35,36].
In this work, DNA damage was achieved either through thermal denaturation at 95 °C followed by sharp cooling in ice or via chemical oxidation in a Cu2+/H2O2 mixture caused by the generation of hydroxyl radicals (1) [37] or in the well-known Fenton reagent [38].
2Cu2+ + H2O2 → 2Cu+ + O2 + 2H+
Cu+ + H2O2 → Cu2+ + OH + ∙OH
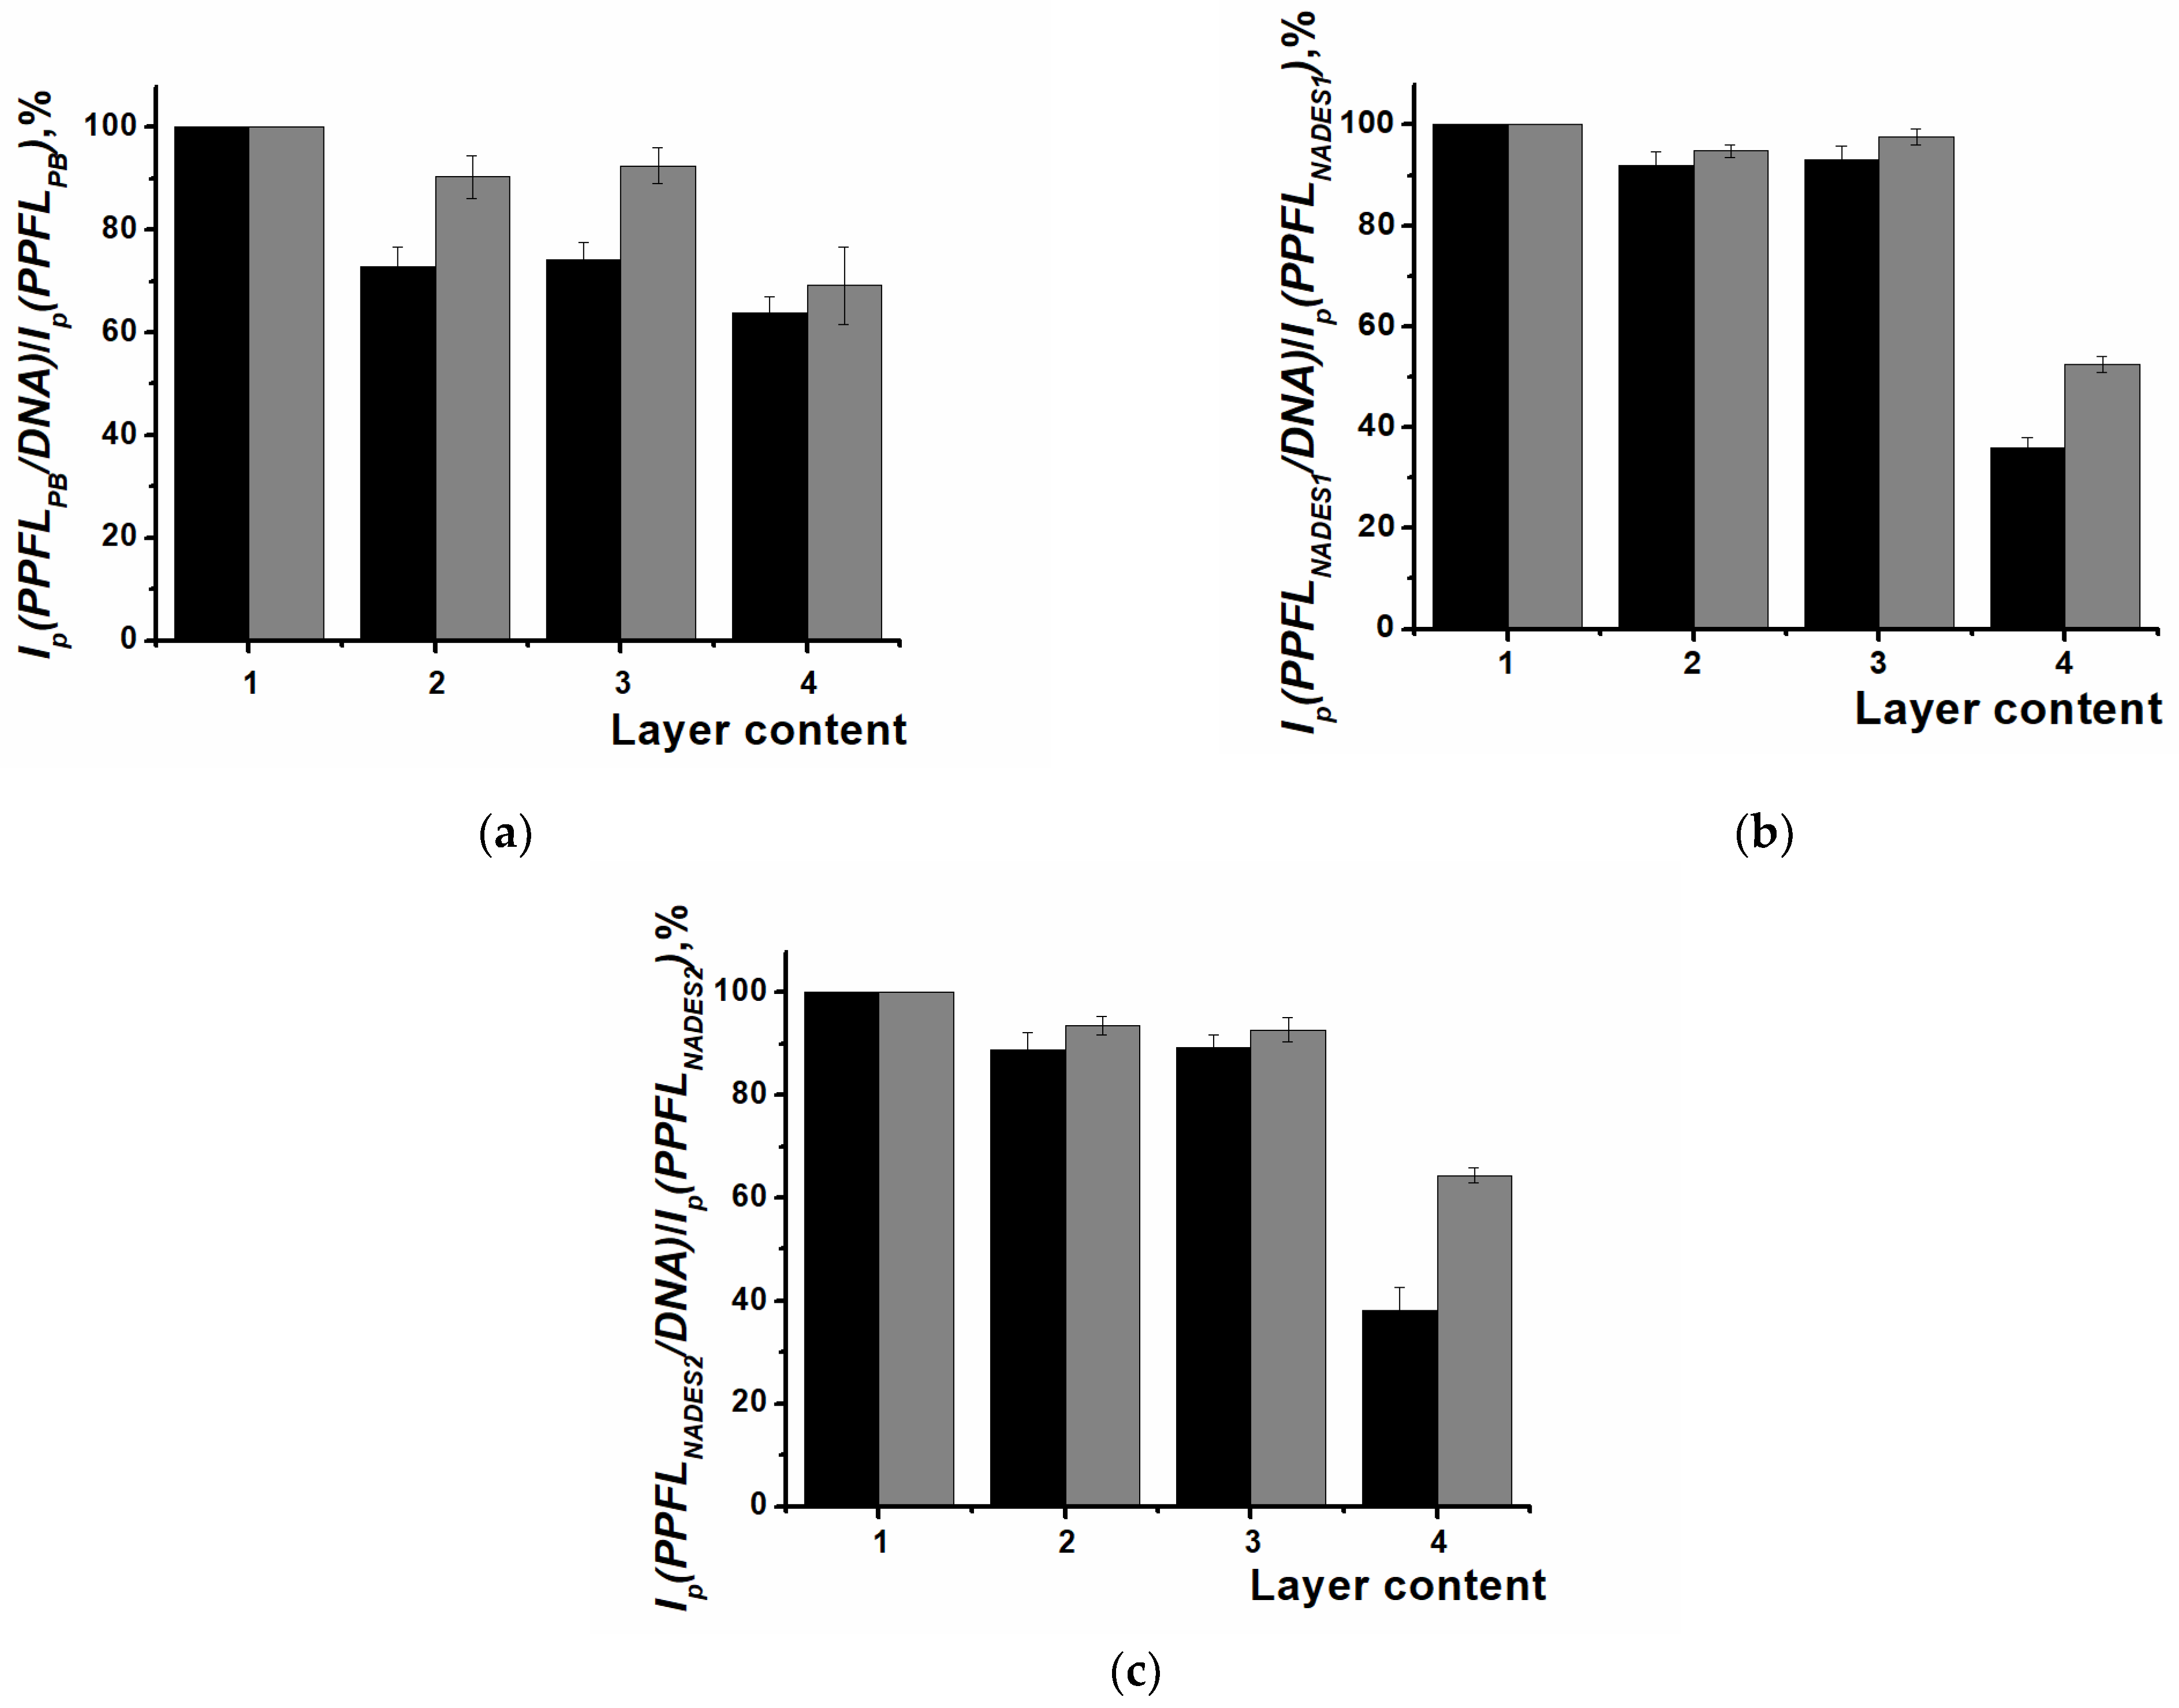
In further experiments, native, thermally damaged, or chemically damaged DNA (2 µL, 1 mg/mL) was immobilized over the PPFL polymer coating. Thermal denaturation or chemical oxidation causes damage to the native DNA structure and results in changes in the electroactive polymer currents detected. All of the coatings studied were able to distinguish between the native and chemically oxidized DNA, but there was no sensitivity to the thermally denatured sample (Figure 7).
The coatings obtained from the NADES media demonstrated similar profiles of changes after DNA damage. The changes in currents, registered after the chemical oxidation of the DNA, were more obvious for the PPFLNADES1 and PPFLNADES2 layers than for PPFLPB.
The use of Fenton reagent for DNA oxidation, applied over the DNA layer or in a mixture with DNA solution in volume ratio of 1:9, led to significant changes in the polymeric coating structure. The redox peaks of the PPFL polymer coatings mostly disappeared after treatment with the Fenton reagent, which can be attributed to the polymer layer’s degradation in a highly alkaline solution.

3.5. Electrochemical Impedance Detection of DNA Damage

EIS can provide a wide range of opportunities for the investigation of modifying layers, their assembly, and their interaction with different targets. Changes in modifying layer permeability and charge distribution resulted in the alteration of electrochemical impedance parameters. Since the voltammetry measurements could not discriminate between the native and thermally denatured DNA, EIS measurements were used for this purpose. A literature analysis confirmed that EIS measurements can be used for the reliable detection of DNA double-helix damage [39,40]. The EIS measurements in this study were carried out in the presence of an equimolar mixture of 0.01 M [Fe(CN)6]3− and [Fe(CN)6]4− ions as a redox probe (the equivalent circuit is presented in Figure 8). The Nyquist diagram based on this equivalent scheme demonstrates two semicircles corresponding to the limiting step of electron transfer on the two interfaces. First, the outer interface is situated between the electrolyte solution and the modifying layer (R1 and C1 parameters), and second, the inner interface is positioned between the inner part of the modifying layer and the electrode support (R2 and C2 parameters). Rs corresponds to the electrolyte resistance. The EIS potentials for all types of coatings investigated were calculated and are presented in Table S1. In addition to the different forms of DNA, two control experiments were conducted. Firstly, polystyrene sulfonate (PSS) was immobilized as polyanion instead of DNA molecules to evaluate whether the changes in the impedance parameters were associated with charge distribution only or with the nature of the DNA phosphate backbone. Secondly, deionized water was drop-casted onto the electrode working surface instead of DNA solution to exclude any washing or disaggregation effects.
Typical Nyquist diagrams for SPCEs modified with PPFLPB, PPFLNADES1, and PPFLNADES2 after immobilization of native DNA, thermally denatured DNA, and DNA chemically oxidized using a Cu2+/H2O2 mixture are shown in Figure S5. The respective changes in the charge transfer resistance of the outer interface of the modified electrodes (R1) are presented in Figure 9.
The EIS measurements for PPFLPB demonstrated the higher charge transfer resistance of the modifying layer compared to PPFLNADES1 and PPFLNADES2, which could have been due to the formation of a compact polymer layer. The immobilization of large negatively charged and non-conducting DNA molecules increased the R1 owing to the further hindrance of the layer permeability for the redox probe and its electrostatic repulsion (Figure 9a). Thermal and oxidative damage led to a further increase in charge transfer resistance owing to the formation of flat compact layers. The polymer surface was covered with a thick layer of single-stranded denatured or oxidized DNA tightly accumulated on the positively charged surface. The discrimination between thermally damaged and chemically oxidized DNA for SPCE/PPFLPB could not be made in EIS mode.
Proflavine electropolymerization from NADES1 and NADES2 media led to a significant decrease in the charge transfer resistance of the poly(proflavine) layer compared to aqueous media. This finding was in good agreement with the SEM data showing the formation of a microgranular polymer layer. When immobilized on the PPFLNADES1 layer with a rather small particle size, native DNA can cause the partial constriction of the positively charged polymer with the formation of agglomerates. This means that the modifying layer had better permeability for the redox probe and the charge transfer resistance was reduced. Thermal denaturation was attended by structural conversions of the biopolymer, such as double helix breakage and the separation of two complementary strands. It was assumed that thermal denaturation resulted in voluminous globule formation in the presented conditions since denaturation led to a decrease in the charge transfer resistance. The globules were positioned in a less compact manner than the double helix, and better permeability for [Fe(CN)6]3−/4− was detected. Chemical oxidation partially disrupted the bonds in the DNA molecule and it became more flexible and covered the polymer layer more sufficiently. As a result, the charge transfer resistance increased (Figure 9b).
The charge transfer resistance changes for the sensors based on PPFLNADES2 after native, thermally denatured, and chemically oxidized DNA immobilization were similar to those for PPFLNADES1, but less pronounced (Figure 9c).
The constant phase element C1 sharply decreased from 1 mF for bare SPCE to 2–8 µF for PPFLPB-based sensors, 80–130 µF for PPFLNADES1-based sensors, and 330–460 µF for PPFLNADES2-based sensors, and changed irregularly.
PSS implementation led to changes similar to those observed in DNA immobilization. This means that the observed changes can be associated with charge control rather than with the nature of the DNA. The signal observed after incubation in deionized water coincided with the signal of the polymer, indicating the absence of any polymer degradation during the measurement.
Thus, in EIS mode, the PPFLNADES1- and PPFLNADES2-based sensors were more sensitive to DNA structural changes after molecule damage and could distinguish all types of DNA used. Since these changes were more significant for the PPFLNADES1 coating, it was chosen for the antioxidant effect evaluation.

3.6. Sensor-to-Sensor Repeatability, Stability, and Selectivity Assessment

DNA damage detection capability is basically determined by a sensor’s metrological characteristics. The sensors developed in this study were disposable and used only once. The signal measurement’s precision was calculated for six individual impedimetric sensors prepared from the set of equal reagents. The sensor-to-sensor charge transfer resistance repeatability slightly differed for the PPFLPB-, PPFLNADES1-, and PPFLNADES2-based DNA sensors. The repeatability values were equal to 15.4%, 14.2%, and 12.3% (the standard deviation of the signal) for the SPCE/PPFLPB/native DNA, SPCE/PPFLPB/denatured DNA, and SPCE/PPFLPB/oxidized DNA, respectively. The sensors based on polymers deposited from NADES media exhibited a lower deviation of the signal through the measurement. For the SPCE/PPFLNADES1/native DNA, SPCE/PPFLNADES1/denatured DNA, and SPCE/PPFLNADES1/oxidized DNA, the repeatability values were equal to 9.8%, 8.4%, and 10.7%, respectively. The smallest deviation values were detected for the SPCE/PPFLNADES2/native DNA, SPCE/PPFLNADES2/denatured DNA, and SPCE/PPFLNADES2/oxidized DNA as 5.0%, 6.9%, and 8.1%, respectively. In general, the sensor signal was stable and no notable drifts in the signals were detected during the week after the sensor preparation when stored in a refrigerator at 4 °C. The selectivity was not applicable in this case because we registered the mechanism of action through the damage results and we could not predict the nature of the oxidant used.

3.7. Evaluation of Antioxidant Influence and Real-Sample Analysis

Antioxidant species have the ability to inhibit oxidation reactions, including those caused by ROS.
There are different mechanisms of antioxidant actions: they can create physical barriers preventing ROS generation or ROS’s access to important biological sites; form certain types of chemical traps and catalytic systems; and cause the inactivation of metal ions, thus preventing the generation of ROS or destroying them. Antioxidants are obtained from plant-based foods, and this plays an important role in maintaining human health. [41]. The most important antioxidants are vitamins C and E, carotenoids, flavonoids, cinnamates, tannins, glucosinolates, and phytosterols [42]. At appropriate levels, antioxidants help neutralize the dangerous effects of ROS and other oxidants in the human organism. However, at extremely high levels, antioxidants can cause the opposite effect—pro-oxidant action, triggering a cascade of oxidative reactions. Most of the mentioned antioxidants can demonstrate pro-oxidant features: for example, ascorbic acid, which is widely used in vitamin supplements and biological additives [43]. For this reason, it was extremely important to investigate the antioxidative and pro-oxidative ranges of certain conventional antioxidants—ascorbic acid, quercetin, and hydroquinone.
All of the compounds (in the concentration range of 0.1 µM to 1 mM) were added to the Cu2+/H2O2 oxidative mixture before its interaction with DNA. After 1 h of DNA oxidation, 2 µL of DNA solution was incubated onto the SPCE/PPFLNADES1 surface for 10 min and then treated with 4 mM EDTA solution to exclude cupric ions. The EIS potentials determined for these experiments are presented in Table S2.
The injection of 1 mM ascorbic acid, quercetin, or hydroquinone to the oxidative mixture resulted in an increase in the charge transfer resistance above the level of DNA oxidized in the absence of the antioxidants. This can be attributed to the boosting of peroxide oxidation due to the pro-oxidant influence of these species. Further reducing the concentration of ascorbic acid and quercetin from 0.1 mM to 1 µM and hydroquinone to 10 µM demonstrated the decay of the charge transfer resistance close to the values of native DNA and reflected the manifestation of the antioxidative effect. Low concentrations of antioxidants (0.1 µM of ascorbic acid and quercetin, 0.1 µM–1 µM of hydroquinone) could not provide effective protection from the oxidative damage caused by hydroxyl radicals (Figure 10).
Two pharmaceutical preparations of ascorbic acid were also assessed for their antioxidative effects (Table 2). Sachets and tablets were used for a 1 µM solution of ascorbic acid. Both preparations contained additives and stabilizers, namely, aromatizer and sugar in sachet form and glucose, potato starch, or calcium stearate in tablet form. No significant influence of the stabilizer was detected. The recoveries were close to 100% for ascorbic acid: 103 ± 6% for the sachets and 110 ± 10% for the tablets.
Thus, when consumed in appropriate concentrations, antioxidants can provide protective effects against DNA damage caused by ROS.

4. Discussion

There are different ways to assemble the modifying layers and signal registration for DNA sensors used in DNA damage detection.
Ensafi et al. used a pencil graphite electrode (PGE) modified with the dispersion of MWNTs in chitosan and dsDNA for impedimetric and voltammetric DNA damage detection [40]. Though carbon nanomaterials are commonly used for electrode modification, time-consuming pretreatment stages such as MWNT oxidation in nitric acid, washing, drying, and dispersing are needed. The sensor developed in their study could detect oxidative DNA damage caused by dopamine in the presence of Cu (II) and/or Fe (III) ions. The antioxidative effects of glutathione and ascorbic acid were also detected. GCE covered with Au nanoparticles, MWNTs, Nafion, and dsDNA was used for the investigation of Cu (II)-induced oxidative damage in the presence of dissolved oxygen [44]. A wide range of natural and synthetic antioxidants and herbal tea extracts were examined in order to evaluate the influence on guanine, adenine, and cytosine signals. However, the sensor assembly procedure was time-consuming and included several stages. In Ref. [45], a GCE was covered with electropolymerized poly(AzureA) deposited from buffer saturated with chloroform and DNA from fish sperm. EIS provided thermal and oxidative DNA damage detection with this sensor, but the exploitation of organic solvents was not environmentally friendly. The permissible limit for chloroform in drinking water is approximately 0.06 mg/L, so there is a risk of contamination. Berghian-Grosan [46] compared voltammetric and Fourier-transform infrared spectroscopy (FT-IR) approaches for ssDNA damage induced by H2O2. A Pt electrode was modified with graphene–metal nanoparticles (Gr–Au-x and Gr–Pt-x) and ssDNA. Sun et al. covered GCE with nitrogen-doped graphene (N-G) and chitosan composite and dsDNA using the drop-casting method [47] and the DNA damage was modeled using Fenton’s reagent treatment. In the last two cases mentioned, biosensor assembly was quite sophisticated and time-consuming due to nanocomposite synthesis. The antioxidant activity of L-ascorbic acid, composite yogurt, and plain yogurt was compared. Wu [48] prepared a mixture of dopamine and graphene oxide in PB and carried out the multiple scanning of the potential on GCE, leading to the development of a polydopamine–graphene oxide composite film on the electrode surface. Salmon sperm DNA was drop-casted onto this nanocomposite layer. Square-wave voltammetry allowed for the determination of DNA damage caused by Fenton’s reagent. In addition, the antioxidative activity of three trademarks of red vine was evaluated. Sun and Wu used Ru(NH3)6 3+ probe solution to detect the changes in the current before and after DNA damage, increasing the analysis cost. Morais presented a simple method of sensor development based on adenine-rich oligonucleotide adsorbed on a carbon-paste electrode (CPE) [49]. The change in the adenine oxidation signal after DNA damage was used for the evaluation of the total antioxidant capacity values of twelve commercial coffee samples. Though the electrode development procedure was quite simple, CPE and other conventional electrodes (Pt, GCE, PGE) arenot convenient for mass screening procedures.
The sensor presented in this study has a number of distinct advantages compared to similar sensors used for DNA damage detection. Biosensor assembly using the drop-casting method is simple and based on electrostatic interactions. The use of SPCE enabled negligible amounts of solutions to be used; furthermore, the components of electropolymerization media are biocompatible and biodegradable. The developed sensors are disposable, low-cost, and in good agreement with “point-of-care” concept. Besides thermal and oxidative DNA damage detection, these sensors can be used to assess antioxidant effectiveness through EIS measurements. Moreover, miniaturization, fast fabrication, and easy scaling for mass production can be made possible by switching from conventional electrodes to SPCEs.

5. Conclusions

The results presented in this work demonstrate the high sensitivity of polymer coatings obtained from natural deep eutectic solvents introduced into DNA sensors for the detection of thermal and oxidative damage to DNA from calf thymus. Though citric-acid-based NADESs have already been used to obtain electroactive polymers for DNA sensor development, malonic-acid-based NADESs were used for the first time in this study. Both of these solvents enabled the synthesis of compact and uniform layers of a microgranular structure with good conduction properties. Working protocols of DNA sensor assembly were proposed with a minimal number of experimental stages and the simple pre-treatment of the electrodes and samples. SPCE application reduced the cell volume to 100 µL. Moreover, this small volume led to a significant reduction in waste as all NADES components were biodegradable and environmentally friendly. NADESs are promising media for many applications in analytical chemistry due to their good adherence to “green chemistry” principles. Their synthesis is not associated with toxic compound formation, as can be in case of ionic liquids. In addition, these solvents are biodegradable, low-cost, non-flammable, and have low vapor pressure and volatility. NADES components are present in live cells and play the role of the third liquid phase, thus providing an alternative to water and lipids. To date, the use of NADESs for the electropolymerization of different organic monomers constitutes less than 5% of their total use in electrochemistry [50]. Using NADES media allows electropolymerized coatings to be produced with morphologies and electrochemical properties that differ from those obtained from aqueous solutions. Such coatings can be successfully used in electrochemical sensors and biosensor assemblies with enhanced analytical and operational characteristics. The development of DNA sensors based on disposable SPCEs makes these devices advantageous for use in “point-of-care” concepts to accelerate diagnostics and the selection of appropriate treatment. EIS measurements often demonstrate higher sensitivity since they are less influenced by other electroactive substances. The changes in charge transfer resistance after electropolymerization are in good agreement with the SEM results. The various morphologies and sizes of the polymer particles obtained from aqueous media and NADESs significantly affected the resulting sensitivity of the DNA sensor to DNA damage. The pro-oxidative effects that occur at high levels of ascorbic acid, quercetin, and hydroquinone consumption should encourage patients to avoid uncontrolled vitamin intake without medical prescriptions. An appropriate dosage of species with antioxidant features can help reduce oxidative stress and the risk of diseases. The sensors proposed in this study for DNA damage detection can be used in medicine, environmental, and food control applications.

Supplementary Materials

The following supporting information can be downloaded at https://www.mdpi.com/article/10.3390/chemosensors12100215/s1: Figure S1. Chronoamperograms of potentiostatic electropolymerization of 0.085 M proflavine in (a) NADES1 and (c) NADES2, 1.2 V, 300 s; multiple cyclic voltammograms (20 cycles, from −1.2 to 1.2 V, 0.1 V/s) recorded after the potentiostatic step in 0.085 M proflavine in (b) NADES1 and (d) NADES2. Arrows indicate changes with increased number of cycles; Figure S2. Single cycle recorded in 0.025 M PB, pH 7.0, scan rate 0.1 V/s, on SPCE covered with (a) PPFLPB, (b) PPFLNADES1, and (c) PPFLNADES2 after the stabilization step; black—potentiodynamic electropolymerization, red—potentiostatic electropolymerization, and blue—mixed mode of electropolymerization; Figure S3. Cyclic voltammograms recorded in 0.025 M PB, pH 7.0, on SPCE covered with (a) PPFLPB, (b) PPFLNADES1, and (c) PPFLNADES2 at scan rates of 0.01, 0.04, 0.07, 0.1, 0.2, 0.3, 0.4, and 0.5 V/s; Figure S4. Cyclic voltammograms recorded in 0.025 M PB on SPCE covered with (a) PPFLPB, (b) PPFLNADES1, and (c) PPFLNADES2 at pH values of 2.0–9.0 and scan rate of 0.1 V/s; Figure S5. Nyquist diagrams recorded for 1—bare SPCE, 2—SPCE/PPFL, 3—SPCE/PPFL/native DNA, 4—SPCE/PPFL/denatured DNA, 5—SPCE/PPFL/oxidized DNA, 6—SPCE/PPFL/PSS, and 7—SPCE/PPFL/H2O; (a) PPFLPB, (b) PPFLNADES1, and (c) PPFLNADES2; 0.025 M PB, pH 7.0, in presence of 0.01 M [Fe(CN)6]3−/4−; Table S1. EIS potentials vs. Ag/AgCl for PPFL-based sensors; Table S2. EIS potentials vs. Ag/AgCl for PPFLNADES1-based sensors in antioxidative effect investigation.

Author Contributions

Conceptualization, G.E.; methodology, A.P. and G.E.; investigation, V.E. (SEM), T.K. (voltammetry), A.G. (EIS), M.M. (voltammetry) and A.P. (EIS); writing—original draft preparation, A.P.; writing—review and editing, G.E. All authors have read and agreed to the published version of the manuscript.

Funding

This research was funded by the Russian Science Foundation, grant number 23-13-00163, https://rscf.ru/en/project/23-13-00163/, accessed on 17 July 2024.

Institutional Review Board Statement

Not applicable.

Informed Consent Statement

Not applicable.

Data Availability Statement

The data presented in this study are available in the Supplementary Materials.

Acknowledgments

The SEM investigation was performed in the Interdisciplinary Center of Analytical Microscopy of Kazan Federal University.

Conflicts of Interest

The authors declare no conflicts of interest.

References

  1. Svitková, V.; Labuda, J. Construction of electrochemical DNA biosensors for investigation of potential risk chemical and physical agents. Monatsh. Chem. 2017, 148, 1569–1579. [Google Scholar] [CrossRef]
  2. De la Cruz Morales, K.; Alarcón-Angeles, G.; Merkoçi, A. Nanomaterial-based sensors for the study of DNA interaction with drugs. Electroanalysis 2019, 31, 1845. [Google Scholar] [CrossRef]
  3. Srinivas, U.S.; Tan, B.W.Q.; Vellayappan, B.A.; Jeyasekharan, A.D. ROS and the DNA damage response in cancer. Redox Biol. 2019, 25, 101084. [Google Scholar] [CrossRef] [PubMed]
  4. Radstake, W.E.; Parisi, A.; Miranda, S.; Gautam, K.; Vermeesen, R.; Rehnberg, E.; Tabury, K.; Coppes, R.; van Goethem, M.-J.; Brandenburg, S.; et al. Radiation-induced DNA double-strand breaks in cortisol exposed fibroblasts as quantified with the novel foci-integrated damage complexity score (FIDCS). Sci. Rep. 2024, 14, 10400. [Google Scholar] [CrossRef]
  5. Furusawa, Y.; Kondo, T.; Tachibana, K.; Feril, L.B. Ultrasound-induced DNA damage and cellular response: Historical review, mechanisms analysis, and therapeutic implications. Radiat. Res. 2022, 197, 662–672. [Google Scholar] [CrossRef]
  6. Habibi, P.; Ostad, S.N.; Heydari, A.; Aliebrahimi, S.; Montazeri, V.; Foroushani, A.R.; Monazzam, M.R.; Ghazi-Khansari, M.; Golbabaei, F. Effect of heat stress on DNA damage: A systematic literature review. Int. J. Biometeorol. 2022, 66, 2147–2158. [Google Scholar] [CrossRef]
  7. Ceron-Carrasco, J.P.; Jacquemin, D. Electric field induced DNA damage: An open door for selective mutations. Chem. Commun. 2013, 49, 7578–7580. [Google Scholar] [CrossRef]
  8. Dalle-Donne, I.; Rossi, R.; Colombo, R.; Giustarini, D.; Milzani, A. Biomarkers of oxidative damage in human disease. Clin. Chem. 2006, 52, 601–623. [Google Scholar] [CrossRef]
  9. Gunasekaran, B.M.; Srinivasan, S.; Ezhilan, M.; Nesakumar, N. Nucleic acid-based electrochemical biosensors. Clin. Chim. Acta 2024, 559, 119715. [Google Scholar] [CrossRef]
  10. Dalle-Donne, I.; Scaloni, A.; Giustarini, D.; Cavarra, E.; Tell, G.; Lungarella, G.; Colombo, R.; Rossi, R.; Milzani, A. Proteins as biomarkers of oxidative/nitrosative stress in diseases: The contribution of redox proteomics. Mass Spectrom. Rev. 2005, 24, 55–99. [Google Scholar] [CrossRef]
  11. Mokni, M.; Tlili, A.; Khalij, Y.; Attia, G.; Zerrouki, C.; Hmida, W.; Othmane, A.; Bouslama, A.; Omezzine, A.; Fourati, N. Designing a simple electrochemical genosensor for the detection of urinary PCA3, a prostate cancer biomarker. Micromachines 2024, 15, 602. [Google Scholar] [CrossRef] [PubMed]
  12. Han, H.W.; Nobusawa, K.; Yamashita, I. Anomalous enhancement of electrochemical charge transfer by a Ru complex ion intercalator. Anal. Chem. 2022, 94, 571–576. [Google Scholar] [CrossRef] [PubMed]
  13. Güngör, M.A.; Alev, O.; Kaya, H.K.; Arslan, L.Ç.; Büyükköse, S.; Öztürk, Z.Z.; Kuralay, F. Atomic layer deposited zinc oxide thin film on pencil graphite for DNA sensor applications. Mater. Today Commun. 2023, 36, 106776. [Google Scholar] [CrossRef]
  14. Evtugyn, G.; Hianik, T. Electrochemical DNA sensors and aptasensors based on electropolymerized materials and polyelectrolyte complexes. TrAC Trends Anal. Chem. 2016, 79, 168–178. [Google Scholar] [CrossRef]
  15. Gebala, M.; Stoica, L.; Neugebauer, S.; Schuhmann, W. Label-free detection of DNA hybridization in presence of intercalators using electrochemical impedance spectroscopy. Electroanalysis 2009, 21, 325–331. [Google Scholar] [CrossRef]
  16. Girousi, S.; Kinigopoulou, V. Detection of short oligonucleotide sequences using an electrochemical DNA hybridization biosensor. Cent. Eur. J. Chem. 2010, 8, 732–736. [Google Scholar] [CrossRef]
  17. Porfireva, A.V.; Goida, A.I.; Rogov, A.M.; Evtugyn, G.A. Impedimetric DNA sensor based on poly(proflavine) for determination of anthracycline drugs. Electroanalysis 2020, 32, 827–834. [Google Scholar] [CrossRef]
  18. Heck, K.L.; Si, L.; Jung, D.J.; Calderón, A.I. Application of eco-friendly natural deep eutectic solvents (NADES) in HPLC for separation of complex natural products: Current limitations and future directions. J. Pharm. Biomed. Anal. 2024, 244, 116102. [Google Scholar] [CrossRef]
  19. Choi, Y.H.; van Spronsen, J.; Dai, Y.; Verberne, M.; Hollmann, F.; Arends, I.W.; Witkamp, G.J.; Verpoorte, R. Are natural deep eutectic solvents the missing link in understanding cellular metabolism and physiology? Plant Physiol. 2011, 156, 1701–1705. [Google Scholar] [CrossRef]
  20. Brett, C.M.A. Perspectives for the use of deep eutectic solvents in the preparation of electrochemical sensors and biosensors. Curr. Opin. Electrochem. 2024, 45, 101465. [Google Scholar] [CrossRef]
  21. Sarjuna, K.; Ilangeswaran, D. Silver nanoparticles: Synthesis in newly formed ternary deep eutectic solvent media, characterization and their antifungal activity. Curr. Nanomater. 2023, 8, 280–290. [Google Scholar]
  22. Yüksek, A.G.; Elik, A.; Altunay, N. Rapid and safe determination of vitamin B1 in dairy products, fruits, nuts and vitamin tablets: Combination of natural deep eutectic solvents, experimental design and artificial intelligence. J. Food Compos. Anal. 2024, 131, 106222. [Google Scholar] [CrossRef]
  23. Simamora, A.; Timotius, K.H.; Setiawan, H.; Saputri, F.A.; Putri, C.R.; Aryani, D.; Ningrum, R.A.; Mun’im, A. Ultrasonic-assisted extraction of xanthorrhizol from Curcuma xanthorrhiza Roxb. Rhizomes by natural deep eutectic solvents: Optimization, antioxidant activity, and toxicity profiles. Molecules 2024, 29, 2093. [Google Scholar] [CrossRef]
  24. Porfireva, A.; Goida, A.; Evtugyn, V.; Evtugyn, G. Impedimetric sensor based on molecularly imprinted polythionine from deep eutectic solvent for epinephrine determination. Green Anal. Chem. 2024, 9, 100113. [Google Scholar] [CrossRef]
  25. Goida, A.; Rogov, A.; Kuzin, Y.; Porfireva, A.; Evtugyn, G. Impedimetric DNA sensors for epirubicin detection based on polythionine films electropolymerized from deep eutectic solvent. Sensors 2023, 23, 8242. [Google Scholar] [CrossRef]
  26. Ding, M.; Niu, H.; Zhang, N.; Hou, T.; Guan, P.; Hu, X. Facile fabrication of electrochemically reduced graphene oxide/polythionine-methylene blue and its use as a platform for detection of nicotinamide adenine dinucleotide in the artificial urine sample. Electrochim. Acta 2022, 425, 140715. [Google Scholar] [CrossRef]
  27. Porfireva, A.; Begisheva, E.; Evtugyn, V.; Evtugyn, G. Electrochemical DNA sensor for valrubicin detection based on poly(Azure C) films deposited from deep eutectic solvent. Biosensors 2023, 13, 931. [Google Scholar] [CrossRef] [PubMed]
  28. Barsan, M.M.; Pinto, E.M.; Brett, C.M.A. Electrosynthesis and electrochemical characterisation of phenazine polymers for application in biosensors. Electrochim. Acta 2008, 53, 3973–3982. [Google Scholar] [CrossRef]
  29. Zhang, S.; Zhang, Q.; Shang, J.; Mao, Z.; Yang, C. Measurement methods of particle size distribution in emulsion polymerization. Chin. J. Chem. Eng. 2021, 39, 1–15. [Google Scholar] [CrossRef]
  30. Kulikova, T.N.; Porfireva, A.V.; Shamagsumova, R.V.; Evtugyn, G.A. Voltammetric sensor with replaceable polyaniline-DNA layer for doxorubicin determination. Electroanalysis 2018, 30, 2284–2292. [Google Scholar] [CrossRef]
  31. Gao, H.; Cui, D.; Zhai, S.; Yang, Y.; Wu, Y.; Yan, X.; Wu, G. A label-free electrochemical impedimetric DNA biosensor for genetically modified soybean detection based on gold carbon dots. Microchim. Acta 2022, 189, 216. [Google Scholar] [CrossRef] [PubMed]
  32. Abu-Salah, K.M.; Ansari, A.A.; Alrokayan, S.A. DNA-based applications in nanobiotechnology. BioMed Res. Int. 2010, 2010, 715295. [Google Scholar] [CrossRef] [PubMed]
  33. Nickoloff, J.A.; Sharma, N.; Taylor, L.; Allen, S.J.; Hromas, R. Nucleases and co-factors in DNA replication stress responses. DNA 2022, 2, 68–85. [Google Scholar] [CrossRef]
  34. Yang, H.; Villani, R.M.; Wang, H.; Yang, H.; Villani, R.M.; Wang, H.; Simpson, M.J.; Roberts, M.S.; Tang, M.; Liang, X. The role of cellular reactive oxygen species in cancer chemotherapy. J. Exp. Clin. Cancer Res. 2018, 37, 266. [Google Scholar] [CrossRef]
  35. Wiseman, H.; Halliwell, B. Damage to DNA by reactive oxygen and nitrogen species: Role in inflammatory disease and progression to cancer. Biochem. J. 1996, 313, 17–29. [Google Scholar] [CrossRef] [PubMed]
  36. Nakamura, H.; Takada, K. Reactive oxygen species in cancer: Current findings and future directions. Cancer Sci. 2021, 112, 3945–3952. [Google Scholar] [CrossRef]
  37. Stoewe, R.; Prütz, W.A. Copper-catalyzed DNA damage by ascorbate and hydrogen peroxide: Kinetics and yield. Free Radic. Biol. Med. 1987, 3, 97–105. [Google Scholar] [CrossRef]
  38. Kuzin, Y.; Ivanov, A.; Evtugyn, G.; Hianik, T. Voltammetric detection of oxidative DNA damage based on interactions between polymeric dyes and DNA. Electroanalysis 2016, 28, 2956. [Google Scholar] [CrossRef]
  39. Bangruwa, N.; Srivastava, M.; Mishra, D. CISS-based label-free novel electrochemical impedimetric detection of UVC-induced DNA damage. ACS Omega 2022, 7, 37705–37713. [Google Scholar] [CrossRef]
  40. Ensafi, A.A.; Kazemnadi, N.; Amini, M.; Rezaei, B. Impedimetric DNA-biosensor for the study of dopamine induces DNA damage and investigation of inhibitory and repair effects of some antioxidants. Bioelectrochemistry 2015, 104, 71–78. [Google Scholar] [CrossRef]
  41. Benzie, I.F.F. Evolution of dietary antioxidants. Comp. Biochem. Physiol. Part A Mol. Integr. Physiol. 2003, 136, 113–126. [Google Scholar] [CrossRef] [PubMed]
  42. Lindsay, D.G.; Clifford, M.N. Critical reviews produced within the EU Concerted Action ‘Nutritional Enhancement of Plant-based Food in European Trade’ (NEODIET). J. Sci. Food Agric. 2000, 80, 793–1137. [Google Scholar] [CrossRef]
  43. Brezová, V.; Polovka, M.; Staško, A. The influence of additives on beer stability investigated by EPR spectroscopy. Spectrochim. Acta Part A Mol. Biomol. Spectrosc. 2002, 58, 1279–1291. [Google Scholar] [CrossRef] [PubMed]
  44. Önem, A.N.; Başkan, K.S.; Apak, R. Voltammetric measurement of antioxidant activity by prevention of Cu (II)-induced oxidative damage on DNA bases using a modified electrode. ACS Omega 2023, 8, 5103–5115. [Google Scholar] [CrossRef]
  45. Porfireva, A.; Plastinina, K.; Evtugyn, V.; Kuzin, Y.; Evtugyn, G. Electrochemical DNA sensor based on poly(Azure A) obtained from the buffer saturated with chloroform. Sensors 2021, 21, 2949. [Google Scholar] [CrossRef]
  46. Berghian-Grosan, C.; Biris, A.R.; Coros, M.; Pogacean, F.; Pruneanu, S. Electrochemical and spectroscopic studies of ssDNA damage induced by hydrogen peroxide using graphene based nanomaterials. Talanta 2015, 138, 209–217. [Google Scholar] [CrossRef]
  47. Sun, B.; Yang, Y.; Yu, S.; Bao, L.; Shi, H.; Dang, Q.; Liu, Y.; Yang, L.; Ma, Q.; Shi, X. Electrochemical biosensor based on ds-DNA/N-G@CS/GCE for highly sensitive and rapid measurement of antioxidant activity. ECS Adv. 2023, 2, 026501. [Google Scholar] [CrossRef]
  48. Wu, H. Electrochemical evaluation of total antioxidant properties in red wine. Food Meas. 2023, 17, 5344–5351. [Google Scholar] [CrossRef]
  49. Morais, S.L.; Rede, D.; Ramalhosa, M.J.; Correia, M.; Santos, M.; Delerue-Matos, C.; Moreira, M.M.; Soares, C.; Barroso, M.F. Assessment of the antioxidant capacity of commercial coffee using conventional optical and chromatographic methods and an innovative electrochemical DNA-based biosensor. Biosensors 2023, 13, 840. [Google Scholar] [CrossRef]
  50. Espino, M.; de los Ángeles Fernández, M.; Gomez, F.J.V.; Silva, M.F. Natural designer solvents for greening analytical chemistry. TrAC Trends Anal. Chem. 2016, 76, 126–136. [Google Scholar]
Figure 1. Chemical structure of proflavine hydrochloride.
Chemosensors 12 00215 g001
Figure 2. Multiple cyclic voltammograms recorded on the SPCE in (a) 0.025 M PB, pH 7.0, containing 0.5 mM proflavine or 0.085 M proflavine in (b) NADES1 and (c) NADES2; 0.1 V/s. Arrows indicate changes with increased number of cycles.
Chemosensors 12 00215 g002
Figure 3. Oxidation (black) and reduction (red) peak currents recorded in 0.025 M PB on the SPCE covered with (a) PPFLPB, (b) PPFLNADES1, and (c) PPFLNADES2 at pH values of 2.0–9.0 (average ± S.D. for eight individual sensors).
Chemosensors 12 00215 g003
Figure 4. SEM images of (a) bare SPCE and SPCE covered with (b) PPFLPB, (c) PPFLNADES1, and (d) PPFLNADES2.
Chemosensors 12 00215 g004
Figure 5. Particle size distributions (Gaussian fitting) for (a) carbon ink nanoparticles of bare SPCE and microspheres of (b) PPFLPB, (c) PPFLNADES1, and (d) PPFLNADES2 coatings.
Chemosensors 12 00215 g005
Figure 6. Relative changes in peak oxidation (black) and reduction (gray) currents after DNA immobilization on (a) PPFLPB, (b) PPFLNADES1, and (c) PPFLNADES2. DNA immobilization protocol: 1—drying; 2–5—incubation in DNA solution for 10, 20, 30, and 40 min, respectively. Specifications: cyclic voltammetry, 0.025 M PB; pH 7.0; from −0.6 to 0.6 V, 0.1 V/s.
Chemosensors 12 00215 g006
Figure 7. Relative changes in peak oxidation (black) and reduction (gray) currents for (a) PPFLPB, (b) PPFLNADES1, and (c) PPFLNADES2. Layer contents: 1—with no DNA, 2—native DNA, 3—thermally denatured DNA, and 4—chemically oxidized (Cu2+/H2O2) DNA.
Chemosensors 12 00215 g007
Figure 8. Equivalent circuit Rs(R1C1)(R2C2) for the evaluation of EIS parameters.
Chemosensors 12 00215 g008
Figure 9. Dependence of charge transfer resistance R1 on modified layer content: 1—bare SPCE, 2—SPCE/PPFL, 3—SPCE/PPFL/native DNA, 4—SPCE/PPFL/denatured DNA, 5—SPCE/PPFL/oxidized DNA, 6—SPCE/PPFL/PSS, and 7—SPCE/PPFL/H2O; (a) PPFLPB, (b) PPFLNADES1, (c) PPFLNADES2; 0.025 M PB, pH 7.0, in the presence of 0.01 M [Fe(CN)6]3−/4−. Average ± S.D. for ten individual sensors.
Chemosensors 12 00215 g009
Figure 10. Dependence of EIS parameters on antioxidant concentration. (a) Charge transfer resistance R1, (b) constant phase element C1; 0.025 M PB, pH 7.0, in the presence of 0.01 M [Fe(CN)6]3−/4−. Average ± S.D. values are shown for ten individual sensors.
Chemosensors 12 00215 g010
Table 1. Slopes of the linear part of the Em-pH dependency for the PPFLPB, PPFLNADES1, and PPFLNADES2 coatings.
CoatingSlope dEm/dpH, V/pH
PPFLPB−0.064 ± 0.002
PPFLNADES1−0.068 ± 0.001
PPFLNADES2−0.057 ± 0.001
Table 2. Charge transfer resistance, R1 (1.13 kΩ in 1 µM standard solution of ascorbic acid), and recovery measured in 1 µM solutions of pharmaceutical preparations. Average ± S.D. values are shown for six individual sensors.
Real SampleR1, kΩRecovery, %
Ascorbic acid in sachets1.16 ± 0.06103 ± 6
Ascorbic acid in tablets1.24 ± 0.11110 ± 10
Disclaimer/Publisher’s Note: The statements, opinions and data contained in all publications are solely those of the individual author(s) and contributor(s) and not of MDPI and/or the editor(s). MDPI and/or the editor(s) disclaim responsibility for any injury to people or property resulting from any ideas, methods, instructions or products referred to in the content.