Article

The Bray–Liebhafsky Oscillatory Reaction as a Chemosensor for Benzenediols

1
Faculty of Physical Chemistry, University of Belgrade, Studentski trg 12-16, 11000 Belgrade, Serbia
2
Faculty of Chemistry and Chemical Technology, University of Maribor, Smetanova ulica 17, SI-2000 Maribor, Slovenia
3
Faculty of Mathematics, Natural Sciences and Information Technologies, University of Primorska, Glagoljaška 8, SI-6000 Koper, Slovenia
4
Institute of Environmental Protection and Sensors, Beloruska ulica 7, SI-2000 Maribor, Slovenia
5
Department of Bromatology, Faculty of Pharmacy, University of Belgrade, Vojvode Stepe 450, 11000 Belgrade, Serbia
6
Department of Catalysis and Chemical Engineering, Institute of Chemistry, Technology and Metallurgy, University of Belgrade, Njegoševa 12, 11000 Belgrade, Serbia
*
Authors to whom correspondence should be addressed.
Chemosensors 2024, 12(10), 211; https://doi.org/10.3390/chemosensors12100211
Submission received: 2 September 2024 / Revised: 5 October 2024 / Accepted: 9 October 2024 / Published: 15 October 2024
(This article belongs to the Section Analytical Methods, Instrumentation and Miniaturization)

Abstract

:
Benezediols are widely used in different areas of industry, thus identification and quantification of benzenediols is of utmost importance due to their toxicity and high environmental abundance. In this work, benzenediol isomers (pyrocatechol, resorcinol, and hydroquinone) were investigated by using the Bray–Liebhafsky (BL) oscillatory reaction. All three isomers exhibit different behavior in the BL reaction, which renders the BL system applicable as a chemosensor. The period between the fifth and sixth oscillation, the amplitude of the sixth oscillation and in the case of hydroquinone, the emergence of a new oscillation in the BL reaction were selected as the parameters used for the identification and quantification of these isomers. Furthermore, electron paramagnetic resonance spectroscopy and DFT calculations were performed in order to provide insights into the mechanism of benzenediols reactions with the BL system.

1. Introduction

The Bray–Liebhafsky (BL) reaction is the decomposition of hydrogen peroxide into water and oxygen in the presence of iodate and hydrogen ions [1,2]. This seemingly simple reaction comprises a complex homogenous catalytic oscillatory process involving numerous iodine intermediates such as I2, I, I•, I2O, IO2•, HOI, HIO2, HO•, and HOO• [3,4,5,6,7,8,9,10,11]. Although the Bray–Liebhafsky oscillatory reaction has been known for more than 100 years and there are a large number of papers [12,13,14,15] devoted to its mechanism, the overall mechanism is still not clarified. It is further complicated by the fact that the system is sensitive to light [9], pressure and stirring [16,17], microwaves [18,19], oxygen [20,21], temperature [22,23], concentrations of reactants [22,23,24], as well as the addition of different analytes [25,26,27,28,29,30,31]. Thanks to the great sensitivity of oscillating reactions to the addition of different analytes, chemical oscillators have become very popular for the analytic determination of “reactive” analytes, and thus their use has been expanded to many areas such as environmental, pharmacy, food science, etc. This paper aims to examine the effect of the three benzenediol isomers (pyrocatechol, resorcinol and hydroquinone) on the BL reaction. All three isomers of benzenediol are colorless to white granular solids at room temperature and pressure, but upon exposure to oxygen, they may darken [32]. The chemical formula of all three isomers is C6H6O2, and their chemical structures are given in Supplementary Materials Figure S1 [33].
Pyrocatechol (1,2-benzenediol or o-benzenediol), resorcinol (1,3-benzenediol or m-benzenediol), and hydroquinone (1,4-benzenediol or p-benzenediol) are used widely as industrial solvents [34] and are found in the effluents of industries such as textile, paper and pulp, steel, petrochemical, petroleum refinery, rubber, dye, plastic, pharmaceutical, cosmetic, etc. (Figure S1) [35,36]. Pyrocatechol is used to produce food additive agents, hair dyes, and antioxidants [37]. Resorcinol is usually employed to produce medicines, adhesives, dyes, plastics, synthetic fibers, cosmetics, and various other compounds [38,39,40]. Hydroquinone has a variety of uses principally associated with its action as a reducing agent, especially in photographic developers and for the production of polymerization inhibitors and rubber and food antioxidants [33]. The quantification of benzenediols is very important because of their presence in environmental samples as highly toxic pollutants [33].
In our previous work [41], we investigated the effect of pyrocatechol on the Bray–Liebhafsky oscillatory reaction. In that study, it has been shown that the oscillatory BL reaction could be used to quantify pyrocatechol. It should be highlighted that experimental conditions were unfavorable because of the reaction duration (more than 5 h). Such BL experimental conditions are highly unsuitable for further analytical applications. However, more favorable experimental conditions were found for the basic BL oscillogram in this paper. Namely, we significantly reduced the induction period, and the frequency of oscillations increased drastically, so it was much easier to monitor the influence of the analyte on the characteristic parameters of the BL reaction. Furthermore, this is the first report of the oscillatory BL system application for the identification and quantification of the other two benzenediol isomers—resorcinol and hydroquinone. The BL reaction is an affordable chemical system, comprised of inexpensive, common chemicals as reactants. Moreover, its experimental setup is simple and accessible to every laboratory.

2. Materials and Methods

2.1. Bray–Liebhafsky Reaction Experimental Setup

Experiments were performed in a closed, well-stirred (stirring rate was 900 rpm for each experiment) double-walled glass electrochemical cell, which was thermostated at all times at 62.0 ± 0.2 °C. The reaction volume was 25 mL. The vessel was protected from the influence of light by tin foil. All of the chemicals used were of p.a. grade (Merck, Darmstadt), and the solutions were prepared in deionized 18 MΩ MiliQ water. Concentrations of the stock solutions used for the BL reaction were the following: [KIO3]o = 0.1636 M, [H2SO4]o = 0.1091 M, and [H2O2]o = 3.83 M. For all of the experiments, 11 mL of KIO3 stock solutions was transferred to the reaction vessel, and subsequently 11 mL of H2SO4 was added and the BL reaction was initiated by the addition of 3 mL of H2O2. The time evolution of BL reaction was monitored from the moment of H2O2 addition until the end of the 10th oscillation, by employing Pt electrode as a working electrode and Ag/AgCl as a reference electrode.
In order to monitor the effect of the three benzenediol isomers (pyrocatechol, resorcinol and hydroquinone) on the BL reaction, five stock solutions of different concentrations were prepared for each of these three compounds. A small volume (100 µL aliquot) of these stock solutions was added to the BL reaction mixture after the fifth oscillation, which was arbitrarily chosen. Each experiment was performed in triplicate, and the measured parameters were averaged.

2.2. EPR Spectroscopy Measurements of Hydroxyl Radical Scavenging by Benzenediols

In order to assess the ability of pyrocatechol, resorcinol, and hydroquinone to scavenge the hydroxyl radical (HO•), electron paramagnetic resonance spectroscopy (EPR) coupled with the spin trapping method was used. All of the chemicals were of p. a. grade.
First, spin trap 5-(diethoxyphosphoryl)-5-methyl-1-pyrroline-N-oxide (DEPMPO; Focus Biomolecules) was purified according to the previously described procedure [42]. Hydroxyl radicals were generated by the Fenton reaction, carried out by adding H2O2 (Merck, Darmstadt) solution to the sample already containing FeSO4 (Merck, Darmstadt), freshly prepared by dissolution in deaerated water, and DEPMPO, in the case of the reference sample, which did not contain analyte. Samples containing benzenediol isomers were prepared according to the same procedure, with the emphasis that these compounds were added to the reaction mixture before H2O2. Concentrations of FeSO4 and H2O2 were 0.17 mM and 1.43 mM in all samples, respectively, while on the other hand, three different concentrations of benzenediols were used to assess their antiradical activity—450 mM, 50 mM, and 5 mM. Samples were withdrawn into thin, gas-permeable, capillary Teflon tubes (Zeus Industries Inc.) and placed into the Bruker SHQE resonator. EPR spectra of each sample were acquired two minutes after initiating the Fenton reaction by adding H2O2, on a Bruker Elexsys II E540 X-band EPR spectrometer. The EPR parameters were as follows: microwave frequency 9.85 GHz, central field 3510 G, sweep width 200 G, modulation frequency 100 kHz, modulation amplitude 2 G, and conversion time 29.30 ms.

2.3. Computational Methods

All results were obtained from calculations using the density functional theory (DFT) approach. Full geometry optimizations and subsequent frequency calculations were performed using the B3LYP-D3 functional [43] as implemented in the Gaussian 09, Revision D.01 [44]. The 6-311++G(d,p) basis set for carbon, oxygen, and hydrogen atoms and def2-TZVPD for the iodine atom were utilized [45]. All calculations refer to water solution at p = 101325 Pa and T = 335.15 K, in agreement with experimental conditions. To mimic the water solution, the SMD continuum solvation model was used [46]. Restricted and unrestricted calculations were applied for the closed-shell and open-shell structures, respectively. The nature of the reactive species was confirmed by analyzing the results of the subsequent frequency calculations in the harmonic approximation: only real frequencies for equilibrium geometries and exactly one imaginary frequency for transition states (TSs) were obtained.
As in our previously published paper [41], two types of reactions between the three benzenediol isomers (PhOH) and intermediates, HO•, HOO•, I•, IO•, IO2•, I2O, HIO, and, HIO2, were examined:
Free radical reactions including
PhOH + R• → PhO• + RH
and redox reactions including
PhOH + I2O → Quin + HI + HIO
PhOH + I2O → Quin + I2 + H2O
PhOH + HIO → Quin + HI + H2O
PhOH + HIO2 → Quin + HIO + H2O
PhOH + HIO2 → Quin + HI + H2O2
where Quin denotes ortho, meta, and para quinone in the case of pyrocatechol (Cat), resorcinol (Res), and hydroquinone (Hq), respectively. The thermochemical viability of the reactions (1)–(6) was investigated in terms of the reaction Gibbs free energies (ΔGr) reaction. The exergonic (ΔGr) free radical reactions were subjected to further kinetic calculations. The Eckart method [47], also known as the zero-tunneling method (ZCT-0), was applied to obtain the reaction rate constants. This method uses the Eckart function for generating the ground-state potential energy function based on information on the stationary points (reactants, transition state, and products) along MERP. To perform the Eckart method calculations, TheRate program [48] was utilized. This program has been successfully applied for the calculation and reproduction of the experimentally obtained reaction rate constants of bimolecular reactions [49,50,51].

3. Results

3.1. The Effect of Benzenediol Isomers on Bray–Liebhafsky Reaction

Potentiometry was used to follow the dynamics of the BL reaction, thereby detecting the activity of all the redox-active species present in the reaction mixture. The dependence of the recorded potential on time for the BL reaction (oscillogram) without any added compounds is depicted in Figure 1. Additionally, all of the measured parameters used to analyze the influence of the benzenediol isomers on the BL reaction are marked in Figure 1. From the presented oscillogram, it can be observed that under the described experimental conditions, the BL reaction passes through an induction period (τind) of approx. 13 min, after which the system exhibits oscillatory behavior. The BL reaction dynamics was followed until the end of 10 oscillations (τend), which lasted approx. 40 min. The mean values of the parameters—τind, τend, period between the fifth and sixth oscillation, τ5–6, and amplitude of the sixth oscillation, A6—obtained for the three experiments, carried out without the addition of any analyte, are summarized in Table 1.
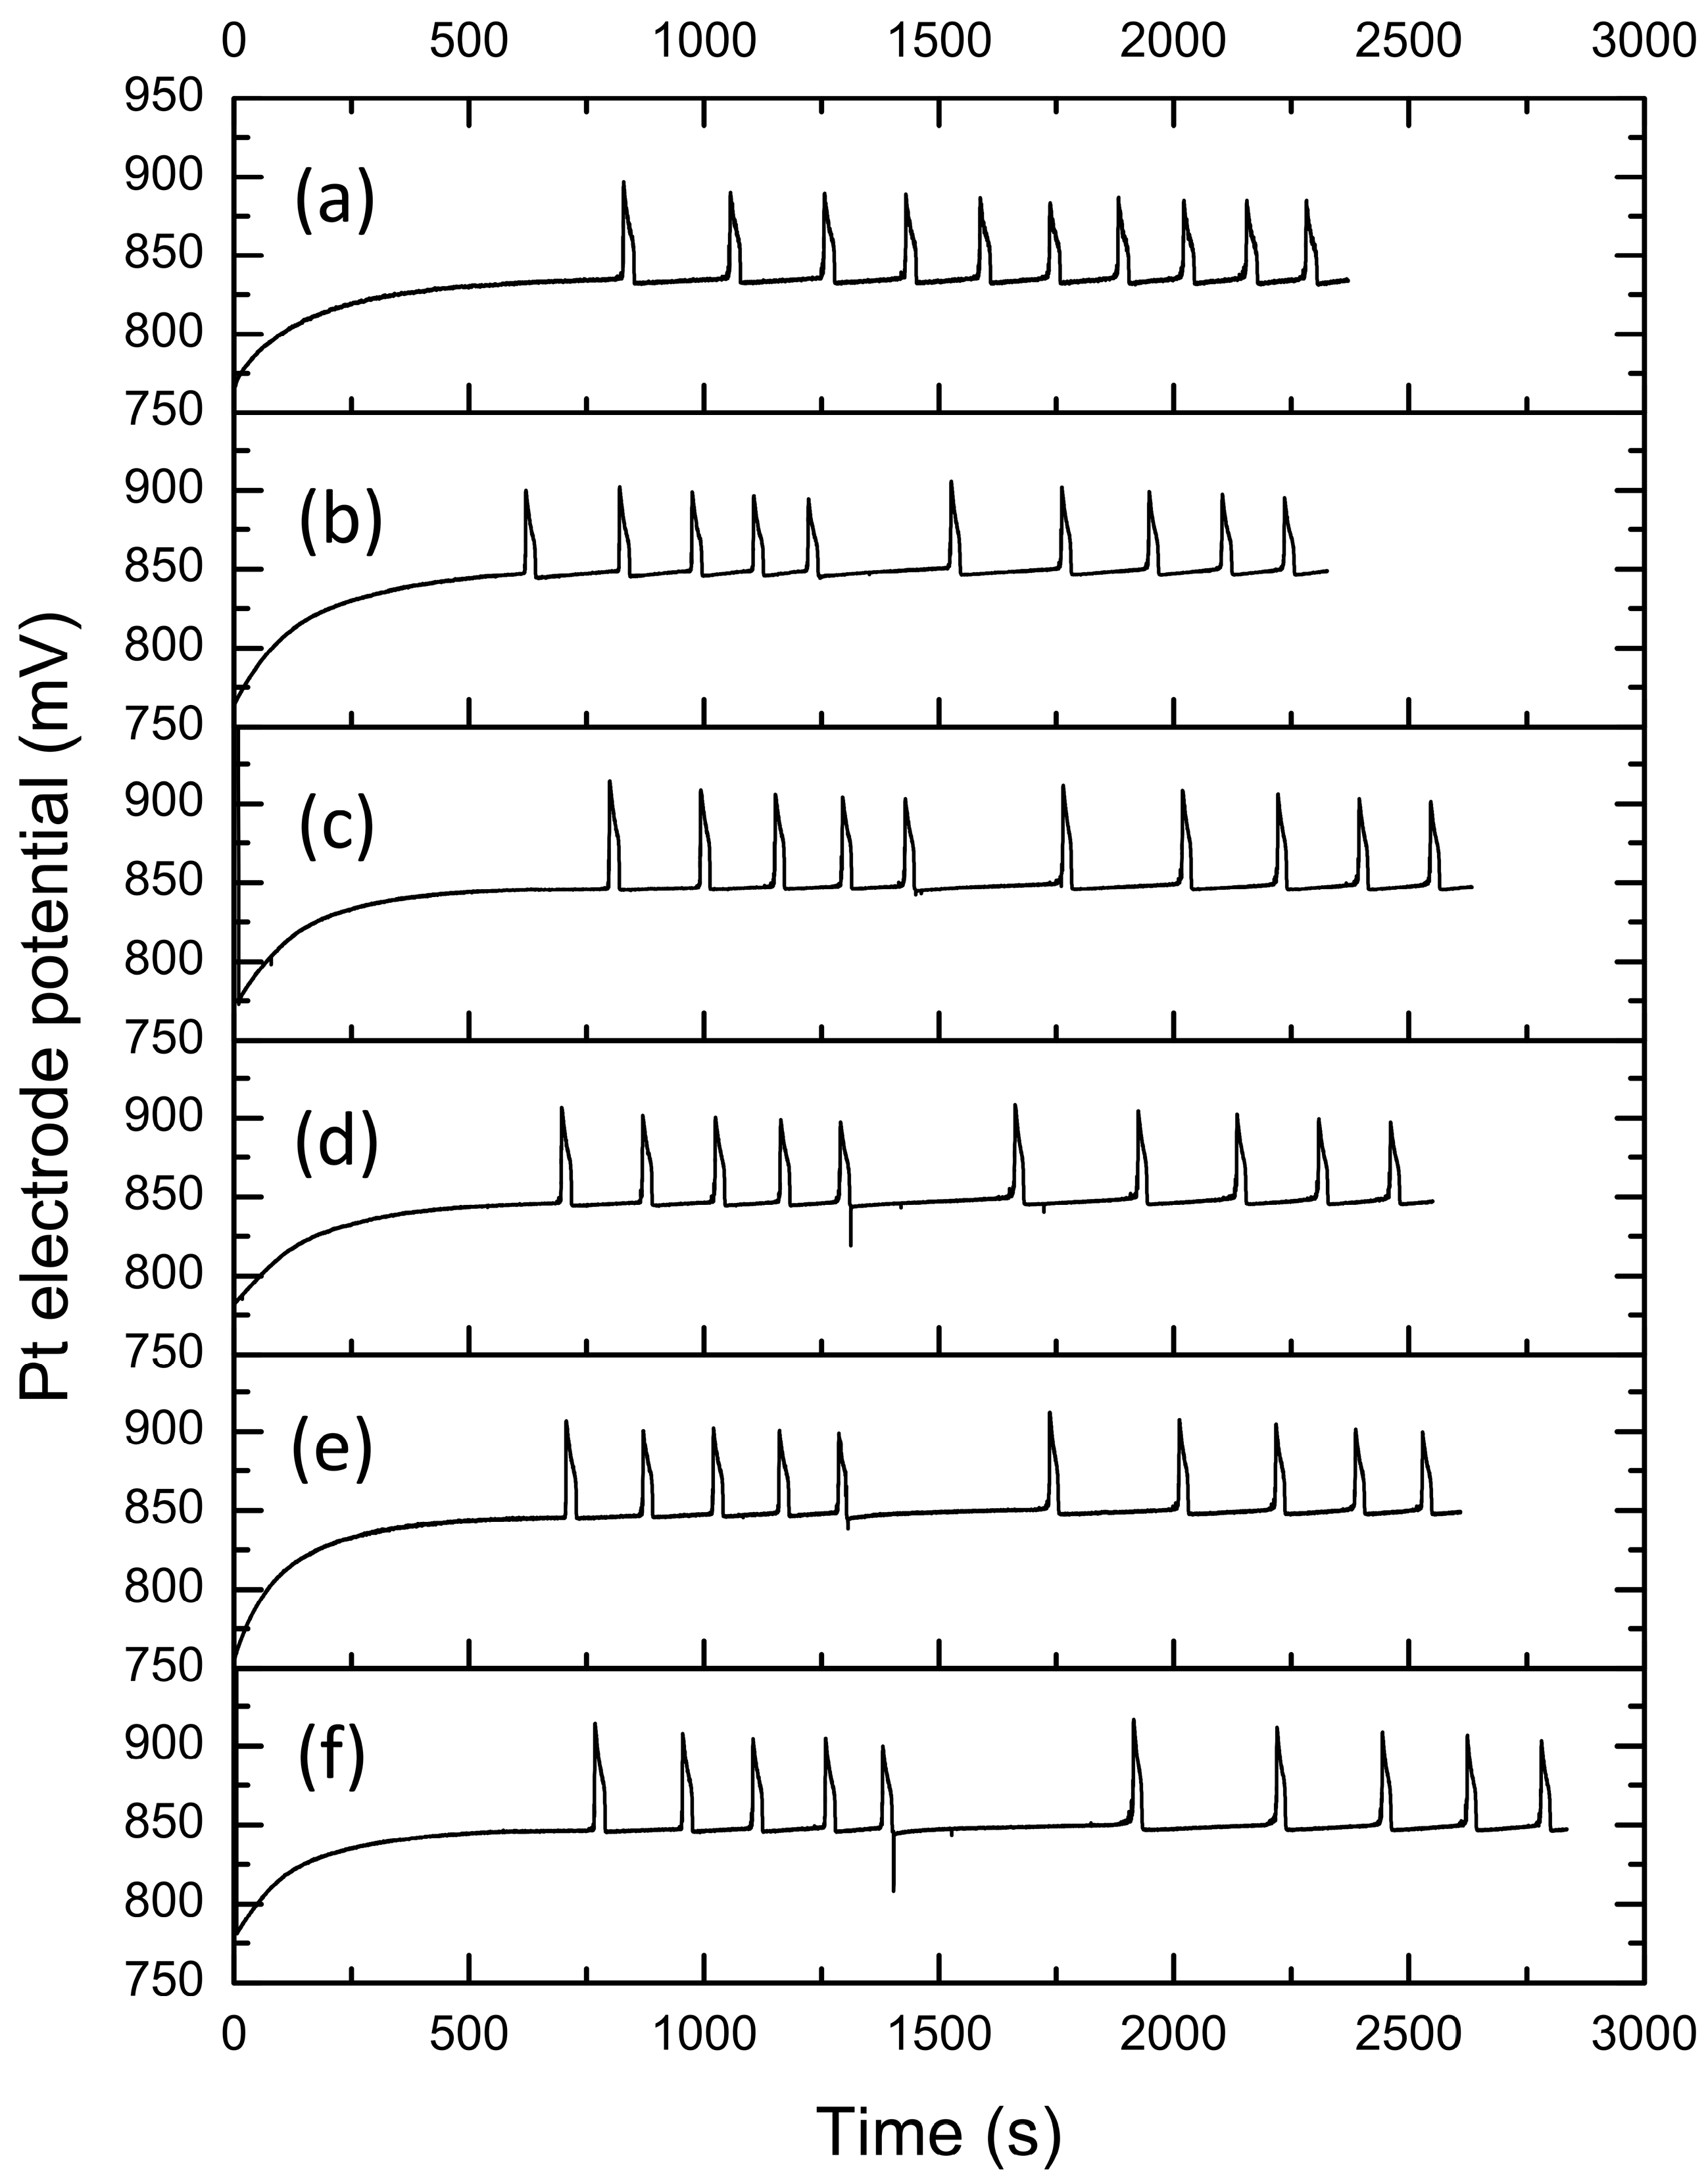
In order to study the effect of benzenediol isomers on BL reaction dynamics, varying concentrations of pyrocatechol, resorcinol, and hydroquinone were added to the reaction mixture immediately after the end of the fifth oscillation. The concentration of these three compounds in the BL system ranged between 60 µM and 2 mM. BL oscillograms recorded for each of the three benzenediol isomers are shown in Figure 2, Figure 3 and Figure 4.
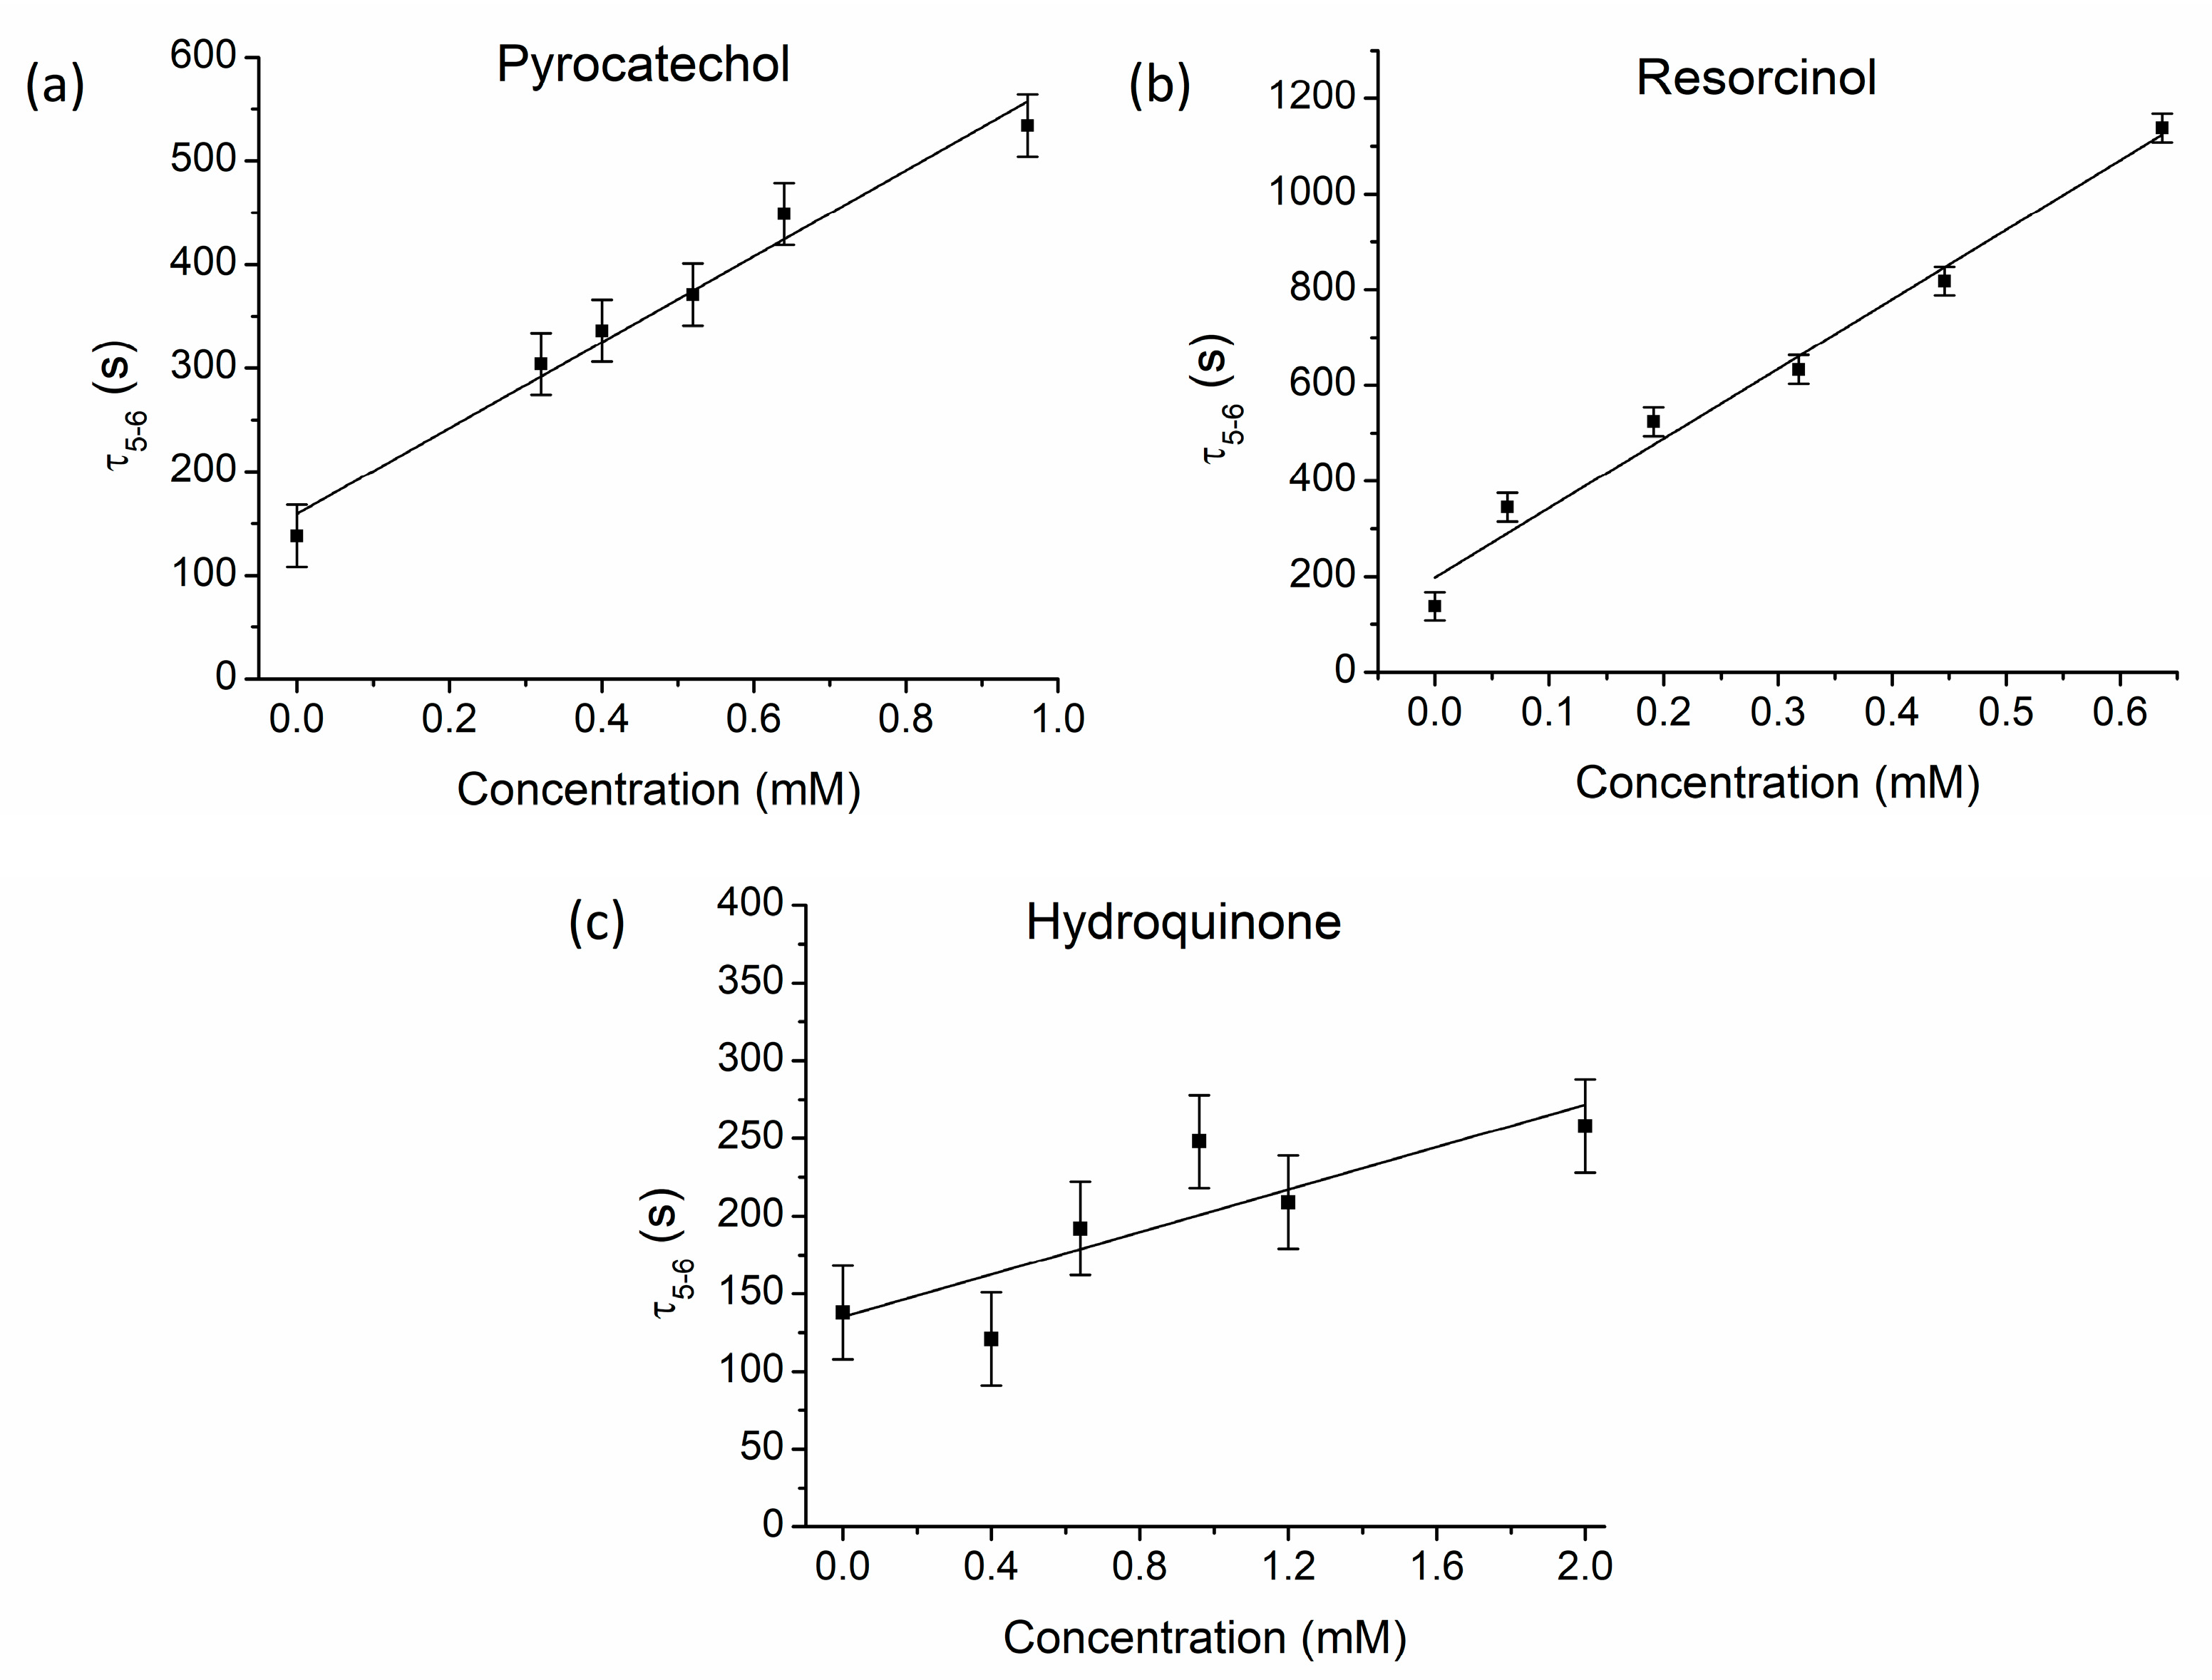
From the data presented in Figure 2, Figure 3 and Figure 4, it can be clearly observed that in certain concentration ranges, pyrocatechol and resorcinol caused a sudden drop of potential immediately after the addition of these compounds, while, on the other hand, hydroquinone induced the appearance of a new oscillation promptly after this compound was introduced to the BL system. Moreover, by measuring and analyzing some of the oscillogram characteristic parameters, it can be noticed that the addition of benzenediol isomers has the most pronounced effect on the amplitude of the sixth oscillation, A6, the period between the fifth and sixth oscillation, τ5–6, and consequently on the entire duration of the oscillogram, τend. The effect of benzenediols addition on τ5–6 is depicted in Figure 5.
The dependence of τ5–6 on the concentration of pyrocatechol and resorcinol displays a linear behavior in the entire selected concentration range. However, τ5–6 seems to be more sensitive to the presence of resorcinol, as the corresponding slope of the linear plot is much higher for this compound, as compared to pyrocatechol: (1500 ± 100) s/mM vs. (410 ± 30) s/mM. These findings may indicate the higher reactivity of resorcinol with some BL intermediates that are produced during the reaction, or with the starting reactants, which is further corroborated by EPR experiments and DFT simulations. On the other hand, hydroquinone, within the experimental error limits, does not exhibit a significant effect on τ5-6, which is supported by the fact that the value of τ5–6 for the highest hydroquinone concentration does not differ markedly from the τ5–6 mean value obtained for the BL reaction without the analyte.
By performing the least square linear fitting of data points shown in Figure 5, the intersections and slopes were calculated for all three isomers in Origin 9 software. These curves were statistically processed to determine the Limit of Detection (LOD) and Limit of Quantification (LOQ). LOD and LOQ are terms used to describe the lowest concentration of a sample that can be detected and reliably measured by an analytical procedure, respectively. The LOD and LOQ were calculated from a linear fit of τ5–6 vs. concentration, according to [52]:
L O D = 3.3 · σ k
L O Q = 10 · σ k
where σ is standard deviation of τ5–6 and is calculated using the difference between measured τ5–6 and the predicted values obtained from the linear regression fit. The parameter k is a slope of the linear fit. The results are presented in Table 2.
As observed from the LOD and LOQ values, the minimal concentration that could be detected by the BL method is obtained for resorcinol.
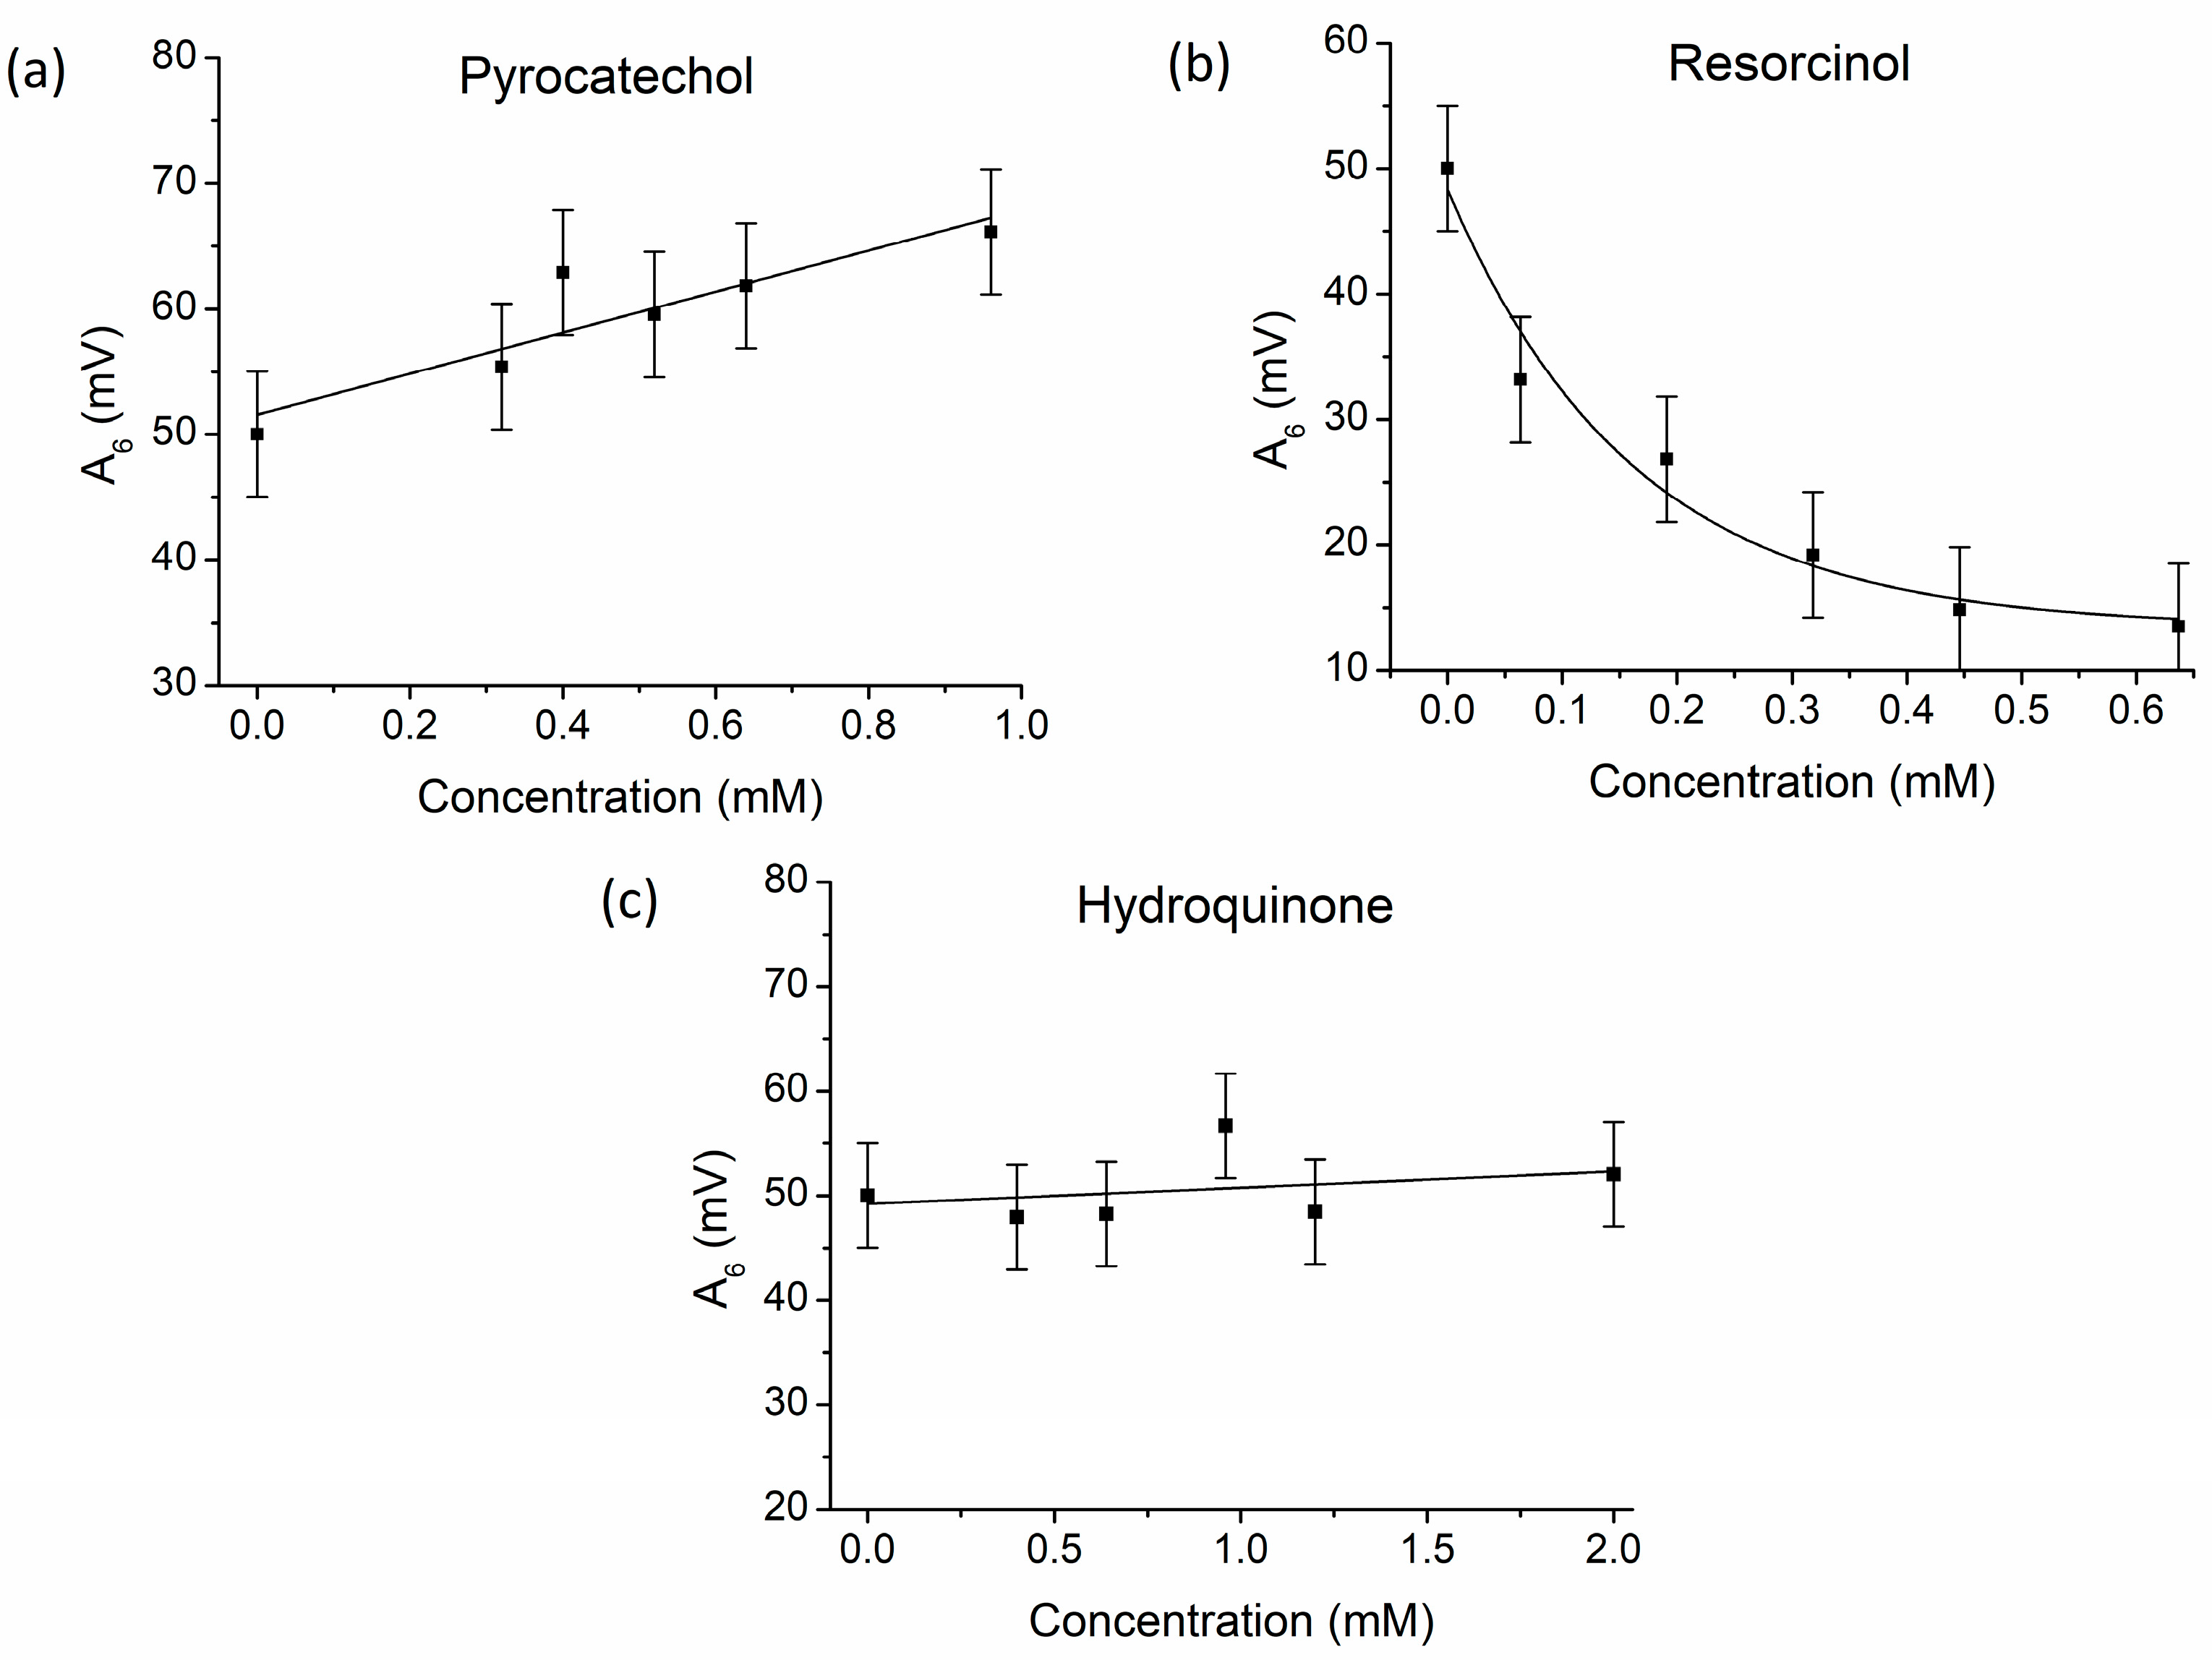
The impact of the benzenediols on the amplitude of the sixth oscillation, A6, was, however, different for each of the three compounds (Figure 6). Pyrocatechol and resorcinol, on the one hand, induced observable changes in the values of the A6 parameter with the increase of their concentrations, while hydroquinone, on the other hand, had no significant impact on A6. While data collected for pyrocatechol showed a linear trend, fitted by equation A6 = 16 mV/mM∙cpyrocatechol + 52 mV (where cpyrocatechol represents the concentration of the pyrocatechol in the BL system), increasing the resorcinol concentration caused the exponential decay of A6, which could be fitted by the following equation: A6 = 35 mV∙e−(cresorcinol/0.16 mM) + 13 mV.
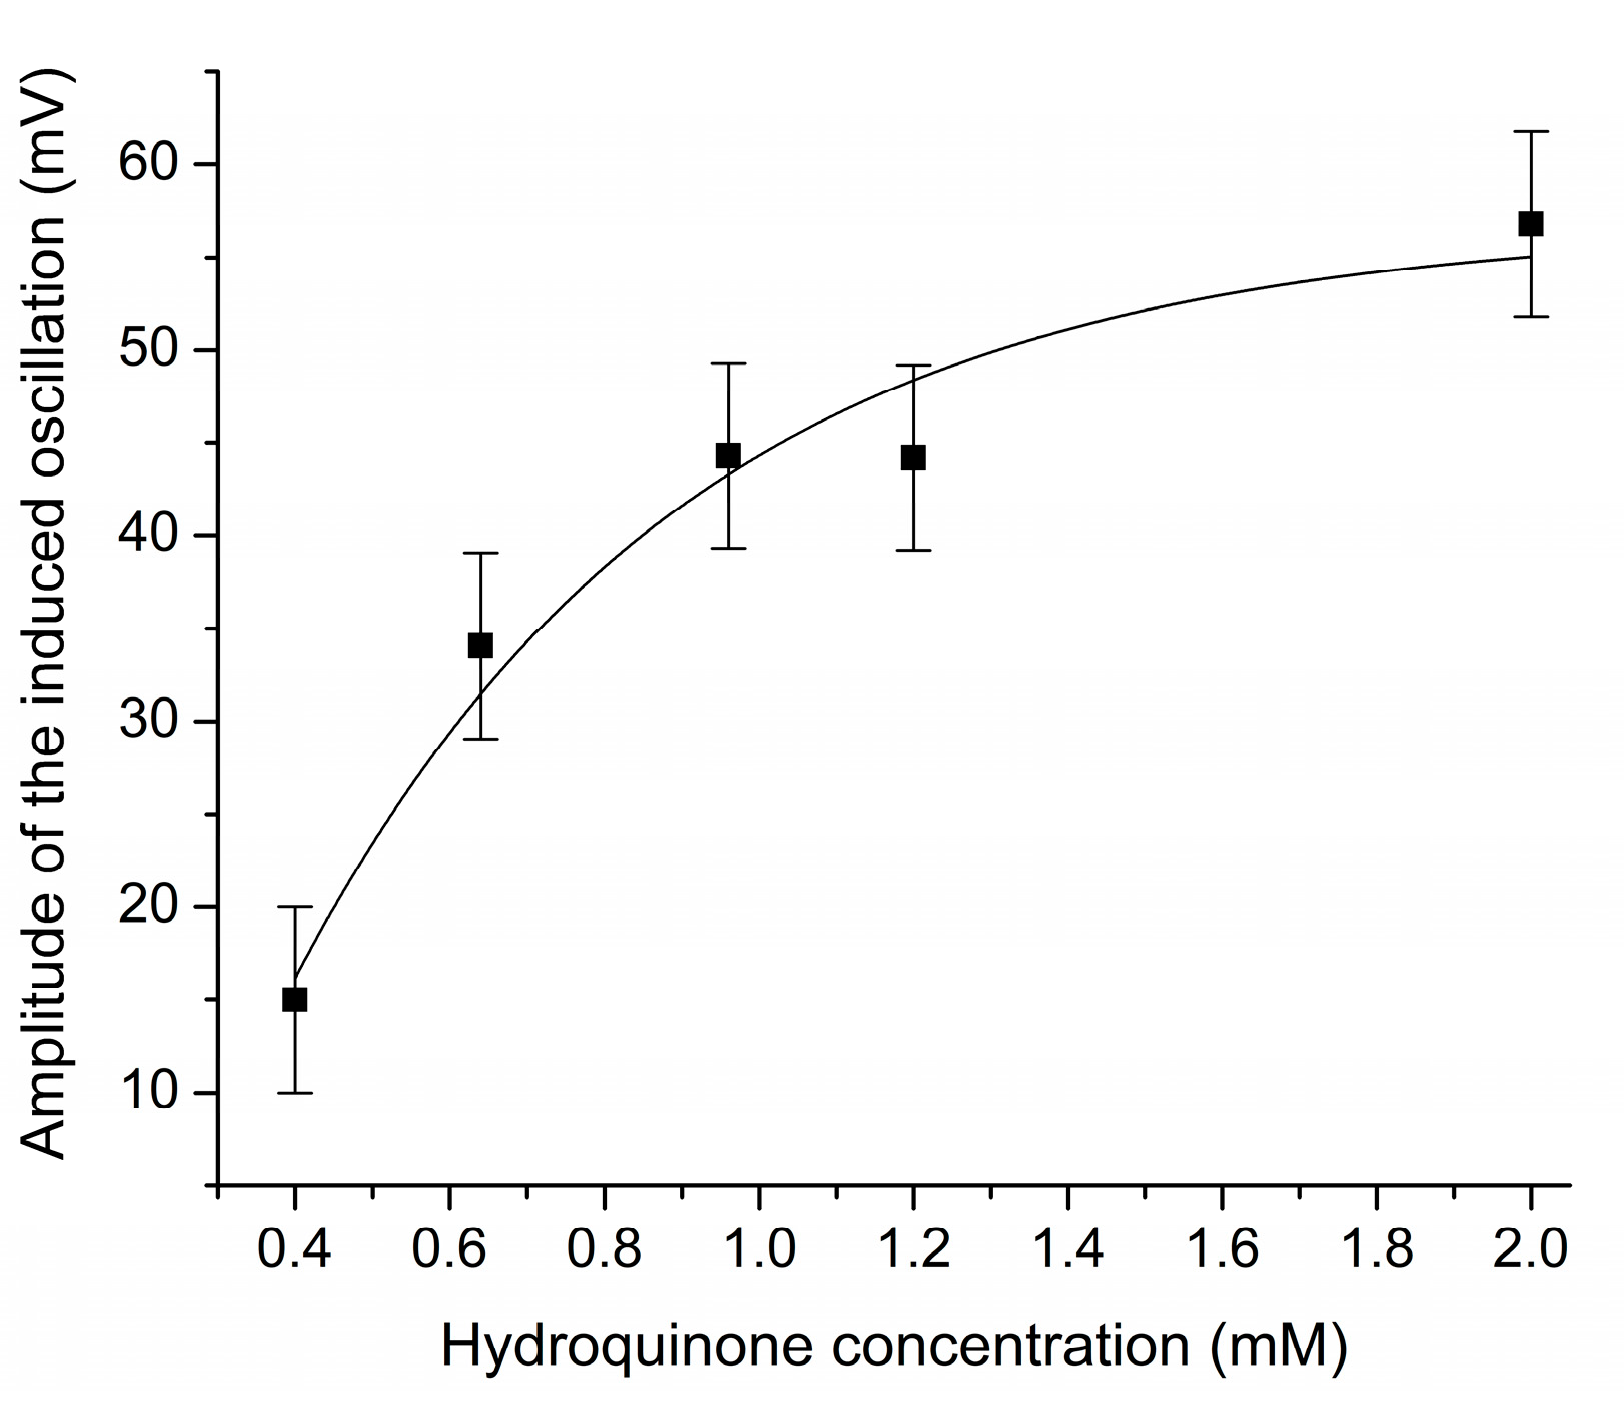
Even though hydroquinone did not exert any significant changes on either of the two measured parameters, the appearance of the new peak immediately after the addition of this compound to the BL reaction represents not only a qualitative feature, which can be used to distinguish this benzenediol isomer from the other two, but also the amplitude of this peak shows a strong dependence on the hydroquinone concentration (Figure 7). A very good fit of this dataset was obtained by using the exponential function given by the following expression: Ai = −90 mV∙e−(Chydroquinone/0.5 mM) + 57 mV, where Ai is the amplitude of the induced peak, and Chydroquinone represents the concentration of hydroquinone in the BL system.

3.2. Hydroxyl Radical Scavenging by Benzenediols—EPR Measurements

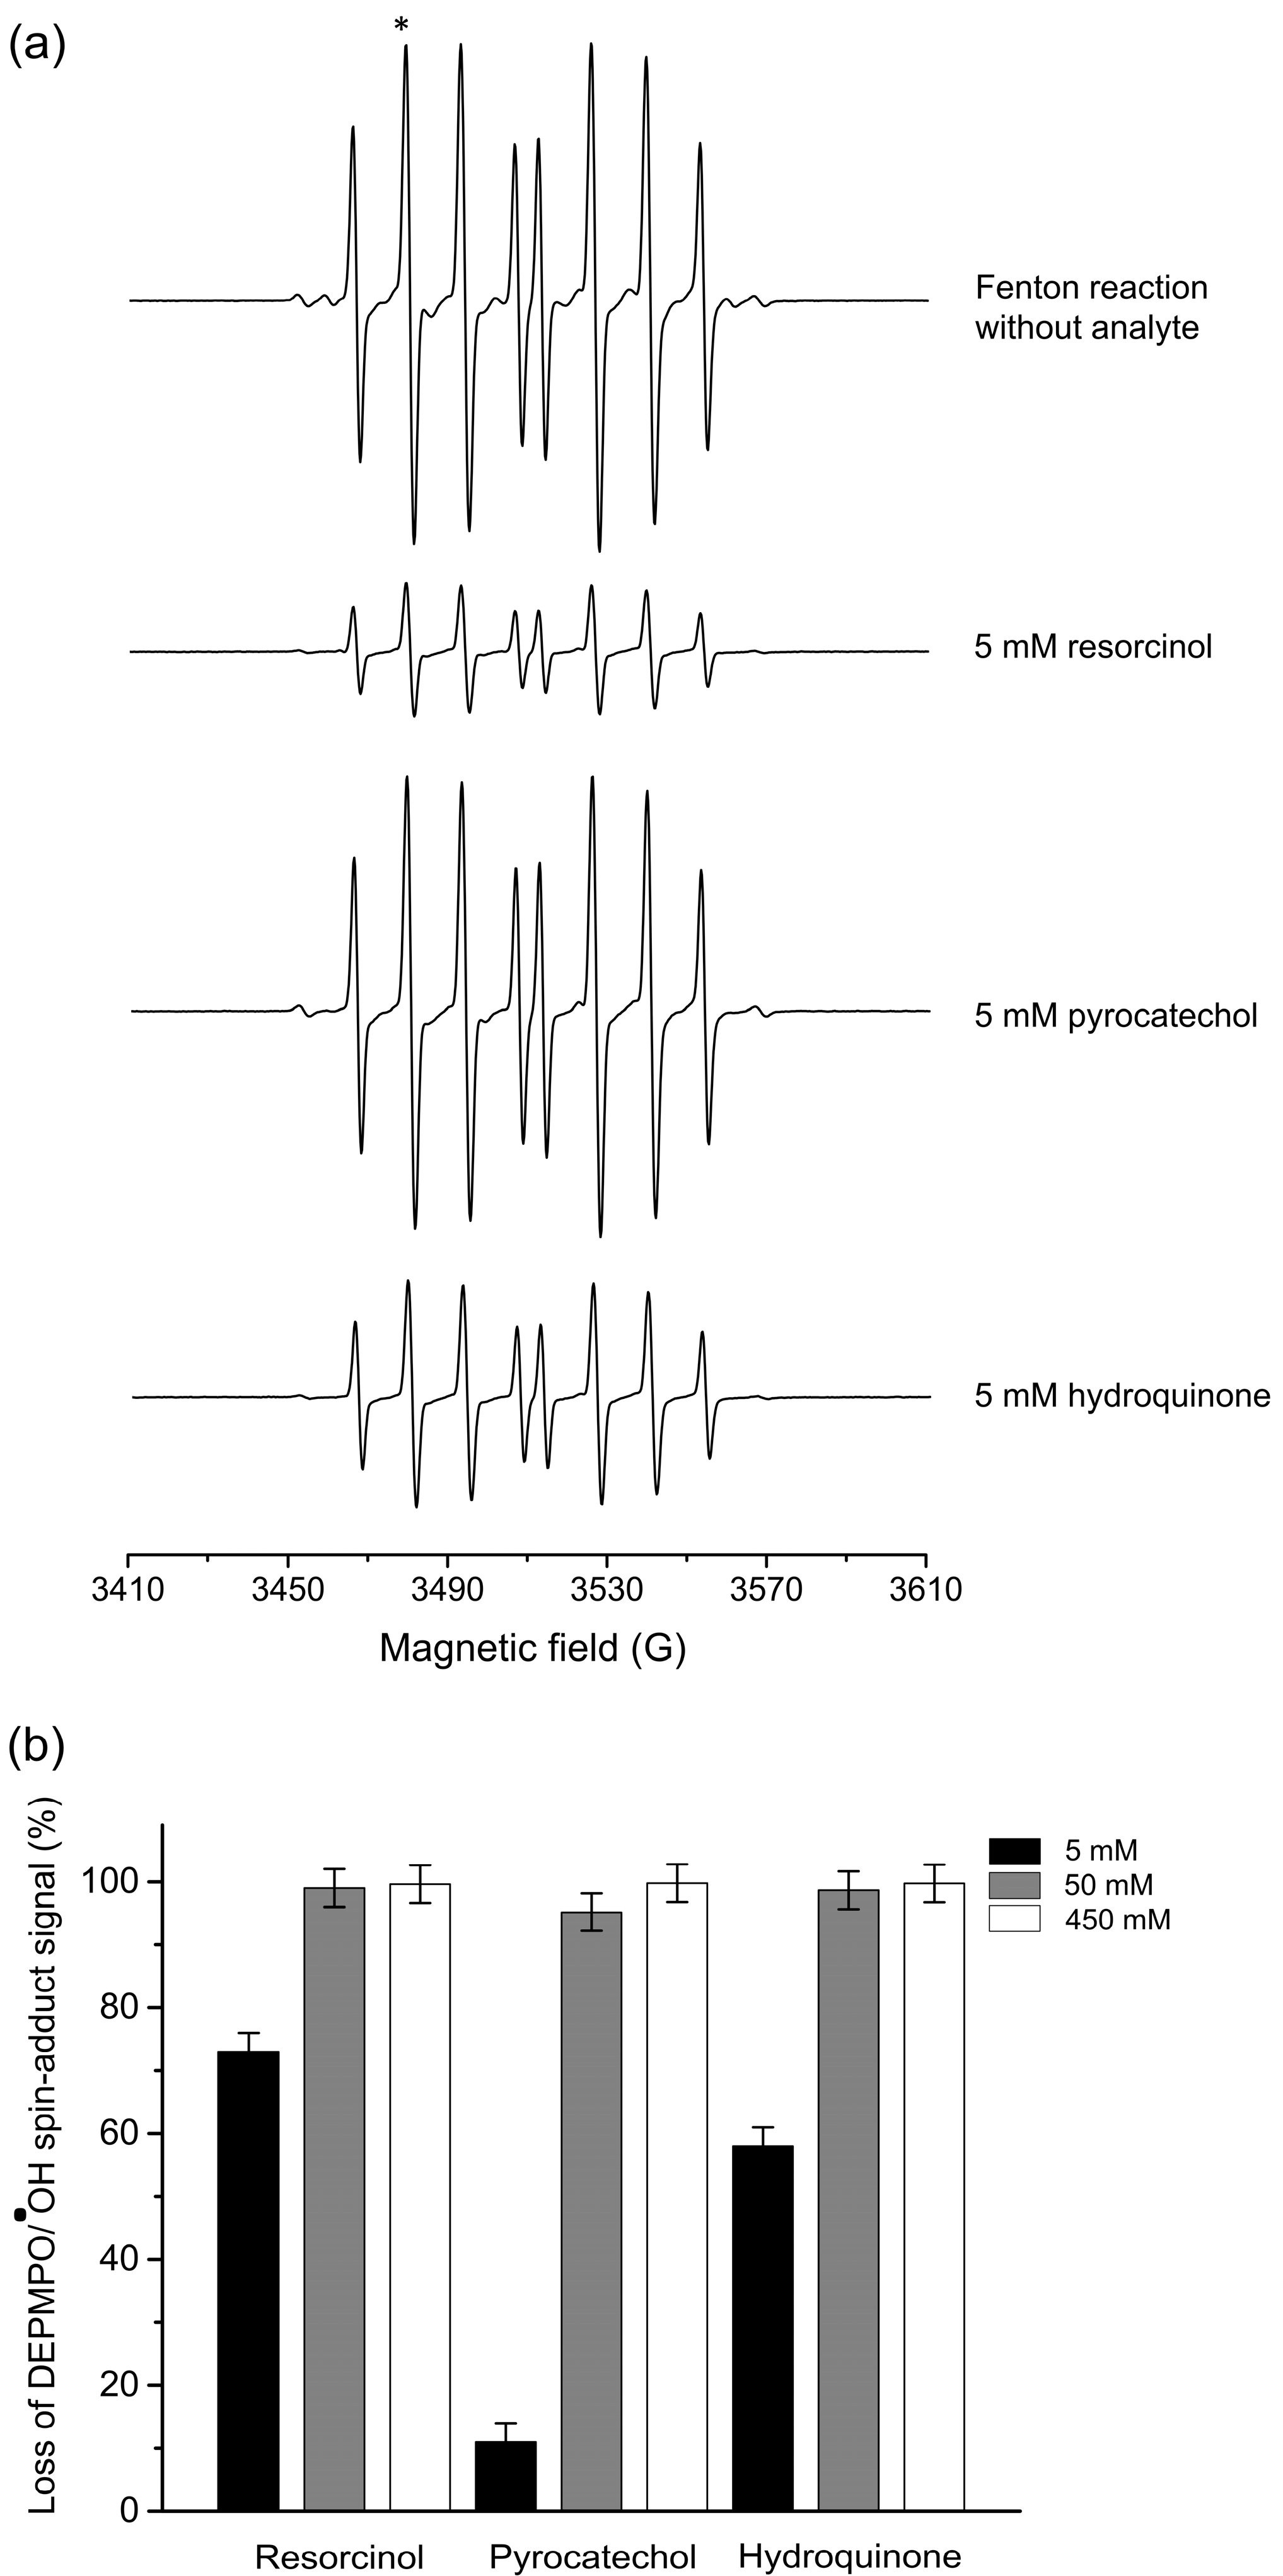
The EPR spectra of the DEPMPO/•OH spin adduct collected for the samples containing 5 mM benzenediols only two minutes after the initiation of the Fenton reaction, as well as for the reference sample containing no analyte, are shown in Figure 8a. For all three isomers, a significant decrease of the typical DEPMPO/•OH spin adduct EPR signal can be observed, indicating that all three compounds are able to scavenge HO• radicals to varying degrees. As expected, the extent of the DEPMPO/•OH signal decay depends strongly on the concentration of benzenediols in the Fenton reaction, which can be clearly observed in Figure 8b. At a very high concentration (450 mM), all of the three compounds exhibit excellent HO• scavenging activity. On the other hand, by observing the ratio of signal amplitudes acquired for the two lower benzenediol concentrations, more specifically at 5 mM, it is possible to discern with high accuracy which of these compounds prevalently reacts with HO• radicals. From the data shown in both Figure 8a,b, it may be unambiguously deduced that the HO• radical scavenging activity decreases in the following order: resorcinol > hydroquinone > pyrocatechol.

3.3. Computational Results

Due to the possibility of bond rotation around the C-O bond, resorcinol exhibits three distinct conformations of hydroxyl groups in relation to the phenyl ring, namely syn-syn, anti-anti, and syn-anti (Figure S2). Similarly, hydroquinone displays cis and trans conformations (Figure S2). The stability differences among the resorcinol conformers are negligible (<1.0 kJ mol−1), and only 0.4 kJ mol−1 for the cis/trans conformers of hydroquinone. As a result, all possible conformers, including syn-syn, anti-anti, and syn-anti for resorcinol, as well as cis and trans for hydroquinone, were subjected to both thermodynamic and kinetic analyses. The reaction Gibbs free energies (ΔGr) for reactions (1)–(6) were calculated, and the results are presented in Table 3.
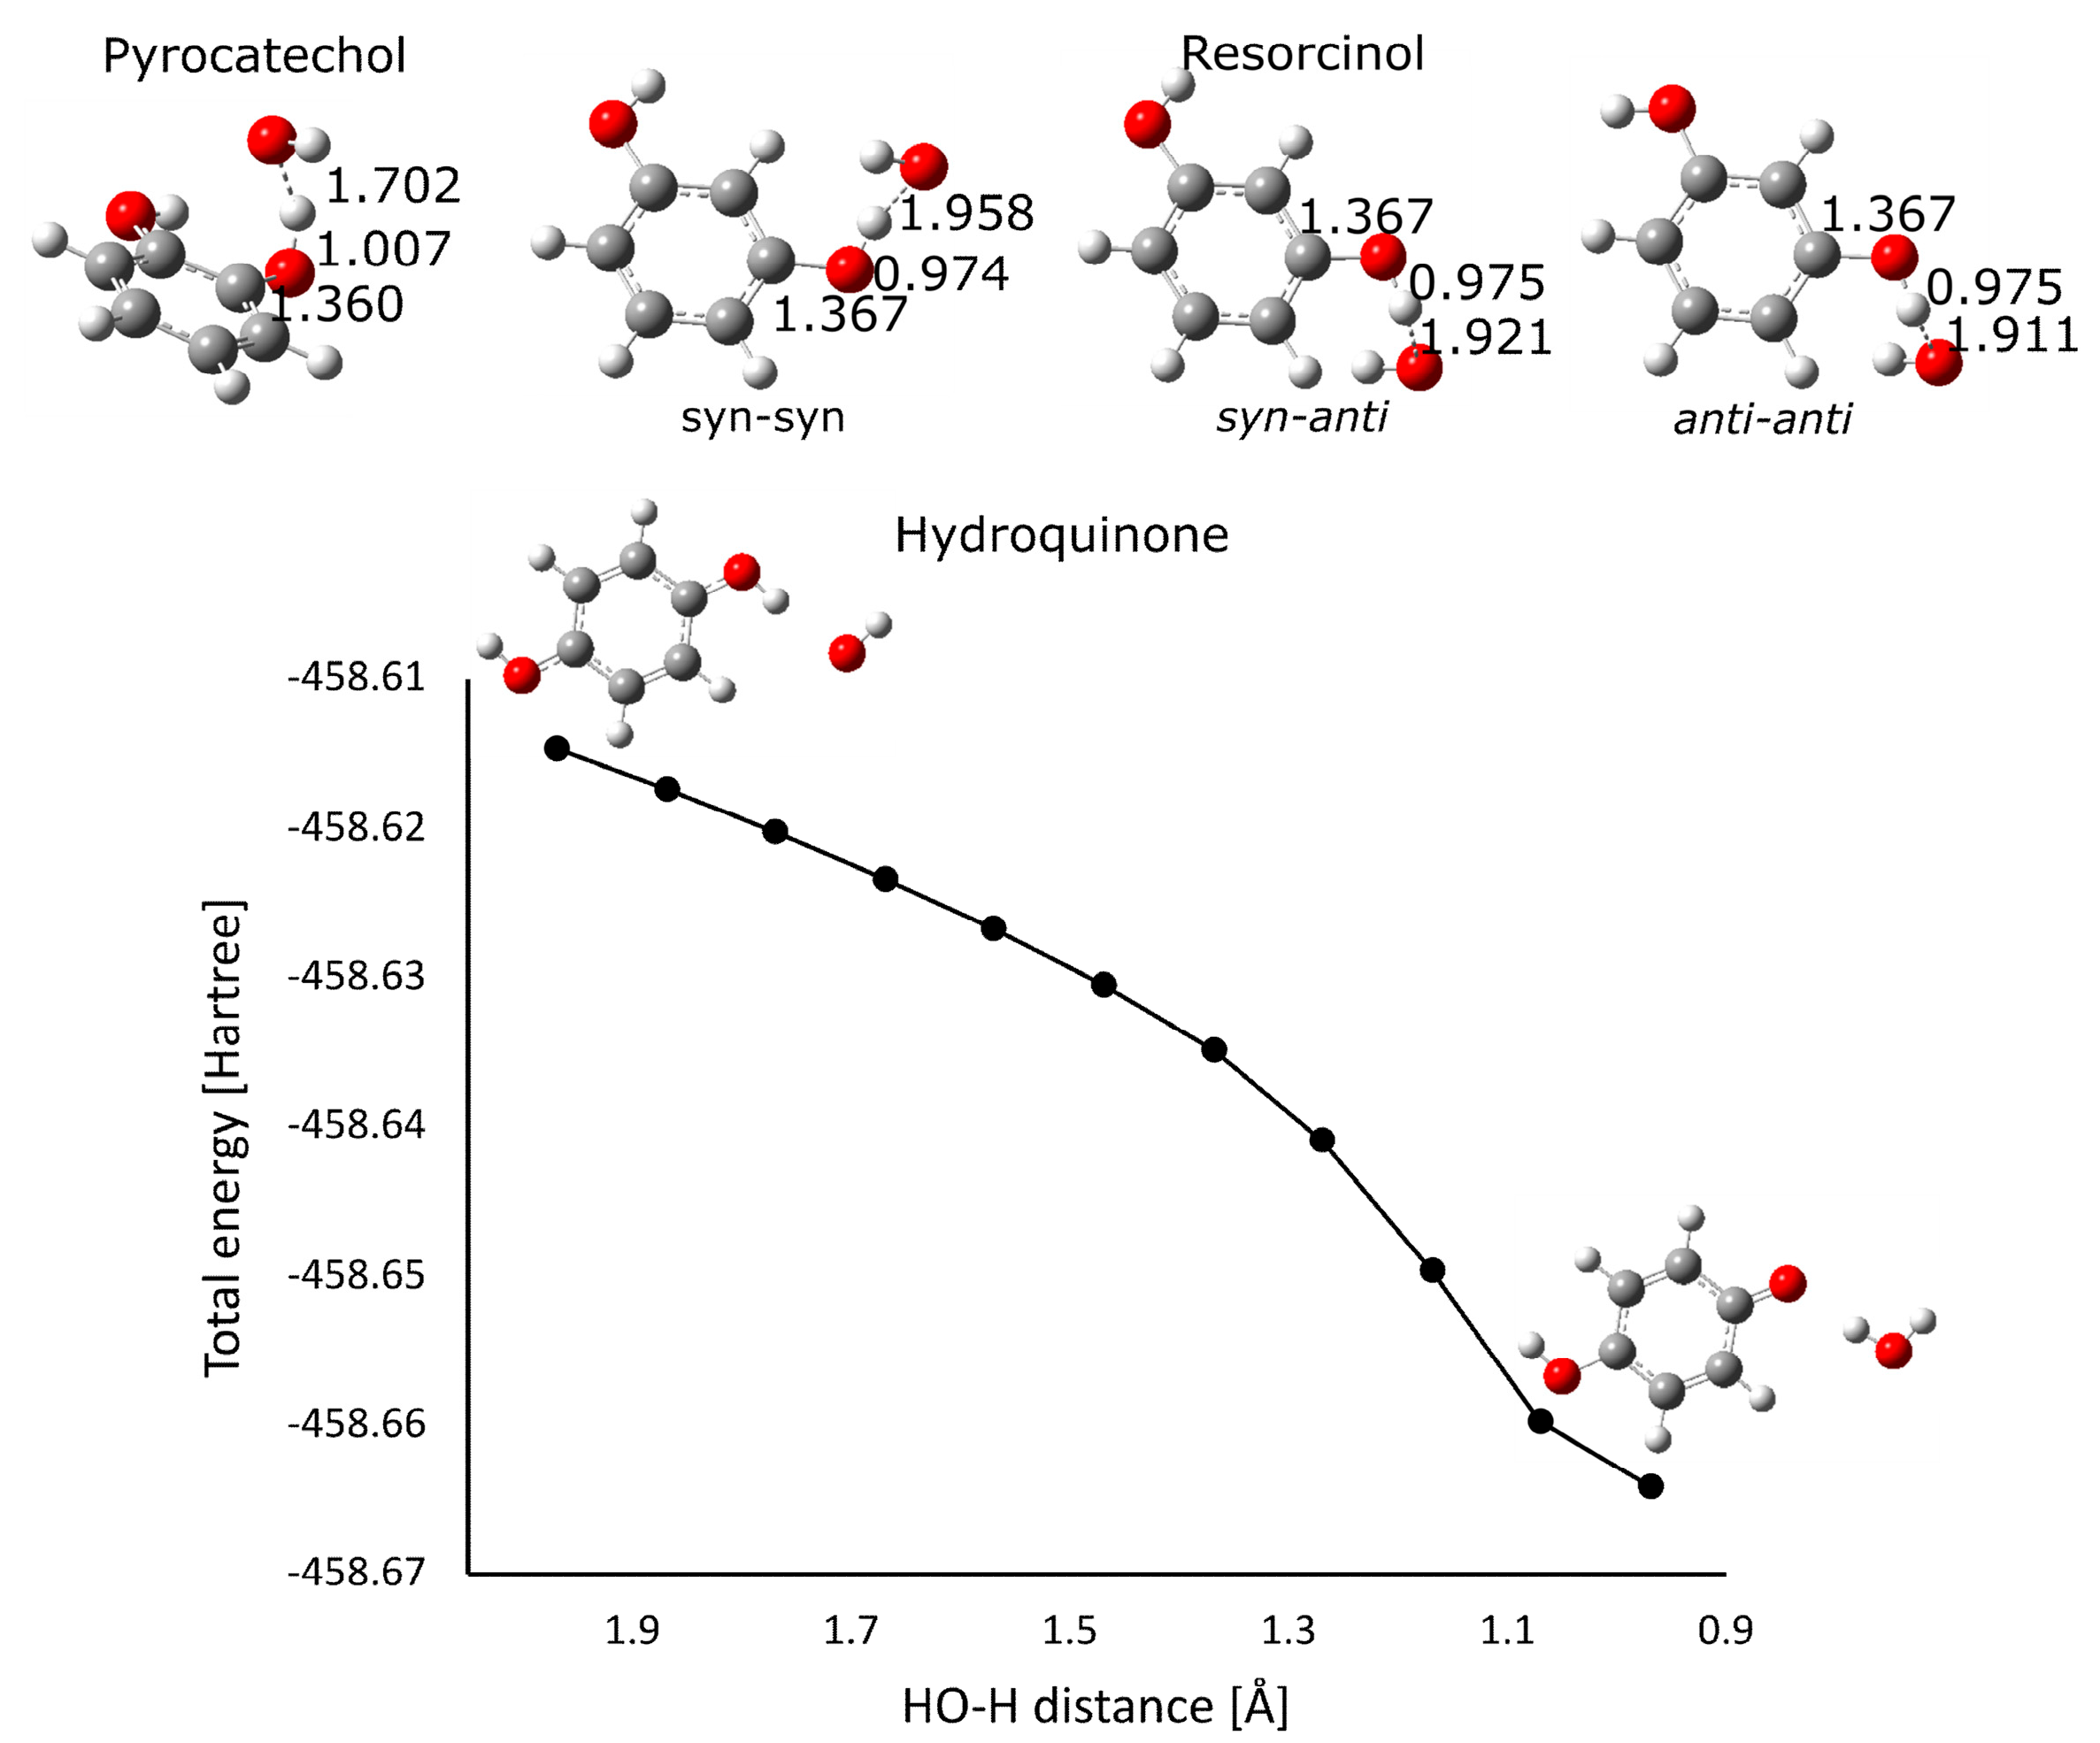
The mechanisms of oscillatory reactions by organic compounds are not well understood, and some of the intermediate products have only been recently identified, making it difficult to study [53]. It is believed that the redox reactions involved in these mechanisms are particularly complex. However, recent reports have shown that oxidation reactions between organic compounds and free radical intermediates occur through a hydrogen atom transfer mechanism (HAT) [54,55]. For this reason, the HAT mechanisms for all thermodynamically favorable reactions involving free radicals considered in this study were further studied kinetically. Most transition states (TSs) for the HAT reactions were successfully obtained, except for the HAT reaction of hydroquinone with the HO• radical, for which all attempts to locate TSs were unsuccessful. It was therefore reasonable to assume that this reaction is barrierless. To confirm this assumption, the HO• radical was placed near the corresponding H atom and allowed to approach the reactive center until product formation. The dependence of the total energy on the corresponding HO•–H distance as a scan coordinate was analyzed. Based on the monotonous decrease in total energy with decreasing HO•–H distance, it was concluded that this reaction is indeed barrierless and, therefore, diffusion-controlled, with a corresponding reaction rate constant of 1.91 × 10 9 M−1 s−1. The successfully obtained TSs for the reactions of pyrocatechol and resorcinol with the HO• radical as well as the representative total energy profile for the HO• radical for the HAT reaction with hydroquinone are depicted in Figure 9. The optimized geometries for all the other successfully obtained TSs are provided in the Supplementary Material (Figures S3–S6). The calculated activation free energies ( Δ G a ) and reaction rate constants (kZCT_0) are presented in Table 4.

4. Discussion

In the present work, it has been shown that all three benzenediol isomers exhibit different behaviors in the Bray–Liebhafsky reaction. Namely, out of all the observed parameters, the period between the fifth and sixth oscillation of the BL reaction shows a linear response to increasing concentrations of pyrocatechol and resorcinol. Also, the amplitude of the sixth peak showed strong dependence on the concentration of these two isomers. In the case of pyrocatechol, this dependence was linear, while for resorcinol, it was an exponential decay. Neither of these BL parameters was significantly affected by the presence of hydroquinone, but hydroquinone solely induced the emergence of a new peak immediately after addition to the BL reaction mixture, whose amplitude showed an exponential dependence on hydroquinone concentration. Based on the observed results, it may be suggested that thanks to the sensitivity of the BL reaction to these three isomers, BL reaction may be employed as a chemosensor for these three compounds. To the best of the authors’ knowledge, this is the first report where the BL reaction was used and optimized as a system for distinguishing between isomers of any compound. In general, among well-known oscillatory reactions, so far, the Briggs–Rauscher reaction has been frequently used for the detection and quantification of various compounds as well as distinguishment between isomers of the same compound [56,57,58,59,60,61,62,63].
All three isomers of benzenediol have previously been investigated in Briggs–Rauscher [63] and Orban–Epstein oscillatory reactions [64]. According to the work of Cervellati et al. [63], whereby the effects of pyrocatechol and resorcinol on the inhibitory period of the Briggs–Rauscher reaction were studied, pyrocatechol and resorcinol showed the opposite trends compared to the results presented in this study. Namely, the slope of the linear dependence between the inhibitory period and the concentration of these two benzenediols was one order of magnitude higher for pyrocatechol in the Briggs–Rauscher reaction. Furthermore, the Briggs–Rauscher reaction was shown to be sensitive to very low concentrations of benzenediols in the range of several µM [63]. However, the drawback of such high sensitivity of the inhibitory period to micromolar concentrations is the longer duration of the experiments, since the inhibitory time for these two compounds was in the range of 1000–3500 s, whereas the inhibitory time in the present study, τ5–6, was up to 1200 s, making the presented experiment setup less time consuming and more efficient. On the other hand, in the Orban–Epstein oscillatory reaction [64], the obtained slopes (inhibitory time vs. benzenediol concentration) for pyrocatechol (estimated from the tabulated data) and resorcinol were 256 and 132 s mM−1, respectively. The slopes presented in this study are an order of magnitude higher for these two compounds. Furthermore, the concentration range used in Orban–Epstein reaction was approx. 2–7 mM, while the range employed with Bray–Liebhafsky reaction was less than 1 mM. According to the sensitivity (determined by the slope of inhibitory time vs. concentration dependence), the Bray–Liebhafsky reaction assumes the intermediate position in the following sequence: Briggs–Rauscher > Bray–Liebhafsky > Orban–Epstein. It should be stressed that in these three systems, higher sensitivity corresponds to a narrow and lower concentration range. However, it is complicated to compare the responses of chemical oscillatory systems due to their convoluted mechanisms and different phase spaces in which oscillatory dynamics occur.
Even though the sensitivity of τ5–6 and A6 to the presence of hydroquinone in the BL reaction was negligible, it displayed a unique feature that so far has not been reported in the other two reactions [63,64]. Namely, a new oscillation emerged immediately after the addition of hydroquinone, making it qualitatively easily distinguishable from the other two benzenediols. Moreover, the amplitude of this new oscillation, Ai, depends on the concentration of hydroquinone, thereby enabling the quantification of hydroquinone.
The different behavior of these three isomers in the BL system is a consequence of the differing reactivity with the numerous chemical species present in the BL, among which presumably are non-radical and radical intermediates. The measured signals shown in Figure 1, Figure 2, Figure 3 and Figure 4 are exceptionally complex since they arise from all of the oxidizing and reducing species present in the BL system and those produced in reactions between each benzenediol and the BL-generated species. For this reason, the reactivity of benzenediols was assessed using the Fenton reaction as an HO• chemical generator and the EPR spin trapping method. According to these measurements, resorcinol exhibits the highest HO• scavenging activity, while pyrocatechol shows the lowest reactivity towards HO• radicals in the Fenton reaction. In the interpretation of these results, one has to consider also the complexity of the Fenton reaction [65] as well as the specificities of the spin trapping method, such as the reactivity of the spin trap, stability of the spin adduct, and in general, the redox behavior of the spin trap/spin adduct.
Hence, the computational considerations of the thermodynamic and kinetic properties of benzenediol isomers in reactions with non-radical and radical intermediates were undertaken.
The thermodynamic properties of the three benzenediol isomers will be discussed first. In a previous publication, we determined the reactivity of pyrocatechol towards the investigated intermediates, HO•, HOO•, I•, IO•, IO2•, I2O, and HIO, by calculating the enthalpies of reactions (1)–(6) using the B3LYP-D3 and M06-2X methods as well as reaction energies using the coupled cluster CCSD and CCSD(T) methods [41]. All four theoretical models showed consistent trends, with the reactivity order being as follows: HO•≈ I2O >HIO2 > IO• >> HOO• ≥ IO2. In this paper, we considered the reaction Gibbs free energies to determine the reactivity of the three benzenediol isomers towards selected intermediates (Table 3). The order of reactivity is the same as previously observed when considering reaction energies, with the addition of a slightly exergonic reaction with I•. Thus, we also included the reaction with I• in further kinetic studies. In the case of all three conformers of resorcinol, reactions with HO•, HOO•, IO•, and I2O (reaction 3) were found to be thermodynamically favorable, with the reactivity order as follows: HO• >> IO•>I2O≈HOO•. The ΔGr values were comparable between the three resorcinol forms. Hydroquinone was reactive towards the same intermediates as pyrocatechol; however, the reactivity order is different: I2O>>HO• ≈ HIO2 > IO• ≈ HIO >> HOO• ≈ IO2• > I•. A comparison between the reaction energies for all intermediates in the case of pyrocatechol and hydroquinone indicated that pyrocatechol was more reactive towards radical intermediates, whereas hydroquinone was more reactive towards non-radical ones.
The subsequent kinetic study of thermodynamically favorable reactions revealed the following. For pyrocatechol, the reaction with the thermodynamically least favorable I• radical remained the least favorable, with a rate constant of 1.87 × 10⁵ M−1 s−1. The order of reactivity for pyrocatechol was as follows: HO• > IO• > HOO• > IO2• > I•. In the case of resorcinol, the IO2• radical was also included in the kinetic study due to the reaction being only slightly endergonic (~5 kJ mol−1). The order of reactivity for the syn-syn and anti-anti isomers was HO• > IO• > HOO• ≈ IO2•, while for the syn-anti isomer, the reaction with IO2• was approximately 4.5 times faster than the reaction with HOO•. Notably, the reaction of resorcinol with HO• was faster than that of pyrocatechol. The barrierless formation of paraquinone and H2O in the reaction of hydroquinone with the HO• radical demonstrated that this reaction was diffusion-controlled, with a corresponding reaction rate constant of 1.91 × 10⁹ M−1 s−1 (Figure 9). As with pyrocatechol, the thermodynamically least favorable intermediate, I•, was characterized by a very high activation energy (≈100 kJ mol−1) and very slow reaction rate constant in the case of both hydroquinone forms. The rate constants for trans-hydroquinone were higher than those for the cis form, making trans-hydroquinone the more reactive form. The order of reactivity for both forms was the same: HO• > IO• > HOO• > IO2• > I•. As with resorcinol, the reaction of hydroquinone with HO• was faster than that of pyrocatechol.
Lastly, we compared the results of DFT simulations and EPR experiments for the HO• radical. The EPR experiments showed the following order of reactivity: resorcinol > hydroquinone > pyrocatechol. Similarly, in the DFT study, pyrocatechol showed the weakest reactivity towards this radical. However, a small discrepancy was observed in the case of resorcinol and hydroquinone. The reaction of hydroquinone was barrierless and was assigned the rate constant of 1.91 × 10⁹ M−1 s−1. For resorcinol, the rate constants for the syn-syn, syn-anti, and anti-anti conformations were 3.33 × 10⁸, 3.73 × 10⁸, and 8.54 × 10⁸ M−1 s−1, respectively. Considering all three forms of resorcinol, both resorcinol and hydroquinone exhibited similar reactivity towards the HO• radical, with hydroquinone being slightly more reactive according to DFT calculations. As previously discussed, the discrepancy between the results obtained by EPR spectrometry and DFT kinetic calculations for hydroquinone and resorcinol may arise from the complexity of the Fenton reaction used herein to generate HO• radicals [65] as well as the redox behavior of spin trap or spin adduct.

5. Conclusions

All three benzenediol isomers (pyrocatechol, resorcinol, and hydroquinone) exhibit different behavior in the oscillatory Bray–Liebhafsky (BL) reaction. Based on the observed results, the BL reaction shows great potential to be applied as a chemosensor for these three compounds. The period between the fifth and sixth oscillation, amplitude of the sixth oscillation and in the case of hydroquinone, an emergence of a new oscillation in the BL reaction, are the selected parameters used for the identification and quantification of these benzenediol isomers. The obtained results in the oscillatory BL reaction were compared to the other two oscillatory reactions used to examine benezenediol isomers—Briggs–Rauscher and Orban–Epstein. According to the sensitivity, the Bray–Liebhafsky reaction assumes the intermediate position among these three reactions. However, the BL reaction is unique in its ability to clearly distinguish hydroquinone from the other two isomers. Furthermore, electron paramagnetic resonance spectroscopy and DFT calculations were performed in order to provide insights into the mechanism of benzenediol reactions with the BL system.

Supplementary Materials

The following supporting information can be downloaded at https://www.mdpi.com/article/10.3390/chemosensors12100211/s1, file name Supplementary Materials. Figure S1: Structures of pyrocatechol, resorcinol, and hydroquinone; Figure S2: Three different possible hydroxyl conformations of resorcinol with respect to the phenyl ring. Cis and trans forms of hydroquinone molecule; Figure S3: Optimized geometries of transition states for the HAT reaction pathways of pyrocatechol, resorcinol, and hydroquinone with the HOO• radical. All distances are reported in Å. Carbon atoms are depicted in gray, oxygen atoms in red, and hydrogen atoms in white color; Figure S4: Optimized geometries of transition states for the HAT reaction pathways of pyrocatechol and hydroquinone with the I• radical. All distances are reported in Å. Carbon atoms are depicted in gray, oxygen atoms in red, iodine atoms in violet, and hydrogen atoms in white color; Figure S5: Optimized geometries of transition states for the HAT reaction pathways of pyrocatechol, resorcinol, and hydroquinone with the IO• radical. All distances are reported in Å. Carbon atoms are depicted in gray, oxygen atoms in red, iodine atoms in violet, and hydrogen atoms in white color; Figure S6: Optimized geometries of transition states for the HAT reaction pathways of pyrocatechol, resorcinol, and hydroquinone with the IO2• radical. All distances are reported in Å. Carbon atoms are depicted in gray, oxygen atoms in red, iodine atoms in violet, and hydrogen atoms in white color.

Author Contributions

Conceptualization, M.P. and J.M.; methodology, M.P., J.M., J.T., U.B. and A.P.; investigation, M.V., M.P., J.M., J.T., U.B., U.Č. and A.P.; writing—original draft preparation, M.P., J.M., J.T. and A.P.; writing—review and editing, M.V., M.P., J.M., J.T., U.B., U.Č. and A.P.; visualization, M.V., J.M., M.P., J.T. and A.P. Funding support for chemicals and measurements M.P., support for journal publication M.P., J.M., J.T., U.B., U.Č. and A.P. All authors have read and agreed to the published version of the manuscript.

Funding

This research was supported by the Ministry of Science, Technological Development and Innovation of the Republic of Serbia (Grant numbers 451-03-65/2024-03/200146, 451-03-66/2024-03/200146, 451-03-66/2024-03/200161 and 451-03-66/2024-03/200026). In addition, financial support from the Slovenian Research and Innovation Agency (ARIS) program and project grants P2-0046, P1-0403, J1-2471, L2-3175, P2-0438, J1-4398, L2-4430, J3-4498, J7-4638, J1-4414, J3-4497, J4-4633, J1-50034, J7-50043, I0-E015, and Z4-2654 are gratefully acknowledged. M.P. acknowledges the financial support of the EU: the EIC Pathfinder Challenges 2022 call through the Research Grant 101115149 (project ARTEMIS). M.P. also acknowledges the support of the Office of Naval Research Global through the Research Grant N62902-22-1-2024.

Institutional Review Board Statement

Not applicable.

Informed Consent Statement

Not applicable.

Data Availability Statement

The original contributions presented in the study are included in the article/Supplementary Material, further inquiries can be directed to the corresponding authors.

Acknowledgments

The authors thank the HPC RIVR consortium (www.hpc-rivr.si) for facilitating this study by providing computing resources of the HPC systems VEGA and MAISTER at the University of Maribor (www.um.si).

Conflicts of Interest

The authors declare no conflicts of interest.

References

  1. Bray, W.C. A periodic reaction in homogeneous solution and its relation to catalysis. J. Am. Chem. Soc. 1921, 43, 1262–1267. [Google Scholar] [CrossRef]
  2. Bray, W.C.; Liebhafsky, H.A. Reactions involving hydrogen peroxide, iodine and iodate ion. i. introduction. J. Am. Chem. Soc. 1931, 53, 38–44. [Google Scholar] [CrossRef]
  3. Sharma, K.R.; Noyes, R.M. Oscillations in Chemical Systems. 13. A Detailed Molecular Mechanism for the Bray-Liebhafsky Reaction of Iodate and Hydrogen Peroxide. J. Am. Chem. Soc. 1976, 98, 4345–4361. [Google Scholar] [CrossRef]
  4. Kolar-Anić, L.; Schmitz, G. Mechanism of the Bray–Liebhafsky Reaction: Effect of the Oxidation of Iodous Acid by Hydrogen Peroxide. J. Chem. Soc. Faraday Trans. 1992, 88, 2343–2349. [Google Scholar] [CrossRef]
  5. Treindl, L.; Noyes, R.M. A New Explanation of the Oscillations in the Bray-Liebhafsky Reaction. J. Phys. Chem. 1993, 97, 11354–11362. [Google Scholar] [CrossRef]
  6. Kolar-Anić, L.; Misljenović, D.; Anić, S.; Nicolis, G. Influence of the Reduction of Iodate Ion by Hydrogen Peroxide on the Model of the Bray-Liebhafsky Reaction. React. Kinet. Catal. Lett. 1995, 54, 35–41. [Google Scholar] [CrossRef]
  7. Schmitz, G.; Noszticzius, Z.; Hollo, G.; Wittmann, M.; Furrow, S.D. Reactions of Iodate with Iodine in Concentrated Sulfuric Acid. Formation of I(+3) and I(+1) Compounds. Chem. Phys. Lett. 2018, 691, 44–50. [Google Scholar] [CrossRef]
  8. Noyes, R.M. Some Models of Chemical Oscillators. J. Chem. Educ. 1989, 66, 190. [Google Scholar] [CrossRef]
  9. Kéki, S.; Székely, G.; Beck, M.T. The Effect of Light on the Bray−Liebhafsky Reaction. J. Phys. Chem. A 2003, 107, 73–75. [Google Scholar] [CrossRef]
  10. Stanisavljev, D.R.; Milenković, M.C.; Popović-Bijelić, A.D.; Mojović, M.D. Radicals in the Bray–Liebhafsky Oscillatory Reaction. J. Phys. Chem. A 2013, 117, 3292–3295. [Google Scholar] [CrossRef]
  11. Pagnacco, M.C.; Mojović, M.D.; Popović-Bijelić, A.D.; Horváth, A.K. Investigation of the Halogenate–Hydrogen Peroxide Reactions Using the Electron Paramagnetic Resonance Spin Trapping Technique. J. Phys. Chem. A 2017, 121, 3207–3212. [Google Scholar] [CrossRef] [PubMed]
  12. Kolar-Anic, L.Z.; Misljenovic, D.M.; Stanisavljev, D.R.; Anic, S.R. Applicability of Schmitz’s Model to Dilution-Reinitiated Oscillations in the Bray-Liebhafsky Reaction. J. Phys. Chem. 1990, 94, 8144–8146. [Google Scholar] [CrossRef]
  13. Valent, I.; Ševčík, P. Simulations of the Iodine Interphase Transport Effect on the Oscillating Bray−Liebhafsky Reaction. J. Phys. Chem. A 1998, 102, 7576–7579. [Google Scholar] [CrossRef]
  14. Láňová, B.; Vřešt’ál, J. Study of the Bray−Liebhafsky Reaction by On-Line Mass Spectrometry. J. Phys. Chem. A 2002, 106, 1228–1232. [Google Scholar] [CrossRef]
  15. Schmitz, G.; Kolar-Anić, L.; Anić, S.; Grozdić, T.; Vukojević, V. Complex and Chaotic Oscillations in a Model for the Catalytic Hydrogen Peroxide Decomposition under Open Reactor Conditions. J. Phys. Chem. A 2006, 110, 10361–10368. [Google Scholar] [CrossRef]
  16. Ševčík, P.; Adamčíková, L. Effect of a Pressure Decrease and Stirring on the Oscillating Bray-Liebhafsky Reaction. Chem. Phys. Lett. 1997, 267, 307–312. [Google Scholar] [CrossRef]
  17. Ševčík, P. Effect of a Gas Bubbling and Stirring on the Oscillating Bray−Liebhafsky Reaction. J. Phys. Chem. A 1998, 102, 1288–1291. [Google Scholar] [CrossRef]
  18. Stanisavljev, D.R.; Djordjević, A.R.; Likar-Smiljanić, V.D. Investigation of Microwave Effects on the Oscillatory Bray–Liebhafsky Reaction. Chem. Phys. Lett. 2005, 412, 420–424. [Google Scholar] [CrossRef]
  19. Stanisavljev, D.R.; Djordjević, A.R.; Likar-Smiljanić, V.D. Microwaves and Coherence in the Bray–Liebhafsky Oscillatory Reaction. Chem. Phys. Lett. 2006, 423, 59–62. [Google Scholar] [CrossRef]
  20. Ševčík, P.; Kissimonová, K.; Adamčíková, L. Oxygen Production in the Oscillatory Bray−Liebhafsky Reaction. J. Phys. Chem. A 2000, 104, 3958–3963. [Google Scholar] [CrossRef]
  21. Kissimonová, K.; Valent, I.; Adamčíková, L.; Ševčík, P. Numerical Simulations of the Oxygen Production in the Oscillating Bray–Liebhafsky Reaction. Chem. Phys. Lett. 2001, 341, 345–350. [Google Scholar] [CrossRef]
  22. Pejić, N.; Kolar-Anić, L.; Maksimović, J.; Janković, M.; Vukojević, V.; Anić, S. Dynamic Transitions in the Bray–Liebhafsky Oscillating Reaction. Effect of Hydrogen Peroxide and Temperature on Bifurcation. React. Kinet. Mech. Cat. 2016, 118, 15–26. [Google Scholar] [CrossRef]
  23. Vukojević, V.; Anić, S.; Kolar-Anić, L. Investigation of Dynamic Behavior of the Bray−Liebhafsky Reaction in the CSTR. Determination of Bifurcation Points. J. Phys. Chem. A 2000, 104, 10731–10739. [Google Scholar] [CrossRef]
  24. Ren, J.; Gao, J.; Qu, J.; Wei, X.; Chen, X.; Yang, W. Nonlinear behavior in Bray-Libhafsky Chemical Reaction. J. Chil. Chem. Soc. 2008, 53, 1620–1623. [Google Scholar] [CrossRef]
  25. Negrojević, L.; Lončar, A.; Maksimović, J.; Anić, S.; Čupić, Ž.; Kolar-Anić, L.; Pejić, N. Bray–Liebhafsky Oscillatory Reaction in a Continuous-Flow Stirred Tank Reactor as the Matrix System for Determination of Tyrosine. Reac. Kinet. Mech. Cat. 2022, 135, 1147–1162. [Google Scholar] [CrossRef]
  26. Maksimović, J.; Čupić, Ž.; Manojlović, N.; Đerić, A.; Anić, S.; Kolar-Anić, L. Bray–Liebhafsky Oscillatory Reaction as the Matrix System for the Kinetic Determination of Microquantities of Alizarin and Purpurin. Reac. Kinet. Mech. Cat. 2020, 130, 655–668. [Google Scholar] [CrossRef]
  27. Pejić, N.; Kolar-Anić, L.; Anić, S.; Stanisavljev, D. Determination of Paracetamol in Pure and Pharmaceutical Dosage Forms by Pulse Perturbation Technique. J. Pharm. Biomed. Anal. 2006, 41, 610–615. [Google Scholar] [CrossRef]
  28. Pejić, N.D.; Blagojević, S.M.; Anić, S.R.; Vukojević, V.B.; Mijatović, M.D.; Ćirić, J.S.; Marković, Z.S.; Marković, S.D.; Kolar-Anić, L.Z. Kinetic Determination of Morphine by Means of Bray–Liebhafsky Oscillatory Reaction System Using Analyte Pulse Perturbation Technique. Anal. Chim. Acta 2007, 582, 367–374. [Google Scholar] [CrossRef]
  29. Pejic, N.; Blagojevic, S.; Vukelic, J.; Kolar-Anic, L.; Anic, S. Analyte Pulse Perturbation Technique for the Determination of 6-O-Acetylmorphine in Seized Street Drug Samples. BCSJ 2007, 80, 1942–1948. [Google Scholar] [CrossRef]
  30. Pejić, N.; Blagojević, S.; Anić, S.; Kolar-Anić, L. Determination of Ascorbic Acid in Pharmaceutical Dosage Forms and Urine by Means of an Oscillatory Reaction System Using the Pulse Perturbation Technique. Anal. Bioanal. Chem. 2007, 389, 2009–2017. [Google Scholar] [CrossRef]
  31. Maksimović, J.P.; Kolar-Anić, L.Z.; Anić, S.R.; Ribić, D.D.; Pejić, N.D. Quantitative Determination of Some Water-Soluble B Vitamins by Kinetic Analytical Method Based on the Perturbation of an Oscillatory Reaction. J. Braz. Chem. Soc. 2011, 22, 38–48. [Google Scholar] [CrossRef]
  32. Sr, R.J.L. Sax’s Dangerous Properties of Industrial Materials, 11th ed.; Wiley-Interscience: Hoboken, NJ, USA, 2004; ISBN 978-0-471-47662-7. [Google Scholar]
  33. Krumenacker, L.; Costantini, M.; Pontal, P.; Sentenac, J. Hydroquinone, Resorcinol, and Catechol. In Kirk-Othmer Encyclopedia of Chemical Technology; John Wiley & Sons, Ltd.: Hoboken, NJ, USA, 2000; ISBN 978-0-471-23896-6. [Google Scholar]
  34. Körbahti, B.K.; Tanyolaç, A. Continuous Electrochemical Treatment of Phenolic Wastewater in a Tubular Reactor. Water Res. 2003, 37, 1505–1514. [Google Scholar] [CrossRef] [PubMed]
  35. Kumar, A.; Kumar, S.; Kumar, S. Adsorption of Resorcinol and Catechol on Granular Activated Carbon: Equilibrium and Kinetics. Carbon 2003, 41, 3015–3025. [Google Scholar] [CrossRef]
  36. Schweigert, N.; Zehnder, A.J.B.; Eggen, R.I.L. Chemical Properties of Catechols and Their Molecular Modes of Toxic Action in Cells, from Microorganisms to Mammals. Environ. Microbiol. 2001, 3, 81–91. [Google Scholar] [CrossRef]
  37. Dellinger, B.; Pryor, W.A.; Cueto, R.; Squadrito, G.L.; Hegde, V.; Deutsch, W.A. Role of Free Radicals in the Toxicity of Airborne Fine Particulate Matter. Chem. Res. Toxicol. 2001, 14, 1371–1377. [Google Scholar] [CrossRef] [PubMed]
  38. Budavari, S. The Merck Index: An Encyclopedia of Chemicals, Drugs, and Biologicals, 11th ed.; Centennial ed.; Merck: Rahway, NJ, USA, 1989; ISBN 978-0-911910-28-5. [Google Scholar]
  39. Milligan, P.W.; Häggblom, M.M. Biodegradation of Resorcinol and Catechol by Denitrifying Enrichment Cultures. Environ. Toxicol. Chem. 1998, 17, 1456–1461. [Google Scholar] [CrossRef]
  40. Hays, M.D.; Fine, P.M.; Geron, C.D.; Kleeman, M.J.; Gullett, B.K. Open Burning of Agricultural Biomass: Physical and Chemical Properties of Particle-Phase Emissions. Atmos. Environ. 2005, 39, 6747–6764. [Google Scholar] [CrossRef]
  41. Maksimović, J.P.; Tošović, J.; Pagnacco, M.C. Insight into the Origin of Pyrocatechol Inhibition on Oscillating Bray-Liebhafsky Reaction: Combined Experimental and Theoretical Study. BCSJ 2020, 93, 676–684. [Google Scholar] [CrossRef]
  42. Jackson, S.K.; Liu, K.J.; Liu, M.; Timmins, G.S. Detection and Removal of Contaminating Hydroxylamines from the Spin Trap DEPMPO, and Re-Evaluation of Its Use to Indicate Nitrone Radical Cation Formation and SN1 Reactions. Free Radic. Biol. Med. 2002, 32, 228–232. [Google Scholar] [CrossRef]
  43. Grimme, S.; Antony, J.; Ehrlich, S.; Krieg, H. A Consistent and Accurate Ab Initio Parametrization of Density Functional Dispersion Correction (DFT-D) for the 94 Elements H-Pu. J. Chem. Phys. 2010, 132, 154104. [Google Scholar] [CrossRef]
  44. Frisch, M.J.; Trucks, G.W.; Schlegel, H.B.; Scuseria, G.E.; Robb, M.A.; Cheeseman, J.R.; Scalmani, G.; Barone, V.; Mennucci, B.; Petersson, G.A. Gaussian 09, Revision D.01; Gaussian Inc.: Wallingford, CT, USA, 2013. [Google Scholar]
  45. Peterson, K.A.; Figgen, D.; Goll, E.; Stoll, H.; Dolg, M. Systematically Convergent Basis Sets with Relativistic Pseudopotentials. II. Small-Core Pseudopotentials and Correlation Consistent Basis Sets for the Post-d Group 16–18 Elements. J. Chem. Phys. 2003, 119, 11113–11123. [Google Scholar] [CrossRef]
  46. Marenich, A.V.; Cramer, C.J.; Truhlar, D.G. Universal Solvation Model Based on Solute Electron Density and on a Continuum Model of the Solvent Defined by the Bulk Dielectric Constant and Atomic Surface Tensions. J. Phys. Chem. B 2009, 113, 6378–6396. [Google Scholar] [CrossRef] [PubMed]
  47. Eckart, C. The Penetration of a Potential Barrier by Electrons. Phys. Rev. 1930, 35, 1303–1309. [Google Scholar] [CrossRef]
  48. Duncan, W.T.; Bell, R.L.; Truong, T.N. TheRate: Program for Ab Initio Direct Dynamics Calculations of Thermal and Vibrational-State-Selected Rate Constants. J. Comput. Chem. 1998, 19, 1039–1052. [Google Scholar] [CrossRef]
  49. Tošović, J.; Marković, S.; Dimitrić Marković, J.M.; Mojović, M.; Milenković, D. Antioxidative Mechanisms in Chlorogenic Acid. Food Chem. 2017, 237, 390–398. [Google Scholar] [CrossRef]
  50. Tošović, J.; Marković, S. Antioxidative Activity of Chlorogenic Acid Relative to Trolox in Aqueous Solution—DFT Study. Food Chem. 2019, 278, 469–475. [Google Scholar] [CrossRef]
  51. Tošović, J.; Bren, U. Antioxidative Action of Ellagic Acid—A Kinetic DFT Study. Antioxidants 2020, 9, 587. [Google Scholar] [CrossRef] [PubMed]
  52. Shrivastava, A.; Gupta, V. Methods for the Determination of Limit of Detection and Limit of Quantitation of the Analytical Methods. Chron. Young Sci. 2011, 2, 21. [Google Scholar] [CrossRef]
  53. Furrow, S.D.; Schmitz, G.E. I2O in Solution and Volatility. Chem. Phys. Lett. 2019, 730, 186–190. [Google Scholar] [CrossRef]
  54. Schwartz, N.A.; Boaz, N.C.; Kalman, S.E.; Zhuang, T.; Goldberg, J.M.; Fu, R.; Nielsen, R.J.; Goddard, W.A.I.; Groves, J.T.; Gunnoe, T.B. Mechanism of Hydrocarbon Functionalization by an Iodate/Chloride System: The Role of Ester Protection. ACS Catal. 2018, 8, 3138–3149. [Google Scholar] [CrossRef]
  55. Zagrean-Tuza, C.; Dorneanu, S.; Mot, A.C. The Strange Case of Polyphenols Inhibiting the Briggs-Rauscher Reaction: pH-Modulated Reactivity of the Superoxide Radical. Free Radic. Biol. Med. 2020, 146, 189–197. [Google Scholar] [CrossRef] [PubMed]
  56. Cervellati, R.; Furrow, S.D. Effects of Additives on the Oscillations of the Briggs-Rauscher Reaction. Russ. J. Phys. Chem. 2013, 87, 2121–2126. [Google Scholar] [CrossRef]
  57. Uddin, W.; Hu, G.; Hu, L.; Hu, Y.; Fang, Z.; Ullah, R.; Sun, X.; Zhang, Y.; Song, J. Identification of Two Aromatic Isomers between 2- and 3-Hydroxy Benzoic Acid by Using a Briggs-Rauscher Oscillator. J. Electroanal. Chem. 2017, 803, 135–140. [Google Scholar] [CrossRef]
  58. Chen, J.; Hu, L.; Hu, G.; Zhang, Y.; Hu, Y.; Song, J. An Application of Chemical Oscillation: Distinguishing Two Isomers between Cyclohexane-1,3-Dione and 1,4-Cyclohexanedione. Electrochim. Acta 2016, 195, 223–229. [Google Scholar] [CrossRef]
  59. Zhang, Y.; Hu, G.; Hu, L.; Song, J. Identification of Two Aliphatic Position Isomers between α- and β-Ketoglutaric Acid by Using a Briggs–Rauscher Oscillating System. Anal. Chem. 2015, 87, 10040–10046. [Google Scholar] [CrossRef]
  60. Zhang, W.; Uddin, W.; Hu, G.; Hu, L.; Fang, Z. Identification of Four Isomers of Dihydroxynaphthalene by Using a Briggs-Rauscher Oscillating System. J. Electroanal. Chem. 2018, 823, 378–387. [Google Scholar] [CrossRef]
  61. Uddin, W.; Hu, G.; Hu, L.; Hu, Y.; Fang, Z.; Ullah, S.; Sun, X.; Shen, X.; Song, J. Identification of Two Positional Isomers between Ortho-Vanillin and Para-Vanillin by Their Inhibitory Effects on a Briggs-Rauscher Oscillator. Int. J. Electrochem. Sci. 2017, 12, 4193–4203. [Google Scholar] [CrossRef]
  62. Nawabi, M.Y.; Uddin, W.; Hu, G. Identification of the Three Isomers of Monochlorophenol: Application of Briggs-Rauscher Oscillation. Int. J. Electrochem. Sci. 2022, 17, 220425. [Google Scholar] [CrossRef]
  63. Cervellati, R.; Höner, K.; Furrow, S.D.; Neddens, C.; Costa, S. The Briggs-Rauscher Reaction as a Test to Measure the Activity of Antioxidants. Helv. Chim. Acta 2001, 84, 3533–3547. [Google Scholar] [CrossRef]
  64. Cervellati, R.; Greco, E.; Blagojević, S.M.; Blagojević, S.N.; Anić, S.; Čupić, Ž.D. Experimental and Mechanistic Study of the Inhibitory Effects by Phenolics on the Oscillations of the Orbàn–Epstein Reaction. Reac. Kinet. Mech. Cat. 2018, 123, 125–139. [Google Scholar] [CrossRef]
  65. Xiao, J.; Guo, S.; Wang, D.; An, Q. Fenton-Like Reaction: Recent Advances and New Trends. Chem. A Eur. J. 2024, 30, e202304337. [Google Scholar] [CrossRef] [PubMed]
Figure 1. Dependence of Pt electrode potential on time (oscillogram) of the Bray–Liebhafsky reaction without any analyte added. Concentrations of the reactants were [KIO3]o = 0.1636 M, [H2SO4]o = 0.1091 M, and [H2O2]o = 3.83 M. The reaction was carried out at 62 °C under constant stirring at 900 rpm. Oscillogram properties marked represent induction period (τind), periods between consecutive oscillations (τ1–2, τ2–3, τ3–4, …, τ9–10), duration of oscillogram defined as the end of 10th oscillation (τend), and amplitude of 6th oscillation (A6).
Chemosensors 12 00211 g001
Figure 2. Oscillograms obtained for BL reaction upon addition of different concentrations of pyrocatechol after the completion of the fifth oscillation. Concentrations of pyrocatechol in BL system were as follows: (a) 0 µM; (b) 320 µM; (c) 400 µM; (d) 520 µM; (e) 640 µM and (f) 960 µM. Concentrations of other reactants were [KIO3]o = 0.1636 M, [H2SO4]o = 0.1091 M, and [H2O2]o = 3.83 M. The reaction was carried out at 62 °C under constant stirring at 900 rpm.
Chemosensors 12 00211 g002
Figure 3. Oscillograms obtained for BL reaction upon addition of different concentrations of resorcinol after the completion of the fifth oscillation. Concentrations of resorcinol in BL system were as follows: (a) 0 µM; (b) 63.6 µM; (c) 191 µM; (d) 318 µM; (e) 446 µM and (f) 637 µM. Concentrations of other reactants were [KIO3]o = 0.1636 M, [H2SO4]o = 0.1091 M, and [H2O2]o = 3.83 M. The reaction was carried out at 62 °C under constant stirring at 900 rpm.
Chemosensors 12 00211 g003
Figure 4. Oscillograms obtained for BL reaction upon addition of different concentrations of hydroquinone after the completion of the fifth oscillation. Concentrations of hydroquinone in BL system were as follows: (a) 0 µM; (b) 400 µM; (c) 640 µM; (d) 960 µM; (e) 1200 µM and (f) 2000 µM. Concentrations of other reactants were [KIO3]o = 0.1636 M, [H2SO4]o = 0.1091 M, and [H2O2]o = 3.83 M. The reaction was carried out at 62 °C under constant stirring at 900 rpm.
Chemosensors 12 00211 g004
Figure 5. Dependence of the period between fifth and sixth oscillation, τ5–6, on the concentration of the analytes in the BL system: (a) pyrocatechol; (b) resorcinol; (c) hydroquinone.
Chemosensors 12 00211 g005
Figure 6. Dependence of the sixth oscillation amplitude, A6, on the concentration of the analytes in the BL system: (a) pyrocatechol; (b) resorcinol; (c) hydroquinone.
Chemosensors 12 00211 g006
Figure 7. Dependence of the induced oscillation amplitude, Ai, on the solution concentration of hydroquinone in BL system.
Chemosensors 12 00211 g007
Figure 8. (a) EPR spectra of DEPMPO/•OH spin adduct in the absence (top spectrum) and presence of the three benzenediol isomers at 5 mM concentration. (b) Decrease of DEPMPO/•OH spin adduct signal in the presence of the three benzenediol isomers at three different concentrations (5, 50, and 450 mM). The amplitude of the second peak (marked with * in panel (a)) was used for the calculation of signal loss.
Chemosensors 12 00211 g008
Figure 9. Optimized geometries of transition states for the HAT reaction pathways of pyrocatechol and resorcinol with the HO• radical (top). Dependence of total energy on the HO-H distance for the HAT pathway of hydroquinone with the HO• radical (bottom). All distances are reported in Å. Carbon atoms are depicted in gray, oxygen atoms in red, and hydrogen atoms in white color.
Chemosensors 12 00211 g009
Table 1. Mean values of induction period (τind), oscillogram duration (τend), period between fifth and sixth oscillation (τ5–6), and amplitude of sixth oscillation (A6) obtained for Bray–Liebhafsky reaction without benzenediol isomers.
τind (s)τend (s)τ5–6 (s)A6 (mV)
Mean value of BL reaction parameter820 ± 402200 ± 400 140 ± 3051 ± 9
Table 2. LOD and LOQ calculated for all three benzenediol isomers based on the dependence of τ5-6 vs. concentration.
Benzenediol IsomerLOD (mM)LOQ (mM)
Pyrocatechol0.160.49
Resorcinol0.140.41
Hydroquinone1.64.8
Table 3. Gibbs energies ΔGr (kJ mol−1) of the reactions (1)–(6).
CompoundsHO•
(1)
HOO•
(1)
I•
(1)
IO•
(1)
IO2•
(1)
I2O
(2)
I2O
(3)
HIO
(4)
HIO2
(5)
HIO2
(6)
Cat−174.7−35.6−4.5−75.5−17.7−35.9−181.3−36.8−144.260.9
syn-syn Res−151.2−12.119.0−52.05.8113.2−32.2112.34.9210.0
syn-anti Res−151.5−12.418.7−52.35.5112.8−32.5111.94.5209.7
anti-anti Res−152.1−13.018.1−52.95.0113.3−32.0112.45.1210.2
cis-Hq−172.7−33.6−2.5−73.5−15.6−56.0−201.3−56.9−164.340.8
trans-Hq−173.4−34.3−3.1−74.2−16.3−56.7−202.0−57.6−165.040.2
Table 4. Activation energies ( Δ G a ) (kJ mol−1) and rate constants (kZCT_0) (M−1 s−1) for exergonic free radical reaction pathways.
Free RadicalsHO•HOO•I•IO•IO2
Pyrocatechol
Δ G a 16.349.653.6319.044.2
kZCT_05.52 × 1073.93 × 1061.87 × 1053.89 × 1071.70 × 106
syn-syn Resorcinol
Δ G a 25.468.0/25.255.7
kZCT_03.33 × 1081.55 × 105/1.65 × 1071.38 × 105
syn-anti Resorcinol
Δ G a 25.863.1/20.853.7
kZCT_03.73 × 1081.06 × 105/2.32 × 1074.99 × 105
anti-anti Resorcinol
Δ G a 23.263.2/22.757.5
kZCT_08.54 × 1080.80 × 105/1.69 × 1070.75 × 105
cis-Hydroquinone
Δ G a ≈0.049.497.9122.339.2
kZCT_0≈1.9 × 1094.16 × 1061.04 × 10−22.49 × 1073.25 × 106
trans-Hydroquinone
Δ G a ≈0.049.3100.1221.138.7
kZCT_0≈1.9 × 1095.46 × 1065.92 × 10−33.13 × 1073.57 × 106
Disclaimer/Publisher’s Note: The statements, opinions and data contained in all publications are solely those of the individual author(s) and contributor(s) and not of MDPI and/or the editor(s). MDPI and/or the editor(s) disclaim responsibility for any injury to people or property resulting from any ideas, methods, instructions or products referred to in the content.