Article

Analytical Tool for Quality Control of Irrigation Waters via a Potentiometric Electronic Tongue

by
Marina Miras
1,
María Cuartero
2,3,*,
María Soledad García
1,
Alberto Ruiz
4 and
Joaquín Ángel Ortuño
1,*
1
Department of Analytical Chemistry, University of Murcia, 30100 Murcia, Spain
2
Department of Chemistry, School of Engineering Science in Chemistry, Biochemistry and Health, KTH Royal Institute of Technology, Teknikringen 30, SE-100 44 Stockholm, Sweden
3
UCAM-SENS, Universidad Católica San Antonio de Murcia, UCAM HiTech, Avda. Andres Hernandez Ros 1, 30107 Murcia, Spain
4
Department of Informatics and Systems, University of Murcia, 30100 Murcia, Spain
*
Authors to whom correspondence should be addressed.
Chemosensors 2023, 11(7), 407; https://doi.org/10.3390/chemosensors11070407
Submission received: 7 June 2023 / Revised: 10 July 2023 / Accepted: 14 July 2023 / Published: 20 July 2023
(This article belongs to the Special Issue Recent Advances in Electrode Materials for Electrochemical Sensing)

Abstract

:
A potentiometric electronic tongue (ET) for the analysis of well and ditch irrigation water samples is herein proposed. The sensors’ array is composed of six ion-selective electrodes based on plasticized polymeric membranes with low selectivity profiles, i.e., the membranes do not contain any selective receptor. The sensors differ between them in the type of ion-exchanger (sensors for cations or anions) and the plasticizer used in the membrane composition, while the polymeric matrix and the preparation protocol were maintained. The potentiometric response of each sensor towards the main cations (Na+, K+, Ca2+, Mg2+) and anions (HCO3, Cl, SO42−, NO3) expected in irrigation water samples was characterized, revealing a fast response time (<50 s). A total of 19 samples were analyzed with the sensor array at optimized experimental conditions, but, also, a series of complementary analytical techniques were applied to obtain the exact ion composition and conductivity to develop a trustable ET. The principal component analysis of the final potential values of the dynamic response observed with each sensor in the array allows for the differentiation between most of the samples in terms of quality. Furthermore, the ET was treated with a linear multivariate regression method for the quantitative determination of the mentioned ions in the irrigation water samples, revealing rather good prediction of Mg2+, Na+, and Cl concentrations and acceptable results for the rest of ions. Overall, the ET is a promising analytical tool for irrigation water quality, exceeding traditional characterization approaches (conductivity, salinity, pH, cations, anions, etc.) in terms of overhead costs, versatility, simplicity, and total time for data provision.

1. Introduction

Owing to successful innovations within the plant science field, agriculture has progressed tremendously over the past century, becoming more and more efficient over time. Agriculture is not only a key player in the economy of most countries in the world, but there is also a crucial relationship between agriculture and human health through food safety and nutrition [1]. Today, a strong synergy exists between different societal, industrial, and technological sectors that work together to pursue better agriculture and health outcomes. The term “smart agriculture” was born in such a context, encompassing the usage of certain tools, such as Internet of Things, sensors, location systems, robots, and artificial intelligence, in every single step of agriculture-related events [2]. The ultimate goal is related to increasing quality and quantity of the crops, attending to global demands and strategies.
Recently, special attention has been devoted to the quality of the irrigation waters used to grow the crops: a prior idea of the quality of the water seems to maximize both performance and sustainability perspective in the entire agricultural chain [3,4,5]. It should be noted that the overall quality of irrigation water is not only connected to the total salt content but also with the type of salt, meaning that knowing the concentration of each ion present in the water will benefit the matter [6,7,8]. Moreover, previous results in the literature have pointed out a relationship between water quality and its geographical location, considering the surrounding human, industrial, and/or other agricultural activities that may affect the source. Some specific examples considered the entry of effluents from industrial, domestic, agricultural, and saline filtrations as part of the interpretation of chemometrics analyses [9,10].
The work carried out around the fitness of irrigation waters is today really large and varying, as evidenced in the literature [11], while recommendations established by the Food and Agriculture Organization of the United Nations (FAO) in 1985 are still commonly followed [12]. Those recommendations consider the levels of the most important parameters (salinity expressed as electrical conductivity and total dissolved solids) together with pH and the concentrations of the primary cations (Na+, K+, Ca2+, Mg2+) and anions (HCO3, Cl, SO42−, NO3). Given that most of the quality indicators are of ionic nature, it seems logical to realize an analytical tool for irrigation water characterization based on potentiometry, which is the technique used per excellence in newly developed on-site water analysis approaches [13]. Moreover, in certain geographical areas and in relation to the type of crop, it is a common practice to use water from wells and ditches for irrigation. For example, in the Region of Murcia (Spain), an organization called “The Segura Hydrographic Confederation” exists that controls this issue under a favorable environmental declaration and surveillance plans [14]. Effectively, the analytical assessment of any irrigation water is crucial, especially when it originates in dynamic sources and, thus, with variable composition. In such a scenario, it would be convenient to provide an analytical control system with enough versatility and data acquisition frequency, enabling adequate monitoring of the water quality before it is utilized.
Sghaier et al. proposed an electronic tongue (ET) composed of nine potentiometric electrodes, which was applied for the characterization of groundwater samples mainly intended for irrigation and domestic use in a specific region in Tunisia [15]. The potentiometric sensors were ion-selective electrodes for K+, Ca2+, Na+, NH4+, Cd2+, Cl, F, and NO3, with a common Ag/AgCl reference electrode. The data were investigated by the Principal Component Analysis (PCA) and Cluster Analysis (CA), and it was found that it was possible to classify 17 samples according to their well origin. At the time of writing, we were not able to find any other ET applied to the qualitative or quantitative analysis of irrigation water samples, excluding nutrient solutions commonly used in hydroponic crops.
In view of the lack of reports about ETs dedicated to the analysis of irrigation waters and given the well-known advantages of the use of ETs in water analysis, we herein present a potentiometric electronic tongue ET for the analysis of well and ditch irrigation water samples. The sensors’ array is composed of six ion-selective electrodes (ISEs) based on plasticized polymeric membranes with low selectivity profiles, i.e., the membranes are prepared without any selective receptor. A total of 19 samples were analyzed with the sensors’ array to perform the training and usage of the ET. In addition, a series of complementary analytical techniques were applied to obtain the exact ion composition and conductivity. It is here demonstrated that the principal component analysis (PCA) of the final potential values of the dynamic response observed with each ISE in the array allows for the differentiation between most of the samples. Furthermore, the data were treated with a lineal multivariate regression method for the quantitative determination of the main ions present in the irrigation water samples, revealing an acceptable quantitative prediction for some of them.

2. Materials and Methods

2.1. Reagents and Samples

Poly(vinyl chloride) (PVC) of high molecular weight, 2-nitrophenyl octyl ether (NPOE), bis(2-ethylhexyl) sebacate (DOS), potassium tetrakis(4-chlorophenyl)borate (KTClPB), tridodecylmethylammonium chloride (TDMACl), tetrahydrofuran (THF), and tricresylphosphate (TCP) were purchased from Sigma Aldrich (Taufkirchen, Germany). Analytical reagent grade salt potassium chloride (KCl), sodium chloride (NaCl), potassium nitrate (KNO3), sodium sulfate (Na2SO4), sodium hydrogen carbonate (NaHCO3), magnesium chloride (MgCl2), calcium chloride dihydrate (CaCl2·2H2O), and hydrochloric acid (HCl) were obtained in Alpha Aesar (Kandel, Germany). All solutions were prepared in 18.2 MΩ cm−1 doubly deionized water (Milli-Q water systems, Merck Millipore, Germany).
The irrigation water samples belonged to wells and irrigation ditches from different geographical areas in the Region of Murcia and Granada (Spain): samples 1–8 from Murcia South-West; samples 9 and 10 from Murcia Middle South; samples 11–16 from Murcia South-East; samples 17 and 18 from Murcia Middle East; and sample 19 from Granada. Notably, the specific location of wells and ditches are not provided due to confidentiality reasons. Before being analyzed by the ET, some quality parameters of the samples (conductivity, concentration of cations and anions) were analyzed, and the results are presented in Table 1. As observed, the variability of ion concentrations was found to be very high, which is convenient for adequately building up the ET from both qualitative and quantitative perspectives.
All the samples were stored in the refrigerator (4 °C), and they were analyzed with the ET only a few weeks (no more than 3 weeks) after collection.

2.2. Instruments

Electrode potentials were recorded against an Orion 90–02 double junction silver-silver chloride reference electrode using a multichannel potentiometer that was a home-made high-impedance data acquisition 16-channel box connected to a personal computer by USB. The outer compartment of the reference electrode was filled with 1.0 × 10⁻³ M KCl solution. The potential readouts (at zero current conditions) were acquired at 1 s frequency.
Conductivity measurements of the irrigation water samples were performed with a CM 35+ instrument equipped with a 5060 (Crison, Barcelona, Spain) conductivity cell. The determination of the concentration of chloride, sulfate, and nitrate ions in the irrigation water samples was accomplished by ion chromatography (IC) with an ICS-2100 Dionex (Thermo Fischer, Spain) instrument. The detection of bicarbonate was carried out by traditional potentiometric titration with hydrochloric acid. Sodium, calcium, and magnesium ions were analyzed by inductively coupled plasma (ICP) with an ICP—OES Agilent 5110 instrument (Madrid, Spain).

2.3. Preparation of the Ion-Selective Electrodes

Six membranes of different compositions were prepared by using several plasticizers (NPOE, TCP, or DOS) and ion-exchangers (cation-exchanger KTClPB or anion–exchanger TDMACl). The membranes were prepared by dissolving approx. 100 mg of PVC, 200 mg of the corresponding plasticizer, and 1.5 mg of the ion-exchanger in 3 mL of THF. The exact composition of each membrane is presented in Table 2. Each solution was poured into a Fluka glass ring (inner diameter 28 mm, height 30 mm) placed on a Fluka glass plate and allowed to settle overnight until total evaporation of THF had occurred, thus obtaining the corresponding plasticized PVC membrane [16]. A 6 mm diameter piece was cut out with a punch (Fluka, Barcelona, Spain) and incorporated into an ISE electrode body (Fluka) containing 1.0 × 10⁻³ M KCl as the internal filling solution. The electrodes were conditioned in deionized water until they reached a constant potential baseline (±0.5 mV/min). Normally, overnight conditioning ensures such a response. When not in use, the electrodes were also kept in water.

2.4. Procedure for the Analysis of the Samples

The six-electrode array and the reference electrode were immersed in 100 mL of 1 × 10⁻⁵ M KCl solution with constant stirring (500 rpm), and the recording of the dynamic potential was started. After 50 s, a volume of 5 mL of the corresponding irrigation water sample was injected to the KCl solution, with the dynamic potential being recorded for another 50 s. The potentials of each of the six electrodes provided after the 100-s recording were considered for the data processing in the ET. Notably, before measuring the next sample, the electrodes were gently rinsed with water and dried. Each irrigation water sample was analyzed in triplicate. The potential signals were processed using the standard data analysis tools (NumPy, scikit-learn, pandas, matplotlib and statsmodels) of the Python language for PCA and linear regression.

3. Results

3.1. Potentiometric Response of Each Electrode in the Electronic Tongue towards the Major Ions Present in Irrigation Water Samples

First, the potentiometric response in the water background of each electrode in the array conforming to the ET was obtained at increasing concentrations of the major ions (in the form of salts) present in the irrigation waters: Na+, K+, Ca2+, Mg2+, Cl, NO3, HCO3, and SO42−.
Figure 1 depicts the dynamic responses observed for NaCl, KCl, CaCl2, MgCl2, HCl, KNO3, Na2SO4, and NaHCO3. As a general trend, a rapid response (i.e., potential change and stabilization to a steady-state value upon increasing the concentration of the salt in the solution) was detected for all of the ISEs, with an average response time of t95 = 5 s. Then, the potential was found to increase for the electrodes based on the cation exchanger KTClPB, decreasing for the electrodes based on the anion exchanger TDMACl.
In essence, the cation-selective electrodes 1, 3, and 5 responded to the cationic part of the salts and the potential differences between the two last concentrations tested in each experiment are provided in Table 3 as the slope of each ISE. The anion-selective electrodes 2, 4, and 6 responded to the anionic part of the salts and the potential differences between the two last concentrations assayed in each experiment are also provided in Table 3 as the slope of each ISE.
Of note is the morphology found for some of the transient signals: nonmonotonic behavior in the form of an initial overpotential in the positive or negative direction (depending on if the ISE presents cationic or anionic response, respectively) followed by a slow relaxation period towards the attainment of the steady-state potential. Interestingly, other papers reporting dynamic signals of ISEs prepared without any ionophore in the membrane, such as those used in the present paper, showed similar kinds of non-monotonic signals [17,18].
Theoretical interpretation of this behavior is indeed difficult, but it can likely be ascribed to the exposure of each ISE to various ions (of different lipophilicity) in a random sequence. The phase-boundary potential model (PBM) has proved to be very useful for the description of the potential-time signal of ISEs [19]. More specifically, the application of finite differences to the resolution of the pertinent equations in the PBM allows for the transient response to be simulated without significant computational complication [20,21,22,23]. Increasing the complexity of the approach, Hambly et al. pertinently considered the kinetics of the interfacial ion-exchange in the membrane [24]. Then, the model proposed by Lewenstam et al. is the most complete one, albeit limited by the requirement of previous knowledge of a series of parameters that may not be easily obtained (tabulated or empirical) [25,26].
Regarding the slopes for the cation-selective electrodes (Table 3), ISE 3 and ISE 5 with DOS and TCP as plasticizer, respectively, higher slopes than those for ISE1 prepared with NPOE were presented. Then, considering that Cl and NO3 as the anion in the salt did not present any significant effect on the slope, ISE 1 displayed sub-Nernstian slopes for Na+, K+, and Ca2+, and almost no response for Mg2+. ISE 3 presented close to Nernstian slopes for Na+ and K+ (monovalent cations) and hyper-Nernstian slopes for Ca2+ and Mg2+. ISE 5 showed close to Nernstian slopes for Na+, K+, Ca2+, and Mg2+. For H+, ISE 1 presented a close to a Nernstian slope, while ISE 3 and ISE 5 displayed hyper-Nernstian values. For the Na+ in the form of NaHCO3, the results showed a close to a Nernstian slope for ISE 1 and hyper-Nernstian slopes for ISE 3 and ISE 5. In the case of the slopes observed for the anion-selective electrodes (Table 3), close to Nernstian values were displayed by the three electrodes for NO3, while sub-Nernstian levels were found for Cl (following the order of ISE 2 < ISE 4 < ISE 6, so NPOE < DOS < TCP). HCO3 displayed a Nernstian slope with ISE2 and a sub-Nernstian slope with ISE 4 and ISE 6.
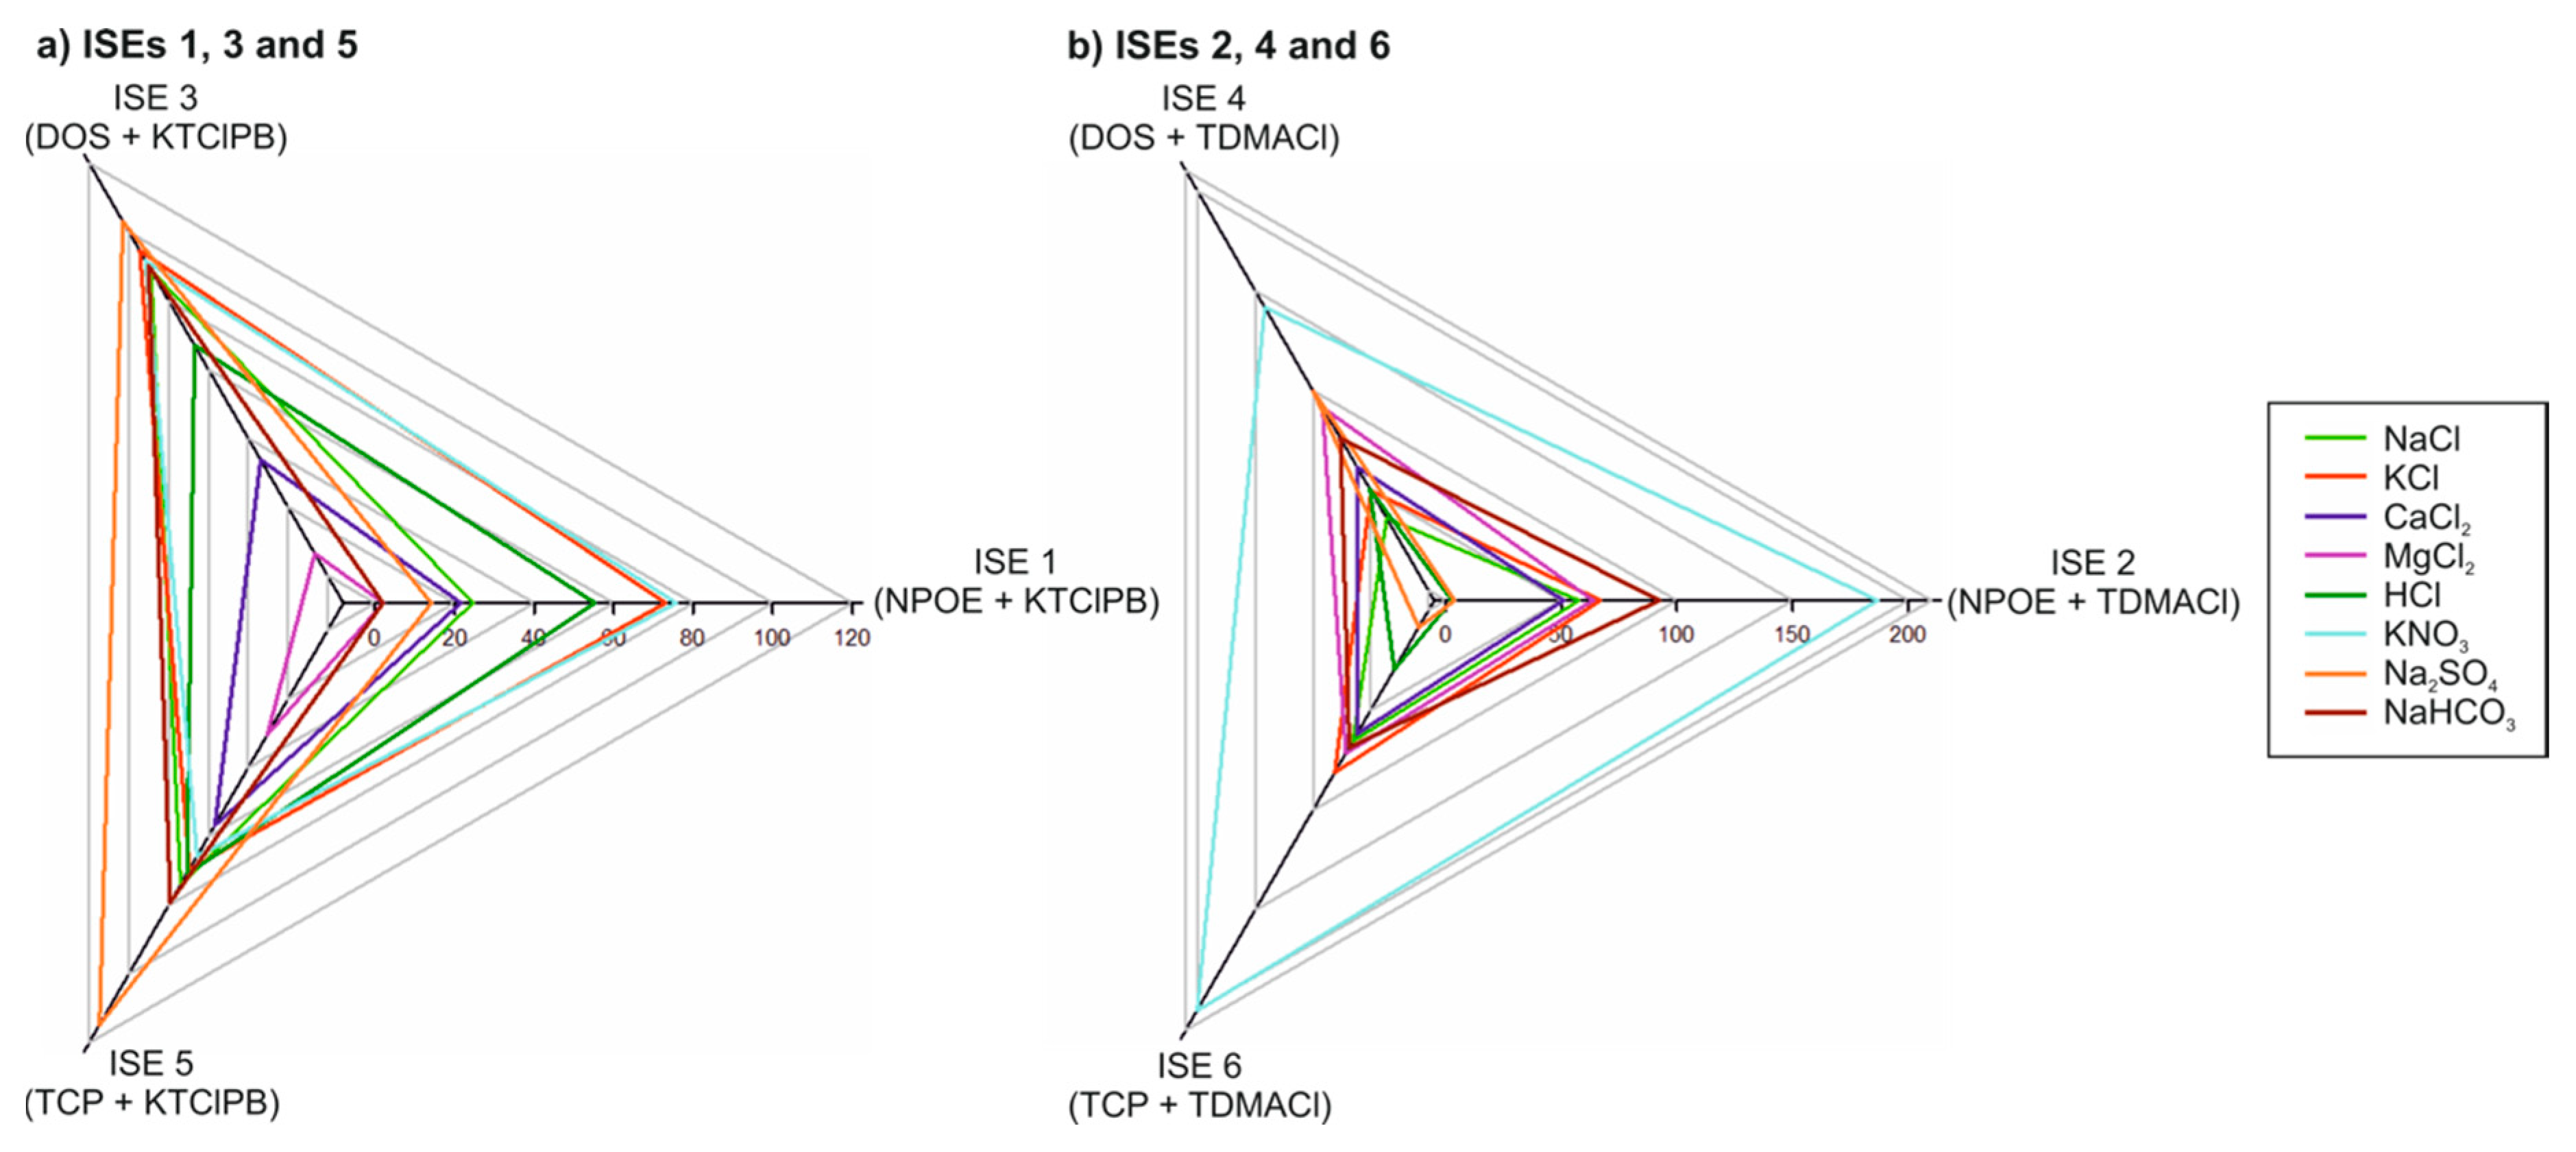
The overall conclusion is that the presence of a different plasticizer in the membrane caused diverse responses of the ISEs for the tested cations and anions, with the responses of DOS and TCP being the most similar between them. Similar trends as the ones with the slopes were observed when analyzing the data in the form of a radar plot. Thus, Figure 2 presents the radar plot of the potential change found for each electrode towards each salt at a concentration of ca. 1 × 10⁻³ M (i.e., potential difference between that provided in the water background and that at the second tested concentration). Those data related to the same sample are linked with a line. As observed, the results presented significant cross-linking between lines, highlighting the cross selectivity of all the ISEs considered as a whole, which is very useful for the appropriate performance of the ET. ISE 1 followed the order of response K+ > H+ > Na+ > Ca2+ > Mg2+, whereas ISE 3 and ISE 5 generally presented a higher response for Na+ than K+. Then, ISE 6 followed the order of NO3 > Cl > HCO3 > SO42− while the response for ISE 4 to SO42− was found to be very similar to Cl and HCO3.

3.2. Potentiometric Response of Each Electrode in the Electronic Tongue towards 19 Samples of Irrigation Waters

The dynamic responses of each electrode in the ET when 5-mL aliquot of each irrigation water sample was added to 100 mL of 1 × 10⁻⁵ M KCl solution were recorded and analyzed. Importantly, this background was selected in order to prevent changes in the initial condition of the membranes between measurements. Basically, the exposure of the electrodes in the ET to the different samples will cause an ion-exchange process between the ions in the sample and those present in the membranes and with exchangeable properties, i.e., K+ or Cl, followed by the pertinent ion diffusion process in the membrane and sample. The initial contact of the ET with the 1 × 10⁻⁵ M KCl solution will ensure the recovery of the initial state of the membrane. Notably, the KCl concentration was selected in order to be high enough to allow such a recovery for a short time but not to be so high as to mask the response of the ions in the sample.
Thus, preliminarily, the experimental conditions were investigated to ensure the maintenance of the initial condition of the membrane, which is reflected by the maintenance of a relatively constant initial baseline of each electrode in the ET. The time for injecting the sample to the background (i.e., initial conditioning of the ISEs in KCl) and for the potential recording were investigated up to 100 s, realizing that only 50 s were necessary in each step to reach a steady-state potential. The concentration for the KCl solution was tested to be 10−6, 10−5, and 10−4 M. It was found that a 10−5 M KCl is suitable to conduct the tests with minimum hysteresis effect and acceptable repeatability, and that the samples are always measured in the order of increasing conductivity (see Table 1).
In essence, the sample with the lowest conductivity (sample #1) was tested before and after the sample with the highest conductivity (sample #19) considering different KCl concentrations in the background at which the sample was added: 10−6, 10−5, and 10−4 M. Some hysteresis events were observed, especially when using the 10−6 M KCl solution in the background. However, in the 10−5 M KCl background and with the samples being tested in the order of increasing conductivity, no hysteresis was observed for the sample of the lowest conductivity when it was injected at different moments of the entire analysis (see below). Moreover, it seems feasible to recondition the ISEs in 10−5 M KCl to recover their initial state prior to test samples with low conductivity if this is necessary after a long exposure to samples of high conductivity.
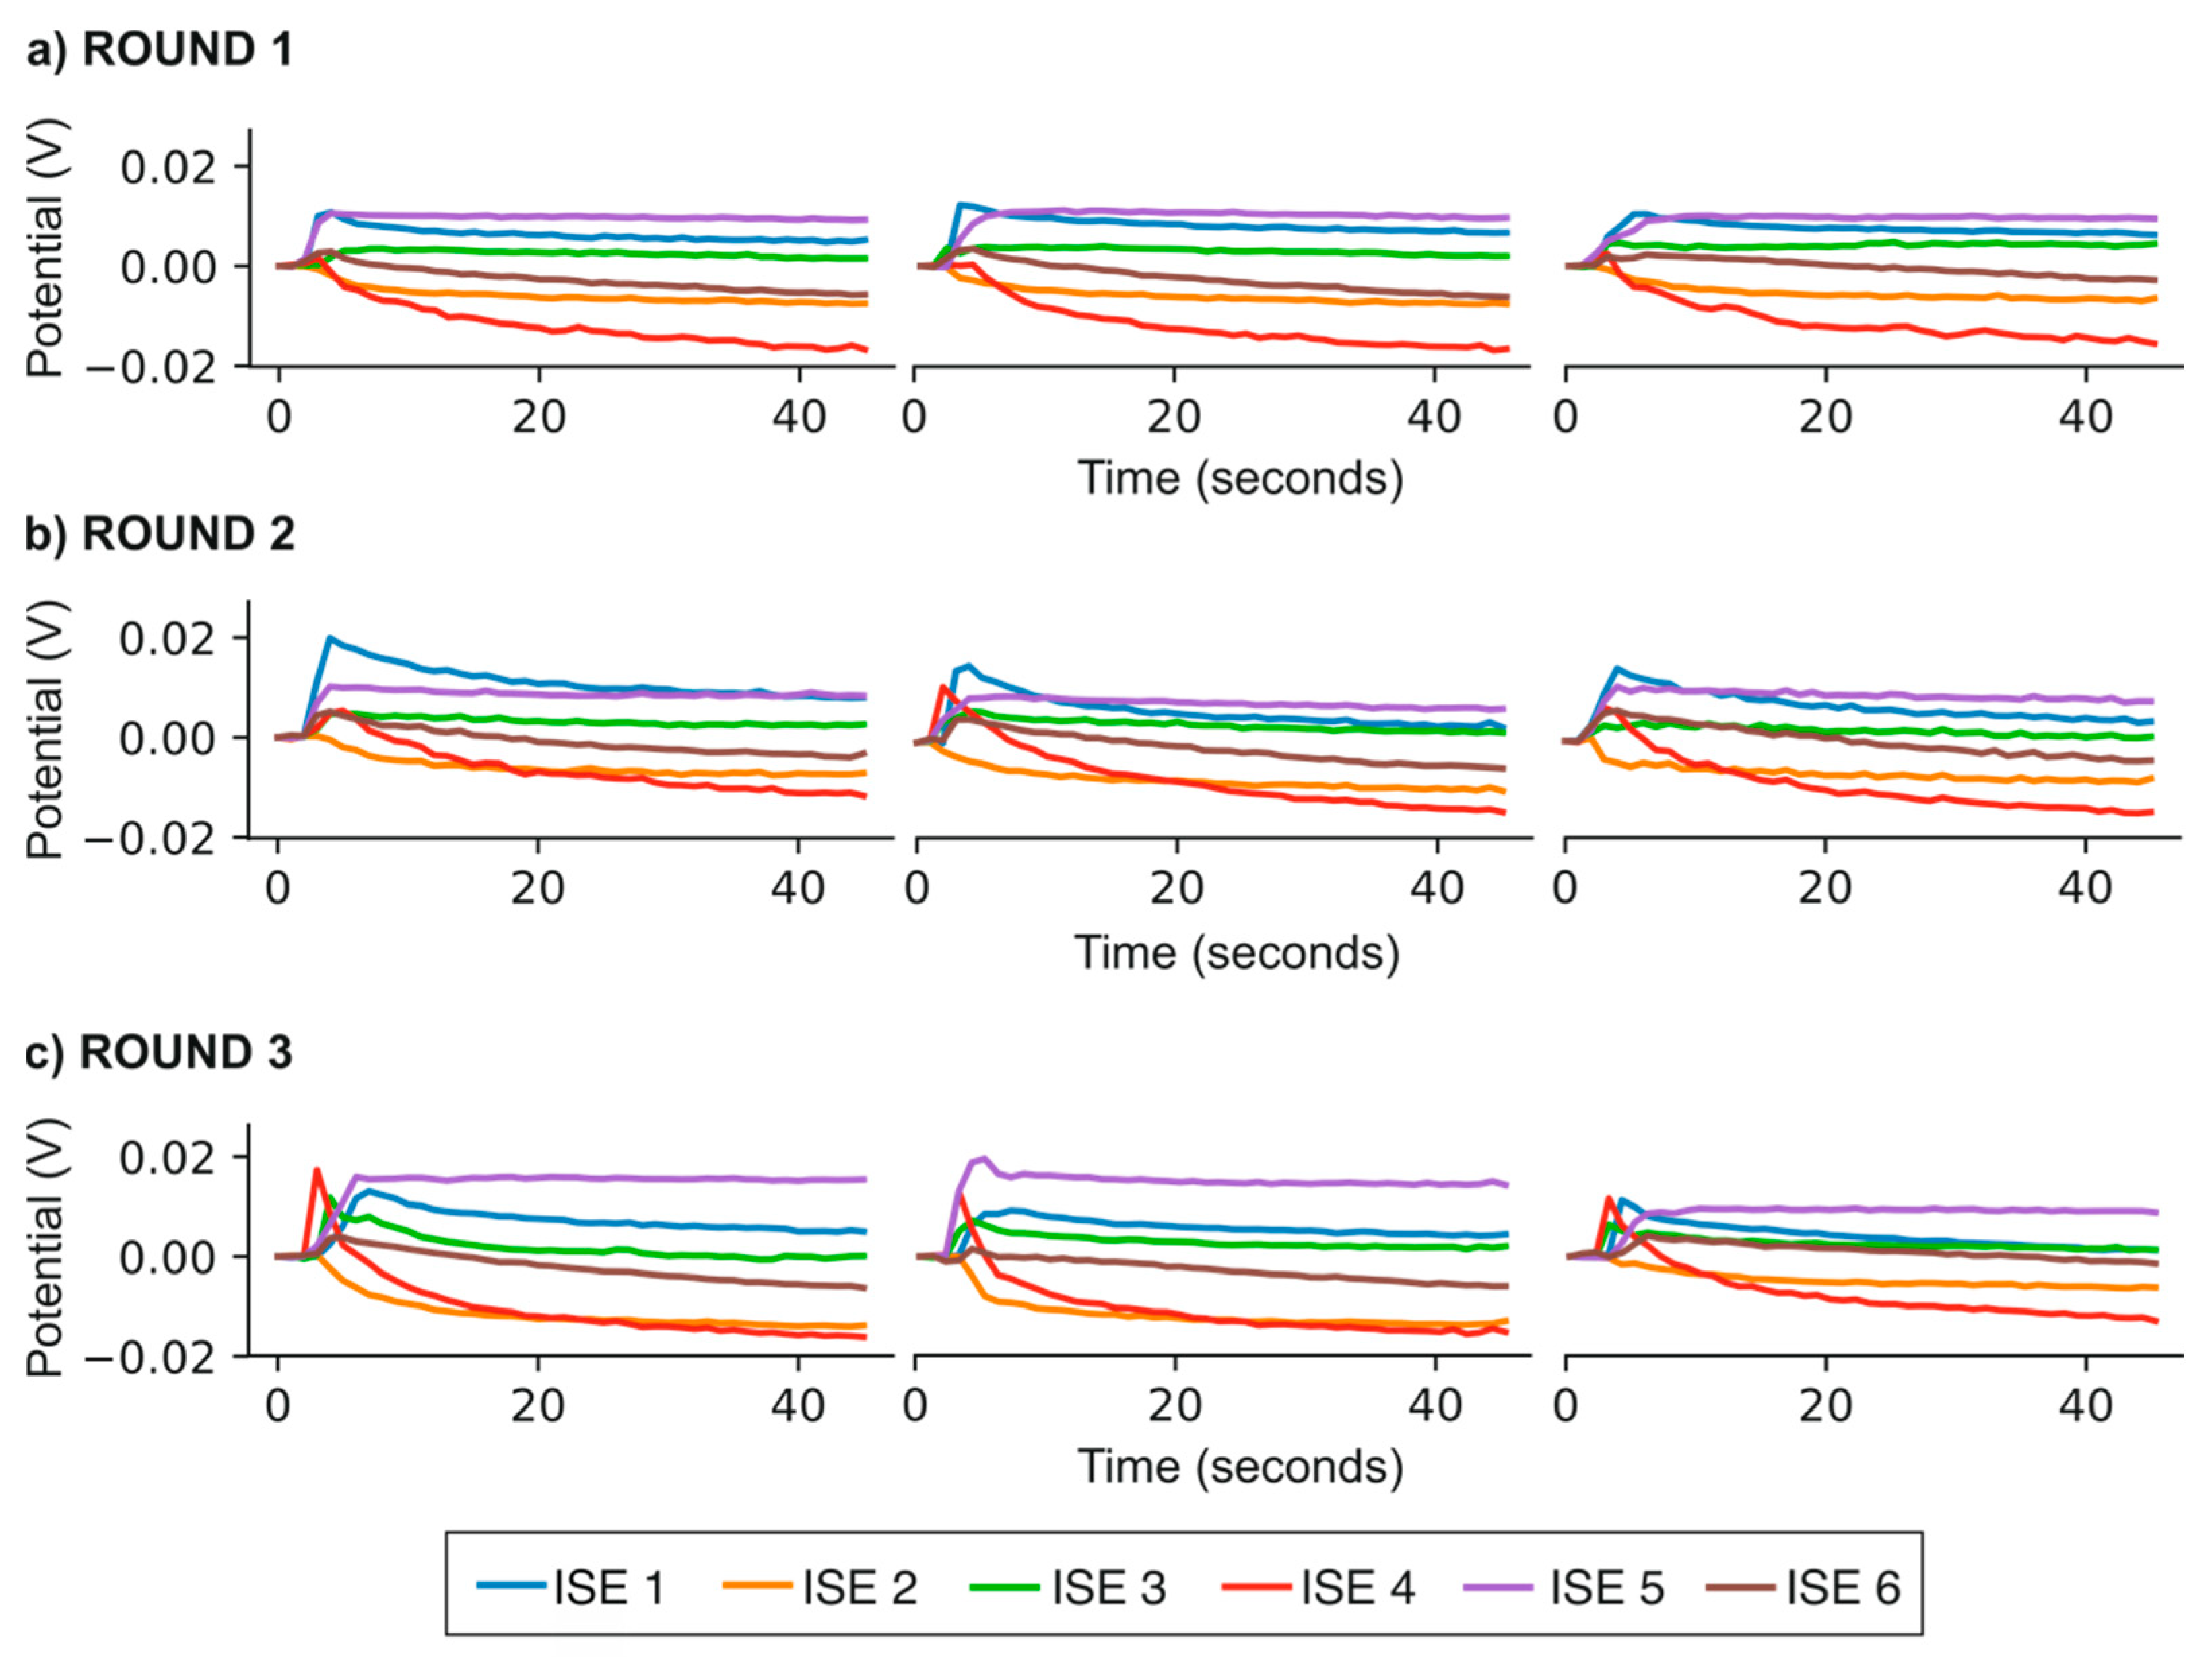
Accordingly, the samples were analyzed at the optimized conditions and in triplicate. In addition, sample #1 was tested at three different moments of the entire assay with the ET: at the beginning and at every eight samples. Figure 3 depicts the dynamic potential responses for sample #1 after baseline correction (for a better comparison). A low deviation level of the final acquired potential, and, hence, a neglectable hysteresis effect, was observed (with standard deviations for the final potentials of 19, 26, 11, 16, 27, and 16 × 10−4 V considering all the measurements with ISEs 1–6, respectively). Indeed, the total potential jumps were also rather well maintained (with standard deviations for the total potential jump potentials of 28, 6, 55, 16, 12, and 10 × 10−4 V considering all of the measurements with ISEs 1–6, respectively).
A high degree of repeatability was found for the signals observed for all of the samples. As an example, Figure 4 presents the dynamic response of sample #12 obtained in triplicate. In this case, the standard deviations were found to be 31, 27, 26, 54, 33, and 18 × 10−4 V for the total potential jump, confirming, again, the excellent reproducibility of the ET.
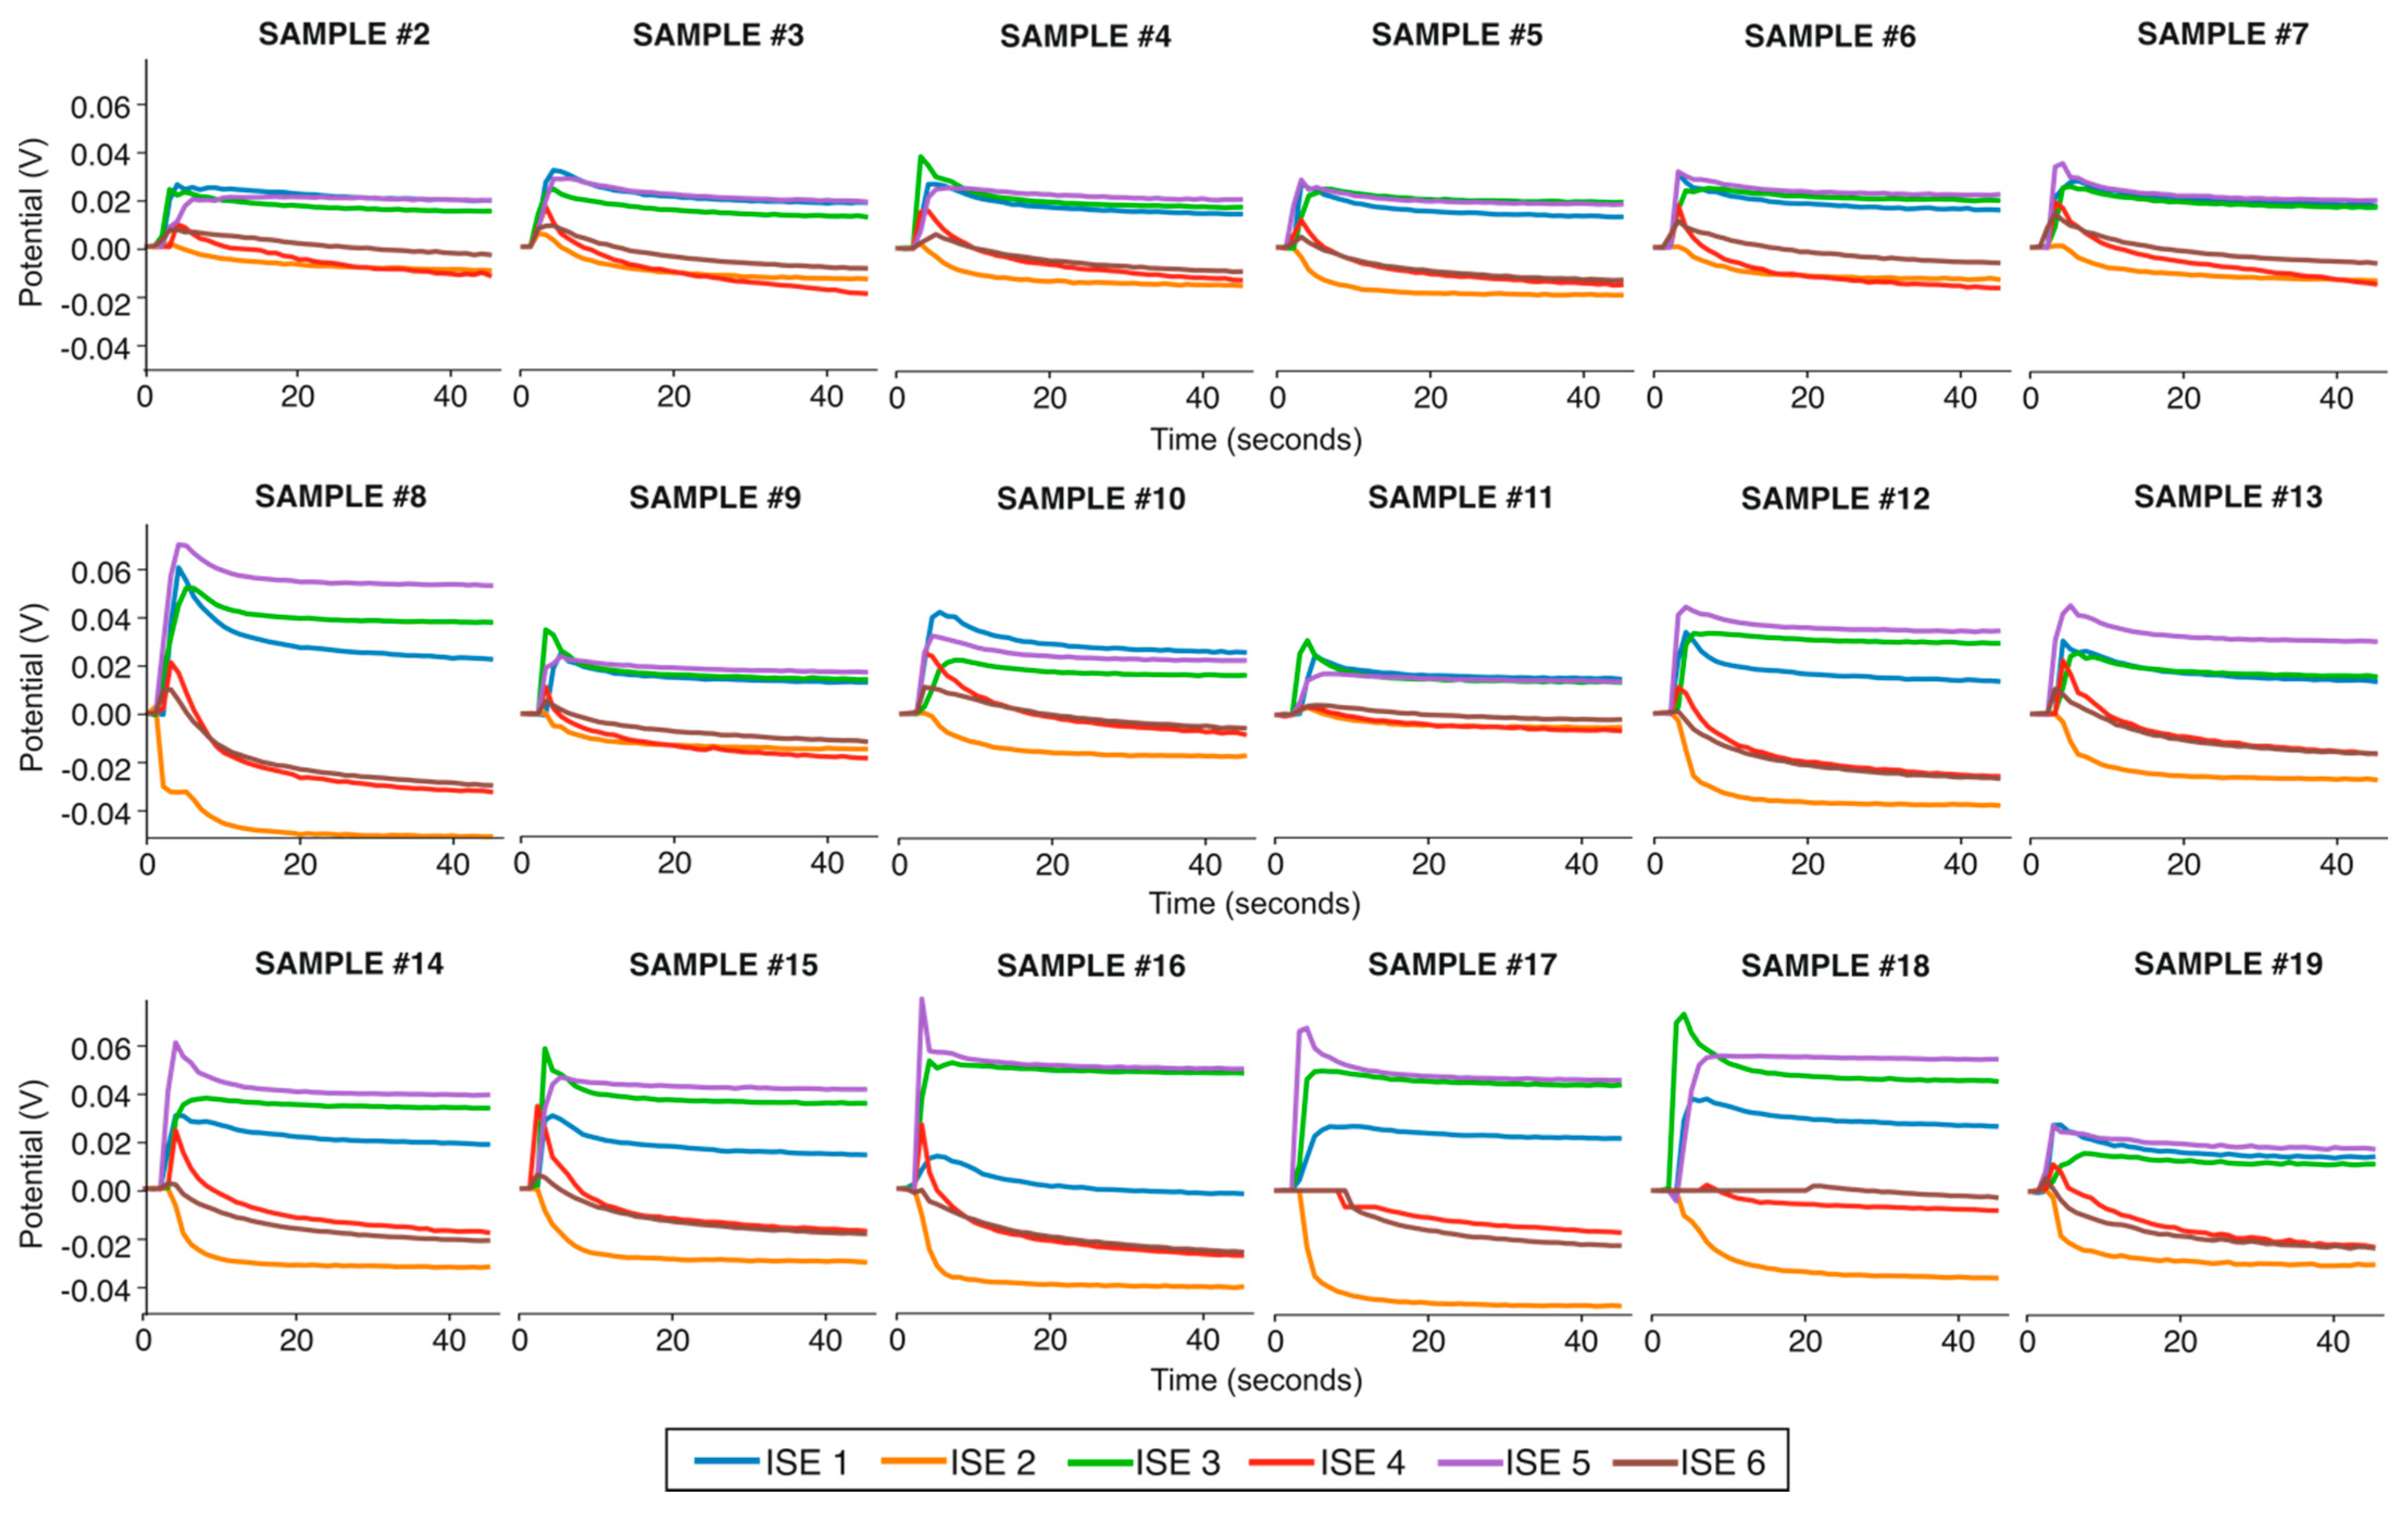
Figure 5 shows the dynamic potential responses observed for each sample, except sample #1 (already shown in Figure 3), with the ET. Notably, only the first results in the triplicate measurements are provided as a matter of clarity. As observed, the ISEs presented a very different response for each of the tested samples. ISEs 1, 3, and 5 displayed an increasing potential jump with respect to the background, whereas ISEs 2, 4, and 6 showed a decreasing potential. Complete (or almost complete) steady-state potentials were achieved in all of the cases. Accordingly, a longer recording time would decrease the speed of analysis without providing a significant improvement of the overall response quality, and, therefore, the potential difference registered at 50 s from the sample injection into the background.
Notably, the establishment of a steady-state potential was preferred versus the equilibrium potential, mainly due to two reasons. First, the shorter time required for the steady-state potential to be reached compared with the equilibrium one (most likely, days or weeks) will be necessary for the equilibrium potential to be established, and second, will be necessary to preserve the membrane from drastic changes in its composition that may prevent consecutive sample measurements from being accurate.
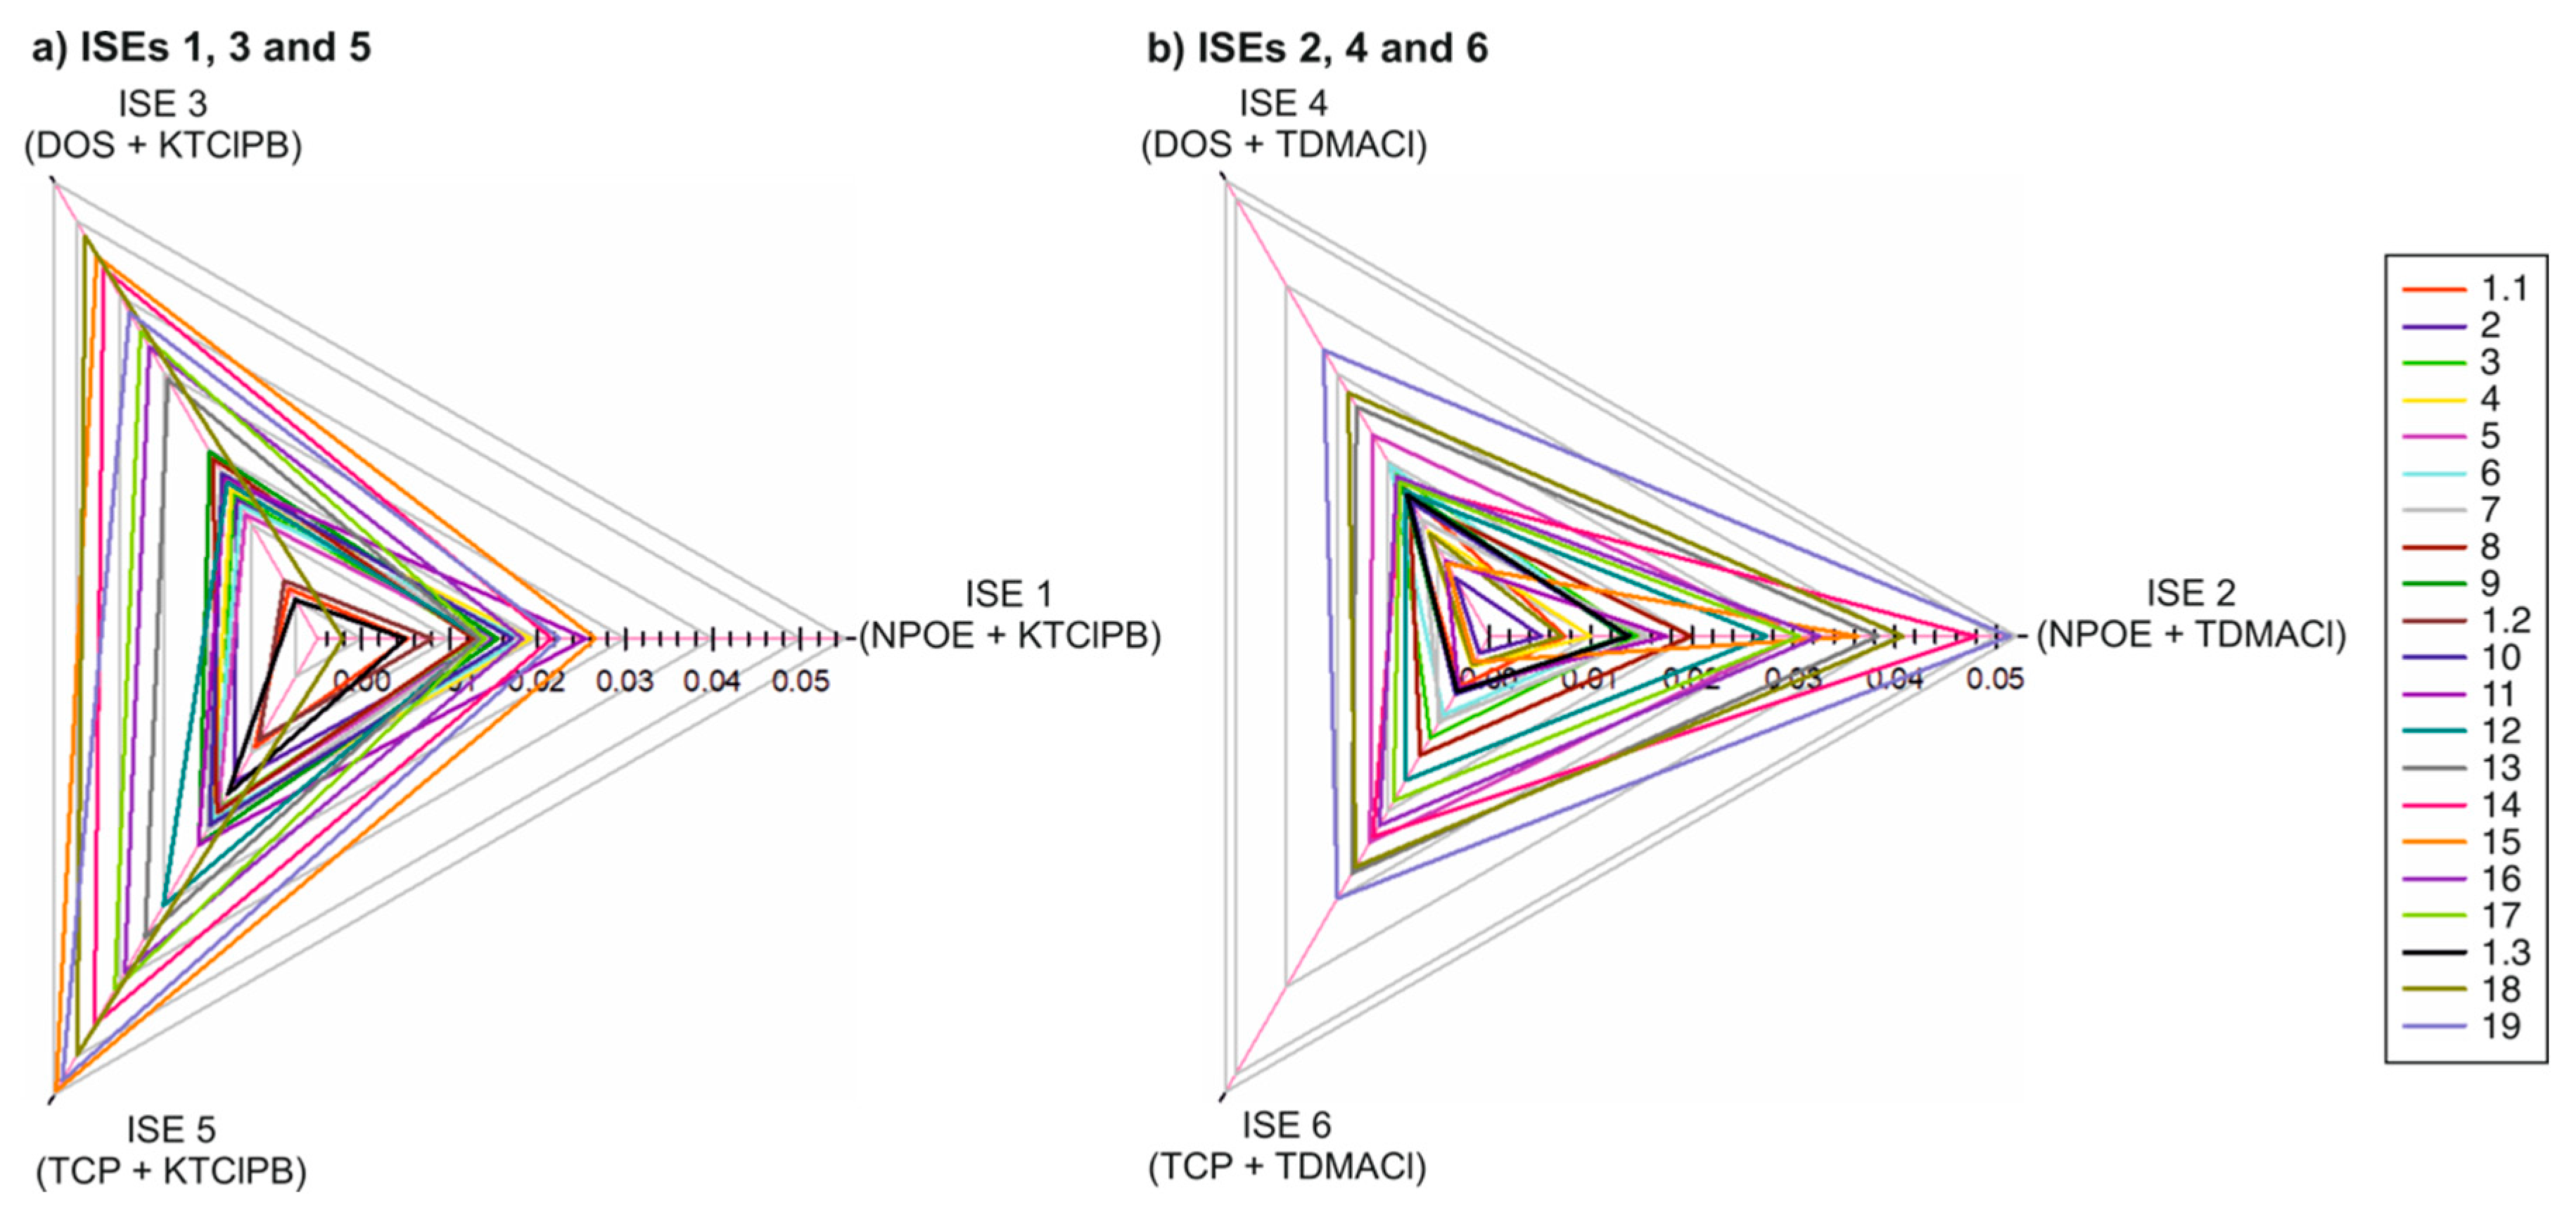
Figure 6 depicts the radar plots for such potential magnitudes presented by the six ISEs when measuring all the samples, comprising those data related to the same sample connected with a line. The lines were found to be crossed between them, which is an indication of the data being adequate for further PCA and the construction of a potentiometric ET. Notably, the responses displayed by DOS- and TCP-based ISEs were more similar between them than those presented by NPOE-based ISEs. The potential window for NPOE-based ISEs was thus higher when the membrane contained TDMACl than with KTClPB as the ion-exchanger. In contrast, with DOS- and TCP-based ISEs, the opposite trend was observed.

3.3. Principal Component Analysis (PCA)

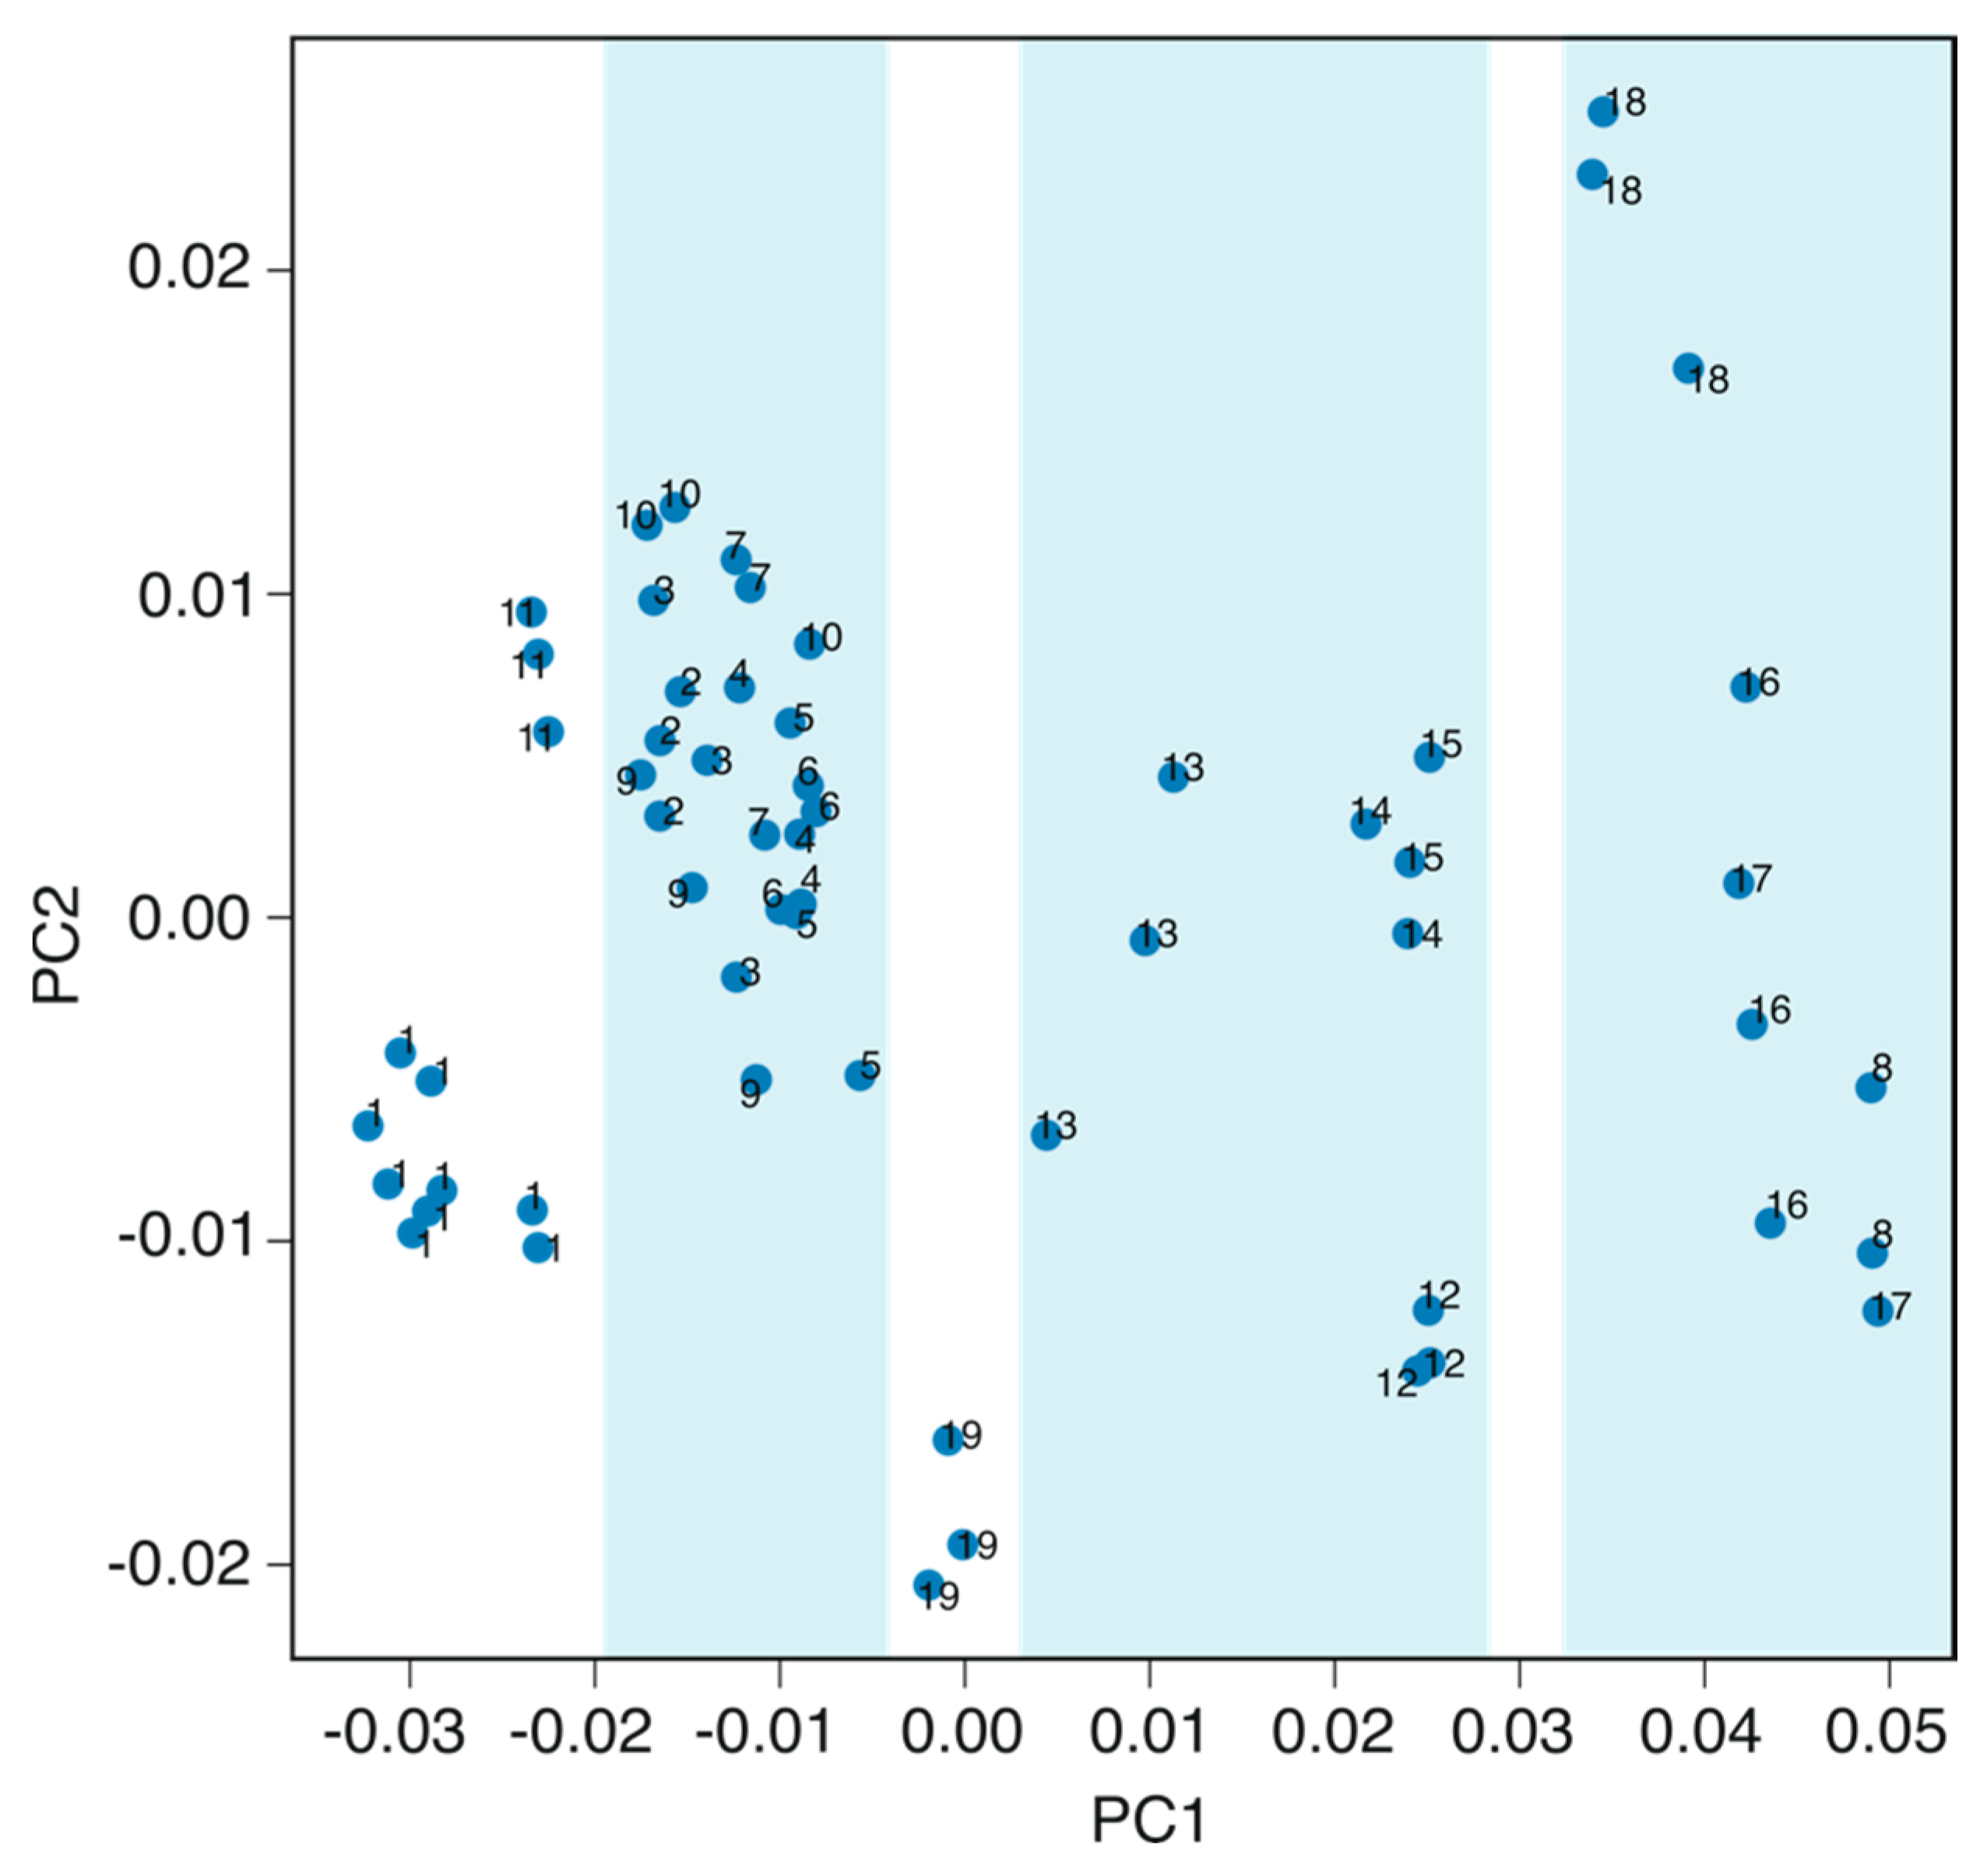
Figure 7 presents the PC map of the signals observed for all of the samples (in triplicate). Principal components 1 and 2 (PC1 and PC2) were found to represent the ca. 93% of the total variance, and these two PCs together will thereby quite accurately describe the similarities and differences between the tested samples. Effectively, PC3–PC5 did not significantly contribute to the accumulated variance (percentages of accumulated variances for each PC were 80.7%, 12.2%, 4.1%, 1.4%, and 1.1% for PC1–PC5). Except for some outliers, the reproducibility for the PC values found for each sample was rather good (the average value in percentage of the deviations for the complete population is <10%).
In the PC map, some groups of samples appeared as per their PC1 and PC2 coordinates. Indeed, PC1 presented a higher influence in this grouping, as shown with the blue squares in Figure 7. Samples #2–7, 9, and 10 configure the first group, with #2–7 having the same geographical situation (i.e., Murcia Southwest). However, the other two samples from the Southwest zone (i.e., 1 and 8) presented very different PC1 values. Indeed, sample #8 appeared in the third group together with samples #16–18. While samples #17 and 18 belongs to the Murcia Middle East area, sample #16 came from Murcia Southeast. The rest of the samples from Murcia Southeast (#12–15), except for sample #11, constituted the second group.
A factor that may contribute to the fact that samples #1 and 8 presented very different PC1 between them, and also when comparing them with the rest of the samples from the Southwest zone, may be the purity/contamination degree. Having collected information about the particular origin of these two samples, sample #1 came from a well, but the composition of well waters form different but relatively close wells may vary between them due to depth and specific area reasons. Sample #8 then came from a major soil with high content in gypsum, as confirmed with the high levels of sulfate and calcium found. In addition, the high nitrate concentration may indicate anthropogenic influence(s), such as agricultural fertilizer. Another interesting result is the one obtained for samples #9 and 10, both from Murcia Middle South and appearing in the first group of samples. Evidently, PC2 separates these two samples, which may be related to the high content in sulphate and calcium ions of sample #10 (see Table 1).
Regarding the group of samples collected in Murcia Southeast, sample #11 is well separated by PC1 from the rest, which could be attributed to a higher purity and also to the fact that the location of the collection point was more in the southeast than the rest. PC1 also separates sample #16, and PC2 separates sample #12 from the rest. Notably, these samples showed the lowest and higher nitrate content, while samples #13–15 presented very similar compositions (see Table 3). The nitrate content could be an indication of the contamination degree of the sample due to agricultural fertilizer.
PC2 allows for the separation of samples #17 and 18 despite their high geographical proximity. This is interesting because sample #18 did not present quantifiable bicarbonate content, which is rather unusual. A possibility is that the bicarbonate is neutralized by acids delivered by local industries in the area. Notably, the sample displayed a very acidic pH compared with the rest of samples.
Finally, sample #19 is from a different Spanish region. It has the peculiarity of a high content in nitrate together with a relatively low chloride content. The classification of this sample in group two or three is not straightforward; however, it seems to be closer to the first group. PC2 is then the lowest value found within the entire sample population, followed by sample #12, and this one also has a high nitrate concentration.
Overall, the potentiometric ET was found to distinguish quite well between different geographical zones. The ET allows for the separation of specific samples, showing a very different composition than the rest of samples that have the same origin area. Variations in the composition may arise from contamination issues or just from the different nature of the water (cistern, osmosis, etc.). Seemingly, PC2 is able to differentiate some of the samples with high nitrate content (from agricultural fertilizers), whereas PC1 relates to the sample conductivity.
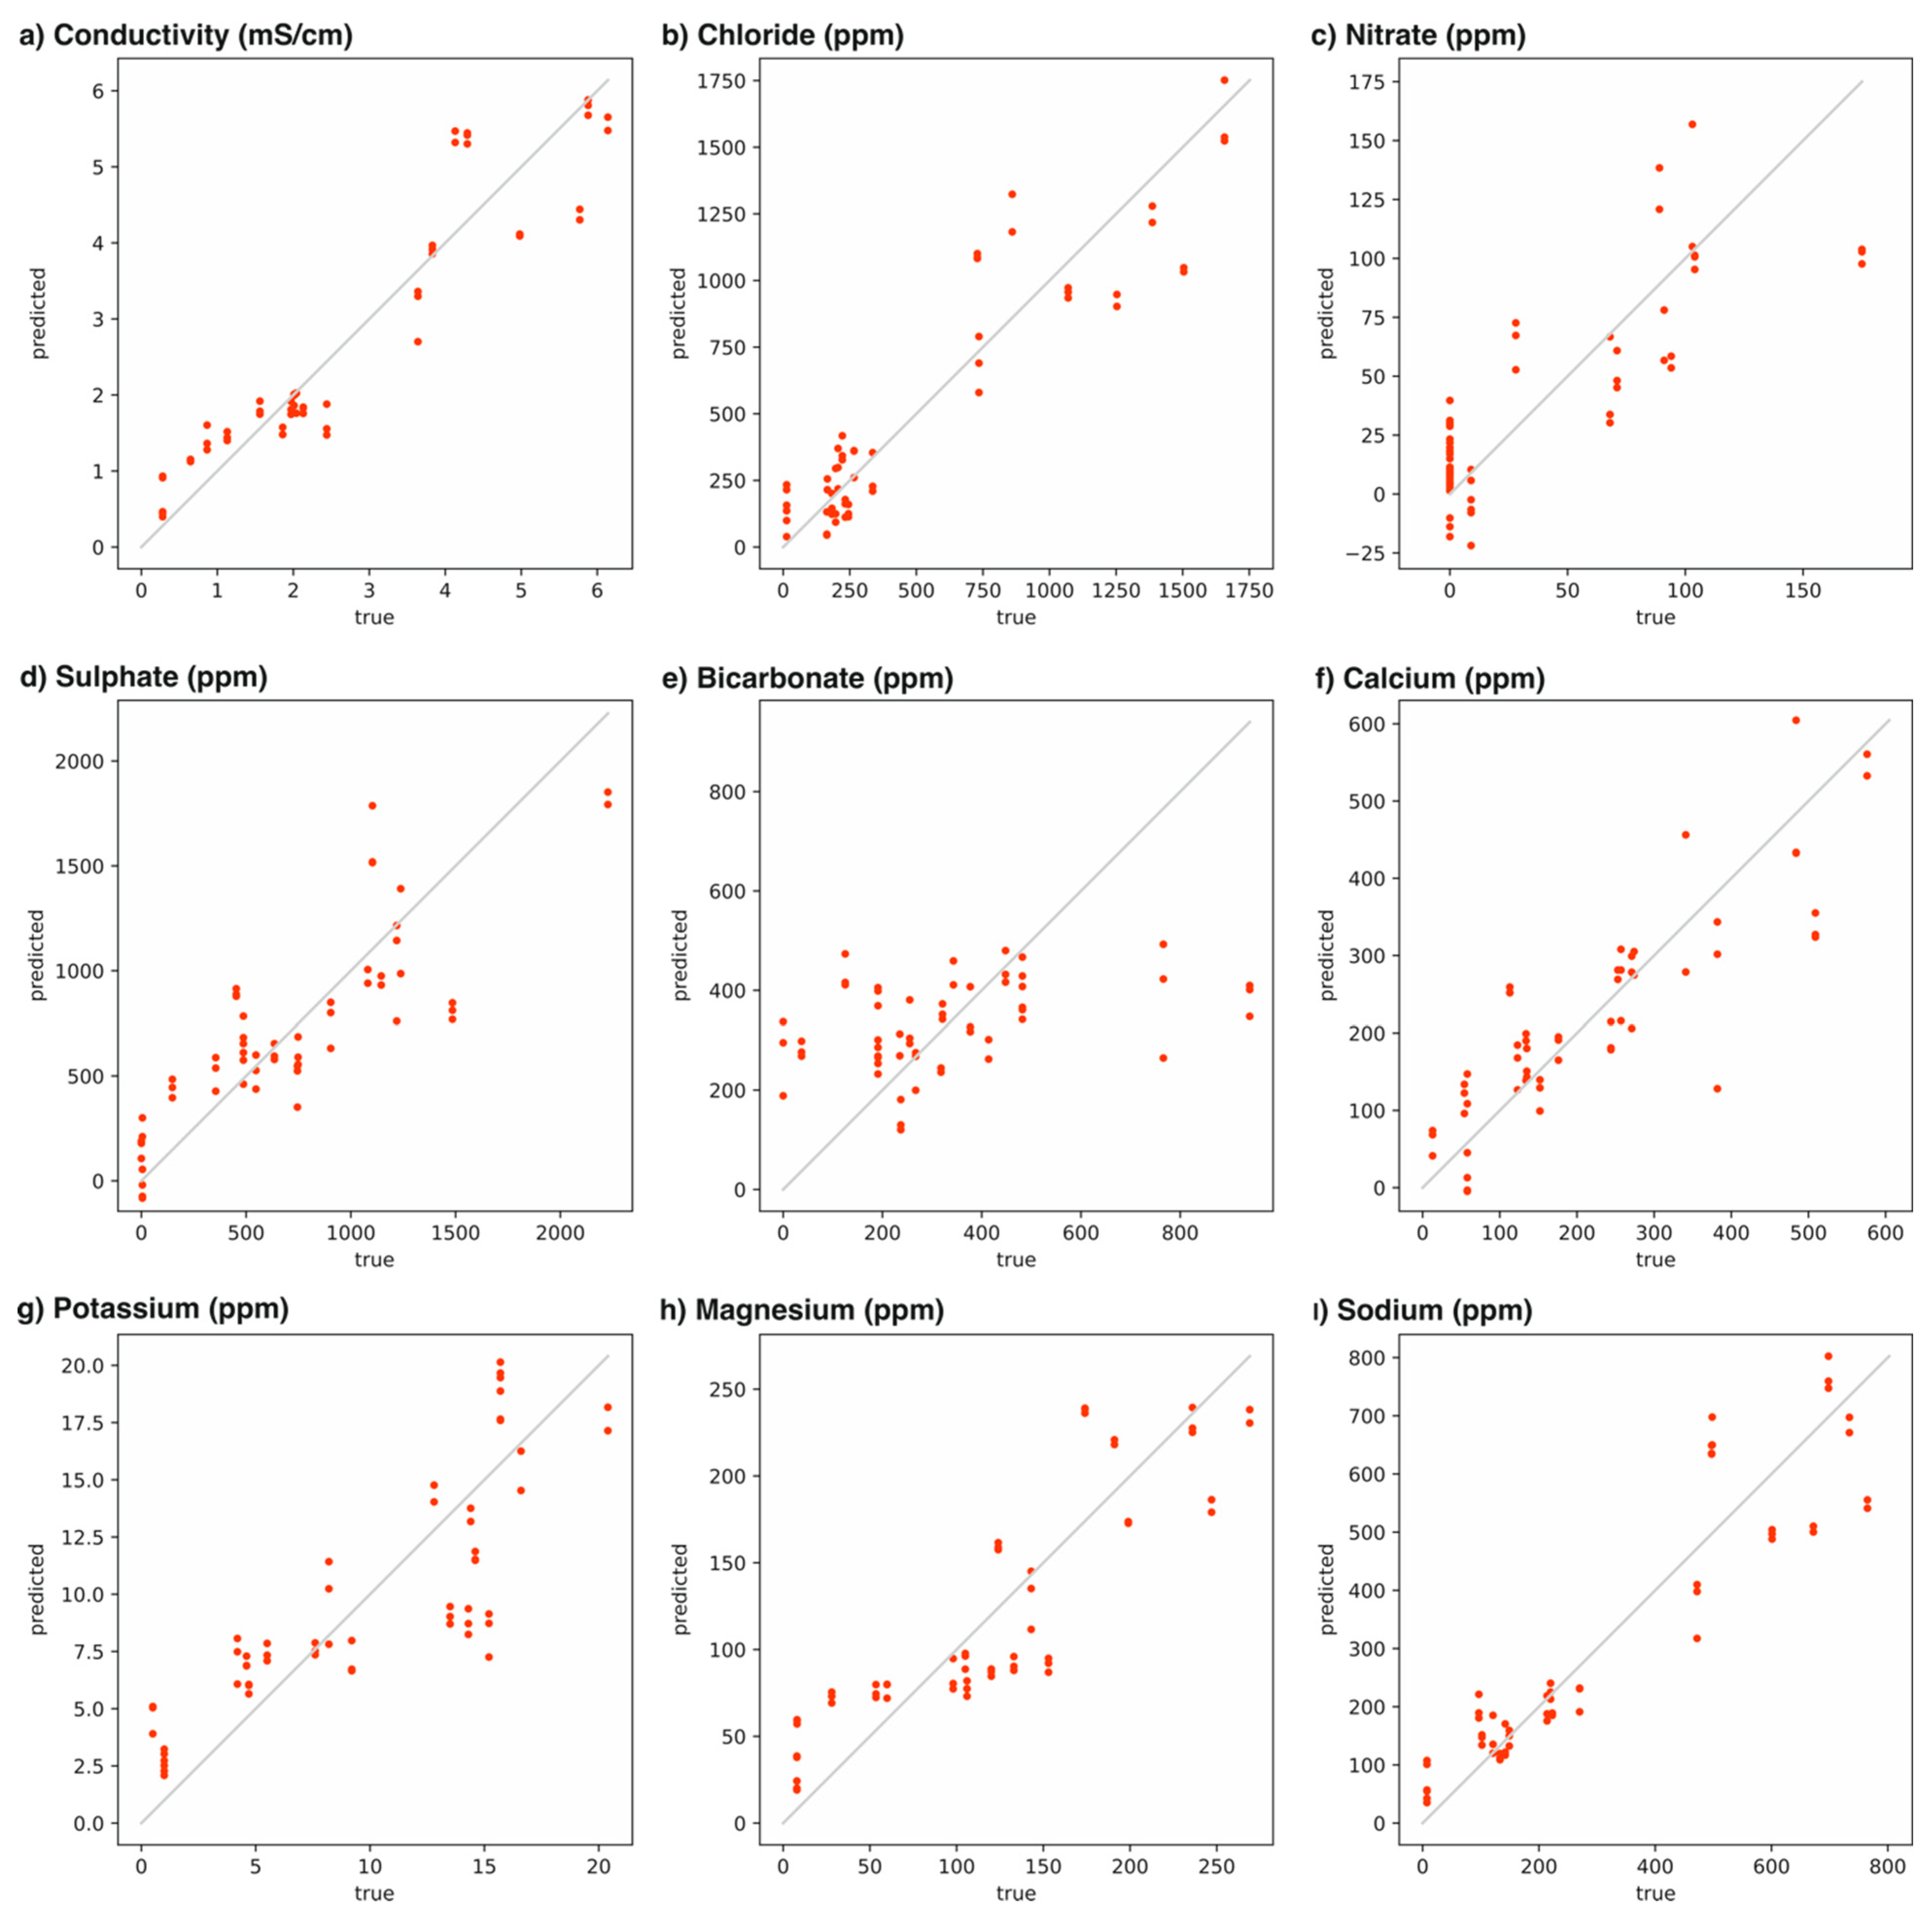
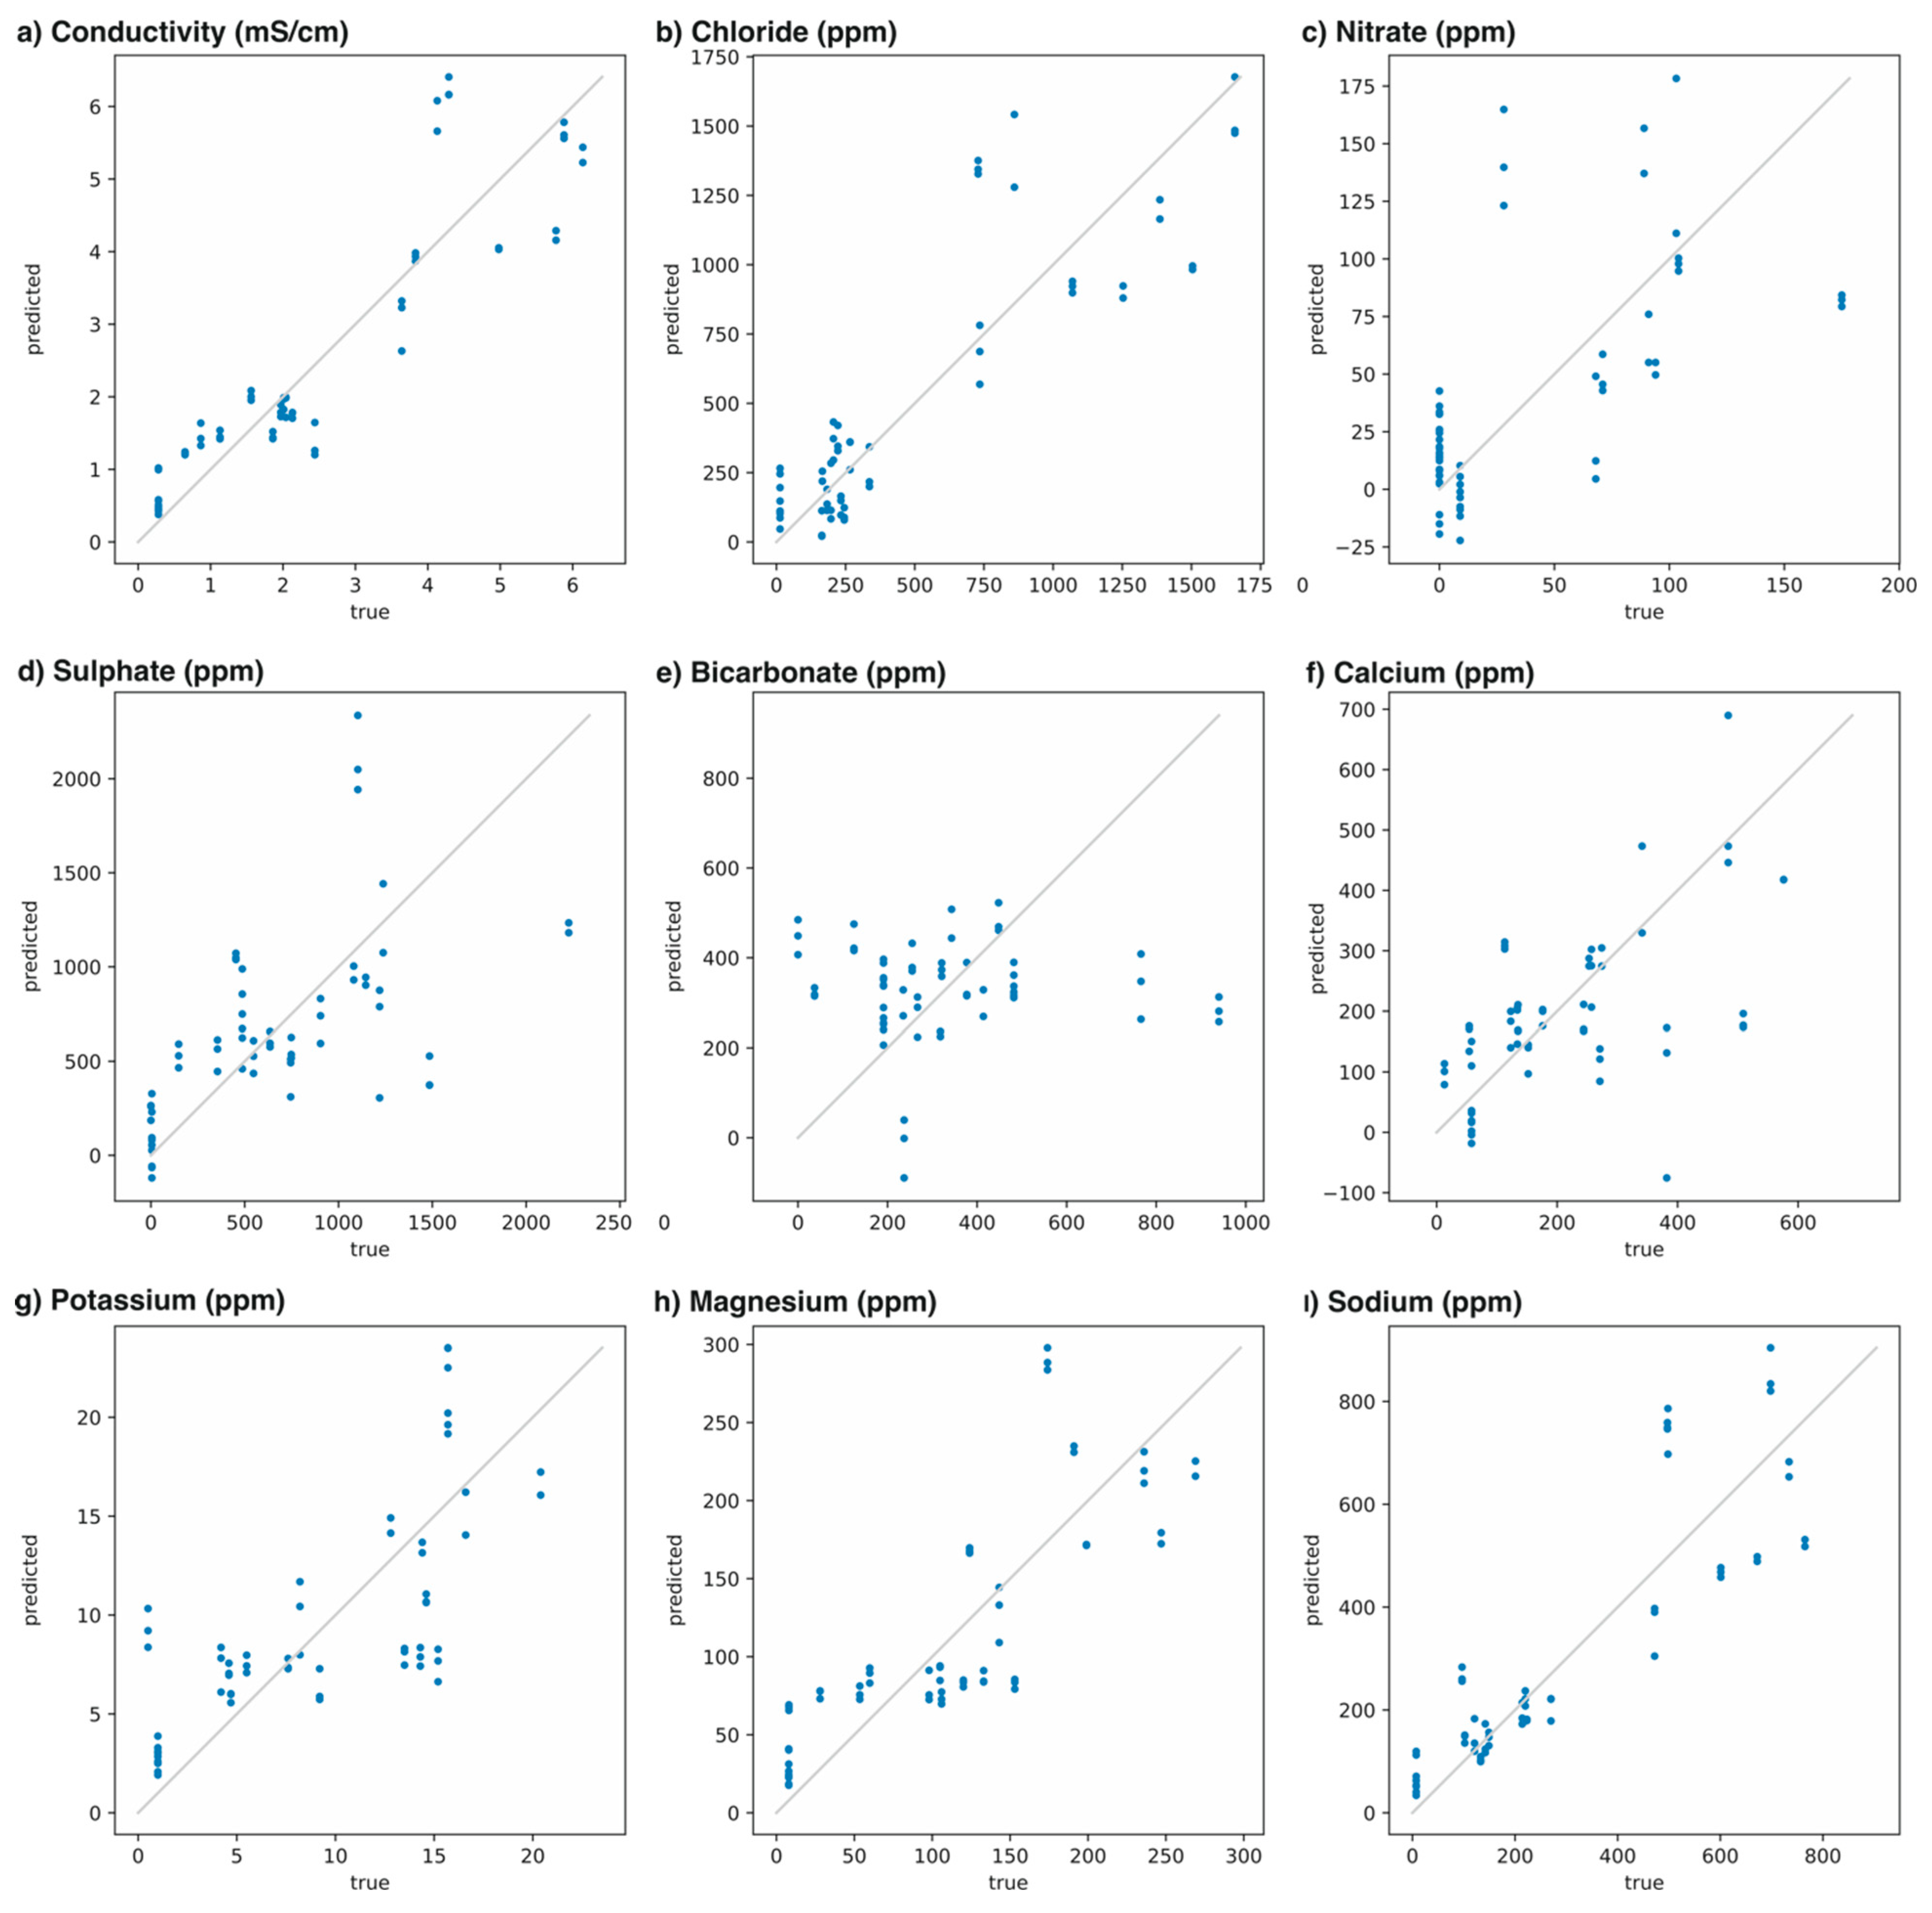
Next, the potential of the potentiometric ET for the quantitative analysis of the water samples was evaluated. The concentrations displayed in Table 1 but also the conductivity were used to elaborate a mathematical model based on multivariate linear regression. The ET calibration was performed using the entire pool of samples (Figure 8), and the quality of the parameters’ predictors was evaluated via cross-validation (Figure 9).
The predictor for each parameter (conductivity or ion concentration) was expressed according to Equation (1):
c n = k = 1 n w k E k + o f f s e t  
where c n is the conductivity or concentration of each ion (n) expressed in mS cm–1 or mg L–1, w k stands for the coefficients obtained by linear fitting providing the minimum quadratic error, E k (expressed in V) is the potential difference (with respect to the baseline) observed for each electrode (k), and offset is the ion concentration corresponding to a zero potential readout.
Table 4 collects the w k and offset values obtained for each parameter and electrode in the ET. Notably, in all of the cases, PCR (principal component regression) with three components and PLS (partial least squares) with two and three components were tested in the data dimension reduction method. It was found that PLS with three components was the best option for all of the parameters. With the data provided in Table 4, it is possible to further reproduce and utilize the developed linear model for the characterization of other samples.
Table 5 presents the quality parameters when performing a cross-validation. Due to the good repeatability of the potentiometric signals, and thus for the PCs, for each sample, the cross-validation was conducted according to the type of water, i.e., each sample was predicted with a model calibrated with the rest of samples but not the one under study. For reference, a good cross-validation accuracy (i.e., values close to 1) usually indicates that the model is not overtrained and will generalize well for any irrigation water sample.
Overall, the w k   values allow us to obtain simple formulas to predict the conductivity and concentration of eight ions in irrigation water samples. However, each parameter is predicted with different accuracy, as revealed by the R2 prediction scores. Importantly, all the parameters, except HCO3 concentration, presented acceptable R2 prediction scores of ≥0.7. Furthermore, the good calibration results obtained by simple linear models indicated that the developed ET provides rich information about conductivity and ions’ concentrations and. Therefore, the use of more complex data processing and machine learning techniques is not needed a priori. Regarding the cross-validation analysis, the conductivity together with Cl, Na+ y Mg2+ concentrations presented excellent results.
Ordinary Least Squares (OLS) models were also evaluated using only statistically significant parameters (as measured by the standard t-test). The results are summarized in Table 6, while the summaries of the tests can be found in Supplementary Materials. As observed, the cross-validation accuracy is similar to that of the PLS models.

4. Conclusions

The potentiometric electronic tongue herein developed permits us to classify a pool of irrigation waters according to their geographical locations, except for those waters that are much more or much less pure than the rest of waters of the corresponding locations. In this case, these samples appear far from the others on the map of the two principal components (PC1 and PC2). For the conductivity and for all ions’ concentrations, except the one for HCO3, simple prediction models based on the developed ISEs are acceptable as long as the tested sample is of the same type of water as those used to build the model. Moreover, the results of cross-validation suggest that for the conductivity and for some particular ions (Cl, Na+ y Mg2+), it is possible to build more general, pre-calibrated models that can work with many types of water. The potentiometric electronic tongue provides a fast and economical method for the control of irrigation water, and it may be a suitable alternative to other more expensive and time-consuming analytical methods.

Supplementary Materials

The following supporting information can be downloaded at: https://www.mdpi.com/article/10.3390/chemosensors11070407/s1.

Author Contributions

Conceptualization, J.Á.O. and A.R.; methodology, M.S.G., A.R. and J.Á.O.; software, M.C. and A.R.; validation, M.M., A.R. and J.Á.O.; formal analysis, M.M., M.C., M.S.G., A.R. and J.Á.O.; investigation, M.M., M.C., M.S.G., A.R. and J.Á.O.; resources, M.C., A.R. and J.Á.O.; data curation, M.M., A.R. and J.Á.O.; writing—original draft preparation, M.M., M.C., M.S.G., A.R. and J.Á.O.; writing—review and editing, M.M., M.C., M.S.G., A.R. and J.Á.O.; visualization, M.M., M.C. and A.R.; supervision, M.S.G. and J.Á.O.; project administration, J.Á.O.; funding acquisition, J.Á.O. All authors have read and agreed to the published version of the manuscript.

Funding

This research was funded by the Spanish Government through the grant numbers PID2019- 106097GB-I00/AEI/10.13039/501100011033 (Ministry of Science and Innovation) and RTI2018-095855- B-I00 (Ministry of Science, Innovation and Universities, State Research Agency, FEDER), but also, TED2021-129300B-I00 y PID2021-122466OB-I00 de MCIN/AEI.

Institutional Review Board Statement

Not applicable.

Informed Consent Statement

Not applicable.

Data Availability Statement

Not applicable.

Acknowledgments

M.C. acknowledges the Royal Institute of Technology (Sweden) and the Universidad Católica San Antonio de Murcia (Spain) for the received support.

Conflicts of Interest

The authors declare no conflict of interest. The funders had no role in the design of the study; in the collection, analyses, or interpretation of data; in the writing of the manuscript; or in the decision to publish the results.

References

  1. Available online: www.euro.who.int/__data/assets/pdf_file/0016/324610/Health-2020-Agriculture-and-health-through-food-safety-and-nutrition-en.pdf (accessed on 5 May 2023).
  2. Antonacci, A.; Arduini, F.; Moscone, D.; Palleschi, G.; Scognamiglio, V. Nanostructured (Bio)sensors for smart agriculture. TrAC 2018, 98, 95–103. [Google Scholar]
  3. García-Tejero, I.F.; Durán-Zuazo, V.H.; Muriel-Fernández, J.L.; Rodríguez-Pleguezuelo, C.R. Water and Sustainable Agriculture; SpringerBriefs in Agriculture Series; Springer: Berlin/Heidelberg, Germany, 2011; pp. 1–9. [Google Scholar]
  4. Rahman, M.S.; Saha, N.; Islam, A.R.M.T.; Shen, S.; Bodrud-Doza, M.D. Evaluation of Water Quality for Sustainable Agriculture in Bangladesh. Water Air Soil Poll. 2017, 228, 385. [Google Scholar] [CrossRef]
  5. Qadir, M.; Oster, J.D. Crop and irrigation management strategies for saline-sodic soils and waters aimed at environmentally sustainable agriculture. Sci. Total Environ. 2004, 323, 1–19. [Google Scholar] [CrossRef] [PubMed]
  6. Zaman, M.; Shahid, S.A.; Heng, L. Irrigation Water Quality. In Guideline for Salinity Assessment, Mitigation and Adaptation Using Nuclear and Related Techniques; Springer: Berlin/Heidelberg, Germany, 2018; pp. 113–131. [Google Scholar]
  7. Smith, C.J.; Oster, J.D.; Sposito, G. Potassium and magnesium in irrigation water quality assessment. Agri. Water Manag. 2015, 157, 59–64. [Google Scholar] [CrossRef]
  8. Irrigation Water Quality Criteria. Available online: https://itc.tamu.edu/files/2018/05/00506.pdf (accessed on 5 May 2023).
  9. Bagordo, F.; Migoni, D.; Grassi, T.; Serio, F.; Idolo, A.; Guido, M.; Zaccarelli, N.; Fanizzi, F.P.; De Donno, A. Using the DPSIR framework to identify factors influencing the quality of groundwater in Greca Salentina (Puglia, Italy). Rend. Lincei. Sci. Fis. E Nat. 2016, 27, 113–125. [Google Scholar] [CrossRef]
  10. Kazi, T.G.; Arain, M.B.; Jamali, M.K.; Jalbani, N.; Afridi, H.I.; Sarfraz, R.A.; Baig, J.A.; Shah, A.Q. Assessment of water quality of polluted lake using multivariate statistical techniques: A case study. Ecotoxicol. Environ. Saf. 2009, 72, 301–309. [Google Scholar] [CrossRef] [PubMed]
  11. Ilic, M.; Mutavdzic, B.; Srdevic, Z.; Srdevic, B. Irrigation water fitness assessment based on Bayesian network and FAO guidelines. Irrig. Drain. 2022, 71, 665–675. [Google Scholar] [CrossRef]
  12. Westcot, D.W.; Ayers, R.S. Irrigation Water Quality Criteria. In Irrigation with Reclaimed Municipal Wastewater—A Guidance Manual; CRC Press: Boca Raton, FL, USA, 1984; Chapter 3. [Google Scholar]
  13. Cuartero, M. Electrochemical sensors for in-situ measurement of ions in seawater. Sens. Act. B Chem. 2021, 334, 129635. [Google Scholar] [CrossRef]
  14. Available online: https://hispagua.cedex.es/en/instituciones/confederaciones/segura (accessed on 5 May 2023).
  15. Sghaier, K.; Barhoumi, H.; Maaref, A.; Siadat, M.; Jaffrezic-Renault, N. Characterization and Classification of Groundwater from Wells Using an Electronic Tongue (Kairouan, Tunisia). J. Water Res. Prot. 2011, 3, 531–539. [Google Scholar] [CrossRef]
  16. Garcia, M.S.; Ortuno, J.A.; Albero, M.I.; Cuartero, M. Application of a trazodone-selective electrode to pharmaceutical quality control and urine analyses. Anal. Bioanal. Chem. 2009, 394, 1563–1567. [Google Scholar] [CrossRef] [PubMed]
  17. Cuartero, M.; Ruiz, A.; Galian, M.; Ortuno, J.A. Potentiometric Electronic Tongue for Quantitative Ion Analysis in Natural Mineral Waters. Sensors 2022, 22, 6204. [Google Scholar] [CrossRef] [PubMed]
  18. Gonzalez-Franco, J.A.; Ruiz, A.; Ortuno, J.A. Dynamic Potentiometry with an Ion-Selective Electrode: A Tool for Qualitative and Quantitative Analysis of Inorganic and Organic Cations. Chemosensors 2022, 10, 116. [Google Scholar] [CrossRef]
  19. Bakker, E.; Buhlmann, P.; Pretsch, E. The phase-boundary potential model. Talanta 2004, 63, 3–20. [Google Scholar] [CrossRef] [PubMed]
  20. Morf, W.E.; Pretsch, E.; de Rooij, N.F. Theory and computer simulation of the time-dependent selectivity behavior of polymeric membrane ion-selective electrodes. J. Electroanal. Chem. 2008, 614, 15–23. [Google Scholar] [CrossRef] [PubMed] [Green Version]
  21. Morf, W.E.; Pretsch, E.; de Rooij, N.F. Memory effects of ion-selective electrodes: Theory and computer simulation of the time-dependent potential response to multiple sample changes. J. Electroanal. Chem. 2009, 633, 137–145. [Google Scholar] [CrossRef] [PubMed] [Green Version]
  22. Egorov, V.V.; Novakovskii, A.D.; Zdrachek, E.A. Modeling of the effect of diffusion processes on the response of ion-selective electrodes by the finite difference technique: Comparison of theory with experiment and critical evaluation. J. Anal. Chem. 2017, 72, 793–802. [Google Scholar] [CrossRef]
  23. Egorov, V.V.; Novakovskii, A.D.; Zdrachek, E.A. An Interface Equilibria-Triggered Time-Dependent Diffusion Model of the Boundary Potential and Its Application for the Numerical Simulation of the Ion-Selective Electrode Response in Real Systems. Anal. Chem. 2018, 90, 1309–1316. [Google Scholar] [CrossRef] [PubMed]
  24. Hambly, B.; Guzinski, M.; Pendley, B.; Lindner, E. Kinetic Description of the Membrane–Solution Interface for Ion-Selective Electrodes. ACS Sens. 2020, 5, 2146–2154. [Google Scholar] [CrossRef] [PubMed]
  25. Sokalski, T.; Lingenfelter, P.; Lewenstam, A. Numerical Solution of the Coupled Nernst−Planck and Poisson Equations for Liquid Junction and Ion Selective Membrane Potentials. J. Phys. Chem. B 2003, 107, 2443–2452. [Google Scholar] [CrossRef]
  26. Sokalski, T.; Lewenstam, A. Application of Nernst–Planck and Poisson equations for interpretation of liquid-junction and membrane potentials in real-time and space domains. Electrochem. Commun. 2001, 3, 107–112. [Google Scholar] [CrossRef]
Figure 1. Dynamic responses observed with each ISE comprising the electronic tongue at increasing concentrations of (a) NaCl, (b) KCl, (c) CaCl2, (d) MgCl2, (e) HCl, (f) KNO3, (g) Na2SO4, and (h) NaHCO3 in water background. Concentrations are indicated for each potential jump. In the case of HCl and NaHCO3, the tested concentrations for ISEs 3 and 4 were 1 × 10⁻⁴, 1 × 10⁻³ and 1 × 10⁻² M.
Chemosensors 11 00407 g001
Figure 2. Radar plot of the potential change in mV found for (a) electrodes 1, 3, and 5, and (b) electrodes 2, 4, and 6 towards each salt at a concentration of ca. 1 × 10⁻³ M.
Chemosensors 11 00407 g002
Figure 3. Replications of the dynamic potential response of sample #1 tested ed at three different moments (rounds) of the entire experiment with the ET.
Chemosensors 11 00407 g003
Figure 4. Replications of the dynamic potential response observed for sample #12 with the ET.
Chemosensors 11 00407 g004
Figure 5. The first measurement observed for each sample, except sample #1.
Chemosensors 11 00407 g005
Figure 6. Radar plot of the potential change in V found for all the samples using (a) electrodes 1, 3, and 5, and (b) electrodes 2, 4, and 6. Sample #1 was measured at three different moments of the entire analysis (1.1, 1.2, and 1.3).
Chemosensors 11 00407 g006
Figure 7. Principal component analysis: Plot of PC1 versus PC2 calculated for the pool of samples and including the repetitions of sample #1 along the analysis.
Chemosensors 11 00407 g007
Figure 8. Calibrations (predicted versus true concentration values) obtained for all the ions tested in the water samples.
Chemosensors 11 00407 g008
Figure 9. Cross-validation models (predicted versus true concentration values) obtained for all the ions tested in the water samples.
Chemosensors 11 00407 g009
Table 1. Quality parameters of the 19 irrigation water samples utilized in this paper. ND = non detectable amount.
Sample#Conductivity (mS/cm)Cl
(ppm)
NO3
(ppm)
SO42−
(ppm)
HCO3
(ppm)
Ca2+
(ppm)
K+
(ppm)
Mg2+
(ppm)
Na+
(ppm)
10.281395191581.087
21.13183ND3551911235.554102
31.86233ND4877662444.2106149
41.97336ND5473771347.6120214
52.01222ND74548215215.2133220
62.04266ND74848213513.5105270
72.13166ND63594017614.3153223
86.14138689222734357620.4269734
90.87197ND148125544.628121
102.44164ND14852555099.298142
110.65245NDND37134.78133
123.83107017545332111314.6124601
133.64735719042672578.2143472
144.98125391108123527414.4199672
155.77150494114531825312.8247765
165.88165728121923738215.7236698
174.13860103123841434116.6191498
184.29729681103ND48415.7174497
191.562061044874482710.559.997
Table 2. Membrane compositions and the label for the corresponding ion-selective electrode (ISE).
Membrane Components ISE
PVC (wt.%)PlasticizerIon Exchanger
Compound(wt.%)Compound(wt.%)
133.1NPOE66.4KTClPB0.51
232.9NPOE66.6TDMACl0.52
332.9DOS66.6KTClPB0.53
432.8DOS66.7TDMACl0.54
531.6TCP67.9KTClPB0.55
632.7TCP66.8TDMACl0.56
Table 3. Slopes between the two last concentrations tested for each salt.
Slope (mV/dec)
SaltISE 1ISE 2ISE 3ISE 4ISE 5ISE 6
NaCl37.9−36.556.5−39.154.9−43.2
KCl47.9−40.054.1−42.352.9−47.3
CaCl211.2−37.545.2−41.526.3−41.9
MgCl2−41.136.6−45.325.0−42.6
HCl55.9−56.772.3−60.371.2−60.9
KNO348.2−53.454.0−53.152.2−56.0
Na2SO429.9−1.350.7−23.750.3−0.4
NaHCO357.1−57.165.9−24.965.5−41.1
Table 4. Fitting coefficients ( w k ) and offsets observed for each parameter (conductivity and ions’ concentrations) in the linear model prediction.
w k
ParameterISE 1ISE 2ISE 3ISE 4ISE 5ISE 6Offset
Conductivity (mS/cm)–72.65–26.6347.063.6752.72–3.53–0.175
Cl (ppm)–20,855.3–6553.514,343.8374.613,634.3–3064.03.33
NO3 (ppm)1443.2–1773.5–627.3–343.1–281.4–2745.0–39.71
SO42− (ppm)29,121.5–16,409.0–9655.8–18,257.725,536.420,067.4–633.0
HCO3 (ppm)13,031.13584.71315.3–16,430.8–5422.6729.073.12
Ca2+ (ppm)9770.9–9432.7–8532.1936.99995.46369.6–130.0
K+ (ppm)62.0522.65245.4–148.3138.6129.9–0.713
Mg2+ (ppm)464.0–704.82134.4–431.22068.3329.2–11.18
Na+ (ppm)–4718.6–2909.17196.2–182.16407.7–1145.5–25.46
Table 5. Quality parameters for each parameter (conductivity and ions’ concentrations). R2: coefficient of determination, proportion of variance explained by the predictor. CC: correlation coefficient between true and predicted values.
CalibrationCross-Validation
ParameterR2CCR2CC
Conductivity (mS/cm)0.890.940.810.91
Cl (ppm)0.860.930.770.88
NO3 (ppm)0.690.830.280.63
SO42− (ppm)0.700.830.220.57
HCO3 (ppm)0.150.38−0.27−0.03
Ca2+ (ppm)0.740.860.240.58
K+ (ppm)0.700.830.490.72
Mg2+ (ppm)0.770.880.640.81
Na+ (ppm)0.860.930.760.88
Table 6. OLS models and cross-validation accuracy. CC: correlation coefficient.
ParameterModelCross-Validated R2CC
Conductivity (mS/cm)−0.58 + 118.3 ISE50.770.89
Cl (ppm)−24,502.3 ISE1 + 33,680.8 ISE50.730.86
NO3 (ppm)−23.7 − 1610.3 ISE2 − 2285.0 ISE60.330.66
SO42– (ppm)−462.6 + 22,310.4 ISE1 − 28,551.2 ISE3 + 52,715.5 ISE50.340.64
HCO3 (ppm)18,837.6 ISE1<00.01
Ca2+ (ppm)−156.8 + 8436.1 ISE1 − 14,265.8 ISE3 + 20,363.0 ISE50.510.73
K+ (ppm)2.1 + 345.5 ISE30.490.73
Mg2+ (ppm)4354.0 ISE50.630.80
Na+(ppm)−3651.9 ISE1 + 16,730.3 ISE30.730.87
Disclaimer/Publisher’s Note: The statements, opinions and data contained in all publications are solely those of the individual author(s) and contributor(s) and not of MDPI and/or the editor(s). MDPI and/or the editor(s) disclaim responsibility for any injury to people or property resulting from any ideas, methods, instructions or products referred to in the content.