Abstract
DNA identification is possible by detecting its components through vibrational spectroscopy. Conventional Raman, Surface-enhanced Raman spectroscopy (SERS) and Tip-enhanced Raman spectroscopy (TERS) have shown a high capacity for the exploration of different molecules and materials (semi-conducting material, carbon nanotubes and biologicals molecules as DNA, proteins). Their applications extended to biological systems and brought significant information to this field. This review summarizes a high number of studies and research conducted with conventional Raman, SERS and TERS on every DNA component starting from the four different nucleic acids in their different forms (nucleosides, deoxyribonucleosides, deoxyribonucleotides) to their biological interaction to form one and double DNA strands. As SERS has an advantage on conventional Raman by exploiting the optical properties of metallic nanostructures to detect very small quantities of molecules, it also clarifies the DNA structure’s orientation in addition to its composition. It also clarifies the influence of different parameters, such as the presence of a spacer or a mutation in the strand on the hybridization process. TERS was shown as a relevant tool to scan DNA chemically and to provide information on its sequence.
1. Introduction
In recent years, for its valuable functionalities, deoxyribonucleic acid (DNA) was taken as a bridge between material sciences and biological systems [1]. DNA polymer has been considered as a genetic material since 1940. Then, it was found that it is sequestered in the nucleus in eukaryote cells. The organism’s genetic information is stocked in the DNA strands under a chemical form. These genomic sequences are able to hybridize as pairs formed from complementary genes [2]. From 1953, DNA information encoding was possible. DNA has the capacity to synthesize proteins in organisms thanks to their replication potential in the same organism. Also, genes’ information is copied and transmitted from one generation to another. These last two operations could generate a default in the transcription, causing several heredity diseases [3,4]. Due to the extensive knowledge on its composition, its structure and its interaction with other biological molecules such as proteins, DNA is now the subject of many scientific research studies. DNA interaction with the protein is the key to transcriptional control, DNA replication, repair and chromosome management [5]. DNA can also be used in diagnosis to detect and quantify diseases and pathogens and can also improve drug design.[6,7]. For its various characteristics, it was obvious to look for the nature, the composition and the function of the DNA through several techniques.
It is therefore a huge technical and biological challenge to develop robust and reliable methods to observe the structure and the conformation of DNA as well as to detect structural variations of DNA with a high sensitivity, since the lack of these biological molecules contained in a sample can be impacted by the substance’s interference [8,9,10]. Until now, numerous methods have been developed, such as fluorescence [11] or ELISA [12], but such techniques can only be used to detect DNA or its hybridization with another strand. They do not provide any information on the secondary structure of single or double DNA strands at the molecular level. Infrared absorption [13,14] and Raman spectroscopy as vibrational spectroscopies can give information on the chemical groups and on the DNA conformation. But when the spectroscopical cross section as well as the signal is low, it implies the use of a large amount of DNA molecules and the measurement of an average IR or Raman signal. To improve the signal and reduce the number of molecules to probe, one can use Surface-Enhanced Raman Scattering (SERS) [15].
In this review, after a short description of the DNA’s structure and composition, we present its characterization using Raman spectroscopy and SERS. Thus, we aim to propose an overview on the information provided by these two methods on the structure of the DNA and its constituents.
2. Raman Spectroscopy, Surface-Enhanced Raman Spectroscopy and Tip-Enhanced Raman Scattering
2.1. Conventional Raman
The Raman effect was discovered by the Indian physicist Sir Chandrasekhar Venkata Raman in 1928 [16], for which he received the Nobel Prize in Physics in 1930. When a monochromatic light irradiates a molecule, a large part of the radiation will be scattered elastically while a small part will be scattered inelastically (1 photon on 107). The latter is called Raman scattering, whereas the former is called Rayleigh scattering. The difference between the energy of the radiation and the energy of the inelastically scattered radiation corresponds to the energy of the vibrational modes of the molecule. These modes are specific for each molecule and the Raman spectrum constitutes a vibrational fingerprint which cannot be confused with any other. Raman spectroscopy also provides structural information, especially on complex biological systems, through the identification of individual atom groups or molecular bond changes [17]. Raman measurements can be carried out on solid-state samples (crystalline, powder, etc.) but also in liquid conditions [18,19], which is an advantage for studies of biological systems.
In Raman spectroscopy, the phenomenon of fluorescence can be challenge, as it can interfere with the Raman signal. Fluorescence is a process where molecules absorb light energy and subsequently emit it as light of a different wavelength. This complicates the detection of the Raman signal, which is typically much weaker than the fluorescence signal, making it difficult to analyze the specific molecular vibrations under study. Such phenomena occurs essentially at wavelength in the blue and green range as 488, 514 or 532 nm. However, such an effect is only observable when laser-excited molecules can absorb the energy of photons, inducing a transition between electronic states within molecules. This phenomenon does not necessarily occur with all biomolecules and, more specifically, with DNA strands. One approach to address the issue of fluorescence in Raman spectroscopy is to use a higher excitation wavelength (785 nm, for instance) that is less likely to excite fluorescent molecules.
2.2. Surface-Enhanced Raman Scattering
The technique is limited by the low Raman cross section of biological molecules [20,21,22]. This drawback can be overcome thanks to Surface-Enhanced Raman Scattering. SERS phenomenon was first observed by Fleischman et al. in 1974 [23]. These authors detected a highly enhanced Raman signal of the pyridine adsorbed on a roughened silver surface of silver substrate. In 1977, Albrecht et al. and Jeanmaire et al. demonstrated that the Raman signal enhancement observed in this case was related to the optical properties of the nanostructured electrode [24,25]. The SERS signal can be 1010 orders of magnitude more intense than the Raman signal, allowing for [26] single-molecule detection.
Raman signal enhancement is dependent on and proportional to two factors: the first one is the molecule polarizability and the second one is the electric field amplitude. The polarizability increase refers to a chemical enhancement (CE) and the electric field increase represents the electromagnetic enhancement (EE) [27]. The electromagnetic enhancement is the result of the excitation of the localized surface plasmons (LSP) of metallic nanoparticles, where the plasmon is the excitation of the free electrons weakly bounded to the metal atoms by photons or electrons. As the LSP has an evanescent nature, the electric field is confined and highly localized at the vicinity of the nanoparticle’s surface. The electromagnetic enhancement contributes mainly to the SERS effect with Raman a gain up to 108 [28,29]. The chemical enhancement factor is estimated to be limited to one or two orders of magnitude. This chemical effect depends on the nature of the molecule, its electronic structure and its interaction with the metal surface (adsorption, chemisorption, etc.). All these parameters can induce a modification and an increase in the polarizability and, as a consequence, in the Raman signal [30].
Since the discovery of Surface-Enhanced Raman Spectroscopy (SERS), significant efforts have been made to develop fabrication methods that can produce reproducible and reliable substrates. Several nanofabrication techniques have been employed to achieve precise structural arrangements and geometries for SERS applications. These techniques include electron beam lithography, laser interference lithography, UV photolithography, scanning-probe lithography, electro-oxidative lithography and block copolymer self-assembly. The key advantage of using these patterning approaches is that they allow for precise positioning of nanofeatures with specific geometric attributes. This precision helps to create a surface with a large number of plasmonic hotspots, which are formed by narrowly separated nanogaps, sharp valleys/vertices and edges. These techniques facilitate the achievement of highly homogeneous and uniform patterned arrangements, leading to enhanced and consistent Raman signals [31,32,33].
SERS has been widely used in biology, particularly in medical applications for diagnostics, studying chemical and biochemical structures (biomarkers, cancer cells) and, in recent years, to detect and characterize single or double strands of DNA [34,35,36].
The main objectives of these studies were to understand the relation between the DNA’s functions and its structure [18].
2.3. Tip-Enhanced Raman Scattering
Tip-Enhanced Raman Scattering (TERS) is a powerful technique for nanoscale chemical analysis and the identification and observation of single molecules. It enables the extension of the Surface-Enhanced Raman Scattering (SERS) effect beyond nanostructured metallic substrates to other surfaces, such as smooth metal surfaces with molecules adsorbed on them. This is achieved by externally delivering the electromagnetic enhancement through the illumination of an individual Ag or Au nanoparticle placed in close proximity to the surface.
In TERS, the Raman signal is significantly enhanced by employing a sharp metallic tip which is commonly employed in scanning tunneling microscopes (STMs) or atomic force microscopes (AFMs), which creates a highly enhanced field at its apex [37,38,39]. The apex of the tip creates a highly amplified field, resulting in the enhancement of the Raman signal at the nanoscale when positioned above a molecule. This method can achieve a lateral resolution as fine as 10 nm. Additionally, since the vertical position and horizontal movements of the tip are controlled by the piezo elements and electronics of a scanning probe microscope (STM or AFM), the surface topography can also be recorded. TERS introduces a new dimension to SERS by enabling 2D chemical imaging with nanometric optical resolution. Due to its ability to provide higher resolution and single-base sensitivity, TERS is a valuable technique for DNA analysis [40,41].
3. DNA
3.1. DNA Composition
In 1869, Friedrich Miesche demonstrated that genetic information is contained in 23 pairs of chromosomes found in the cellular nucleus [42]. Each pair consists of a long chain composed of two strands known as deoxyribonucleic acid (DNA). Watson and Crick further demonstrated that DNA forms a helical structure. A DNA strand is a nucleic acid characterized as a polymeric chain of nucleotides. A nucleotide consists of a nitrogenous base connected to a monosaccharide (called deoxyribose, with the chemical formula C5H10O4 in the case of DNA) by a glycosidic bond and attached to a phosphate group by an ester bond (Figure 1). The combination of a base and a monosaccharide is referred to as a nucleoside. A nucleoside can be either a ribonucleoside, if the nitrogenous base is linked to a ribose sugar, or a deoxyribonucleoside, if it is attached to a deoxyribose sugar [43]. Similarly, a nucleotide can be a ribonucleotide if it is attached to a ribose sugar, or a deoxyribonucleotide if it is linked to a deoxyribose sugar. There are four types of nitrogenous bases: adenine (A), cytosine (C), thymine (T) and guanine (G) (Table 1). Adenine and guanine belong to the pyrimidine family, while cytosine and thymine belong to the purine family. The glycosidic bond connects adenine and guanine through nitrogen N9, and cytosine and thymine through nitrogen N1 (Table 1). Pyrimidine bases pair with purine bases (T with A, and C with G) through hydrogen bonds [34], forming double strands of DNA (Figure 2b).
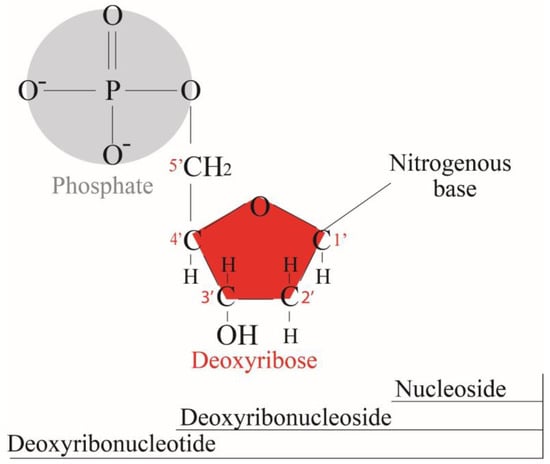
Figure 1.
Deoxyribonucleotide structure with numbered carbon atoms in the deoxyribose.

Table 1.
Nitrogenous bases’, nucleosides’ and nucleotides’ compositions and structures. Reproduced with permission from Elsevier.
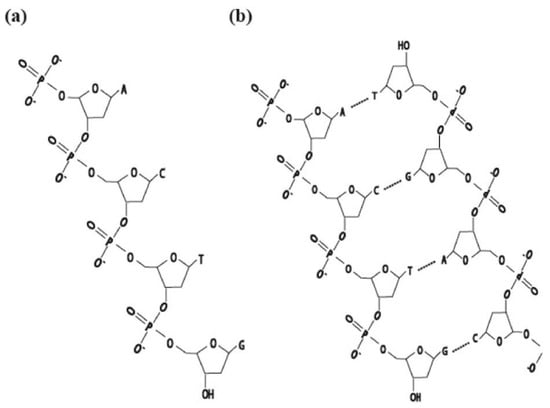
Figure 2.
(a) DNA single strand, (b) DNA double strand, complementary nucleosides A–T, G–C.
The phosphate groups constitute the backbone of the strand. The deoxynucleosides are bound to the phosphate backbones made of phosphodiester groups to form nucleotides (Figure 1). The nucleotides can then bind together to create a chain to form a single-strand DNA. The succession of the bases forms the DNA sequence. The short chains of deoxynucleotides are named oligonucleotides and the order of the oligonucleotides determines the genetic information.
3.2. Double-Strand DNA
The double strand is constituted from two single-stranded DNAs (ss-DNAs). The ss-DNAs hybridize in a complementary way through hydrogen bonds [44]. The double-stranded DNA (dsDNA) forms a double helix through the bonding of two complementary bases of adenine with thymine (A–T pair) and guanine with cytosine (C–T pair) (Figure 2). It has a 5′-3′ polarity, representing the sequence direction of nucleic acid synthesis. The pentose sugar ring of the nucleotide has a phosphate group at its end attached to the 5′ carbon of the deoxyribose ring and has an unmodified 3′ end from deoxyribose-OH substituent.
Double DNA strands exist in three forms: A, B and Z [45].
- -
- B-DNA is a double helix in a right-handed step with a diameter of 2 nm and forming one major groove and one minor groove. One round of a helix (one turn) is equal to 10 base pairs and to 3.4 nm.
- -
- A-DNA appears when humidity is lower than 75%. It is, then, uncommon in normal physiological conditions. The helix is larger with a diameter of 2.3 nm, whereas one round has a length of 2.86 nm for 11 base pairs.
- -
- Z-DNA is a left-handed helix without grooves and having 12 bases pairs per round with a 4.56 nm length and a diameter of 1.8 nm. It is unstable and, thus, hard to be observed. It can be contained in bacteria, eukaryotes and viruses.
4. Raman Spectroscopy on DNA Structures
Raman spectroscopy has been employed to examine the structure of DNA in relation to various factors such as the excitation wavelength, the molecular environment (in buffer or in a dry state), temperature and concentration [46].
In order to investigate the vibrational behavior of DNA, each component of the DNA molecule (bases, nucleosides or nucleotides) was characterized. Consequently, the Raman spectrum of each base was measured to identify its specific vibrational features. Subsequently, the Raman spectra of nucleosides and nucleotides were examined to identify the vibrational bands resulting from the presence of sugar and phosphate groups. These assignments were crucial for comprehending the Raman spectrum of DNA.
4.1. DNA Base Raman Spectrum
4.1.1. Adenine
Mathlouthi et al. recorded the Raman signal of adenine using a Spex 1400 double monochromator and a Spex sample chamber [47]. A 514.5 nm excitation wavelength of a spectra Physics model 165 laser was used on adenine in solid state and in solution. The solutions were obtained by dissolving 2-deoxy-D-eryhro-pentose in distilled water.
Spectra of adenine in a solid state (Figure 3) and in solution exhibited intense bands at 728 cm−1 and in the region 1400–1200 cm−1. They assigned the 728 cm−1 band to the (C-C)/(C-N) in-phase stretching modes, the 1254 cm−1 to the (C-NH2) stretching mode, the 1332 cm−1 to the (C-N) and (C=N) stretching modes and the 1368 cm−1 to the (C8-H) and (C2-H) out-of-plane bending modes [48]. For the adenine in solution (Figure 3b), similar bands were observed with some shifts and shape modifications.
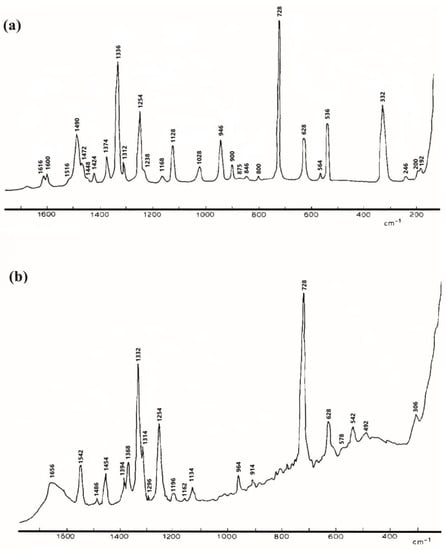
Figure 3.
Raman spectrum of solid adenine (a), and adenine in solution in sodium hydroxide (b). Reproduced with permission from Elsevier [47].
4.1.2. Guanine
The solid guanine measured in the same conditions as adenine showed a very strong band at 642 cm−1 assigned to breathing mode of purine ring (Figure 4) [48]. The Raman spectrum also showed strong bands at 928 cm−1 assigned to (N-C=N) and (N-C-N) bending modes, at 1228 cm−1 for (C2-NH2) stretching mode, at 1258 cm−1 for (C5-N7) and (C4-N9) bending modes, at 1354 cm−1 and 1348 cm−1 for (C8-N-H),(C8-H) bending modes and (C8-N) stretching mode and at 1542 cm−1 for (C=C) stretching mode [48].
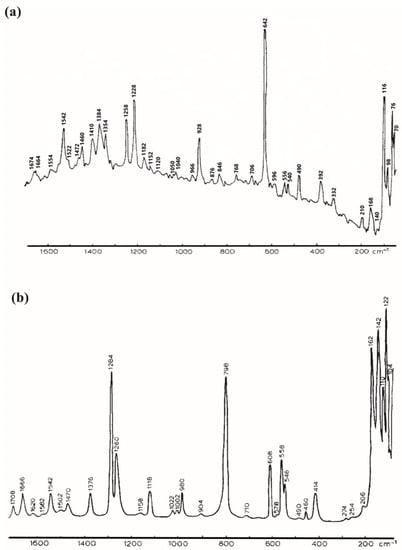
Figure 4.
Raman spectrum of guanine ((a), reprinted/adapted with permission from [49]) and cytosine ((b), Reproduced with permission from Elsevier [48]).
4.1.3. Cytosine
For the Raman signal of solid cytosine under the same conditions as adenine [47], the spectrum can be separated into three regions: the 1800–1200 cm−1 region corresponded to double and local symmetrical vibrations between two atoms, the 1200–800 cm−1 one concerned the out of ring vibration and the bands observed below 800 cm−1 were assigned to skeletal vibrations (Figure 4). The strongest bands were observable at 798 cm−1, 1260 cm−1 and at 1284 cm−1 and were assignable to the breathing mode, the (C4-N4) stretching mode and the (C2-N1) and v(C6-N1) stretching modes, respectively [49].
4.1.4. Thymine
Zhang et al. studied the thymine in solid and in liquid (solution at 0.01 mol/L) with an excitation wavelength of 514 nm [50]. They obtained an intense spectrum for solid and a weak one in solution. The two main bands appearing at 1369 cm−1 and at 1672 cm−1 were assigned to N-H and C-H in-plane bending and to the C=O stretching coupled to N–H and C–H asymmetric bending, respectively [50].
There were similar bands between nucleotides that corresponded to similar vibrations. For the adenine and the guanine, the bands between 310 and 390 cm−1 were assigned to the bending of the carbon in interaction with H2 and the nitrogen in interaction with other bases. The bands between 930 and 970 cm−1 represented N-C=N stretching, and the bands at 1570–1585 cm−1 corresponded to the stretch of the same couple of carbons. This similarity between bands relied on the fact that they were purine bases. Also, for cytosine and thymine, there were some close bands corresponding to the ring breathing mode between 735 and 815 cm−1 and to the stretching of C=O and the ring atoms between 1655 and 1675 cm−1.
4.2. Nucleosides’ Raman Spectrum
Associated with the monosaccharide, the nitrogenous bases formed the nucleosides. For the saccharide alone, Cramona et al. studied the Raman signal of D-ribose in a solid state and in aqueous solutions with a 514.5 nm excitation wavelength [51]. The spectrum showed intense peaks at 544 cm−1 (symmetric ring band), 874 cm−1 (not assigned by the authors), 1078 cm−1 (CO and CC stretching), 1120 cm−1 (CO stretching), a medium band at 676 cm−1 (OCO elongation), 594 cm−1 (CCO and CCC elongation) and a weak band at 644 cm−1 (OCO elongation) [51].
4.2.1. Deoxyguanosine and Guanosine
Nishimura et al. [52] conducted investigations on the Raman spectra of solid guanosine moieties. The researchers measured the spectra of solid guanosine crystals using an excitation wavelength of 514.5 nm, within the range of 550 to 700 cm−1. They observed for guanosine constituted from guanine and ribose one strong Raman band around 650 cm−1. For guanosine moieties, they observed bands between 600 and 700 cm−1. They assigned them to the ring breathing mode of the guanine. These Raman bands were shifted compared with the one observed with the guanine alone. This indicates that the presence of the ribose ring inherently influenced the vibration of guanine, and the vibrational coupling between ribose and guanine relied on the conformation of the ribose [52]. Additionally, the ribose bands reported by Carmona et al. were also observed in this spectral range.
4.2.2. Cytidine
Mathlouthi et al. performed Raman studies of cytidine. It was purchased from Sigma (St. Louis, MO, USA) without additional purification [49]. The Raman spectrum of cytidine showed a higher number of bands than that for cytosine (Figure 5), especially between 800 and 1200 cm−1 (Figure 5). The most intense bands at 1209 and 1252 cm−1 corresponded to the cytosine vibrations. The band at 792 cm−1 was also assigned to the base itself [50]. In the continuity of the studies on cytidine, the complete Raman spectrum of cytidine (purity 99% from Chem-ipex) was measured for the first time by Lee et al. with a 514.5 nm excitation wavelength. The sugar modes were observed at 625, 843, 858, 1195, 1249 and 1263 cm−1 [53]. If we compare Table 2 and Table 3, the ring breathing modes of cytosine and cytidine were the same between 735 and 815 cm−1. The 850 cm−1 band was related to N-C-N stretching, as discussed by Jang et al., whereas the band at 858 cm−1 corresponded to C-N1-C [54], where N1 is where the atom links to the sugar. A new band was also observed for the cytosine at 1194 cm−1, representing C-N1 stretching [49]. A series of bands located between 1240 and 1300 cm−1 corresponded to the combination of cytosine with ribose.
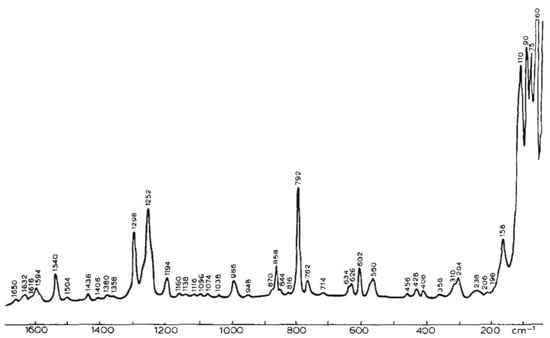
Figure 5.
Raman spectra of cytidine in solid state (Reproduced with permission from Elsevier [49]).
4.2.3. Thymidine
The Raman spectrum of thymidine (Figure 6) was totally different from the thymine one [55]. In fact, the ribose affected the spectrum especially between 800 and 1200 cm−1. The spectrum changes are clear, with frequency shifts and relative intensity variations due to the deoxy sugar structure. The principal variations came from the stretching (1232 cm−1) and the deformation of the glycosylic bond (C1-N1). The bands at 1068 cm−1 and 1006 cm−1 were assigned to the elongations of (N1-C1-H) and (O4-C1-H) [55]. We have to mention that N1, having the strong bands, is the one that links to the sugar.
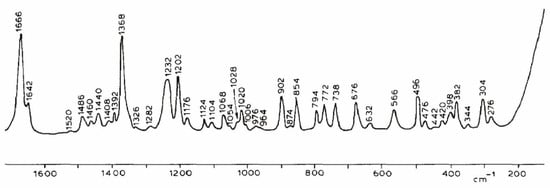
Figure 6.
Raman spectrum of solid thymidine (Reproduced with permission from Elsevier [56]).
4.3. Nucleotides’ Raman Spectrum
The phosphate group plays a crucial role in forming the backbone of the DNA chain. When combined with a nucleoside, it constitutes a nucleotide. The presence of hydrogen bonds, both intra- and inter-molecular, within the phosphate group can have an impact on the Raman spectrum. It is worth noting that the literature primarily includes studies focused on adenosine linked to phosphate groups.
In a study conducted on adenosine mono, di and triphosphate (AMP, ADP and ATP, respectively) purchased from the Nutritional Biochemical Corporation, the influence of the number of phosphate groups and of the pH (0.5 to 13.5) were studied in aqueous solution. For Raman measurements, they used a 632 nm excitation wavelength.
At pH = 6, the spectra of the different adenosines with different phosphate groups exhibit several features at 1125 cm−1 and between 800 and 920 cm−1. The AMP spectrum was significantly different from the polyphosphate one.
By changing the pH, the region between 600 and 1200 cm−1 was affected: the ADP and ATP presented a shoulder to the strongest band at 727 cm−1 but not the AMP. This change was explained by the collective vibration of the phosphate group [56].
In a study conducted by Forrest et al. on adenosine 5′-monophosphate (5′-AMP), Raman spectra were measured in solution with a 488 nm laser incident beam [57]. The authors showed that the stretching frequency of O-P-O (i.e., phosphate group that links the deoxy-nucleosides together in the DNA strand) is influenced by the angle bond between its atoms. They also found that the substitution of the cycle along the phosphate affects the frequency intensity [57].
4.4. Double-Stranded DNA Raman Spectrum
An essential aspect of double-stranded DNA is its conformation and flexibility, which are influenced by both the nucleotide sequence and the molecular environment [20]. Following the description of the Raman spectra of the individual components comprising DNA, we can now shift our focus to the Raman characteristics of the entire molecule. This analytical approach offers valuable qualitative insights into the secondary structure of DNA.
Benevides et al. focused their research on A, B and Z DNA forms in crystal and solution. In this section, the explications will be about B-DNA, as it is the most common form.
In 1988, they studied the Raman spectra of a B form, self-complementary hexamer formed from oligonucleotides d(CGCGCG) dissolved to a concentration of 24 mM in 0.1 M NaCl with a pH 7 and another one with a T mismatched d(CGCGTG) dissolved similarly in 0.2 M NaCl. The Raman spectra obtained were between the 300 and 1800 cm−1 range with an excitation wavelength of 514 nm. The main Raman bands were assignable to the bases: 784 and 1182 cm−1 to the C base, 1486 and 1575 to the G base and 680 cm−1 to the T or G base (Figure 7). Some bands were also assignable to the backbone OPO conformation of B-DNA as the 1091 and 832 cm−1 bands (table in Figure 7). Thus, the DNA strand Raman spectrum was mainly composed of the bands of the bases and of the backbone. The spectra difference in Figure 7 shows that the modification of the sequence induced a modification of the band intensity of the base (C band at 784 cm−1 and T band at 680 cm−1). Moreover, the 832 cm−1 band intensity of d(CGCGTG) is almost 40% weaker than the one of d(CGCGCG). Therefore, 40% of OPO groups of d(CGCGTG) have a different conformation to those of d(CGCGCG). They concluded that the mismatched sites imposed on the base pairing a configurational variation in the B backbone [58].
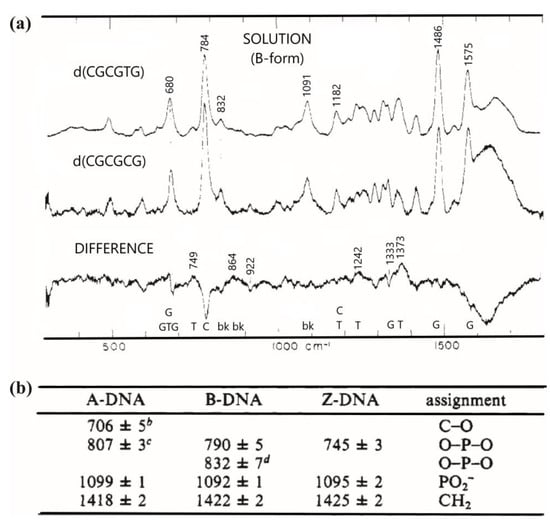
Figure 7.
(a) Raman spectra of DNA in B form in solution between the range 300 and 1800 cm−1 of B-DNA. d(CGCGTG) in the top, d(CGCGCG) in the middle and the spectrum of d(CGCGTG) minus d(CGCGCG) showing the computed difference down. Label of “bk” here represents OPO groups of the B-DNA backbone and A, C, G or T, corresponding to the bands of the nucleosides; (b) the table showing the mode frequencies in cm−1 extracted from Raman spectra of known structure of DNA crystals [from Thomas and Wang (1988)] (adapted with permission from [58]).
In order to understand the Raman spectrum of the B-form DNA and to compare it with the spectra of the two other forms (A and Z), Benevides et al. studied the oligonucleotide d(CGCAAATTTGCG) that crystallizes in B-form. To obtain DNA in solution, the oligonucleotide was dissolved in NaCl buffer solution. The samples were excited with a 514.5 nm laser (200–300 mW). In solution, the spectrum was different from the one of the crystal (Figure 8). Most of the spectral differences were observed in the 600–900 and 1200–1400 cm−1 ranges. These ranges are sensitive to the fingerprints of the nucleoside [59].
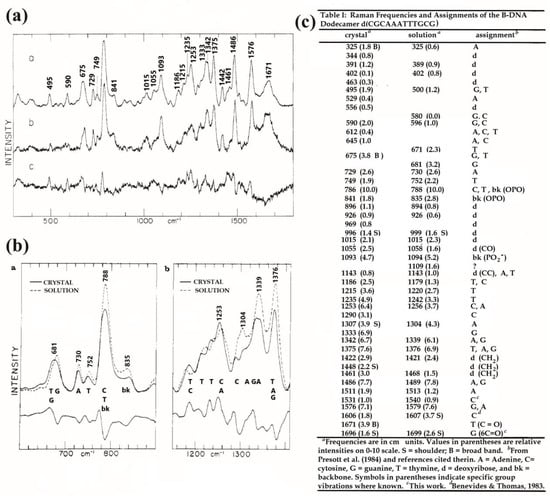
Figure 8.
(a) Raman spectra of the oligonucleotide d(CGCAAATTTGCG) in B-form (1): spectrum in crystal a, in solution b, and difference c between a and b; (b) comparison of the Raman spectra of the oligonucleotide d(CGCAAATTTGCG) in B-form in crystal and in solution; (c) table showing the frequencies in cm−1 corresponding to the peak positions of different B-DNA Raman bands. A, C, G and T correspond to the bands of the bases and the backbone groups bk to OPO, P, etc., extracted from earlier studies on mono-oligonucleotides and poly-oligonucleotides [referred from Thomas et al. (1986)] (adapted with permission from [59]).
While B-form DNA does not completely keep its spectrum between crystal and solution states, the authors showed that Z-DNA and A-DNA have the same Raman fingerprints in the solid state and in aqueous solution [59].
As DNA fibers are constituted by oriented molecules, the relative Raman intensity could depend on the orientations of the fiber axis compared with the polarization direction of the incident laser beam. In a study conducted on oriented fibers taken from aqueous gels of DNA calf thymus, the authors compared the Raman spectra of two different forms of DNA: A and B. The Raman spectra were measured with a 514.5 nm excitation wavelength (100 mW) between 300 and 1400 cm−1.
When comparing the Raman intensities of A-DNA and B-DNA fibers, it is customary to ensure that the DNA strands are aligned. This alignment implies that the axis of the DNA fibers is perpendicular to the direction of the incident laser beam and its polarization. By following this approach, the effects of the transition between A and B forms of DNA become evident and significant in the resulting spectrum. The vibration bands at 430, 806 and 1396 cm−1 were present only in the A-form. The band near 834 existed only for the B-form. Many Raman bands experienced significant relative intensity variations and frequency shifts between the two forms. The 1489 cm−1 band in B-DNA shifted to 1483 cm−1 in A-DNA. The O-P-O bending vibration between 400 and 500 cm−1 shifted from 430 cm−1 to 497 cm−1 when transition was realized from A to B form [60].
Detailed information can be extracted from the structures, but the effective Raman cross section of biological molecules is very low. The low signal response does not allow one to detect the molecules at low concentration. Thus, a large concentration (in mM range) of DNA has to be measured. In addition, to monitor the dynamics of the biological structures, a low acquisition time (lower than one second) has to be used. This drawback can be overcome using Surface-Enhanced Raman spectroscopy (SERS).
After the description of the Raman spectra for the different elements of DNA, the SERS spectra will be discussed.
5. SERS
Now, let us shift our focus to the study of DNA and its constituents using Surface-Enhanced Raman Spectroscopy (SERS) (Table 4, Table 5, Table 6, Table 7, Table 8 and Table 9). In SERS, biomolecules are either deposited or attached to metallic surfaces, primarily gold and silver. Within the DNA structure, specific sites such as the nucleosides (including purine, pyrimidine and sugar) and nitrogen groups have the potential to interact with the metal [48,49,61]. In this context, we will explore the influence of various factors on SERS spectra, including the orientation of DNA molecules, as well as the distribution and packing density of molecules on the metallic surface [62]. These factors play a significant role in determining the characteristics and intensities of Raman signals observed in SERS measurements.
5.1. SERS on DNA Bases (Table 5)
5.1.1. Adenine
Thornton et al. studied different nucleic acids (adenine and guanine) in liquid conditions. The solutions were prepared at a concentration of 5.0 mM with buffer (pH between 4 and 7.5) and mixed with silver colloidal nanoparticles [61]. The samples were excited with a 514.5 nm excitation wavelength (100–200 mW). The most intense band was observed at 735 cm−1 and corresponded to the ring breathing mode of adenine. We can note that this mode was red-shifted compared with the one observed in classical Raman (726–728 cm−1, Section 4.1.1) [48]. When adenine was present in an equimolar mixture of different bases (adenine, cytosine and uracil), adenine bands dominated the spectrum. SERS experiments implied that the compounds that showed the highest enhancement were the ones that were preferentially adsorbed on the active sites of the metallic surface [62]. The surface may favor the adsorption of the adenine compared with the other bases.
Potara et al. demonstrated the detection of adenine in the pM range on an SERS substrate based on small clusters of anisotropic silver nanoparticles embedded in a film of chitosan biopolymer and using a 632.5 nm excitation wavelength. They observed an intense band of adenine at 737 cm−1 [63].
5.1.2. Guanine
In the same study conducted by Thornton et al. [61], the guanine gave the second strongest signal after adenine with a strong ring breathing mode at 657 cm−1. The authors suggested that this was due to the structural similarities between guanine and adenine [61]. To understand the attribution of the bands, another study was conducted with Camafeita et al. [64]. On gold and silver colloids with a concentration of 3 × 10⁻⁷ M, a neutral solution of guanine was added. SERS of guanine was obtained with a 647 nm excitation wavelength. The bands with a normal intensity were found at 1705, 1351, 960, 241 and the strongest one at 668 cm−1. They corresponded, respectively, to C=O stretching, (C-N) stretching and (C-H) deformation, (N9-R) and (C-N) stretching, Au-adsorbate stretching and ring breathing modes [64].
5.1.3. Cytosine
In the study conducted by Sanchez Cortés et al. [65], SERS and Raman spectra of the cytosine were compared. SERS spectra of cytosine (purchased from sigma) were measured with a 514.5 nm excitation wavelength in silver and copper colloids in HCl and NaOH solutions (adjusted pH). The majority of the bands observable in the SERS spectrum on silver colloids were the same as the ones obtained with classical Raman. The highest band in the SERS spectrum was close to 800 cm−1 and assigned to the ring breathing mode. New bands appeared on the SERS spectrum obtained with Ag nanoparticles in the range between 1200 and 1300 cm−1 and were assigned to ν(CN) modes of the pyrimidine ring. They also suggested that in this case, the CO was close to the surface since the bands assigned to this group at 1637, 1106 and 601 cm−1 were shifted compared with the classical Raman spectrum. Indeed, the ν(CO) band shifted to a lower frequency at 1637 cm−1 in the SERS experiment, meaning that the double bond character of the carbonyl group disappeared. This implies that the carbonyl group was adsorbed on the metallic surface. The strong intensities of the ν(CN) bands between 1150 and 1350 cm−1 highlight that N1 and N3 atoms of cytosine (Table 1) were also close to the metal surface (Table 1). The enhancement of these in-plane vibrations may be the consequence of a non-planar orientation of the molecule on the silver surface.
5.1.4. Thymine
Zhang et al. [51] compared the Raman and the SERS spectra of the thymine. They measured SERS spectra with a 514.5 nm excitation wavelength (20 mW) on a 5 × 10⁻⁴ mol/L sample of thymine in solution with Ag nanoparticles (NPs) with an added stable medium of a polymer, Carbopol 981NF. They found large differences between the Raman and SERS spectra. The bands observed on the Raman spectrum at 790, 991, 1367 and 1657 cm−1 were observed at 778, 995, 1349 and 1657 cm−1 on the SERS spectrum. They corresponded, respectively, to C–H on C=C wagging, the ring breathing coupled to in-plane -CH3 asymmetric stretching, in-plane bending of N–H and C–H and the stretching of C=O coupled to N–H and C–H asymmetric bending modes. They concluded that all the modes were blue-shifted by about ten cm−1 on the SERS spectrum. In fact, the addition of stable medium to study SERS produced a little impact on the thymine SERS bands compared with the Raman ones. Two intense bands also appeared on the SERS spectrum at 1218 and 1404 cm−1 but were not assigned [51].
The interaction of the molecules with the nanoparticle surface used to make the SERS could modify the band position and intensity compared with the classical Raman conducted on molecules alone. As a result, shifts in band positions as well as variations in intensity could be observed in the SERS spectra.
5.2. SERS of Nucleosides (Table 6)
5.2.1. Deoxyadenosine
Jang et al. studied neutrally charged DNA nucleosides using gold colloidal nanoparticles in aqueous solution [46]. Each nucleoside (3 µM) was added to 20 nM solution of 13 nm diameter gold nanoparticles. The Raman and SERS spectra were measured with an excitation wavelength of 488 nm and of 710 nm (200 mW), respectively. SERS spectra of the deoxyadenosine (dA) showed a strong band at 728 cm−1 that corresponded to the vibration of the adenine ring. The band at 1657 cm−1 was assigned to the scissor’s mode of NH2 and the intense band at 1472 cm−1 to the stretching vibration mode of C=N. The authors assumed that there is a precise configuration that corresponds to a gold surface-adenine complex. In this complex, they suggested that the ring has a perpendicular orientation to the surface when the adsorption of the ring on the surface is insured by the N7 of the imidazole ring or through the atoms N1, N3 of the pyrimidine atom. A third option could be an interaction through the external amin group.
5.2.2. Deoxyguanosine
In the same study realized by Jang et al. [46], deoxyguanosine (dG) showed a strong band at 1642 cm−1 corresponding to the stretching vibration of C=O, which interacts strongly with the surface of the nanoparticles (Figure 9). The SERS bands at 1338, 1486, and 1577 cm−1 could be assigned to C-N stretching and C=N stretching modes of the pyrimidine ring. The authors suggested that dG has a preferential perpendicular orientation on the gold surface through the N1 nitrogen. The 1318 and 1254 cm−1 bands were assigned to the pyrimidine vibration ring mode [46]. According to this study, the main site of the nucleoside interacting with the gold is the N1 nitrogen (Au-N1 stretching mode at 225 cm−1), and they proposed other possible sites of binding of dG to the gold surface through the surface to NH2, C2, N7, C=O and C6.
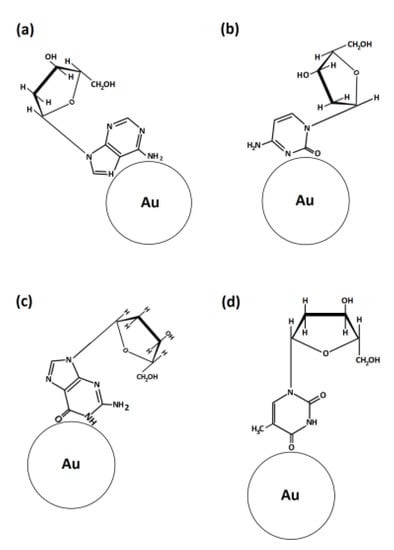
Figure 9.
Scheme of the binding of DNA nucleosides on gold nanoparticle surface: (a) deoxyadenosine, (b) deoxycytidine, (c) deoxyguanosine and (d) deoxythymidine.
All purine derivatives gave a strong Raman band for the ring breathing mode at 725 cm−1, that is, red-shifted at 662 cm−1 on the SERS spectra [46].
5.2.3. Deoxycytosine
The same experiments were conducted on deoxycytidine (dC). The cytosine ring can interact with the gold surface through the N3 nitrogen of the pyrimidine ring (1293 cm−1, Figure 9). The strongest band at 1638 cm−1 was due to the stretching vibration of the C=O group. According to the authors, this vibration comes from the electron delocalization of the C=O group in interactions with the gold surface. It can be explained theoretically by a charge transfer from the pyrimidine ring in dC to the gold atoms (Figure 9). The mode in 1458 cm−1 was assigned to NH2 deformation. The 231 cm−1 was the Au-Cytosine stretching-vibration originating from metal adsorbate interaction [46].
5.2.4. Deoxythymidine
In the same study, Jang et al. found that the band at 1647 cm−1 corresponding to the stretching vibration mode of the C4=O carbonyl group indicates that the molecular orientation of deoxythymine (dT) was perpendicular to the gold surface (Figure 9). Due to electron transfer between the oxygen of C4 and gold atoms from the surface, the band was red-shifted (18 cm−1) compared with the band observed in classical Raman. They also found a strong band at 1233 cm−1 and 1349 cm−1 assigned to the ring-CH3 stretching and C4-N3 stretching vibration of the pyrimidine ring [46].
Due to the scarcity of publications on SERS studies focusing solely on ribose and deoxyribose, it is challenging to determine their specific Raman bands and directly compare their SERS spectra with those of nucleosides. However, to address this limitation, Agarwal et al. reached a conclusion based on nucleoside spectra. They proposed that the SERS bands observed at 959 cm−1 and 1456 cm−1 correspond to the C-C and C=O symmetric stretching modes of the deoxyribose ring sugar [66].
5.3. SERS of Nucleotides
This section focuses on the SERS measurements conducted on nucleotides utilizing gold or silver nanostructures (Table 6).
5.3.1. Deoxyadenosine with Phosphate Groups
Ag
Green et al. studied the SERS signal of diluted solutions (4·10−6 M) of oligonucleotides composed of 18 adenines (oligo A) on silver nanostructures [67]. The samples were excited with a 633 nm He-Ne laser (0.2 mW). They reported two main bands: one at 731 cm−1 corresponding to the breathing mode of adenine and one at 1320 cm−1 corresponding to the in-plane stretching mode of the C6 atom in the adenine ring (Table 1). The authors concluded that in this case, the oligo A was adsorbed on the surface through the C6 atom [67].
SERS experiments were performed by Bell and Sirimuthu to compare adenine, adenosine and 2′-deoxyadenosine 5′- monophosphate (dAMP) on Ag colloids. The three spectra are shown in Figure 10c [62]. Some bands were present in the three spectra with the same positions but with different relative intensities. These intensity variations in SERS were due to different orientations of the molecules on the metallic surface. The two compounds (deoxyadenosine and dAMP) showed similar features in their SERS spectra, indicating that the phosphate group had few influences on the nucleoside vibration modes. The intense bands at 1330 cm−1 and 740 cm−1 corresponded to the ring stretching mode of adenine that is slightly shifted for deoxyadenosine and dAMP. The variation in the SERS spectra between deoxyadenosine and dAMP (deoxyadenosine monophosphate) can be attributed to the presence or absence of the sugar component attached to the base. In the case of deoxyadenosine, which lacks the ribose sugar, certain modes, such as the 1120 cm−1 band associated with CO stretching in ribose (as defined by Carmona et al. [51]), may be absent. The Raman bands associated with the sugar vibrations may be less prominent or completely absent in the SERS spectra, as the sugar molecules have limited access to the adsorption sites on the surface. (Figure 10c). In SERS, there is a first layer effect that is dominated by species directly bound to the surface (in this case, the base was directly adsorbed to the surface) and the phosphate bands only appear for high concentrations (10 ppm) (see the inset showing the high band intensities in SERS spectra in Figure 10c for 10 and 100 ppm).
He et al. studied SERS spectra of polyA formed by 15 A terminated by 5 T as spacer ((5′ T5-A15 3′) with an excitation wavelength of 632.8 nm (1 mW) on Ag nanoparticles (100 nm diameter) formed on TiO2 surfaces (Figure 10e) [68]. The polyA spectrum was dominated by the vibration band at 735 cm−1 that corresponded to the in-plane ring mode. The band at 1330 cm−1 was the stretching mode of the ring. The 1333 cm−1 was assigned to the N7-C5 stretching mode. The modes at 1402, 1463 and 1535 cm−1 corresponded to in-plane vibrational modes and the 687 and 786 cm−1 bands corresponded to out-of-plane vibration modes.
The authors concluded that PolyA were fixed on Ag nanoparticles with the N atom because of its high affinity with the metal. The PolyA can interact with the Ag surface through NH2, N1, N3 and N7, which induce a preferential orientation of the polyA on the surface [68].
Au
In a different way, Kundul et al. studied the effect of pH on the SERS spectra of adenine, Adenine Mono Phosphate (AMP) and poly Adenine (thiolate single-stranded DNA of 24 bases) (Figure 10b) purchased from Integrated DNA Technologies (IDT) [69]. Au nanoshell films (metal nanoshell is formed from a dielectric core and a metallic shell having a thickness in the nanometer order [70]) were used as SERS substrates and the measurements were performed with a laser at 785 nm and a 55 µW laser power.
This study demonstrated that for a determined pH, the SERS spectra of adenine, AMP and poly A are the same, meaning that the studied molecules bind to the surface through the same coordinating sites (Figure 10a) [61]. The SERS spectra were similar and were dominated by the ring breathing mode at 735 cm−1. The bands at 1010 and 1099 cm−1, corresponding to phosphate groups and sugar moiety, respectively, were absent in the SERS spectra but were present in the Raman spectra of Poly A and AMP. C-NH2 in-plane bending was observed at 330 cm−1 in the Raman spectra but at 326 cm−1 in the SERS spectra.
However, the pH influenced the orientation of groups [69]. Adenine is protonated on site N1 at pka = 4.1. This explains that when the pH changes from 2.5 to 11.5, the band at 1342 cm−1 shifts to 1323 cm−1 in SERS spectra for the three molecules [69].
Papadopoulou et al. studied the effect of the concentrations of thiolated and un-thiolated polyA in solution (concentrations of 10−4 to 10−8 M) with Au nanoparticles (50–70 nm diameter) on the SERS spectrum. SERS spectra were measured with an excitation wavelength of 785 nm (0.57 mW). At low concentrations, the skeletal ring modes dominated the 1200–1600 cm−1 spectral range, while for higher concentrations, the in-plane ring modes dominated the SERS spectra. The number of strands grafted at the surface of the nanoparticle determined the orientation of the strand with respect to the surface. The orientation at low concentrations of thiolated polyA was similar to the un-thiolated one. In these two cases, the polyA was laying on the surface, favoring the observation of the bands in the 1200–1600 cm−1 range.
At high concentrations, the thiolated polyA will be standing up to the surface (Figure 10d) [71], inducing the observation of an intense band at 735 cm−1 and a large decrease in the intensity of bands located between 1200 and 1600 cm−1.
5.3.2. Deoxyguanosine with Phosphate Groups
Green et al. measured the SERS spectrum of diluted solutions (4.10–6 M) of oligo G (18G) on silver nanostructures [67]. The samples were excited with a 633 nm He-Ne laser (0.2 mW). The SERS spectrum exhibited two intense bands at 650 cm−1 and 688 cm−1 related to the ring breathing modes [67].
He et al. studied polyG formed by 15 G (5′ T5-G15 3′) on silver surfaces. An intense band at 656 cm−1 corresponding to the in-plane ring stretching mode was observed (Figure 10e). They observed several other bands: the remarkable ones were at 889 cm−1 (NH bending, in-plane mode), at 1295 cm−1 (stretching N7−C8, C2−N3, bending N1−H, in-plane mode), a strong band at 1328 cm−1 related to the in-plane mode referred to the bending of C8−H and the stretching of C5−N7−C8 and a little band at 730 cm−1 that corresponded to the out-of-plane bending mode, (Figure 10e) [68].
5.3.3. Deoxycytidine with Phosphate Groups
Green et al. performed SERS measurements with diluted oligo C formed by 15 C (5′ T5-G15 3′) (4 × 10⁻⁴ M solution) on Ag surfaces [67]. The spectrum in Figure 10e shows a band at 790 cm−1 assigned to the breathing mode of cytosine. A strong band observed at 1023 cm−1 corresponded to the amine group, and the one at 1299 cm−1 was associated with skeleton vibration. The authors assumed that adsorption of the oligo C on the Ag surface was conducted through the C4- amino group [67].
The first band was also observed by He et al. on Ag nanoparticles, as the SERS spectrum of poly C was dominated by a band at 792 cm−1 assigned to in-plane ring-breathing mode (Figure 10e). In-plane vibrations were also observable at 1260 cm−1 (C4-N3 stretching mode), at 1315 cm−1 (skeleton vibration) and at 1484 cm−1 (N1-C6 and N3-C4 stretching modes). One out-of-plane vibration was able to be seen at 688 cm−1 [68].
5.3.4. Deoxythymine with Phosphate Groups
Green et al. demonstrated that spectra of oligo T show an intense band at 790 cm−1, assigned to the breathing mode of the thymine [67].
For He et al., the SERS spectrum of PolyT formed from 20 T (5′ T20 3′) on Ag surfaces showed an intense band at 799 cm−1, representing the in-plane ring-breathing mode, one at 1212 cm−1 assigned to the in-plane stretching mode and two bands at 1312 cm−1 and 1380 cm−1 corresponding, respectively, to the N3-H and C6-H in-plane bending modes (Figure 10e) [68].
Similar features were seen between deoxycytidine and deoxythymine, as they both exhibited a band around 790 cm−1 assigned to the ring breathing mode of thymine. On the contrary, the breathing modes of deoxyadenosine and deoxyguanosine were largely shifted: 656 cm−1 for G base and 730 cm−1 for A base. We can assume that the ring breathing modes were related to the base nature between purine and pyrimidine and their vibration frequencies were not affected by the presence of the phosphate or the sugar. For all nucleotides, the bands related to the ring breathing modes were the strongest in Raman and SERS studies and can be seen as spectral signatures of the nucleotides.

Figure 10.
(a) SERS spectra of adenine (1), AMP (2) and polyadenine (3) at different pH values (i: 2.5, ii: 5.1, iii: 6.5, iv: 8.5, and v: 11.5) and Raman spectra (4) of powder of adenine (i), powder of AMP (ii) and in-solution polyadenine (iii) (extracted from [69]). (b) Atomic composition of molecules of adenine, adenine monophosphate (AMP) and polyadenine (poly A) (reprinted/adapted with permission from [70]). (c) From bottom to top, SERS spectra of adenine, adenosine and dAMP, respectively (Inset: SERS spectra for 10 and 100 ppm concentrations of phosphate) (extracted from [62]). (d) SERS spectra of 24-mer thiolated polyA at concentrations from 10−4 down to 10−8 M (a–e) and of 10−5 M un-thiolated polyA (reprinted/adapted with permission from [71]). (e) SERS spectra of polyA (1, 10−5 M in solution), of polyG (2, 10 × 10−6 M in solution), of polyC (3, 10 × 10−6 M in solution) and of polyT (4, 10 × 10−6 M in solution) Reproduced with permission from Royal Society of Chemistry [68].
5.4. SERS Studies of Single-Strand DNA
In this section, we will focus on the single-strand DNA studied by SERS, including polynucleosides including only one base type as well as complex DNA with sequences of different bases (Table 8). We will also discuss the interaction of the DNA with the metallic surface through the different elements that constitute the nucleotides: the base, the sugar and the phosphate backbones.
Papadopoulou et al. measured SERS spectra of 24 oligonucleotides (poly A, dGMP, poly C and poly T) on Ag nanoparticles with a 785 nm excitation wavelength [72]. They assigned the 737 and 688cm−1 bands to the ring breathing mode of poly A and dGMP, respectively. The one at 792 cm−1 was related to the ring breathing modes of poly C and poly T and the band at 1636 cm−1 corresponded to the carbonyl stretching mode of the poly C (Figure 11a) [72].
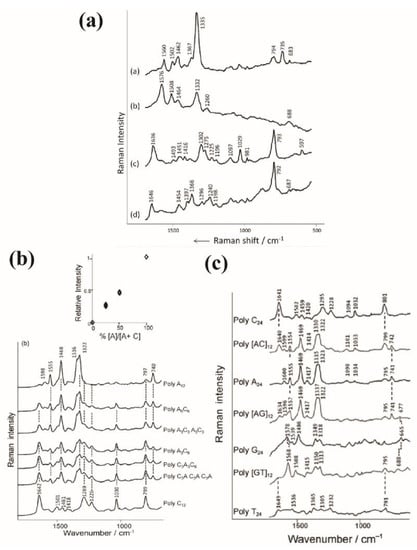
Figure 11.
(a) SERS spectra of 24-mers (10−6 M): (a) poly A, (b) dGMP (10−5 M), (c) poly C and (d) poly T on hydroxylamine-reduced Ag colloid. Reproduced with permission from John Wiley and Sons. (b) SERS spectra of ssDNA sequences (10−6 M) having general formula of poly-AxC12–x on Au colloidal nanoparticles aggregated with MgSO4 (0.1 M). The spectra are presented with the same intensity scale and have been offset for clarity. The insert represents the relative intensities between 740 and 1642 cm−1 bands depending on the composition fractions of A nucleotides in the sequences (extracted from [73]). (c) SERS spectra of 24-mers: poly-C, poly[AC]12, poly-A, poly[AG]12, poly-G, poly[GT]12 and poly-T on Au colloids. The solution concentrations were all fixed at 10−6 M except for poly [GT]12 and poly-T, which were fixed at 10−5 M. The colloids were aggregated with 0.1 M of MgSO4, except for polyG, with 1 M of KH2PO4. Reproduced with permission from John Wiley and Sons [72].
They also studied the sequence of 12-mer (a sequence of 12 nucleosides) with different proportions of adenosine and cytosine using colloidal gold nanoparticles. One can observe that the SERS spectra of the strands including both A and C bases were directly the combination of the A and C SERS spectra. Thus, when the number of A in the heteropolymer increased, the adenosine bands at 1555, 1468, 1336 and 740 cm−1 (ring modes) became more intense, whereas the cytosine ones at 1642 and 799 cm−1 (ring breathing mode) decreased in intensity (Figure 11b) [73]. The SERS intensity of the A and C features were, in fact, proportional to the number of A and C bases (Figure 11b insert).
Such observation was confirmed by the SERS spectrum of poly [AC]12 (24 mer including 12 A and 12 C) with the following sequence: ACA-CAC-ACA-CAC-ACA-CAC-ACA-CAC (Figure 11c).
For poly[AG]12 (AGA-GAG-AGA-GAG-AGA-GAG-AGA-GAG), the SERS spectrum was largely dominated by the contribution of A bands, whereas the G features were nearly not observable (Figure 11c). This means that the SERS intensity of the G base was far lower than the one of the A base.
On the contrary, on the spectrum of poly[GT]12 (GTG-TGT-GTG-TGT-GTG-TGT-GTG-TGT), the G bands were more intense than the T ones. Moreover, several bands were shifted compared with the positions of strands, including only one base.
These results on the different strands composed of several bases suggest that the SERS cross section was the highest for A and C, whereas it was the weakest for T and it was intermediate for the G. The following distribution has, then, been proposed for the SERS intensity: IA ≈ IC >> IG > IT.
In order to investigate the impact of the percentage of each base and the number of nucleosides in a DNA sequence on SERS spectra, Xu et al. conducted SERS measurements on various polybases. However, due to repulsive forces between negatively charged metallic nanoparticles and DNA, which hinder their electrostatic binding, the researchers employed iodide-modified silver (Ag) nanoparticles as an alternative. The studied ssDNAs were constituted of 12 or 40 bases with different base ratios [74].
The SERS spectra of the ssDNAs including only one base exhibited different fingerprints related to their bases (Figure 12a). They were highly similar to the one already observed by Papadopoulou et al. [73] (Figure 11b). A new common band at 1087 cm−1 that corresponded to the symmetric stretching vibration of phosphodioxy P was also observed (Figure 12a). The position of the P band did not change from one sequence to another. The presence of this stretching band indicates that the phosphate backbones were very close to the NP surface of whatever the base was in the ssDNA sequence. This means that the SERS features are related to the bases inside the strand but also to its backbone, depending on its orientation on the metallic surface.
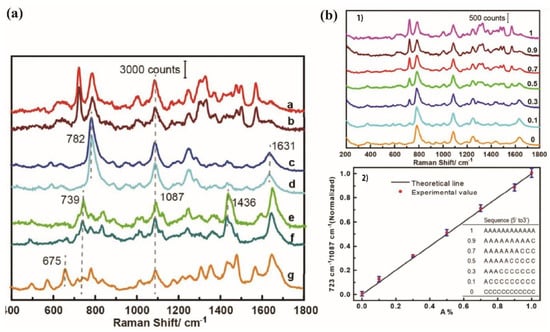
Figure 12.
(a) SERS spectra of PolyBases ssDNA on Ag nanoparticles normalized with P band (1087 cm−1): a—A12, b—A40, c—C12, d—C40, e—T12, f—T40 and g—(TG)12. (b) (1) SERS spectra of different oligonucleotide strands formed from different percentages of adenine A and cytosine C, A% = A/(A + C) = 1, 0.9, 0.7, 0.5, 0.3, 0.1, 0, as mentioned in the graph. The spectra were normalized by the intensity of the band 1087 cm−1 of P (reprinted/adapted with permission from [74]). (2) Evolution of the relative intensity of the 723 cm−1 band compared with the 1087 cm−1 band intensity versus the ratio of A in the oligonucleotides (A%). The ratio of 723 cm−1/1087 cm−1 is equal to 1 for the completely A sequence and to 0 for the completely C sequence. The inserted listed table represents the oligonucleotide sequences (adapted with permission from [74]).
The authors also measured the SERS spectra of sequences of 12 nucleotides including both A and C bases. They modified the sequences by continuously changing the nucleotide ratio between adenine and cytosine from 0 to 100%. The evolution of the intensity of the adenine band at 723 cm−1 compared with the one of the P band at 1087 cm−1 exhibited a linear dependence with the adenine ratio (Figure 12b) [74].
Papadopoulou et al. measured the SERS signal of four different sequences of nucleotides on silver colloids [72]: CTT-TTT-CCT-GCA-TCC-TGT-CTG-GAA-A (DNA-2), CTT-TTT-CCT-GCA-TCC-TGT-CTG-GAA-G (DNA-3), ATA-AAT-CGC-CAT-TCG-TTG-ACT-AA (DNA-4) and ATA-AAT-CGC-CAT-TCG-TTG-ACT-AC (DNA-5) (Figure 13a). DNA-2 and DNA-3 have exactly the same sequence, except the last base is changed from A (DNA-2) to G (DNA-3). For DNA-4 and DNA-5, the last base is changed from A (DNA-4) to C (DNA-5).
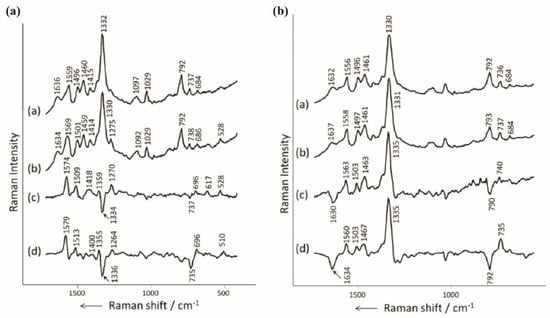
Figure 13.
(a) SERS spectra of (a) DNA-2, (b) DNA-3, (c) subtraction of DNA-2 spectrum to the DNA-3 one and (d) subtraction of PolyA spectrum to the dGMP one from Figure 11a. (b) SERS spectra of (a) DNA-4, (b) DNA-5, (c) subtraction of DNA-4 spectrum to the DNA-5 one and (d) subtraction of poly A spectrum to the poly C one from Figure 11a. All spectra were conducted on aggregated hydroxylamine-reduced Ag colloids with 0.1 M of MgSO4. Reproduced with permission from John Wiley and Sons [73].
When adenine (DNA-2) replaces guanine (DNA-3), the main modification of the SERS spectrum is the shift of the band at 1559 cm−1 (DNA-2) to 1569 cm−1 (DNA-3) (Figure 13a). To have a better insight on the spectral changes, the SERS spectrum of DNA-2 was subtracted to the one of DNA-3. Then, one could assume that the result spectrum was relevant to the two individual nucleotides A and G (The A features were negative peaks and the G features were positive peaks). The calculated spectrum shows negative bands at 1334 cm−1 and 737 cm−1 that corresponded to the adenine vibrations and the positive bands at 1574 cm−1 and 1509 cm−1 were assigned to guanine. This calculated spectrum is similar to the one calculated by the subtraction of the PolyA to the dGMP, observable in Figure 11a.
They used the same methodology for DNA-4 and 5. On the calculated spectrum (DNA-4 spectrum subtracted from the DNA-5 one, Figure 13b), they found that the bands at 790 cm−1 and at 1630 cm−1 corresponding to cytosine were negative and the bands of adenine at 740, 1335, 1463, 1503 and 1563 cm−1 were positive.
They concluded that DNA spectra were directly constituted by the features of the bases of the DNA sequence. Moreover, the mismatch of a single base between two DNA strands can induce spectral modifications and be monitored by SERS [72].
He et al. grafted polyA, polyG, polyC and polyT on Ag surfaces through Ag-N bonds [68]. They wanted to determine the importance of DNA concentration on the SERS intensity and its influence on molecular orientation on the metallic surface. They found that for low polybase concentrations (10 μM or less), all the spectra were dominated by in-plane breathing modes. Due to specific SERS selection rules, the enhanced bands were mainly related to the vibration modes perpendicular to the surface. The authors concluded that the strands were laying on the surface and the nucleobases were oriented perpendicularly to the surface. For Poly A and Poly G, the interaction with the surface was conducted through the NH2 group or the N1, N3 and N7 atoms defining a preferential orientation (bands at positions 735, 1333, 1402, 1463 and 1535 cm−1 for polyA and 656, 700, 850, 889, 957, 1138, 1235, 1295, 1328, 1385, 1468 and 1532 cm−1 for polyG)). For Poly C, this was conducted through the NH2 group and N3 atom, and for Poly T, only the N3 atom was considered (bands at positions 792, 1235, 1280, 1315, 1380, 1472 and 1484 cm−1 for polyC and 706, 799, 1212, 1312, 1385 and 1463 cm−1 for polyT). These in-plane vibrations were enhanced when the nucleobases were perpendicular to the surface.
Contrary to the previous analysis, the presence of out-of-plane bands (687 cm−1, corresponding to the adenine) observed at high DNA concentrations (above 100 μM) indicates the presence of nucleobases parallel to the surface. This means that the DNA strands are more perpendicular to the surface. Describing the orientation and the packing density of immobilized DNA strands, the authors suggested that for large concentrations the DNA are not in 2D distribution, but, rather, heterogeneously aggregated in 3D distribution (Figure 14a) [69].
Figure 14.
(a) Schemes of polybase DNA behavior on Ag surface presenting the relation between concentration, distribution and orientation. On upper illustrations: rectangles represent the nucleotides’ orientation with respect to the Ag surface. (a) DNA lies flat on the surface and nucleobases are oriented perpendicularly to the surface. (b) The DNA is oriented perpendicularly to the surface and the nucleobases are parallel to the surface. Lower illustrations show the distribution evolution of DNA on the surface depending on the DNA concentration. At low concentration (C = 1 μM, left figure), the DNA coverage on Ag is weak, but for optimum concentration (between 5 and 10 μM, middle figure), the distribution of DNA is homogeneously distributed on all the surface. The DNA lie flat at this range of concentration. For higher concentration (C = 100 μM, right figure), the strands are randomly oriented. Some DNA lie flat, whereas others stand up (reprinted/adapted with permission from [68]). (b) SERS spectra of two thiolated DNA sequences adsorbed on AuNP: DNA-1 at 10−5 M (a) and 10−7 M (b) and DNA-2 at 10−5 M (c) and 10−7 M (d). Reproduced with permission from Royal Society of Chemistry[71].
Papadopoulou et al. found that the different orientations of the DNA sequences could affect the relative SERS enhancement of the nucleobase modes [71]. The SERS signal of thiolated PolyA (24 A) on Au nanoparticles (diameter 50–70 nm) were obtained with an excitation wavelength of 785 nm (100 mW). At concentrations higher than 10−6 M, the SERS spectrum was dominated by the 736 cm−1 band of adenine. For lower concentrations, the band at 736 cm−1 nearly disappeared and the spectrum was dominated by two bands at 1337 and 1469 cm−1. Such modifications were interpreted using the orientation of the strands. At high concentrations, the strands should be perpendicular to the surface favoring the observation of the 736 cm−1 adenine band.
For sequences including the four bases (DNA-1: HS-(CH2)6-GAC-TGC-GAC-CAA-CCT-AGC-CTG-CTA-TGA-TGT, DNA-2: HS-(CH2)6-ACA-TCA-TAG-CAG-GCT-AGG-TTG-GTC-GCA-GTC), they found that at concentrations of 10−5 M the adenine bands dominated the spectrum, especially the 736 cm−1 band (Figure 14b). But at a concentration of 10−7 M, the intensity of this band decreased drastically and the bands of the other bases became more visible (Figure 14b) [71]. They suggested that the orientation of strands changes with the DNA concentration. With respect to the metal surface, the DNA strands went from parallel to perpendicular, while the DNA concentration increased. They found that the DNA containing the four bases had the same orientation as that for poly A at high and low concentrations.
The thiol function facilitated the binding of the DNA to the surface and impacted its orientation. The DNA concentration also had an influence on the DNA orientation and, thus, on its SERS spectrum.
5.5. Double-Strand DNA
SERS experiments on nanostructured surfaces gave different results for single- and double-stranded DNA (dsDNA) (Table 9). The interactions between dsDNA and metallic surfaces are governed by electrostatic repulsion, as the nanostructures and the phosphate backbones are both negatively charged. When positively charged species (as spermine) are added in the solution, the adsorption of the negatively charged oligonucleotides on the surface of the nanoparticles is favored as well as the nanoparticle aggregation, which provides a better Raman enhancement [75]. The adsorption of the strands on the nanoparticle surface can induce different orientations of the strand at the surface, such as laying or being perpendicular to the surface, differently exposing the elements (bases or backbone) of the DNA to the surface. The SERS spectrum cannot, then, reflect exactly the same part of the DNA strand from one experiment to another and, as a consequence, the study of DNA strands can suffer from non-reproducible spectra [75].
In contact with silver nanoparticles coated with spermine (Sp), the double DNA strands in contact with silver show three stages of adsorption on the metallic surface: (1) The recognition phase, when the oligonucleotides approach the silver surface to interact with the first phosphate groups and the positive nitrogen atoms of spermine; (2) the relaxation phase, to establish a stable conformation; and (3) the adhesion phase, where the DNA is completely attached. During these stages, the DNA passes from DNA-Sp contact to reach a uniform distance between the DNA and Ag surface to obtain laying DNA conformation (Figure 15a) [76].
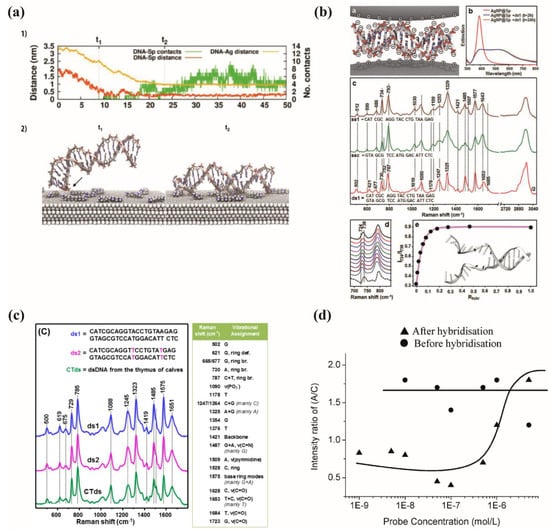
Figure 15.
(a) 1—evolution with the time of incubation of the calculated distance between dsDNA and the silver surface and of the calculated distance between the dsDNA and the spermine molecules. 2—Schemes of the ds DNA between times t1 and t2. The arrow points to the first contact between DNA and spermine (reprinted/adapted with permission from [76]). (b) a—Illustration of double-stranded DNA sandwiched between two AgNP@Sp charged positively, b—AgNP@Sp colloids extinction spectra in the presence of ds1 with a final concentration of 630 ng/mL, taken 2 h and 24 h after DNA addition (for few seconds, the mixture AgNP@Sp+ds1 was sonicated before the acquisition of the spectra). c—Ss1 and ssc (3.15 µg/mL) and ds1 (630 ng/mL) SERS spectra on AgNP@Sp, these spectra were normalized to 1090 cm−1, corresponding to the stretching of P. From 2700 to 3050 cm−1 the SERS spectrum was divided by two. d—Details of the spectral range between 680 and 890 cm−1 of ssc+ds1 mixtures’ SERS spectra with several molar ratios Rhybr = [ds1]/([ds1] + [ssc]) (presented from up to down: 0.011; 0.024; 0.041; 0.063; 0.091; 0.130; 0.189; 0.286; 0.474; 1). The concentration of ds1 was gradually increased from 0 to 630 ng/mL, while the concentration of ssc was directly decreased from 3.15 µg/mL to 0. The dotted spectrum corresponding to the digital subtraction of SERS spectra of ds1 from ssc represented in -c-. e—Intensity of ratiometric peaks I724/I738 as a function of molar ratio Rhybr = [ds1]/([ds1] + [ssc]), (c) SERS spectra of short synthetic double-stranded duplex (ds1 and ds2) with two T mismatches and dsDNA from thymus of calves (CTds). Right table: main vibrational SERS modes of dsDNA. The Ag nanoparticle concentration was kept constant at 0.3 nM. The samples were measured with a final concentration of 0.1 μM, corresponding to 1.3 μg/mL for ds1 and ds2, and 7.8 μg/mL for CTds. (reprinted/adapted with permission from [76]), and (d) ratio of Raman intensities of A/C versus probe concentration adapted with permission from [67], (b) Reproduced with permission from John Wiley and Sons) [75].
5.5.1. Effect of the DNA Hybridization on the SERS Spectrum
Guerrini et al. performed experiments to observe hybridization events using SERS. They used positively charged silver nanoparticles coated with spermine (Figure 15a) [76]. The negatively charged dsDNA binds through a non-specific electrostatic interaction between the phosphate groups or the positively charged nitrogen atoms and the nanoparticle surface. ds-DNA strands are sandwiched in junctions created by nanoparticle aggregation which can be considered as SERS hotspots, leading to an intense spectrum (Figure 15b). They measured the SERS spectrum of two complementary single DNA strands in interaction with the nanoparticle surface.
When single strands of DNA hybridize to form double strands, significant changes are observed in terms of band position, width and relative intensities in the resulting SERS spectra (Figure 15b). These spectral modifications arise from the well-defined hybridization process, where two individual single strands come together to form a self-organized, rigid duplex structure. For instance, a band shift was observed for the ring breathing modes (600–800 cm−1) and the carbonyl stretching modes (1653 cm−1). The adenine band was shifted from 734 cm−1 to 730 cm−1. They demonstrated that it is possible to estimate the ratio of hybridization (number of dsDNA compared with ssDNA) by calculating the peak intensity ratio I724/I738 (Figure 15b). The double strands can be observed at concentrations lower than 1%, and the SERS spectrum is dominated by the dsDNA features when their population is higher than 20% [75].
Moreover, as presented thereafter, various parameters can influence the double-stranded DNA SERS spectra, such as the incubation time and the DNA concentration.
Influence of the Incubation Time
During SERS experiments, it is crucial to allow the molecules sufficient incubation time in solution before measurements are taken. This incubation period is necessary to ensure that the molecules have enough time to adsorb onto the surface of the metallic nanostructure, enabling proper interaction and signal enhancement during the subsequent Raman measurements.
In the study conducted by Herne et al. on HS-ssDNA grafted to gold, the authors showed that the SERS intensity increases with incubation time. They concluded that there is a relation between the number of DNA on the surface and the incubation time. The thiolated DNA cannot hybridize with its complementary after 240 min, representing the maximum time of incubation in their conditions, and the hybridization can no longer occur when the thiolated DNA are tightly packed above a precise concentration of thiolated DNA. In this case, the surface is saturated and the complementary strand cannot access the HS-ssDNA [77].
Influence of the Concentration
Concentration studies play a crucial role in SERS experiments, as they enable the quantitative correlation of spectral changes to the number of binding events that occur during the formation of double-stranded DNA (dsDNA). This approach allows for the characterization and identification of various DNA structures (Figure 15a) [67].
A silver substrate was functionalized with a thiolated DNA strand, AGA AGA AAC CGC AAA AGC—C3—SH at different concentrations (Figure 15d). The same amount of its complementary sequence GCT TTT GCG GTT TCT TCT was added during an incubation time of 18 h to obtain the highest hybridization with the complementary strand. After hybridization, the bands of the adenine at 731 cm−1 and cytosine at 790 cm−1 showed a non-proportional change with the complementary concentration. The intensity ratio (A/(C + T), considered as ratio A/C as T intensity is neglected) for the different concentrations of ssDNA and hybridized dsDNA was almost constant for the DNA alone, but changed after the hybridization. In fact, when the concentration was increased, the intensity of the bands also increased until it reached a maximum. At high concentrations, the formation of a tightly packed monolayer hindered the process of hybridization. This explains why the ratio remained constant for probe concentrations above 10−7 M. The authors concluded that there is an optimum concentration allowing the hybridization to be detected [67].
5.5.2. Orientation
Barhoumi et al. worked on the orientation of double-stranded DNA binding to Au nanoshells and performed SERS measurements with a 785 nm excitation wavelength [78]. The dsDNA was constituted of two complementary sequences; the first one was HS-A20-CGCCGTTAGTCCAACTGGCATGTAGTATCGTCCGATGCAACCAGCGTCAG (SA20N1) and the second one was the complementary strand without the thiol group [78]. All the hybridized dsDNA adopted a rigid rodlike structure [79]. To quantitatively study the direction angle of DNA, they correlated it with the intensity ratio between the vibration band measured at 667 cm−1 (guanine) and the one at the 623 cm−1 band (adenine). At high concentrations, the double DNA strands had a high packing density in a near perpendicular orientation and the adenine mode was more intense than the guanine one (Figure 16A). As the angle of the DNA increased, the guanine band intensity was higher in the spectrum. At low concentrations, there was a low packing density and the DNA was lying down. Figure 16C shows that at low concentrations, the DNA strands were closer to the surface [68].
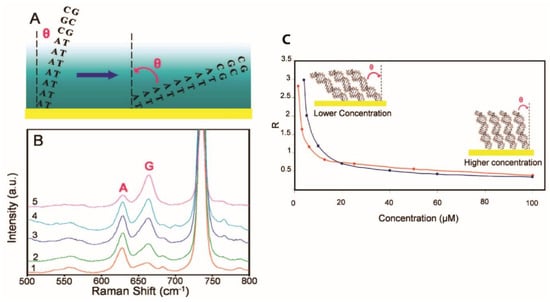
Figure 16.
Evolution of the SERS signal with the DNA orientation. (A) Scheme of the orientation of the dsDNA. (B) SERS spectra at different concentrations of dsDNA. Spectra from 1 to 5 represent 40, 20, 10, 5 and 1.25 µM of dsDNA, respectively. For clarity, spectra are offset. (C) Evolution of the intensity ratio between guanine and adenine bands depending on the DNA concentration (reprinted/adapted with permission from [78]).
The SERS spectrum of DNA is, then, strongly dependent on the orientation of the strand and the intensity of the features can be modified.
5.5.3. Influence of Mutation
Guerrini et al. studied the effect of base mismatches along the DNA duplexes on the SERS spectrum. Fully complementary dsDNA and heteroduplexes were compared [75]. In the heteroduplexes, A replaced G in its extremity (ds2), A replaced C in the beginning of the sequence (ds3) or A rather than C in the middle (ds4) (Figure 17a). They subtracted the SERS spectrum of the original sequence from the spectra of all the other sequences and observed the SERS differences. In ds2-ds1, they found positive bands emerging at 730 and 1507 cm−1 assigned to adenine, whereas the band at 1325 cm−1 corresponding to adenine did not show any changes in its relative intensity. Negative G bands appeared at 620, 675 and 1354 cm−1, 1487 and 1577 cm−1 (Figure 17a). The ds3-ds1 and ds4-ds1 showed similar profiles: positive bands corresponding to A at 730 and 1507 cm−1 and negative bands at 1250 and 1528 cm−1 corresponding to C, an increase in the G bands at 1325, 1487 and 1577 cm−1 and a decrease for the pyrimidine ring breath at 787 cm−1 corresponding to C + T [75]. This study demonstrates that the DNA duplex can be studied using SERS in a low amount with direct information on the genomic sequence. As for ssDNA, the SERS spectrum is constituted of the base features and the band intensities are directly related with the number of bases inside the sequence. Moreover, the SERS spectrum reaches single-base sensitivity.
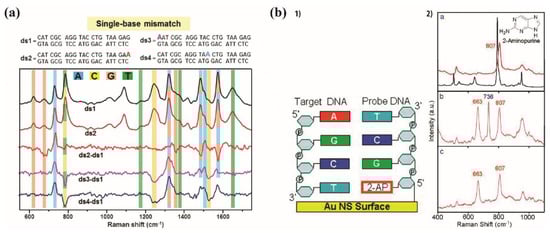
Figure 17.
(a) SERS spectra of ds1, ds2 and subtracted SERS spectra (ds2-ds1, ds3-ds1, ds4-ds1). The subtracted spectra were multiplied by 3 for ds2-ds1, 4 for ds3-ds1 and ds4-ds1. The concentration of the dsDNA was fixed at 630 ng/mL. The frequency positions representing nucleotide bands are colored as follows: the adenine (blue), the cytosine (yellow), the guanine (orange) and the thymine (green). Reproduced with permission from John Wiley and Sons [75]. (b) (1) dsDNA on core–shell nanoparticles (Silica core and Au shell) with an adenine substituted with 2 aminopurines (2-AP), and (2) a—SERS spectrum (black spectrum) and Raman spectrum (red spectrum) of 2-aminopurine base Inset: 2-aminopurine chemical structure. b—SERS spectrum of the target DNA sequence C-S2APN5 hybridized with its complementary S2APN5 probe. c—DNA sequence (CATGTGACCTCTTCTAGATC) hybridized to S2APN5 having a 2-aminopurine. Reproduced with permission from Royal Society of Chemistry [80].
Barhoumi et al. studied DNA duplexes on core–shell nanoparticles (silica core and Au shell) by substituting the adenine with 2 aminopurines (2-AP) in the DNA sequence: S2APN5 (SHC6CGCT/2-AP/GG/2-AP/TCTG/2-AP/CTGCGGCTCCTCC/2-AP/T). The DNA sequence bound the Au shell through a thiol moiety on its 5′ end. SERS was measured at 785 nm and a 0.57 mW laser power. The SERS spectrum of the thermally pretreated DNA was dominated by the adenine breathing mode at 736 cm−1 (Figure 17b). When the DNA was free from adenine, the spectrum showed SERS modes corresponding to the other bases, especially guanine. The sequences with the 2-aminopurine bases did not show any band at 736 cm−1. Then, they detected the SERS spectrum of the S2APN5 hybridized with its complementary C-S2APN5 (ATGGAGGAGCCGCAGTCAGATCCTAGCG). The hybridization was identified by the 736 cm−1 band, while 807 cm−1 was the band corresponding to the 2-aminopurine. The 736/807 band ratio went from 0 to the maximum value, representing a complete hybridization[80]. They demonstrated that in SERS the substitution can be detected in double-stranded DNA.
5.5.4. Influence of the dsDNA Length
To compare the SERS spectra of synthetic dsDNA and natural ones, Masseti et al. studied the position, width and relative intensity of SERS bands for both kinds of dsDNA on Ag nanoparticles (Figure 15). They used two short double-helix sequences formed by 21 base pairs and a long one extracted from the thymus of claves (CTds). The SERS spectra of all dsDNA did not show any significant variation in the band widths and positions, but a small change in the relative band intensities could be observed due to the different base compositions (Figure 15c) [77]. Thus, whatever the composition of the dsDNA, there was no influence on the SERS spectrum and no new bands appeared with the increase in the dsDNA length.
5.6. Influence of a Spacer
Research groups have investigated the impact of using a spacer on SERS signals. The spacer is added to the end of the DNA sequence to increase the distance between the sequence and the metal surface of the nanostructures. Typically, the spacer consists of a specific number of identical bases, and its purpose is to assess its influence on various aspects, such as the orientation of DNA on the nanostructures, the binding process and the quality and reproducibility of the SERS spectrum. By varying the spacer length, researchers can gain insights into how the spatial arrangement and interactions between DNA and the metallic surface affect the SERS signal characteristics and the overall performance of the measurement. PolyT is often chosen as a molecular spacer for thiolated ssDNA because the SERS signal for the T base is low, and thus will not affect the whole spectrum [78]. The PolyT spacer is negatively charged, flexible and hydrophilic. The presence of a spacer can modify the surface coverage of DNA or improve the interaction of molecules with DNA.
In a study conducted by Waybrant et al. on a DNA strand used as an aptamer, it was proven that the addition of a spacer formed by thymine or adenine modifies the aptamer affinity to its target. In fact, the authors show that when the size of the spacer PolyT is reduced from 10 to 5 nucleotides, the affinity to its target is also reduced [81].
Demers et al. studied 32-mer strands composed of 20-dA (20-deoxyadenine) and 20-dT (20-deoxythymine spacers included with 12-mer on Au nanoparticles using fluorescence. They found that the surface coverage of the Au nanoparticles by the strand with the thymine spacer (20 base of thymine) reached 35 ± 1 pmol/cm2. It was greater than the one obtained with the strand containing adenine spacer (20 bases of adenine) with a surface coverage of 24 ± 1 pmol/cm2. It was assumed that the DNA strands with the 20-dT spacer extended perpendicularly to the Au surface, inducing a higher surface coverage, while for 20-dA spacer, the strands lie flatly on the surface and partially block Au sites [82].
SERS spectra were measured on gold nanoshell (silica core) for two different sequences, ST20N1 (SH-C6-T20GCGGCAATCAGGTTGACCG TACATCATAGCAGGCTAGGTTGGTCGCAGTC) and SA20N2 (SH-C6-A20CGCCGTTAGTCCA ACTGGCATGTAGTATCGTCCGATGCAACCAGCGTCAG), each one formed by 70 bases and composed from 15.5 and 44.3% of adenine, respectively. In ST20N1, adenine represents 26 bases far from the gold surface, while the SA20N2 contains 20 adenine bases in close vicinity to the surface. In both sequences, the adenine mode at 729 cm−1 dominated the spectra (Figure 18). The effective distance where the SERS signal can be detected above the nanoshell surface is about 9 nm, representing approximately the first 30–40 bases close to the surface. In the case of ST20N1, as the adenine are far from the Au surface, they suggested that DNA chains prefer to lie flat on the Au surface and they estimated that long DNA can be trapped between two nanoshells, so the bases can be enhanced inside the interparticle gap [79].
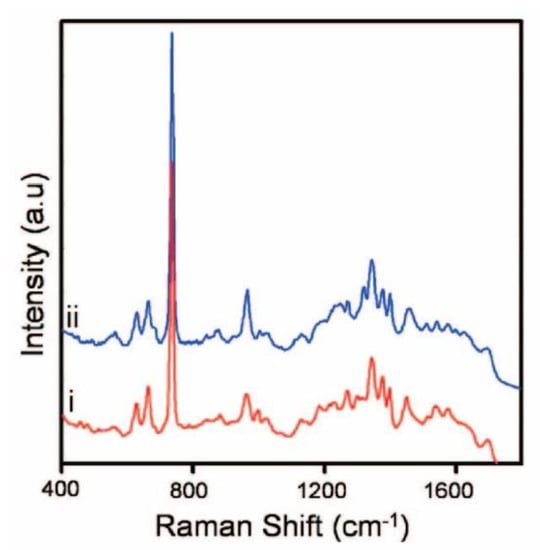
Figure 18.
Spectra of SERS of (i) ST20N1 and (ii) SA20N2. Spectra are shifted for more clarity. Adapted with permission from [79]).
To conclude this part, to have the best SERS signal, the sample incubation time of double-stranded DNA has to be optimized regarding the sample nature and the molecules’ composition. The DNA concentration and the presence of a spacer have an influence on the DNA distribution and orientation and, then, on the SERS spectra. We have to mention that any mutation of the DNA strand could affect the spectrum and the SERS can be sensitive to the change of a single base.
6. Interaction with Analyte
DNA can interact strongly with atoms or others molecules as pollutants, DNA strands, proteins, etc. Such interactions are, in most of the cases, electrostatic interactions that will induce some structural and conformational modifications.
The affinity of the DNA to specific molecules or atoms was exploited in biosensors to specifically detect analytes. The DNA strand was then used as a bioreceptor of the biosensor. One DNA bioreceptor was the aptamer, and an ssDNA formed a loop that could specifically capture one molecule depending on its sequence and its structure.
It was highlighted in 1981 that one can study the interaction between DNA and peptide using Raman spectroscopy by analyzing the mode variations of the Raman spectrum after interaction with every peptide under different excitation wavelengths [47].
More recently, several studies were performed on aptamers interacting with their specific analytes. Thiolated and un-thiolated aptamers were studied using SERS on metal nanoparticles. As for ssDNA, the SERS spectra of the aptamer is constituted by the features of the nucleotides with the highest cross-section [83]. As the electromagnetic field generated by plasmon excitation is confined close to the surface, the SERS signal of the analyte is very low compared with the aptamer one. Indeed, as the analyte was placed on the top of the aptamer, it contribution was largely lower than the one of the aptamer nucleotides close to the surface [83,84].
Yasukuni et al. studied the modification of the aptamer spectrum with 14-thymine spacer (5′-HS-C6 -TT TTT TTT TTT TTT TTC TTC TCT AGC TGA ATA ACC GGA AGT AAC TCA TCG TTT CGA TGA GTT ACT TCC GGT TAT TCA GCT AGA GAA G-3′) when it interacts with different concentrations of its analyte, the MnSOD (a liver cancer biomarker), on Au nanocylinders (Figure 19). They found that the thymine spacer has the strongest contribution with bands at 1000, 1240 and 1390 cm−1. They measured 40 spectra (10 for each concentration of MnSOD from 0 up to 100 nM). The small variations in the SERS spectrum were quantitatively analyzed using principal component analysis (PCA). The spectral variations were mainly due to the low frequency shift of the aptamer bands when MnSOD was added. A small decrease in the full width at half maximum of the main aptamer band was also observed. These two effects indicated a structural modification of the aptamer during the interaction [46].
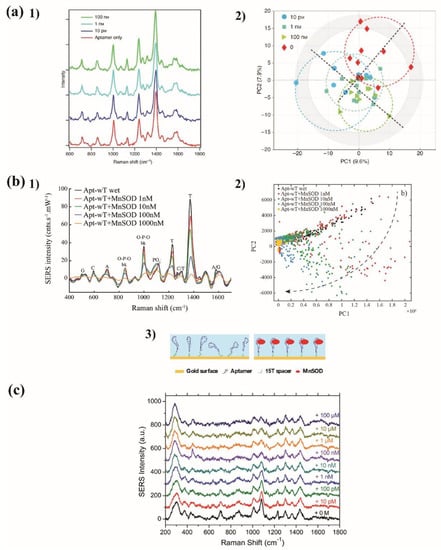
Figure 19.
(a) (1) Normalized SERS spectra of the aptamer interacting with its analyte, the MnSOD. Each one is an average of 10 spectra recorded at different positions on the same substrate (red spectrum: the aptamer alone, blue spectrum: aptamer with 10 pM of MnSOD, light blue spectrum: aptamer with 1 nM of MnSOD, green spectrum: aptamer with 100 nM of MnSOD). For clarity, background was eliminated and baseline was offset, (2) PCA score plot for 40 spectra. It is indicated in the figure the corresponding symbol of each concentration. To visualize and separate symbols’ distribution, colored dashed lines and circles were added (reprinted/adapted with permission from [84]), (b) (1) SERS spectra of the aptamer interacting with its analyte, the MnSOD. Each one is the average of more than 50 spectra recorded at different places on the same substrate in the buffer (black spectrum: aptamer alone, red spectrum: aptamer with 1 nM of MnSOD, green spectrum: aptamer with 10 nM of MnSOD, blue spectrum: aptamer with 100 nM of MnSOD, orange spectrum: aptamer with 1000 nM of MnSOD), (2) PCA score plot for the aptamer in interactions with different concentrations of MnSOD. Black, red, green, blue and yellow dots correspond, respectively, to aptamer alone, 1 nM, 10 nM, 100 nM and 1000 nM of MnSOD. The dashed arrow indicates the aptamer orientations from parallel to standing strands on the surface. (3) Illustration of the aptamer lying on the surface before adding MnSOD to a standing one after adding MnSOD (reprinted/adapted with permission from [75]). (c) Mean SERS spectra of aptamer interacting with ochratoxin (OTA). The OTA concentration increased from the bottom (black spectrum: aptamer alone) to the top (dark blue spectrum: 100 μM of OTA) (Reproduced with permission from Walter De Gruyter Publishers [84]).
Safar et al. studied the same specific aptamer with different concentrations of MnSOD (1 nM, 10 nM, 100 nM and 1000n M) on gold nanocylinders in dry conditions and in PBS buffer (Figure 19) [85]. They recorded SERS spectra at several tens of localizations on the SERS active surface. Using PCA analysis, they were able to determine that the aptamer orientation depends on the experimental conditions. The aptamer is almost lying on the surface in dry conditions and is perpendicular to the surface in the buffer. After adding the different MnSOD concentrations, they observed a large decrease in the SERS signal. Two main components could be extracted from the PCA: the first one, PC1, represented the aptamer dominated by thymine bands, and PC2 had a lower intensity and new bands assigned to other bases. The SERS spectra exhibited large intensity fluctuations for the aptamer alone, whereas few fluctuations were observable with the higher concentration of MnSOD. Thus, the large fluctuation can be interpreted by a large flexibility and large number of orientations of the aptamer when it was alone. On the contrary, the aptamer was in fixed conformation when it was interacting with the MnSOD and, as a consequence, it exhibited few change in its SERS spectrum [85].
Gillibert et al. detected the ochratoxin (OTA) using a specific aptamer (HS-C6)5′ GAT-CGG-GTG-TGG-GTG-GCG-TAA-AGG-GAG-CATCGG-ACA 3′ [86]. The gold surface was functionalized with 10 µM of aptamers to have a high density of grafted single-stranded DNA and with MOH (6-mercapto-1-hexanol) as a blocking layer. Several OTA concentrations (from 10 pM up to 100 mM) were deposited on the SERS active surface to determine the limit of detection of the system (Figure 19). They recorded 10 SERS spectra for each concentration. After the addition of OTA, no new band from OTA appeared, but the OTA induced large modifications of the aptamer bands that can be correlated with the OTA concentration. It was suggested that the interaction of the OTA with the aptamer can change the aptamer’s spectral signature. The bands related to the aptamer between 1100 and 1500 cm−1 remained unchanged. But, by increasing the OTA concentration, they observed a decrease in the bands 1083, 833 and 710 cm−1, while a band appeared at 1600 cm−1. It may be due to the modifications in the aptamer conformation [86].
The SERS can, then, be used to monitor the structural modifications induced on a DNA strand due to its interaction with another molecule. This can be highly relevant to study the interaction mechanism. It also paves the way for a new methodology of detection not through the apparition of new bands of the analyte, but through the modification of the SERS spectrum of the bioreceptor.
7. Tip-Enhanced Raman Scattering (TERS) on DNA
7.1. DNA Base TERS Spectrum
7.1.1. Adenine
Ichimura et al. studied the TERS spectra of adenine molecules with temporal spectral fluctuations [87]. The laser wavelength used was 532 nm and the measurements were achieved with an atomic force microscope (AFM) in contact mode equipped with a silver-coated tip. The sample was prepared by dropping 0.1 mM of adenine-ethanol solution on a glass substrate. They managed to measure an isolated cluster (the number of adenine molecules in one cluster was estimated to be around 104). They measured eight spectra (between 500 and 1500 cm−1) successively (Figure 20). Only one peak (728 cm−1) assigned to the adenine was observable on all TERS spectra. The intensities of the other adenine peaks fluctuated considerably from one spectrum to another. The authors made the hypothesis that temporal changes in the adsorption conditions could explain theses fluctuations, inducing some modifications to the adenine’s orientation under the tip [87].
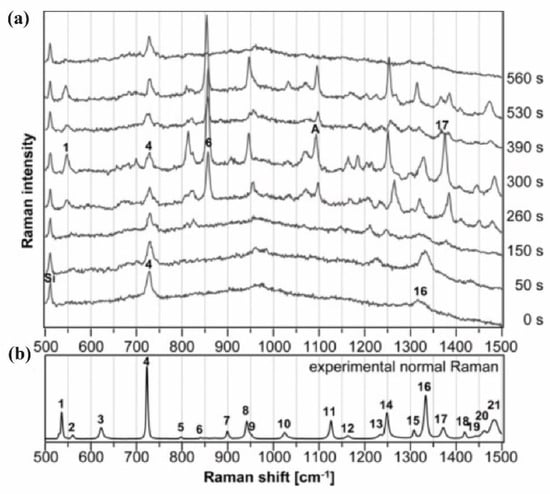
Figure 20.
(a) TERS spectra of adenine at different times. (b) Classical Raman spectrum of bulk adenine (adapted with permission from [87]).
7.1.2. Cytosine
In a study conducted on pyrimidine bases (thymine and cytosine), the pyrimidine bases were dissolved in high-purity ethanol (concentration of 10−5 M). The laser beam used was 568 nm and was focused on the tip from below via an oil immersion objective.
In Figure 21 (a), the upper section shows the TERS spectrum of cytosine [88]. For spectrum (a) the signal of cytosine is enhanced when the tip is in contact, whereas spectrum (b) shows the unenhanced background Raman signal of the substrate. Spectrum (c) is dominated by two main bands at 784 and 1285 cm−1. It reflects the enhanced modes of the cytosine and is compared with the classical Raman spectrum (d). They estimated a low enhancement factor between 5 and 10, and noticed that the spectrum was different from the one obtained on SERS. The TERS spectrum was, in fact, closer to the classical Raman spectrum than the SERS one.
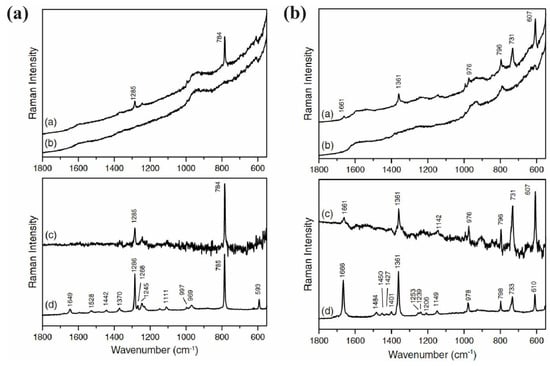
Figure 21.
(a) TERS spectra of cytosine when (a) the tip is in contact and (b) the tip is elevated by 700 nm from the sample. (c) Difference between spectra a and b (a,b) and (d) classical Raman spectrum of cytosine powder (reprinted/adapted with permission from [88]); (b) TERS spectra of thymine when (a) the tip is in contact and (b) the tip is elevated by 700 nm from the sample. (c) The difference between spectra a and b (a,b) and (d) a classical Raman spectrum of thymine powder. The exposure time of all spectra was 100 s and the laser power was 2 mW on the sample (Reproduced with permission from John Wiley and Sons [88]).
7.1.3. Thymine
Figure 21 shows the TERS spectra of thymine [83]. As for the cytosine, the spectrum was enhanced when the tip was in contact with the surface, and the TERS spectrum was very similar to the classical Raman one and not to the SERS one.
7.2. Single-Stranded TERS Signal
When the tip is moved along the strands of the DNA, it is possible to record a TERS map of the strand. Each TERS spectrum is then an average response of a nucleobase fragment. The size of the nucleobase fragment probed in TERS is directly linked to the optical spatial resolution, estimated to be around 10 nm. Thus, as the width of one nucleobase is known to be 0.3 nm the TERS analyses of nucleic acids include the signal from a large number of bases (around 30 bases for each TERS spectrum). The TERS spectrum of a particular strand, even if it is a homopolymer sequence, is analyzed by spectral changes (mostly the change in the intensity of the peaks) [87,89].
Treffer et al. studied an ssDNA of adenines (poly dA) on mica surface (Figure 22a–d) and an ssDNA from calf thymus (Figure 22e) with 530.9 nm and 568.2 nm excitation wavelengths, respectively. For the poly dA, the measurements were conducted on eight different points along the DNA, separated by 10 nm. Two spectra exhibited a high enhancement, as the TERS tip was positioned above the strand [89]. The bands corresponding to the poly dA were located at point 3 at 1045 cm−1 and at point 4 at 1039 cm−1, representing the N-sugar stretching and C-O sugar stretching vibrations. The bands at point 3 at 1068 cm−1 and at point 4 at 1072 cm−1 were assigned to the N-sugar stretching and PO2− stretching vibrations. These strong bands demonstrate that the DNA backbone interacts with the tip and confirms the loop formation along the strand.
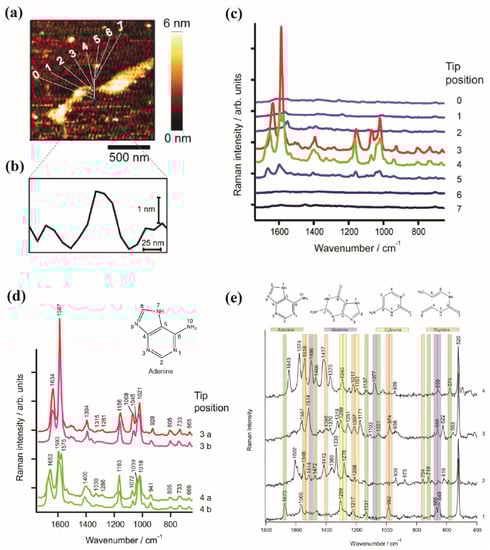
Figure 22.
(a) AFM topography image of ssDNA of adenine (to enhance the contrast, the topography was slightly smoothed (Gaussian)). (b) Cross section topography representing the line indexed into (a,c) TERS spectra measured on different positions indexed in a (from points 0 to 7). (d) TERS spectra measured twice at positions 3 and 4 of the ssDNA of adenine, referring to (a,e) TERS spectra of single-stranded DNA of calf thymus measured at four positions (adapted with permission from [90]).
Figure 22e shows four spectra representing four positions on a single-stranded DNA from calf thymus. The band at around 650 cm−1 was assigned to the guanine ring breathing mode and had a similar position to that in SERS.
As the adenine have a higher cross section than the guanine, the band in spectrum 3 at 1319 cm−1 corresponded to adenine and also to guanine and in spectrum 2 the band at 1330 cm−1 corresponded to guanine. The band at 719 cm−1 in spectrum 2 corresponded to the adenine ring breathing mode and the one at 754 cm−1 in spectrum 2 represented the ring breathing mode of thymine [90].
As for SERS, the TERS spectrum was dominated by the vibrational modes of the bases, especially the adenine, and by the features of the backbone of the strand.
7.3. Double-Stranded DNA TERS Signal
As in SERS, dsDNA was recently and rarely studied with TERS. TERS can distinguish ss and dsDNA samples, and can then be used for DNA hybridization detection. TERS spectra can also give information about nucleoside and backbone vibration on the dsDNA [91].
Najjar et al. studied dsDNA strands of a λ-phage virus in a mixture with Tris-HCl, EDTA, SA and OTS; these last two were used to align DNA on glass slides coated with 60 nm thickness of silver [91]. TERS spectra were measured with an irradiation of 568.2 nm (Figure 23). Au/Ag AFM tips were used: an Ag coating of about 20 nm was first deposited on the AFM and a 5 nm thick Au layer was then deposited. The Au layer insured a more stable and reproducible TERS signal by reducing peak-frequency fluctuations caused by the orientation changes or the adsorption of the molecule on the silver [87]. TERS spectra were recorded across the dsDNA with a step of 5 nm. Raman bands corresponding to the signature of all the nucleobases and their backbones were observed (Figure 23). For instance, the bands of the symmetric and antisymmetric O-P-O stretching modes were located at 765, 824 and 845 cm−1 for point 1 and at 764, 824 and 840 cm−1 for point 2. These bands were not observed in ssDNA, concluding that TERS makes the difference between ss and dsDNA [85]. In Figure 23, every band of TERS can be assigned to DNA modes. In particular, DNA marker bands can be also observed in TERS, namely at 754, 765 and 789 cm−1 for point 1 and 755, 764 and 789 cm−1 for point 2. The bands colored at the positions ν1 = 755 cm−1, ν2 = 840 cm−1, ν3 = 1053 cm−1, ν4 = 1190 cm−1 and ν5 = 1450 cm−1 corresponded, respectively, to the thymine ring breathing mode, O-P-O antisymmetric stretching, adenine (N-sugar) and EDTA/Tris-HCl stretching of (C−C), cytosine or thymine and adenine corresponding to C-N bending [86].
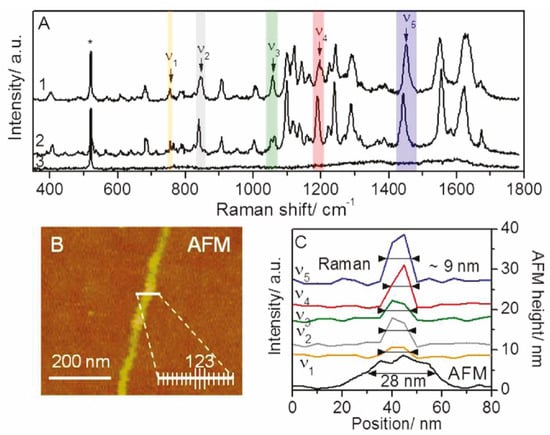
Figure 23.
(A) TERS spectra recorded on three different points (1, 2 and 3) along the white line through the dsDNA, as shown in (B). The band at 520 cm−1 with a star corresponds to the Si AFM tip Raman band. The integration time of each spectrum was 10 s. (B) Topographical AFM image in tapping mode of a dsDNA. (C) On left axis, integrated TERS intensity of the bands representing the wavenumbers from ν1 to ν5 and, on the right axis, the AFM height related to the cross-section of the white line in B. The width of TERS and AFM profiles are noted (adapted with permission from [91]).
One can conclude that TERS is a powerful method to observe single- and double-strand DNA. The Raman signal of all four different DNA nucleosides and backbones can be recorded by supplying some information on the DNA sequence. Some specific features can also be observed for dsDNA. In parallel with Raman, TERS can specify molecules’ morphology using coupled AFM.
8. Conclusions
In this review, we summarized the most relevant Raman, SERS and TERS studies conducted on nucleobases, nucleosides, nucleotides, simple and double-stranded DNA and determined the most significant fingerprints that are related to their composition and their hybridization.
The Raman studies on these types of molecules are limited, as it is necessary to have a large quantity of materials. New technologies and a recent advancement could be able to highlight these molecules using Raman spectroscopy. The studies are insufficient, which means there is only one study for each DNA element, not allowing the comparison between two studies, and sometimes the study does not exist. This lack of research opens rooms to further Raman experiments on nucleobases, sugars, nucleosides, nucleotides, single-strand DNA and various types of double DNA in different forms and various conditions such as liquid or solid states.
In recent years, studies are focusing on the SERS method. The studies tried to detect molecules and their SERS spectra at low concentrations. We have highlighted that SERS can be used to determine not only the composition of the sequence, but also the DNA structure and orientation on the metallic surfaces. The orientation can be deduced from the band positions and intensities in the SERS spectra, describing the molecular interaction and behavior on the surface. We have shown the influence of the addition of a spacer or of a mutation in a sequence on the SERS spectrum and we also reported the influence of the DNA interaction with its complementary strands.
As SERS is paving the way in recent biological research, TERS could be more used as it gives the possibility to identify a whole DNA strand and provide a chemical and structural scanning of the DNA all along the strand.
9. Raman and SERS Bands for DNA Components
Table 2, Table 3, Table 4, Table 5, Table 6, Table 7, Table 8 and Table 9 list the different Raman and SERS bands positions observed for dna and its components.
Table 2.
Raman bands of DNA bases.
Table 2.
Raman bands of DNA bases.
| Bands (cm−1) | DNA Bases | References | |||
|---|---|---|---|---|---|
| Adenine | Cytosine | Guanine | Thymine | ||
| 310–330 | -C6N12 bending +N9R bending/Hydrogen bending | [47,92] | |||
| 380–390 | C2N14 bending+N9R bending/(C=O) bending mode | [48,92] | |||
| 414 | (N3-C2=O) + (N1-C2=O) bending mode | [49] | |||
| 470 | C2N1C6 bending+ N3C4C5 bending | [92] | |||
| 490, 500 | C2N1C5 bending+N9R-C5C4N bending/(N9-C4=C5) +S(N7-C=C4) bending modes | [48,92] | |||
| 540–550 | C5C4N bending-C2N1C6 bending/(C-C=C) bending | -N1C2N3 bending + C2N3C4 bending/(C-C=C) and (N3=C3-N4) bending mode | [47,49,92] | ||
| 558 | (C2-N3=C4) and (N1-C2-N3) bending mode | [49,92] | |||
| 565 | N1C2N3 bending-C2N3C4 bending | [92] | |||
| 608 | (C=O) in phase stretching mode | [49] | |||
| 617 | wag of N-H | [50] | |||
| 625–630 | N9R bending +C6N12 bending-N7C5C6 bending/(C-C=C) bending | [47,92] | |||
| 640–685 | G in-plane, ring breathing | [48,92] | |||
| 720–730 | A ring stretching/C-C, C-N stretching in-phase breathing | [47,70,92] | |||
| 735–815 | C Ring breathing | T ring breathing/coupled out-plane wag of N-H on C=C | [49,50,92] | ||
| 930–970 | NH2 rocking + N9C6 stretching/(N-C=N) bending mode | (N-C=N) and (N-C-N) bending modes | [47,48,92] | ||
| 975 | C5H bending | [92] | |||
| 984 | ring breathing coupled to in-plane -CH3 asymmetric stretching | [50] | |||
| 1116 | N1R stretching-C2N3 stretching | [92] | |||
| 1124 | N3C2 stretching+N9R stretching | [92] | |||
| 1134 | (C2-N1=C6) bending mode/(C5-N7=C8) stretching mode | [47] | |||
| 1169 | -C6 breathing H +C2N3 stretching | [92] | |||
| 1180–1260 | N1C2 stretching + C2H bending + N9C8 stretching + C8N7 stretching/(C-NH2) stretching mode | G in-plane stretching mode (C2-NH2) /C8H bending + C8N7 stretching | T (stretching N3-C4, C6-N1) | [47,48,92] | |
| 1260–1294 | stretching C-N | [49,92] | |||
| 1314 | (C-N) and (C=N) stretching modes | [47] | |||
| 1354 | G in-plane ring mode, bending/C-N Stretching | [48,92] | |||
| 1330–1340 | N1C5 stretching+ C8N7 stretching | [47,92] | |||
| 1354 | (C8-N-H), (C8-H) bending modes + (C8-N) stretching mode | [48] | |||
| 1360–1365 | C8N9 stretching+C2N3 stretching | C8N9 stretching-N7C8 stretching | [92] | ||
| 1365–1370 | (C8-H), (C2-H) out-of-plane bending modes | C4N stretching-C5C6 stretching | Deoxy-guanine | N-H + C-H in-plane bending/Deoxy-thymine | [47,50,92] |
| 1376 | (C=C-H) bending mode | [49] | |||
| 1398 | -N1C6 stretching + C6N12 stretching | [92] | |||
| 1410 | (N7=C8-H) bending mode | [48] | |||
| 1418 | C2N3 stretching-C2(ND2) stretching | NH bending | [92] | ||
| 1442 | C=N Stretching Pyrimidine | [92] | |||
| 1484 | N1C2 stretching+N3C2 stretching | N1C2 stretching+N1C6 stretching | [92] | ||
| 1503 | NH bending | [92] | |||
| 1536 | N3C4 stretching-N1C2 stretching | C4C5 stretching-C4N9 stretching | [92] | ||
| 1542 | (N-H) in plane bending mode | (C=C) stretching mode | [48,49] | ||
| 1570–1585 | Adenine/Guanine (N3C4-C4C5 stretching) | Adenine/Guanine (N3C4-C4C5 stretching) | [92] | ||
| 1655–1675 | C2=O-C2N3 Stretching | C=O Stretching and coupled to N–H and C–H asymmetric bending [mainly T] | [50,92] | ||
| 1680 | C6=O-C5C6 Stretching | [92] | |||
Table 3.
Raman bands of deoxyribonucleosides.
Table 3.
Raman bands of deoxyribonucleosides.
| Bands (cm−1) | Nucleosides | References | ||||
|---|---|---|---|---|---|---|
| Sugar | Adenosine | Cytidine | Guanosine | Thymidine | ||
| 294 | D-ribose | [49] | ||||
| 310 | D-ribose | [49] | ||||
| 560 | Cytosine | [49] | ||||
| 602 | Cytosine+ D-ribose | [49] | ||||
| 675–680 | G ring breathing | [54] | ||||
| 730–735 | ring breath | [54] | ||||
| 762 | Cytosine+ D-ribose | [49] | ||||
| 780–795 | C ring breathing | T ring breathing | [49,54] | |||
| 850 | N-C-N Stretching | N-C-N Stretching | [54] | |||
| 858 | Bending mode of (C-N1-C) | [54] | ||||
| 908 | NH2 Rocking | [54] | ||||
| 950 | NH2 Rocking | NH2 Rocking | [54] | |||
| 986 | Cytosine+ D-ribose | [54] | ||||
| 1015–1025 | (N-C), N-Sugar Stretching | (N-C), N-Sugar Stretching | (N-C), N-Sugar Stretching | (N-C), N-Sugar Stretching | [54] | |
| 1066 | (N-C), N-Sugar Stretching | (N-C), N-Sugar Stretching | [54] | |||
| 1170 | C-C Stretching | [54] | ||||
| 1174 | C-C Stretching | [54] | ||||
| 1194 | Stretching(C-N1) | [49] | ||||
| 1224 | stretching C5-C6, Ring- CH3 stretching | [54] | ||||
| 1240 | C-C stretching, Ring-CH3 Stretching | [54] | ||||
| 1260–1295 | C2-N3 stretching | C in-plane, C3-N9 stretching/Cytosine+ D-ribose | [49,54] | |||
| 1296 | Cytosine+ D-ribose | [49] | ||||
| 1315–1325 | C-N Stretching Imidazole | C-N Stretching Imidazole | [54] | |||
| 1348 | C-N Stretching | C-N Stretching | [54] | |||
| 1363 | C-N Stretching pyrimidine | [54] | ||||
| 1380 | C-N Stretching Pyrimidine | [54] | ||||
| 1390 | CH3 Deformation | [54] | ||||
| 1417 | C4-C5 Stretching | [54] | ||||
| 1448 | C=N Stretching Pyrimidine | [54] | ||||
| 1478 | C=N Stretching Pyrimidine | [54] | ||||
| 1480–1490 | C=N Stretching imidazole | C=N Stretching Pyrimidine | [54] | |||
| 1533 | NH2 Deformation | [54] | ||||
| 1568 | Ring Stretching Pyrimidine | [54] | ||||
| 1570–1580 | A, G (Ring Stretching Pyrimidine) | A, G (Ring Stretching Pyrimidine) | T Ring Stretching Pyrimidine | [54] | ||
| 1594 | Cytosine | [49] | ||||
| 1615–1620 | NH2 Deformation | NH2 Deformation | [54] | |||
| 1664 | C=O Stretching | C=O Stretching | [54] | |||
| 1687 | NH 2 Scissoring | [54] | ||||
Table 4.
Raman bands of deoxyribonucleic acids.
Table 4.
Raman bands of deoxyribonucleic acids.
| Nucleosides | References | |||||
|---|---|---|---|---|---|---|
| Bands | Backbones | Adenosine | Cytidine | Guanosine | Thymidine | |
| 330 | Deoxy-adenine | [70] | ||||
| 499 | PO2- scissors | [93] | ||||
| 642 | Deoxyribose moiety in Cytosine | [94] | ||||
| 665–685 | G ring breathing | [83,93] | ||||
| 720–735 | A ring breathing | [70,93,94] | ||||
| 745–750 | O-P-O anti-symmetric | [83] | ||||
| 750–785 | C Ring breathing/deoxyribose moiety in Cytosine | T ring breathing/deoxyribose moiety in Thymine | [93,94] | |||
| 785–795 | O-P-O symmetric stretching | [83,93] | ||||
| 805–840 | O-P-O Stretching | [93,94] | ||||
| 880–960 | Deoxy-ribose ring/sugar vibration | [83,93,94] | ||||
| 1010 | Phosphate and sugar stretching mode | [70] | ||||
| 1018 | Deoxy- guanine (N-H deformation) | [83] | ||||
| 10751101 | PO2- symmetric Stretching/sugar stretching | [70,83,93,94] | ||||
| 1210–1260 | deoxy-adenine | Deoxy-cytosine/Ring mode [mainly] | Deoxy-Thymine, N–H deformation, C–N stretching [mainly] | [83,93,94] | ||
| 1292 | Deoxy-cytosine | [94] | ||||
| 1300,1310 | deoxy-adenine | [70,94] | ||||
| 1315 | Deoxy-guanine | [94] | ||||
| 1330–1340 | Deoxy-adenine/A ring mode | Deoxy-guanine/A ring mode | [83,93,94] | |||
| 1374 | Deoxy-adenine | Deoxy-cytosine | Deoxy-thymine | [94] | ||
| 1419 | 2’ CH2 scissors | [93] | ||||
| 1420 | Deoxy-adenine | [94] | ||||
| 1463 | 5’ CH2 scissors | [93] | ||||
| 1480–1490 | Ring mode (G, A)/Deoxy-adenine | Ring mode (G, A)/Deoxy-guanine | [93,94] | |||
| 1575–1580 | Ring mode (G, A)/Deoxy-adenine | Ring mode (G, A)/Deoxy-guanine | [93,94] | |||
| 1580–1585 | Deoxy-guanine | [83] | ||||
| 1665–1670 | C=O Stretching | C=O Stretching | [83,93] | |||
Table 5.
SERS bands of DNA bases.
Table 5.
SERS bands of DNA bases.
| Bands (cm−1) | DNA Bases | References | |||
|---|---|---|---|---|---|
| Adenine | Cytosine | Guanine | Thymine | ||
| 314 | C2N1 bending—C6N1 bending | [92] | |||
| 326 | -C6N12 bending +N9 bending | [92] | |||
| 370 | C2N14 bending + N9 bending | [92] | |||
| 470 | C2N1C6 bending + N3C4C5 bending | [92] | |||
| 490 | C2N1C6 bending + N3C4C5 bending | [92] | |||
| 500–515 | G (C2N1C 5bending + N9R-C5C4N bending) | [92] | |||
| 548 | C5C4N bending-C2N1C6 bending | [92] | |||
| 558 | -N1C2N3 bending + C2N3C4 bending | [92] | |||
| 586 | N1C2N3 bending-C2N3C4 bending | [92] | |||
| 595–620 | C (C2=O bending + N1 bending + C4N11 bending) | [2] | |||
| 626 | Adenine (N9 bending +C6N12 bending-N7C5C6 bending) | [92] | |||
| 632 | N1C2O bending + N3C4O bending | [92] | |||
| 656 | Ring breathing mode (in-plane, breath six-membered ring In-phase except C4C5) | [92] | |||
| 690 | C5C4 bending- N3C4 bending+ N1C2O bending–N2C2O bending | [92] | |||
| 732 | A Ring stretching | [92] | |||
| 775,780 | C ring breathing | T Ring breathing/Wag of C–H on C=C | [50,92] | ||
| 785,800 | C Ring breathing | [92] | |||
| 812 | N1C2 stretching +N1Rstretching + C5C 4 stretching + N1C6 stretching + N3C4 stretching | [92] | |||
| 852 | -N7C5 stretching -N1C2N3 bending | [92] | |||
| 960 | NH2 rocking + N9C6stretching | [92] | |||
| 986 | C5H bending | [92] | |||
| 995 | Ring breathing coupled to in-plane –CH3 asymmetric stretching | [50] | |||
| 1020 | NH2 rocking+C6Hbending | [92] | |||
| 1028 | NH2rocking+N9Rstretching | [92] | |||
| 1118 | N1Rstretching-C2N3stretching | [92] | |||
| 1122 | N3C2stretching+N9Rstretching | [92] | |||
| 1140 | -N1Rstretching +C6Hbending | [92] | |||
| 1154 | -C8N7stretching+N9Rstretching-C4N3stretching | [92] | |||
| 1184 | -C6bendingH +C2N3stretching | [92] | |||
| 1190–1200 | C8N7stretching + C6N12Hbending-C1N2 stretching | C6Hbending +C4N11 | [92] | ||
| 1218 | =CN stretching | [50] | |||
| 1222 | C8Hbending+C8N7stretching | [92] | |||
| 1264 | N1C2stretching+C2Hbending+N9C8stretching+C8N7stretching | [92] | |||
| 1275–1280 | -C8N7stretching-N1C6 stretching +N7C5stretching | Ring stretching+CHbreathing | [92] | ||
| 1306 | N1C6stretching+C5C6stretching | [92] | |||
| 1330–1335 | Ring breathing | C8N9stretching-N7C8stretching | [62] | ||
| 1349 | N–H and C–H in-plane bending | [50] | |||
| 1370 | C8N9stretching+C2N3stretching | [92] | |||
| 1384 | C2N3stretching-C2(ND2) stretching | [92] | |||
| 1390 | -N1C6stretching+C6N12stretching | [92] | |||
| 1404 | –N–H deformation | [50] | |||
| 1460 | C2Hbending-N1C2stretching+N3C2stretching | [92] | |||
| 1470–1485 | N1C6stretching + N3C4stretching | - N1C2stretching + C2N3stretching | [92] | ||
| 1504–1515 | -N3C4stretching-N1C2stretching | C4C5stretching-C4N9sttretching | NH bending | [92] | |
| 1582 | Adenine | Stretching vibration (NH2)/C4C5stretching-C5C6stretching | N3C4stretching-C4C5stretching | N3C4+N1C2stretching+C6C5stretching-N1C6stretching | [92] |
| 1635, 1640 | C2=Ostretching-C2N3stretching | [92] | |||
| 1652 | C=O stretching and coupled to N–H and C–H asymmetric bending | [92] | |||
| 1680 | C6=Ostretching-C5C6stretching | [92] | |||
Table 6.
SERS bands of deoxyribonucleosides.
Table 6.
SERS bands of deoxyribonucleosides.
| Bands (cm−1) | Nucleosides | References | ||||
|---|---|---|---|---|---|---|
| Sugar | Adenosine | Cytidine | Guanosine | Thymidine | ||
| 225 | Au-N stretching | [54] | ||||
| 231 | Au-N stretching | [54] | ||||
| 243 | Au-O stretching | [54] | ||||
| 728–735 | A Ring breathing Pyrimidine | [54,70] | ||||
| 742 | A ring vibration | [62] | ||||
| 796 | T Ring breathing Pyrimidine | [54] | ||||
| 802 | C Ring breathing Pyrimidine | [54] | ||||
| 850 | Deoxyribose ring/sugar vibration | [14] | ||||
| 919 | Deoxyribose ring/Ribose,C-C stretching | NH2 Rocking | [54] | |||
| 949 | NH2 Rocking | [54] | ||||
| 954 | NH2 Rocking | [54] | ||||
| 1019 | N-Sugar Stretching | [54] | ||||
| 1032 | N-Sugar Stretching | [54] | ||||
| 1033 | N-Sugar Stretching | [54] | ||||
| 1035 | N-Sugar Stretching | [54] | ||||
| 1171 | C5-C6 Stretching | [54] | ||||
| 1179 | C5-C6 Stretching | [54] | ||||
| 1226 | Ring-CH3 Stretching | [54] | ||||
| 1233 | Ring-CH3 Stretching | [54] | ||||
| 1254 | C8-N9 Stretching | [54] | ||||
| 1293 | C2-N3 Stretching | [54] | ||||
| 1318 | C-N Stretching Imdazole | [54] | ||||
| 1320 | C6-N in-plane Stretching (ring skeleton vibration) | [62] | ||||
| 1330 | A ring vibration | [62] | ||||
| 1389 | C6-N1 Stretching Pyrimidine | [54] | ||||
| 1419 | C4-C5 Stretching | [54] | ||||
| 1450 | C=N Stretching Pyrimidine | [54] | ||||
| 1458 | C=N Stretching Pyrimidine | [54] | ||||
| 1472 | C=N Stretching Pyrimidine | [54] | ||||
| 1486 | C=N Stretching Imidazole | [54] | ||||
| 1498 | NH2 Deformation | [54] | ||||
| 1551 | A Ring Stretching | [54] | ||||
| 1572 | C Ring Stretching Pyrimidine | [54] | ||||
| 1574 | T Ring Stretching Pyrimidine | [54] | ||||
| 1577 | G Ring Stretching Pyrimidine | [54] | ||||
| 1594 | NH2 Deformation | [54] | ||||
| 1635, 1450 | C=O Stretching | C=O Stretching | C=O Stretching | [54] | ||
| 1657 | NH2 Scissoring | [54] | ||||
Table 7.
SERS bands of deoxyribonucleosides linked to phosphate groups.
Table 7.
SERS bands of deoxyribonucleosides linked to phosphate groups.
| Bands (cm−1) | Nucleosides | References | ||||
|---|---|---|---|---|---|---|
| Backbones | Adenosine | Cytidine | Guanosine | Thymidine | ||
| 326 | C-NH2 in-plane bend | [70] | ||||
| 650–660 | G in-plane, breath six-membered ring | [67,68] | ||||
| 680–690 | A out-of-plane, deformation R5 ring, R6 (torsion C4-C5-C6, wagging N3-C4-N9) | C out-of-plane, bending C5-C4, N3-C4) | Ring breathing mode | [67,68] | ||
| 700–710 | G in-plane, bend (ring) | T in-plane, ring breath | [68] | |||
| 730, 735 | A ring breath | G out-of-plane, deformation R6 (wagging N1-C2-N3) torsion NH2 | [67,68,70] | |||
| 735–740 | A in-plane, ring breath | [62,68] | ||||
| 786 | A out-of-plane, deformation R6 (w C4-C5-C6, w C8-H) | [68] | ||||
| 792 | C in-plane, ring breath | [68] | ||||
| 799 | T in-plane ring breath | [68] | ||||
| 850 | G in-plane, deformation, six-membered ring-, five-membered ring | [68] | ||||
| 882 | G in-plane, NH bend | [68] | ||||
| 957 | G in-plane, deformation, five-membered ring (squeeze N7-C8-N9) | [68] | ||||
| 1023 | Amino group | [67] | ||||
| 1138 | G in-plane, bending C8-H, str C4-N9 rock NH2 | [68] | ||||
| 1212 | T in-plane, str C5-C6, bending CH3, strN3-C4, C6-N1 | [68] | ||||
| 1235 | G in-plane, pyrimidic character | [68] | ||||
| 1260 | C in-plane, str C4-N3 | [68] | ||||
| 1280 | C in-plane, str C2-N3 | [68] | ||||
| 1295 | G in-plane, str N7-C8, C2-N3, bending N1-H | [68] | ||||
| 1299 | Skeleton vibration | [67] | ||||
| 1310–1315 | C in-plane, str N1-C6+C5-C6 | in, bend N3−H, C6−H | [68] | |||
| 1320–1325 | ring skeleton vibration | [67,70] | ||||
| 1328 | G in-plane, bending C8-H, str C5-N7-C8 | [68] | ||||
| 1330–1345 | A in-plane, ring skeleton vibration: str C5-N7, N1-C2 bend C2-H, C8-H | [62,68,70] | ||||
| 1360 | T | [67] | ||||
| 1380 | Thymine in-plane, bend C5-Methyl | [68] | ||||
| 1385 | G in-plane, str C2-N3, C6-N1, C5-C6,C4-N9, C5-N7 | [68] | ||||
| 1402 | 2’ CH2 ciseaux | A in-plane, bending C2-H, str C8-N7, N1-C2 | [68] | |||
| 1463 | A in-plane, str C2-N3, N1-C6, bending C2-H, scissoring NH2 | [68] | ||||
| 1465–1475 | C in-plane, str C4-N3 + C2-N3 | G in-plane, str N7=C8 and C8-N9 | [68] | |||
| 1484 | C in-plane, str N1-C6 + str N3-C4 | [68] | ||||
| 1495 | T bend C6-H, N-H | [68] | ||||
| 1530–1535 | A in-plane, str N3-C4, N1-C6, C5-N7, N7-C8, scissoring NH2 | G in-plane, str C=C, str N3-C4 | [68] | |||
Table 8.
SERS bands of single-stranded deoxyribonucleic acids.
Table 8.
SERS bands of single-stranded deoxyribonucleic acids.
| Bands (cm−1) | Nucleosides | References | ||||
|---|---|---|---|---|---|---|
| Backbones | Adenosine | Cytidine | Guanosine | Thymidine | ||
| 510 | G ring breathing | [39] | ||||
| 595–560 | C ring deformation (C2=O bending +N1R bending +C4N11bending) | [39,95] | ||||
| 650–685 | G ring breathing | [52,62,65,79] | ||||
| 720–740 | A in-plane, ring breathing | T ring breathing/deoxythymine (mainly T) | [39,67,71,74] | |||
| 775,780 | C ring breathing | [72] | ||||
| 785–795 | P skeleton stretching | C in-plane, ring breathing Pyrimidine [mainly C] | T Ring breathing (Pyrimidine) | [39,67,72,73,95] | ||
| 800–815 | O-P-O symmetric stretching, backbone vibration | [39] | ||||
| 919 | Deoxyribose ring (C-C stretching) | [39] | ||||
| 958 | Ribose-Phosphate | [39] | ||||
| 1020–1025 | C (NH2 rocking+C6H bending adsorbed on the surface) | [67,95] | ||||
| 1028 | Ribose + C | -N9R5 stretching-N1C2N3 bending | [39] | |||
| 1075/1085 | P- symmetric. Stretch, backbone | [39] | ||||
| 1087/1089 | V (P) stretching vibration of phosphodioxy moiety | [39,74,95] | ||||
| 1155- 1175 | Deoxyadenine | [39] | ||||
| 1179 | Desoxythymine | [39] | ||||
| 1212 | T in-plane, C5-C6 stretching, CH3 bending, N3-C4, C6-N1 stretching | [39] | ||||
| 1240/1266 | C Ring stretching | T Ring stretching | [39,74,95] | |||
| 1299 | C (skeleton vibration) | [67] | ||||
| 1325–1335 | A ring mode | G (ring in-plane, bending C8-H, stretching C5-N7-C8) | [39,74] | |||
| 1360 | T breathing mode vibration | [67] | ||||
| 1387 | Desoxyadenine | Desoxyguanine | Desoxythymine | [39] | ||
| 1435–1440 | Backbone (CH2 deformation) | Deoxythymine | [72] | |||
| 1485 | A ring mode (mainly G) | G ring mode (mainly G) | [39] | |||
| 1500–1510 | A ring mode (mainly G) | G ring mode (mainly G) | [39] | |||
| 1570–1580 | A ring mode | G ring mode | [39,72,73] | |||
| 1640–1645 | C (C=O Stretching) | T (C=O Stretching) (mainly T) | [39,73] | |||
Table 9.
SERS bands of double-stranded deoxyribonucleic acids.
Table 9.
SERS bands of double-stranded deoxyribonucleic acids.
| Bands (cm−1) | Nucleosides | References | ||||
|---|---|---|---|---|---|---|
| Backbones | Adenosine | Cytidine | Guanine | Thymidine | ||
| 500–505 | G ring deformation | [39,76] | ||||
| 595–625 | C ring deformation | [39,76] | ||||
| 630 | Adenine | [71] | ||||
| 665/680 | G ring breathing | [39,76] | ||||
| 730–740 | A ring breathing | [39,76] | ||||
| 785–790 | C ring breathing (Mainly C) | T ring breathing (mainly C) | [39,76] | |||
| 814 | O-P-O symmetric stretching | [39] | ||||
| 919 | ribose ring (C-C stretching) | [39] | ||||
| 958 | Ribose-Phosphate | [39] | ||||
| 1010–1035 | Deoxy-phosphate backbone (P-O-P) | [60] | ||||
| 1090 | P symmetric stretching | [39,76] | ||||
| 1178 | T | [39,76] | ||||
| 1212 | T (in-plane, str C5-C6, bending CH3, strN3-C4, C6-N1) | [39] | ||||
| 1247/1264 | C+G (Ring stretching) [mainly C] | C+G (Ring stretching) [mainly C] | [39,76] | |||
| 1320–1330 | A+G ring modes | A+G ring modes | [39,76] | |||
| 1354 | Guanosine | [76] | ||||
| 1378 | Thymine | [76] | ||||
| 1415–1425 | Backbone | [39,76] | ||||
| 1485–1490 | G+A, ring modes (C=N stretching) [mainly G] | G+A, ring modes (C=N stretching) [mainly G] | [39,76] | |||
| 1506 | G+A, ring modes [mainly G] | G+A, ring modes [mainly G] | [39] | |||
| 1509 | A, v(pyrimidine) | [76] | ||||
| 1528 | C ring | [76] | ||||
| 1575 | Ring mode (A, G) | Ring mode (A, G) | [39,76] | |||
| 1628 | C (C=O Stretching) | [76] | ||||
| 1650–1655 | T+C (C=O stretching) | T+C (C=O stretching) | [39,76] | |||
| 1684 | T (C=O stretching) | [76] | ||||
| 1721 | G (C=O stretching) | [39] | ||||
Author Contributions
Conceptualization, M.L.d.l.C.; methodology, W.S., M.E. and M.L.d.l.C.; investigation, W.S. and A.A.; writing—original draft preparation, W.S.; writing—review and editing, W.S., A.A., M.E. and M.L.d.l.C.; supervision, M.L.d.l.C.; funding acquisition, M.L.d.l.C. All authors have read and agreed to the published version of the manuscript.
Funding
This research was funded by the EUROPEAN UNION’s HORIZON 2020 research and innovation FET Open program under grant agreement No. 964248 (DeDNAed).
Conflicts of Interest
The authors declare no conflict of interest.
References
- Campolongo, M.J.; Tan, S.J.; Xu, J.; Luo, D. DNA Nanomedicine: Engineering DNA as a Polymer for Therapeutic and Diagnostic Applications. Adv. Drug Deliv. Rev. 2010, 62, 606–616. [Google Scholar] [CrossRef]
- Goris, J.; Konstantinidis, K.T.; Klappenbach, J.A.; Coenye, T.; Vandamme, P.; Tiedje, J.M. DNA–DNA Hybridization Values and Their Relationship to Whole-Genome Sequence Similarities. Int. J. Syst. Evol. Microbiol. 2007, 57, 81–91. [Google Scholar] [CrossRef] [PubMed]
- Chee, M.; Yang, R.; Hubbell, E.; Berno, A.; Huang, X.C.; Stern, D.; Winkler, J.; Lockhart, D.J.; Morris, M.S.; Fodor, S.P.A. Accessing Genetic Information with High-Density DNA Arrays. Science 1996, 274, 610–614. [Google Scholar] [CrossRef] [PubMed]
- Alberts, B.; Johnson, A.; Lewis, J.; Raff, M.; Roberts, K.; Walter, P. Molecular Biology of the Cell; Garland Science: New York, NY, USA, 2002. [Google Scholar]
- Dey, B.; Thukral, S.; Krishnan, S.; Chakrobarty, M.; Gupta, S.; Manghani, C.; Rani, V. DNA–Protein Interactions: Methods for Detection and Analysis. Mol. Cell Biochem. 2012, 365, 279–299. [Google Scholar] [CrossRef]
- Rauf, S.; Gooding, J.J.; Akhtar, K.; Ghauri, M.A.; Rahman, M.; Anwar, M.A.; Khalid, A.M. Electrochemical Approach of Anticancer Drugs–DNA Interaction. J. Pharm. Biomed. Anal. 2005, 37, 205–217. [Google Scholar] [CrossRef] [PubMed]
- Hassibi, A.; Vikalo, H.; Riechmann, J.L.; Hassibi, B. Real-Time DNA Microarray Analysis. Nucleic Acids Res. 2009, 37, e132. [Google Scholar] [CrossRef]
- Mavragani, I.V.; Nikitaki, Z.; Kalospyros, S.A.; Georgakilas, A.G. Ionizing Radiation and Complex DNA Damage: From Prediction to Detection Challenges and Biological Significance. Cancers 2019, 11, 1789. [Google Scholar] [CrossRef]
- Gorgannezhad, L.; Umer, M.; Islam, M.N.; Nguyen, N.-T.; Shiddiky, M.J.A. Circulating Tumor DNA and Liquid Biopsy: Opportunities, Challenges, and Recent Advances in Detection Technologies. Lab Chip 2018, 18, 1174–1196. [Google Scholar] [CrossRef]
- Dunbar, S.A.; Zee, C.A.V.; Oliver, K.G.; Karem, K.L.; Jacobson, J.W. Quantitative, Multiplexed Detection of Bacterial Pathogens: DNA and Protein Applications of the Luminex LabMAPTM System. J. Microbiol. Methods 2003, 53, 245–252. [Google Scholar] [CrossRef]
- Gerion, D.; Chen, F.; Kannan, B.; Fu, A.; Parak, W.J.; Chen, D.J.; Majumdar, A.; Alivisatos, A.P. Room-Temperature Single-Nucleotide Polymorphism and Multiallele DNA Detection Using Fluorescent Nanocrystals and Microarrays. Available online: https://pubs.acs.org/doi/abs/10.1021/ac034482j (accessed on 6 September 2021).
- Emlen, W.; Jarusiripipat, P.; Burdick, G. A New ELISA for the Detection of Double-Stranded DNA Antibodies. J. Immunol. Methods 1990, 132, 91–101. [Google Scholar] [CrossRef]
- Wood, B.R. The Importance of Hydration and DNA Conformation in Interpreting Infrared Spectra of Cells and Tissues. Chem. Soc. Rev. 2016, 45, 1980–1998. [Google Scholar] [CrossRef] [PubMed]
- Mahajan, S.; Richardson, J.; Brown, T.; Bartlett, P.N. SERS-Melting: A New Method for Discriminating Mutations in DNA Sequences. Available online: https://pubs.acs.org/doi/abs/10.1021/ja805517q (accessed on 13 April 2021).
- Sun, L.; Yu, C.; Irudayaraj, J. Surface-Enhanced Raman Scattering Based Nonfluorescent Probe for Multiplex DNA Detection. Available online: https://pubs.acs.org/doi/abs/10.1021/ac070078z (accessed on 6 September 2021).
- Singh, R. CV Raman and the Discovery of the Raman Effect. Phys. Perspect. 2002, 4, 399–420. [Google Scholar] [CrossRef]
- Peticolas, W.L. Raman Spectroscopy of DNA and Proteins. Methods Enzymol. 1995, 246, 389–416. [Google Scholar] [CrossRef]
- Thomas, G.J.; Wang, A.H.J. Laser Raman Spectroscopy of Nucleic Acids. In Nucleic Acids and Molecular Biology; Eckstein, F., Lilley, D.M.J., Eds.; Springer: Berlin/Heidelberg, Germany, 1988; Volume 2. [Google Scholar] [CrossRef]
- Duguid, J.G.; Bloomfield, V.A.; Benevides, J.M.; Thomas, G.J. DNA Melting Investigated by Differential Scanning Calorimetry and Raman Spectroscopy. Biophys. J. 1996, 71, 3350–3360. [Google Scholar] [CrossRef]
- Nishimura, Y.; Tsuboi, M.; Nakano, T.; Higuchi, S.; Sato, T.; Shida, T.; Uesugi, S.; Ohtsuka, E.; Ikehara, M. Raman Diagnosis of Nucleic Acid Structure: Sugar-Puckering and Glycosidic Conformation in the Guanosine Moiety. Nucleic Acids Res. 1983, 11, 1579–1588. [Google Scholar] [CrossRef] [PubMed]
- Ellis, D.I.; Goodacre, R. Metabolic Fingerprinting in Disease Diagnosis: Biomedical Applications of Infrared and Raman Spectroscopy. Analyst 2006, 131, 875–885. [Google Scholar] [CrossRef]
- Buric, M.P.; Chen, K.P.; Falk, J.; Woodruff, S.D. Improved Sensitivity Gas Detection by Spontaneous Raman Scattering. Appl. Opt. AO 2009, 48, 4424–4429. [Google Scholar] [CrossRef] [PubMed]
- Fleischmann, M.; Hendra, P.J.; McQuillan, A.J. Raman Spectra of Pyridine Adsorbed at a Silver Electrode. Chem. Phys. Lett. 1974, 26, 163–166. [Google Scholar] [CrossRef]
- McQuillan, A.J. The Discovery of Surface-Enhanced Raman Scattering. Notes Rec. R. Soc. 2009, 63, 105–109. [Google Scholar] [CrossRef]
- Jeanmaire, D.L.; Van Duyne, R.P. Surface Raman Spectroelectrochemistry: Part I. Heterocyclic, Aromatic, and Aliphatic Amines Adsorbed on the Anodized Silver Electrode. J. Electroanal. Chem. Interfacial Electrochem. 1977, 84, 1–20. [Google Scholar] [CrossRef]
- Li, Y.; Qi, X.; Lei, C.; Yue, Q.; Zhang, S. Simultaneous SERS Detection and Imaging of Two Biomarkers on the Cancer Cell Surface by Self-Assembly of Branched DNA–Gold Nanoaggregates. Chem. Commun. 2014, 50, 9907–9909. [Google Scholar] [CrossRef] [PubMed]
- Colas, F. Propriétés optiques et thermoplasmoniques de réseaux de nanocylindres: Applications à la détection de molécules et de micro-objets. Phdthesis. Ph.D. Thesis, Université Sorbonne Paris Cité, Paris, France, 2017. [Google Scholar]
- Yoshida, K.; Itoh, T.; Biju, V.; Ishikawa, M.; Ozaki, Y. Experimental Evaluation of the Twofold Electromagnetic Enhancement Theory of Surface-Enhanced Resonance Raman Scattering. Phys. Rev. B 2009, 79, 085419. [Google Scholar] [CrossRef]
- Ding, S.-Y.; You, E.-M.; Tian, Z.-Q.; Moskovits, M. Electromagnetic Theories of Surface-Enhanced Raman Spectroscopy. Chem. Soc. Rev. 2017, 46, 4042–4076. [Google Scholar] [CrossRef]
- Albrecht, A.C. On the Theory of Raman Intensities. J. Chem. Phys. 2004, 34, 1476. [Google Scholar] [CrossRef]
- Guillot, N.; De La Chapelle, M.L. Lithographied nanostructures as nanosensors. J. Nanophotonics 2012, 6, 064506. [Google Scholar] [CrossRef]
- Edely, M.; Delorme, N.; Siniscalco, D.; Bardeau, J.-F. Alternative strategy based on scanning probe lithography for patterning complex metallic nanostrutures on rigid or flexible substrates. Adv. Mater. Technol. 2018, 3, 1800134. [Google Scholar] [CrossRef]
- Azziz, A.; Safar, W.; Xiang, Y.; Edely, M.; de la Chapelle, M.L. Sensing performances of commercial SERS substrates. J. Mol. Struct. 2022, 1248, 131519. [Google Scholar] [CrossRef]
- Li, X.; Keshavarz, M.; Kassanos, P.; Kidy, Z.; Roddan, A.; Yeatman, E.; Thompson, A.J. SERS Detection of Breast Cancer-Derived Exosomes Using a Nanostructured Pt-Black Template. Adv. Sens. Res. 2023, 2, 2200039. [Google Scholar] [CrossRef]
- Cottat, M.; Yasukuni, R.; Homma, Y.; Lidgi-Guigui, N.; Varin-Blank, N.; de la Chapelle, M.L.; Le Roy, C. Phosphorylation impact on spleen tyrosine kinase conformation by surface enhanced Raman spectroscopy. Sci. Rep. 2017, 7, 39766. [Google Scholar] [CrossRef]
- He, Y.; Su, S.; Xu, T.; Zhong, Y.; Zapien, J.A.; Li, J.; Fan, C.; Lee, S.-T. Silicon Nanowires-Based Highly-Efficient SERS-Active Platform for Ultrasensitive DNA Detection. Nano Today 2011, 6, 122–130. [Google Scholar] [CrossRef]
- He, Z.; Han, Z.; Kizer, M.; Linhardt, R.J.; Wang, X.; Sinyukov, A.M.; Wang, J.; Deckert, V.; Sokolov, A.V.; Hu, J.; et al. Tip-Enhanced Raman Imaging of Single-Stranded DNA with Single Base Resolution. J. Am. Chem. Soc. 2018, 141, 753–757. [Google Scholar] [CrossRef] [PubMed]
- Pashaee, F.; Tabatabaei, M.; Caetano, F.A.; Ferguson, S.S.G.; Lagugné-Labarthet, F. Tip-Enhanced Raman Spectroscopy: Plasmid-Free vs. Plasmid-Embedded DNA. Analyst 2016, 141, 3251–3258. [Google Scholar] [CrossRef] [PubMed]
- Garcia-Rico, E.; Alvarez-Puebla, R.A.; Guerrini, L. Direct Surface-Enhanced Raman Scattering (SERS) Spectroscopy of Nucleic Acids: From Fundamental Studies to Real-Life Applications. Chem. Soc. Rev. 2018, 47, 4909–4923. [Google Scholar] [CrossRef]
- Deckert-Gaudig, T.; Deckert, V. Tip-Enhanced Raman Scattering ( TERS ) and High-Resolution Bio Nano-Analysis—A Comparison. Phys. Chem. Chem. Phys. 2010, 12, 12040–12049. [Google Scholar] [CrossRef]
- Bailo, E.; Deckert, V. Tip-Enhanced Raman Scattering. Chem. Soc. Rev. 2008, 37, 921–930. [Google Scholar] [CrossRef]
- Dahm, R. Friedrich Miescher and the Discovery of DNA. Dev. Biol. 2005, 278, 274–288. [Google Scholar] [CrossRef] [PubMed]
- Patejko, M.; Struck-Lewicka, W.; Siluk, D.; Waszczuk-Jankowska, M.; Markuszewski, M.J. Urinary Nucleosides and Deoxynucleosides. Adv. Clin. Chem. 2018, 83, 1–51. [Google Scholar] [CrossRef] [PubMed]
- Watson, J.D.; Crick, F.H.C. The structure of DNA. Cold Spring Harb. Symp. Quant. Biol. 1953, 18, 123–131. [Google Scholar] [CrossRef]
- Ussery, D.W. DNA Structure: A-, B- and Z-DNA Helix Families. Encycl. Life Sci. 2002, 1, e003122. [Google Scholar]
- Laigle, A.; Chinsky, L.; Turpin, P.-Y.; Liquier, J.; Taillandier, E. Spécificité des interactions DNA-peptides et DNA-histones en spectroscopie de résonance Raman dans l’ultraviolet. Biochimie 1982, 63, 831–833. [Google Scholar] [CrossRef]
- Mathlouthi, M.; Seuvre, A.M.; Koenig, J.L. Ft.-ir and Laser-Raman Spectra of Adenine and Adenosine. Carbohydr. Res. 1984, 131, 1–15. [Google Scholar] [CrossRef]
- Mathlouthi, M.; Seuvre, A.M.; Koenig, J.L. F.T.-I.R. and Laser-Raman Spectra of Guanine and Guanosine. Carbohydr. Res. 1986, 146, 15–27. [Google Scholar] [CrossRef] [PubMed]
- Mathlouthi, M.; Seuvre, A.M.; Koenig, J.L. F.T.-I.R. and Laser-Raman Spectra of Cytosine and Cytidine. Carbohydr. Res. 1986, 146, 1–13. [Google Scholar] [CrossRef] [PubMed]
- Zhang, L.; Li, Q.; Tao, W.; Yu, B.; Du, Y. Quantitative Analysis of Thymine with Surface-Enhanced Raman Spectroscopy and Partial Least Squares (PLS) Regression. Anal. Bioanal. Chem. 2010, 398, 1827–1832. [Google Scholar] [CrossRef] [PubMed]
- Carmona, P.; Molina, M. Raman and Infrared Spectra of D-ribose and D-ribose 5-phosphate. J. Raman Spectrosc. 1990, 21, 395–400. [Google Scholar] [CrossRef]
- Nishimura, Y.; Tsuboi, M.; Sato, T. Structure-Spectrum Correlations in Nucleic Acids. I. Raman Lines in the 600–700 Cm −1 Range of Guanosine Residue. Nucleic Acids Res 1984, 12, 6901–6908. [Google Scholar] [CrossRef]
- Lee, S.A.; Li, J.; Anderson, A.; Smith, W.; Griffey, R.H.; Mohan, V. Temperature-dependent Raman and Infrared Spectra of Nucleosides. II—Cytidine. J. Raman Spectrosc. 2001, 32, 795–802. [Google Scholar] [CrossRef]
- Jang, N.-H. The Coordination Chemistry of DNA Nucleosides on Gold Nanoparticles as a Probe by SERS-Bulletin of the Korean Chemical Society|Korea Science. Available online: http://www.koreascience.or.kr/article/JAKO200202727080320.page (accessed on 24 March 2020).
- Mathlouthi, M.; Seuvre, A.M.; Koenig, J.L. F.T.-I.R. and Laser-Raman Spectra of Thymine and Thymidine. Carbohydr. Res. 1984, 134, 23–38. [Google Scholar] [CrossRef]
- Rimai, L. Studies of Raman Spectra of Water Solutions of Adenosine Tri-, Di-, and Monophosphate and Some Related Compounds. Biophys. J. 1969, 9, 320–329. [Google Scholar] [CrossRef]
- Forrest, G.; Lord, R.C. Laser Raman Spectroscopy of Biomolecules. X-frequency and Intensity of the Phosphodiester Stretching Vibrations of Cyclic Nucleotides. J. Raman Spectrosc. 1977, 6, 32–37. [Google Scholar] [CrossRef]
- Benevides, J.M.; Wang, A.H.J.; Van der Marel, G.A.; Van Boom, J.H.; Thomas, G.J., Jr. Effect of the G.T Mismatch on Backbone and Sugar Conformations of Z-DNA and B-DNA: Analysis by Raman Spectroscopy of Crystal and Solution Structures of d(CGCGTG) and d(CGCGCG). Biochemistry 1989, 28, 304–310. [Google Scholar] [CrossRef]
- Benevides, J.M.; Wang, A.H.J.; Van der Marel, G.A.; Van Boom, J.H.; Thomas, G.J., Jr. Crystal and Solution Structures of the B-DNA Dodecamer d(CGCAAATTTGCG) Probed by Raman Spectroscopy: Heterogeneity in the Crystal Structure Does Not Persist in the Solution Structure. Biochemistry 1988, 27, 931–938. [Google Scholar] [CrossRef] [PubMed]
- Prescott, B.; Steinmetz, W.; Thomas, G.J. Characterization of DNA Structures by Laser Raman Spectroscopy. Biopolymers 1984, 23, 235–256. [Google Scholar] [CrossRef] [PubMed]
- Thornton, J.; Forcé, R.K. Surface-Enhanced Raman Spectroscopy of Nucleic Acid Compounds and Their Mixtures. Appl. Spectrosc. AS 1991, 45, 1522–1526. [Google Scholar] [CrossRef]
- Bell, S.E.J.; Sirimuthu, N.M.S. Surface-Enhanced Raman Spectroscopy (SERS) for Sub-Micromolar Detection of DNA/RNA Mononucleotides. J. Am. Chem. Soc. 2006, 128, 15580–15581. [Google Scholar] [CrossRef]
- Potara, M.; Baia, M.; Farcau, C.; Astilean, S. Chitosan-Coated Anisotropic Silver Nanoparticles as a SERS Substrate for Single-Molecule Detection. Nanotechnology 2012, 23, 055501. [Google Scholar] [CrossRef] [PubMed]
- Camafeita, L.E.; Sánchez-Cortés, S.; García-Ramos, J.V. SERS of Guanine and Its Alkyl Derivatives on Gold Sols. J. Raman Spectrosc. 1996, 27, 533–537. [Google Scholar] [CrossRef]
- Śanchez-Cortés, S.; Garcia-Ramos, J.V. SERS of Cytosine and Its Methylated Derivatives on Metal Colloids. J. Raman Spectrosc. 1992, 23, 61–66. [Google Scholar] [CrossRef]
- Agarwal, S.; Ray, B.; Mehrotra, R. SERS as an Advanced Tool for Investigating Chloroethyl Nitrosourea Derivatives Complexation with DNA. Int. J. Biol. Macromol. 2015, 81, 891–897. [Google Scholar] [CrossRef]
- Green, M.; Liu, F.-M.; Cohen, L.; Köllensperger, P.; Cass, T. SERS Platforms for High Density DNA Arrays. Faraday Discuss. 2006, 132, 269–280. [Google Scholar] [CrossRef]
- He, L.; Langlet, M.; Bouvier, P.; Calers, C.; Pradier, C.-M.; Stambouli, V. New Insights into Surface-Enhanced Raman Spectroscopy Label-Free Detection of DNA on Ag/TiO2 Substrate. J. Phys. Chem. C 2014, 118, 25658–25670. [Google Scholar] [CrossRef]
- Kundu, J.; Neumann, O.; Janesko, B.G.; Zhang, D.; Lal, S.; Barhoumi, A.; Scuseria, G.E.; Halas, N.J. Adenine− and Adenosine Monophosphate (AMP)−Gold Binding Interactions Studied by Surface-Enhanced Raman and Infrared Spectroscopies. J. Phys. Chem. C 2009, 113, 14390–14397. [Google Scholar] [CrossRef]
- Oldenburg, S.; Averitt, R.; Westcott, S.; Halas, N. Nanoengineering of Optical Resonances. Chem. Phys. Lett. 1998, 288, 243–247. [Google Scholar] [CrossRef]
- Papadopoulou, E.; Bell, S.E.J. DNA Reorientation on Au Nanoparticles: Label-Free Detection of Hybridization by Surface Enhanced Raman Spectroscopy. Chem. Commun. 2011, 47, 10966–10968. [Google Scholar] [CrossRef]
- Papadopoulou, E.; Bell, S.E.J. Label-Free Detection of Single-Base Mismatches in DNA by Surface-Enhanced Raman Spectroscopy. Angew. Chem. Int. Ed. 2011, 50, 9058–9061. [Google Scholar] [CrossRef] [PubMed]
- Papadopoulou, E.; Bell, S.E.J. Label-Free Detection of Nanomolar Unmodified Single- and Double-Stranded DNA by Using Surface-Enhanced Raman Spectroscopy on Ag and Au Colloids. Chem.–A Eur. J. 2012, 18, 5394–5400. [Google Scholar] [CrossRef] [PubMed]
- Xu, L.-J.; Lei, Z.-C.; Li, J.; Zong, C.; Yang, C.J.; Ren, B. Label-Free Surface-Enhanced Raman Spectroscopy Detection of DNA with Single-Base Sensitivity. J. Am. Chem. Soc. 2015, 137, 5149–5154. Available online: https://pubs.acs.org/doi/abs/10.1021/jacs.5b01426 (accessed on 17 March 2020). [CrossRef] [PubMed]
- Guerrini, L.; Krpetić, Ž.; van Lierop, D.; Alvarez-Puebla, R.A.; Graham, D. Direct Surface-Enhanced Raman Scattering Analysis of DNA Duplexes. Angew. Chem. Int. Ed. 2015, 54, 1144–1148. [Google Scholar] [CrossRef]
- Masetti, M.; Xie, H.; Krpetić, Ž.; Recanatini, M.; Alvarez-Puebla, R.A.; Guerrini, L. Revealing DNA Interactions with Exogenous Agents by Surface-Enhanced Raman Scattering. J. Am. Chem. Soc. 2015, 137, 469–476. [Google Scholar] [CrossRef]
- Hartwich, G. Characterization of DNA Probes Immobilized on Gold Surfaces. J. Am. Chem. Soc. 1997, 119, 8916–8920. Available online: https://pubs.acs.org/doi/abs/10.1021/ja9719586 (accessed on 16 March 2020).
- Barhoumi, A.; Zhang, D.; Halas, N.J. Correlation of Molecular Orientation and Packing Density in a DsDNA Self-Assembled Monolayer Observable with Surface-Enhanced Raman Spectroscopy. J. Am. Chem. Soc. 2008, 130, 14040–14041. [Google Scholar] [CrossRef]
- Barhoumi, A.; Zhang, D.; Tam, F.; Halas, N.J. Surface-Enhanced Raman Spectroscopy of DNA. J. Am. Chem. Soc. 2008, 130, 5523–5529. [Google Scholar] [CrossRef]
- Barhoumi, A.; Halas, N.J. Label-Free Detection of DNA Hybridization Using Surface Enhanced Raman Spectroscopy. J. Am. Chem. Soc. 2010, 132, 12792–12793. [Google Scholar] [CrossRef] [PubMed]
- Waybrant, B.; Pearce, T.R.; Kokkoli, E. Effect of Polyethylene Glycol, Alkyl, and Oligonucleotide Spacers on the Binding, Secondary Structure, and Self-Assembly of Fractalkine Binding FKN-S2 Aptamer-Amphiphiles. Available online: https://pubs.acs.org/doi/abs/10.1021/la500403v (accessed on 30 April 2020).
- Demers, L.M.; Mirkin, C.A.; Mucic, R.C.; Reynolds, R.A.; Letsinger, R.L.; Elghanian, R.; Viswanadham, G. A Fluorescence-Based Method for Determining the Surface Coverage and Hybridization Efficiency of Thiol-Capped Oligonucleotides Bound to Gold Thin Films and Nanoparticles. Anal. Chem. 2000, 72, 5535–5541. Available online: https://pubs.acs.org/doi/abs/10.1021/ac0006627 (accessed on 29 April 2020). [CrossRef] [PubMed]
- Pagba, C.V.; Lane, S.M.; Wachsmann-Hogiu, S. Raman and Surface-enhanced Raman Spectroscopic Studies of the 15-mer DNA Thrombin-binding Aptamer. J. Raman Spectrosc. 2010, 41, 241–247. [Google Scholar] [CrossRef]
- Yasukuni, R.; Gillibert, R.; Triba, M.N.; Grinyte, R.; Pavlov, V.; Chapelle, M.L. de la Quantitative Analysis of SERS Spectra of MnSOD over Fluctuated Aptamer Signals Using Multivariate Statistics. Nanophotonics 2019, 8, 1477–1483. [Google Scholar] [CrossRef]
- Safar, W.; Tatar, A.-S.; Leray, A.; Potara, M.; Liu, Q.; Edely, M.; Djaker, N.; Spadavecchia, J.; Fu, W.; Derouich, S.G.; et al. New Insight into the Aptamer Conformation and Aptamer/Protein Interaction by Surface-Enhanced Raman Scattering and Multivariate Statistical Analysis. Nanoscale 2021, 13, 12443–12453. [Google Scholar] [CrossRef]
- Gillibert, R.; Triba, M.N.; de la Chapelle, M.L. Surface Enhanced Raman Scattering Sensor for Highly Sensitive and Selective Detection of Ochratoxin A. Analyst 2018, 143, 339–345. [Google Scholar] [CrossRef] [PubMed]
- Ichimura, T.; Watanabe, H.; Morita, Y.; Verma, P.; Kawata, S.; Inouye, Y. Temporal Fluctuation of Tip-Enhanced Raman Spectra of Adenine Molecules. J. Phys. Chem. C 2007, 111, 9460–9464. Available online: https://pubs.acs.org/doi/abs/10.1021/jp070420b (accessed on 28 April 2021). [CrossRef]
- Rasmussen, A.; Deckert, V. Surface- and Tip-enhanced Raman Scattering of DNA Components. J. Raman Spectrosc. 2006, 37, 311–317. [Google Scholar] [CrossRef]
- Budich, C.; Neugebauer, U.; Popp, J.; Deckert, V. Cell Wall Investigations Utilizing Tip-Enhanced Raman Scattering. J. Microsc. 2008, 229, 533–539. [Google Scholar] [CrossRef]
- Treffer, R.; Lin, X.; Bailo, E.; Deckert-Gaudig, T.; Deckert, V. Distinction of Nucleobases—A Tip-Enhanced Raman Approach. Beilstein J. Nanotechnol. 2011, 2, 628–637. [Google Scholar] [CrossRef] [PubMed]
- Najjar, S.; Talaga, D.; Schué, L.; Coffinier, Y.; Szunerits, S.; Boukherroub, R.; Servant, L.; Rodriguez, V.; Bonhommeau, S. Tip-Enhanced Raman Spectroscopy of Combed Double-Stranded DNA Bundles. J. Phys. Chem. C 2014, 118, 1174–1181. Available online: https://pubs.acs.org/doi/abs/10.1021/jp410963z (accessed on 25 April 2022). [CrossRef]
- Otto, C.; van den Tweel, T.J.J.; de Mul, F.F.M.; Greve, J. Surface-enhanced Raman Spectroscopy of DNA Bases. J. Raman Spectrosc. 1986, 17, 289–298. [Google Scholar] [CrossRef]
- Thomas, G.; Benevides, J.; Overman, S.; Ueda, T.; Ushizawa, K.; Saitoh, M.; Tsuboi, M. Polarized Raman Spectra of Oriented Fibers of A DNA and B DNA: Anisotropic and Isotropic Local Raman Tensors of Base and Backbone Vibrations. Biophys. J. 1995, 68, 1073. [Google Scholar] [CrossRef]
- Huser, T.; Orme, C.A.; Hollars, C.W.; Corzett, M.H.; Balhorn, R. Raman Spectroscopy of DNA Packaging in Individual Human Sperm Cells Distinguishes Normal from Abnormal Cells. J. Biophotonics 2009, 2, 322–332. [Google Scholar] [CrossRef] [PubMed]
- Morla-Folch, J.; Xie, H.; Gisbert-Quilis, P.; Pedro, S.G.; Pazos-Perez, N.; Alvarez-Puebla, R.A.; Guerrini, L. Ultrasensitive Direct Quantification of Nucleobase Modifications in DNA by Surface-Enhanced Raman Scattering: The Case of Cytosine. Angew. Chem. Int. Ed. 2015, 54, 13650–13654. [Google Scholar] [CrossRef]


Disclaimer/Publisher’s Note: The statements, opinions and data contained in all publications are solely those of the individual author(s) and contributor(s) and not of MDPI and/or the editor(s). MDPI and/or the editor(s) disclaim responsibility for any injury to people or property resulting from any ideas, methods, instructions or products referred to in the content. |
© 2023 by the authors. Licensee MDPI, Basel, Switzerland. This article is an open access article distributed under the terms and conditions of the Creative Commons Attribution (CC BY) license (https://creativecommons.org/licenses/by/4.0/).