Communication

Screening the Specific Surface Area for Metal-Organic Frameworks by Cataluminescence

1
State Key Laboratory of Chemical Resource Engineering, Beijing University of Chemical Technology, Beijing 100029, China
2
Green Catalysis Center, College of Chemistry, Zhengzhou University, Zhengzhou 450001, China
*
Authors to whom correspondence should be addressed.
Chemosensors 2023, 11(5), 292; https://doi.org/10.3390/chemosensors11050292
Submission received: 6 April 2023 / Revised: 11 May 2023 / Accepted: 12 May 2023 / Published: 14 May 2023

Abstract

:
Metal-organic frameworks (MOFs) are famous for their large surface area, which is responsible for the dispersed active sites and decent behaviors in gas adsorption, storage, and catalytic reactions. However, it remains a great challenge to acquire a cost-effective and accurate evaluation on the surface area for the MOFs. In this work, we have proposed cataluminescence (CTL) to evaluate the specific surface area for the MOFs, based on the adsorption–desorption and the catalytic reaction of ethanol. Aluminum-based MOFs with large-pore (lp), narrow-pore (np), and medium-pore (mp-130, mp-140, and mp-150 synthesized under 130, 140, and 150 °C) have been prepared. Distinguished CTL signals were acquired from ethanol in the presence of these MOFs: lp > mp-150 > mp-130 > mp-140 > np. Note that the CTL intensities were positively correlated with the specific surface areas of these MOFs acquired by the Brunauer–Emmett–Teller (BET) method. The distinct specific surface area of MOFs determined the capacity to accommodate and activate ethanol, leading to the varied CTL intensity signals. Therefore, the proposed CTL could be utilized for the rapid and accurate evaluation of the specific surface area for MOFs. It is believed that this CTL strategy showed great possibilities in the structural evaluation for various porous materials.

1. Introduction

Metal-organic frameworks (MOFs) are a class of crystalline coordination materials that are composed of organic connectors and inorganic nodes [1,2]. MOFs have been regarded as excellent candidates for gas adsorption, storage, and the corresponding catalytic reactions [3,4]. The diverse functionalities of MOFs are highly dependent on their high porosity and large surface area [5,6]. The variations in the pore structures of MOFs, such as the known “breathing” behaviors, with the changed textural properties also manifesting as the specific surface area [7,8,9]. It is noteworthy that the large surface area of MOFs favored good dispersion of active centers, facilitating the adsorption, enrichment, and reaction of analytes [10,11]. The value of the surface area has been regarded as the key factor to determine the capacity of MOFs to accommodate and concentrate guest molecules for gas adsorption and the subsequent reaction [12,13,14,15]. Moreover, the large surface area of MOFs is beneficial for the synthesis reaction and functional modification, offering an infinite platform to prepare MOF-based composites for different applications [11,16,17]. Therefore, it is a topic of interest and significance to estimate the surface area of MOFs, in order to analyze the adsorption, storage, and catalytic performances for MOFs.
The Brunauer–Emmett–Teller (BET) method is known as the most commonly applied technique to evaluate the specific surface area and pore volume for a material [18,19,20]. The BET measurements are generally implemented through the isothermal adsorption of nitrogen at 77 K, and the adsorption capacity of the material can be evaluated by the adsorption–desorption curves [21,22,23,24]. However, N2 diffuses slowly in the samples at the low temperature ranges, around 77 K, and thus a long equilibration time is required to achieve fully equilibrated nitrogen isotherms for data acquisition [21]. The complex experimental equipment and time-consuming process have hampered the applications of BET to evaluate the textural structure of the MOFs. Moreover, it usually requires large quantities of samples to achieve accurate statistical results, and insufficient samples could result in largely derived results [25]. These requirements mean that BET failed to provide high-throughput analyses to meet the needs of the rapid development for MOFs in recent years. Therefore, it is critical to establish an accurate and cost-effective strategy to evaluate the surface area and adsorption capacity of MOF materials.
Cataluminescence (CTL) is derived from the luminescence emissions of the species generated during a chemical reaction [26,27,28]. It requires a featured catalyst with a large specific surface area and abundant active sites during a chemical reaction, and the CTL emissions are dependent on the adsorption and catalytic behaviors of the catalyst [29,30,31,32]. Herein, we have employed CTL emissions to evaluate the surface area of MOFs, taking the catalytic oxidation of ethanol as a model system. The aluminum-based MOFs with the large-pore (lp), narrow-pore (np), and medium-pore phases synthesized under different temperatures (short as mp-130, mp-140, and mp-150) were prepared. The CTL intensities in the presence of these different MOF catalysts showed distinct, repeatable, and highly sensitive signals, according to a tendency as follows: lp > mp-150 > mp-130 > mp-140 > np. It should be noted that the CTL intensities of ethanol are highly correlated with the specific surface areas acquired by the BET measurements for the MOFs (Scheme 1). A positive relationship between the CTL intensity (I) and specific surface area from BET measurements (SA) could be drawn as follows: I = −4.94 × 10⁴ exp (4.39 × 10⁻³ SA) + 6.88 × 10⁴. Such a correlation could be ascribed to the distinct specific surface area of MOFs that is responsible for the adsorption, desorption, and catalytic oxidation towards ethanol during the CTL measurements. Therefore, we have proposed CTL as a fast, sensitive, and cost-effective approach to screen the specific surface area of MOF materials in the absence of sophisticated data analysis or a time-consuming process. Based on the distinct adsorption and catalytic performances of a material with varied structures, it is anticipated that the CTL could be further used to evaluate the structural variations of other materials.

2. Materials and Methods

2.1. Chemicals and Materials

All the reagents used in this work were of analytical grade and used without further purification. Al(NO3)3·9H2O was provided by Beijing Chemical Works. AlCl3·6H2O was purchased from Xilong Science Co., Ltd. N, N-dimethylformamide (DMF) was purchased from Tianjin Fuyu Fine Chemical Co., Ltd. (Tianjin, China). 2, 2′-Bipyridine-5, 5′-dicarboxylic acid (H2bpydc) was supplied by Shanghai Titan Scientific Co., Ltd. (Shanghai, China). Acetic acid glacial was purchased from Tianjin Damao Chemical Reagent Factory (Tianjin, China). NaOH was provided by Fuchen (Tianjin) Chemical Reagent Co., Ltd. (Tianjin, China).

2.2. Synthesis of the Narrow-Pore (np) Form of Al-Based MOF

The Al2(OH)2(bpydc)∙(H2O)0.5 (short as np) was synthesized by an environmentally friendly hydrothermal method, and the unit cell parameters of np phase are a = 5.36 Å, b = 4.58 Å, c = 26.76 Å, α = 90°, β = 93.3°, and γ = 90° [7]. Specifically, Al(NO3)3·9H2O (0.1 mmol, 0.375 g) and H2bpydc (0.25 mmol, 0.061 g) were dissolved in H2O (12.5 mL) containing 2.5 mmol of NaOH. The pH of the mixture was ~3.5. The mixture was placed in a 23 mL Teflon-lined stainless autoclave and heated at 120 °C for 24 h. After cooling to room temperature, the synthesized np was collected by centrifugation and dried at 60 °C.

2.3. Synthesis of the Large-Pore (lp) Form of Al-Based MOF

The macroporous Al(OH)(bpydc) (labelled as lp) was prepared through a hydrothermal method, and the unit cell parameters of the lp phase are determined as a = 23.59 Å, b = 6.91 Å, and c = 19.84 Å [33]. Briefly, the mixture of AlCl3·6H2O (0.151 g, 0.625 mmol), H2bpydc (0.153 g, 0.625 mmol), DMF (10 mL), and glacial acetic acid (859 µL, 15.0 mmol) was placed in 23 mL of Teflon-lined stainless autoclave. The pH of the mixture was ~2.7. This mixture was heated at 120 °C for 24 h, followed by the centrifugation and drying procedure to acquire the MOFs with the lp phase. Note that the lp phase is the macroporous form of np, and the lp phase can be converted to np phase after hydrothermal treatment in water gradually [7].

2.4. Synthesis of the Medium-Pore (mp) Phase of Al-Based MOF

The medium-pore (mp) phases were synthesized by hydrothermal treatment of the lp phase under different temperatures. In total, 0.15 g of the lp phase was dispersed into 15 mL of water and transferred into a Teflon-lined stainless autoclave. The hydrothermal treatment was carried out at 150 °C, 140 °C, and 130 °C for 12 h, respectively. The as-prepared mp phases were cooled to room temperature, centrifuged, and dried to acquire mp-150, mp-140, and mp-130, respectively.

2.5. Apparatus and Characterization

The morphologies of the MOFs were investigated using a JEOL (JEOL, Akishima, Japan) S-4700 scanning electron microscope (SEM). The crystalline structures of the MOFs were characterized by X-ray diffraction (XRD) on Bruker (Karlsruhe, Germany) D8 ADVANCE equipped with graphite-monochromatized Cu Kα radiation (λ = 1.5406 Å).

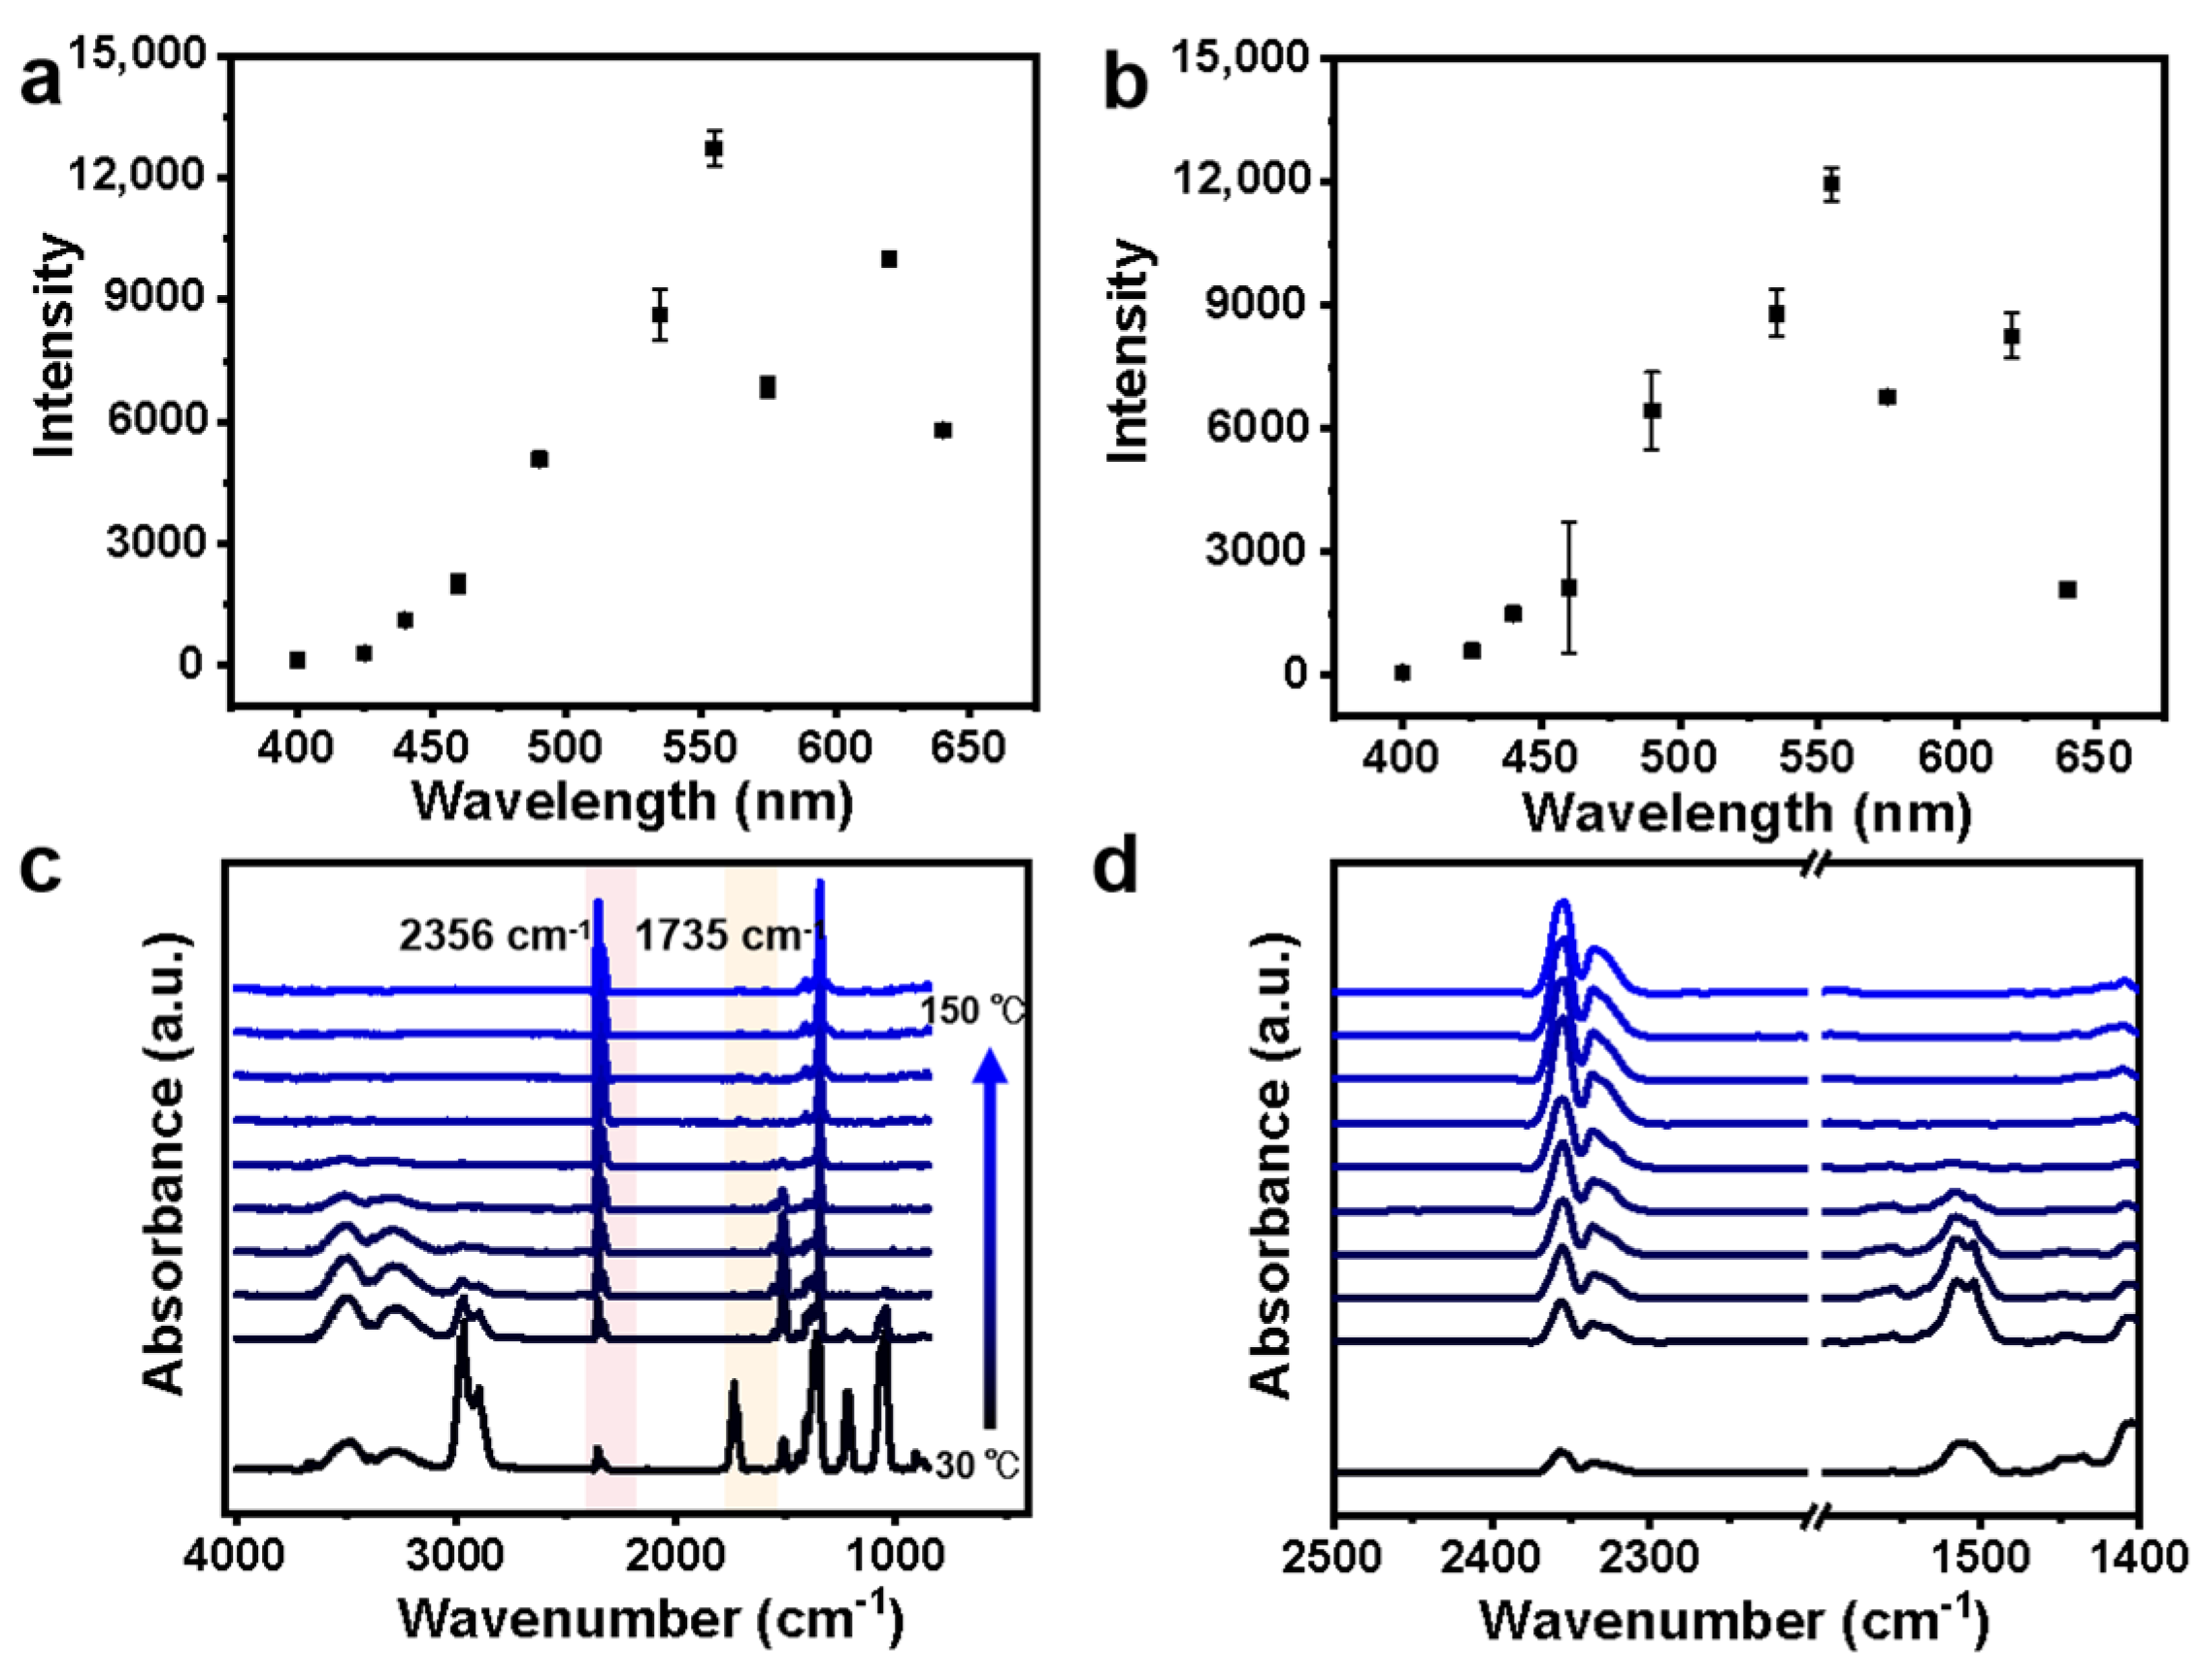
2.6. Fourier Transform Infrared (FT-IR) Measurements

The FT-IR spectra for the samples before and after reactions were implemented on a Nicolet 6700 FTIR spectrometer (Thermo, Waltham, MA, USA) with KBr particles, and the spectra were collected in the range of 2200–400 cm−1. In-situ Fourier transform infrared (FT-IR) spectra were acquired through a Nicolet 380 system (Thermo, Waltham, MA, USA) containing a controlled environment chamber with a CaF2 window. The in-situ cell was loaded with the sample and placed in the diffuse reflectance device. The temperature was first programmed to 150 °C and maintained for 30 min under air purging. After cooling down, a background in the range of 30–150 °C was collected. Afterwards, ethanol was fed to the sample to reach an adsorption equilibrium, and the samples were purged until no changes in the infrared spectra. The IR signals were scanned through a programmed heating procedure from room temperature to 150 °C at a heating rate of 10 °C/min. The spectra were collected in the range of 4000–650 cm−1, with a resolution of 8 cm−1 and an integration order of 64.

2.7. Gas Chromatography–Mass Spectrometry (GC–MS) Measurements

The oxidation products of ethanol by the MOF catalysts were investigated by gas chromatography–mass spectrometry (GC–MS). It was performed on a Thermo Trace 1300-ISQ GC-MS system (Thermo, Waltham, MA, USA) equipped with a TR-5MS column (length of 30 m, inner diameter of 0.25 mm, and the film thickness of 0.25 μm). The tail gas produced during the CTL reaction was collected through 10 mL of acetonitrile (liquid chromatography gradient) for about 4 h.

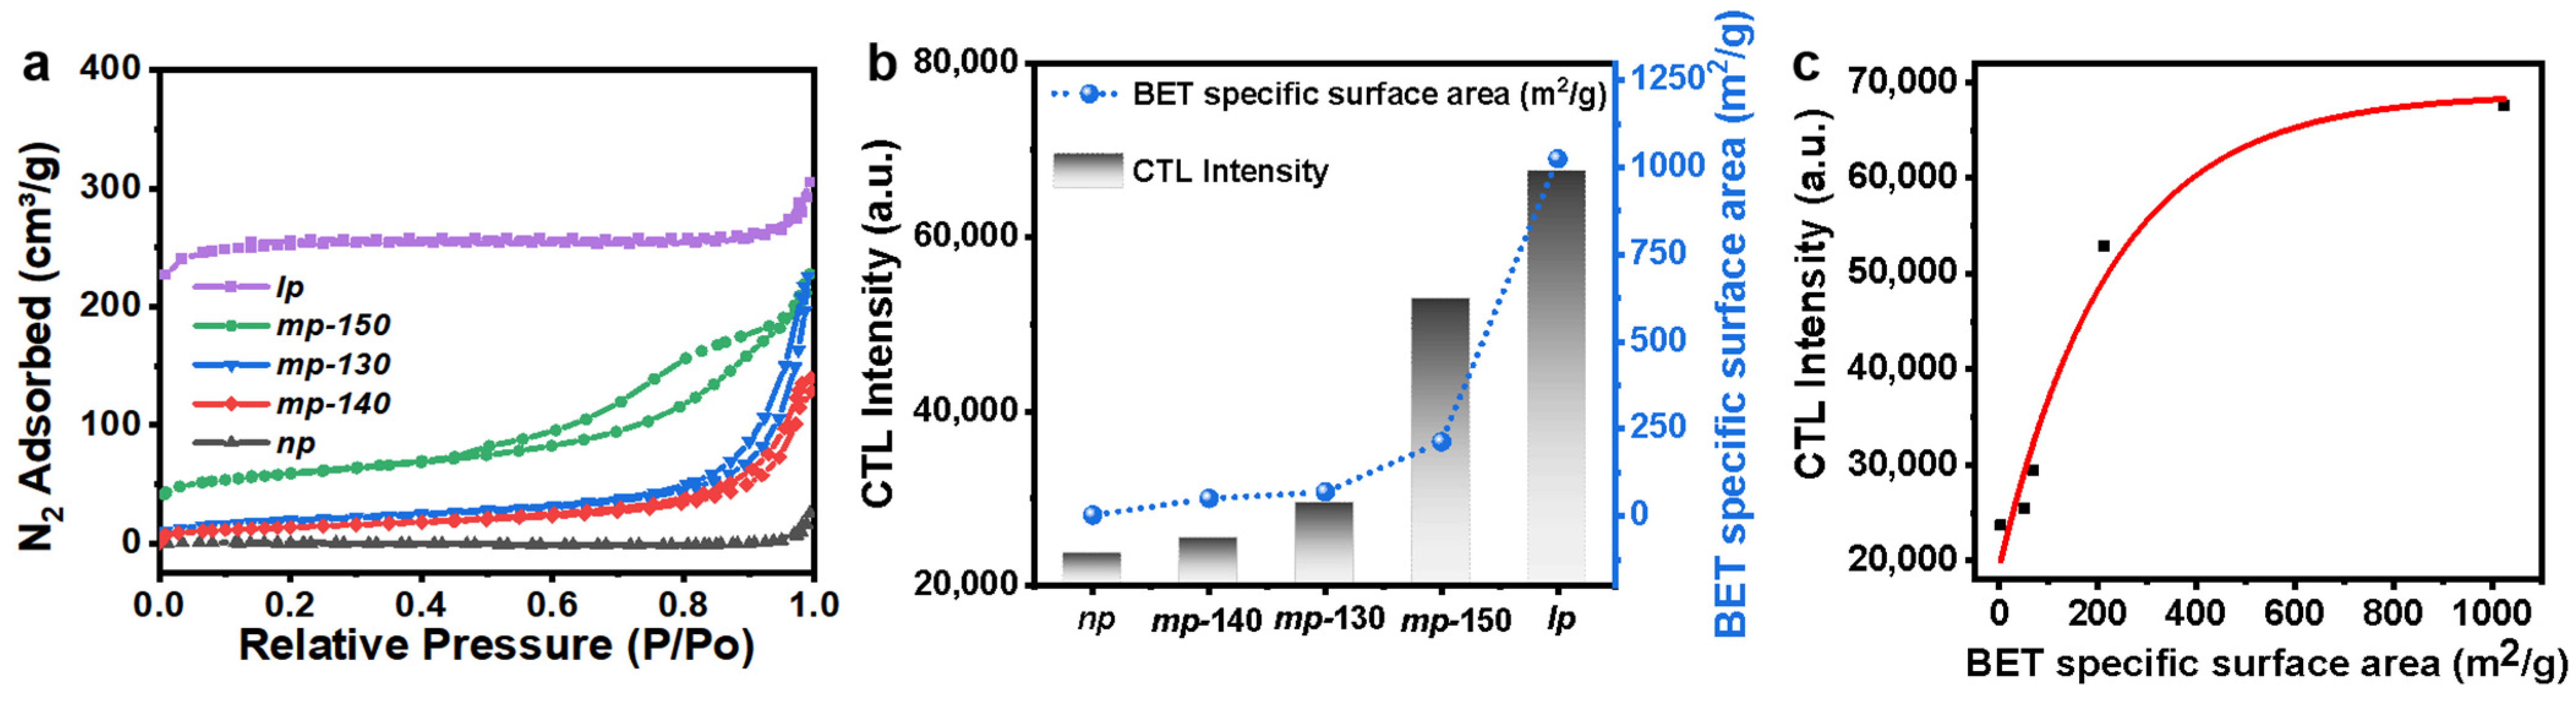
2.8. Brunauer–Emmett–Teller (BET) Measurements

Desorption isotherms were measured at 77 K by the Brunauer–Emmett–Teller (BET) method using an Autosorb-IQ-MP nitrogen adsorption device (Quantachrome, Boynton Beach, FL, USA).

2.9. Thermogravimetric Analysis (TGA) Measurements

Thermogravimetric analysis (TGA) of the samples was performed on a simultaneous thermal analyzer 6000 (PerkinElmer) at a heating rate of 10 °C/min in nitrogen from 30 °C to 800 °C. The data were analyzed in the range of 45–450 °C in the supporting information.

2.10. Cataluminescence (CTL) Measurements

The CTL signals were detected by a biophysical chemiluminescence (BPCL) luminescence analyzer (Institute of Biophysics, Chinese Academy of Sciences, Beijing, China), and the volatile organic gases were transported by air pump (Beijing Zhongxing Huili Co., Ltd., Beijing, China). First, 0.01 g of MOF catalyst was dispersed into 200 μL of deionized water. After ultrasonic treatment for 5 min, a uniform suspension was acquired. The suspension was evenly spread onto the surface of the ceramic rod, followed by natural air-drying. Afterwards, 50 μL of absolute ethanol was injected into the vaporization chamber, and the reactant was brought into the reaction chamber by an air pump. The flow rates of the carrier gas were set in the range of 160–400 mL·min−1, and the heating voltages of the ceramic rod varied from 100 to 125 V. Finally, the CTL signals were output to the computer for data analysis, with the voltage of the BPCL analyzer set at −1000 V and an integration time of 1 s.

3. Results and Discussion

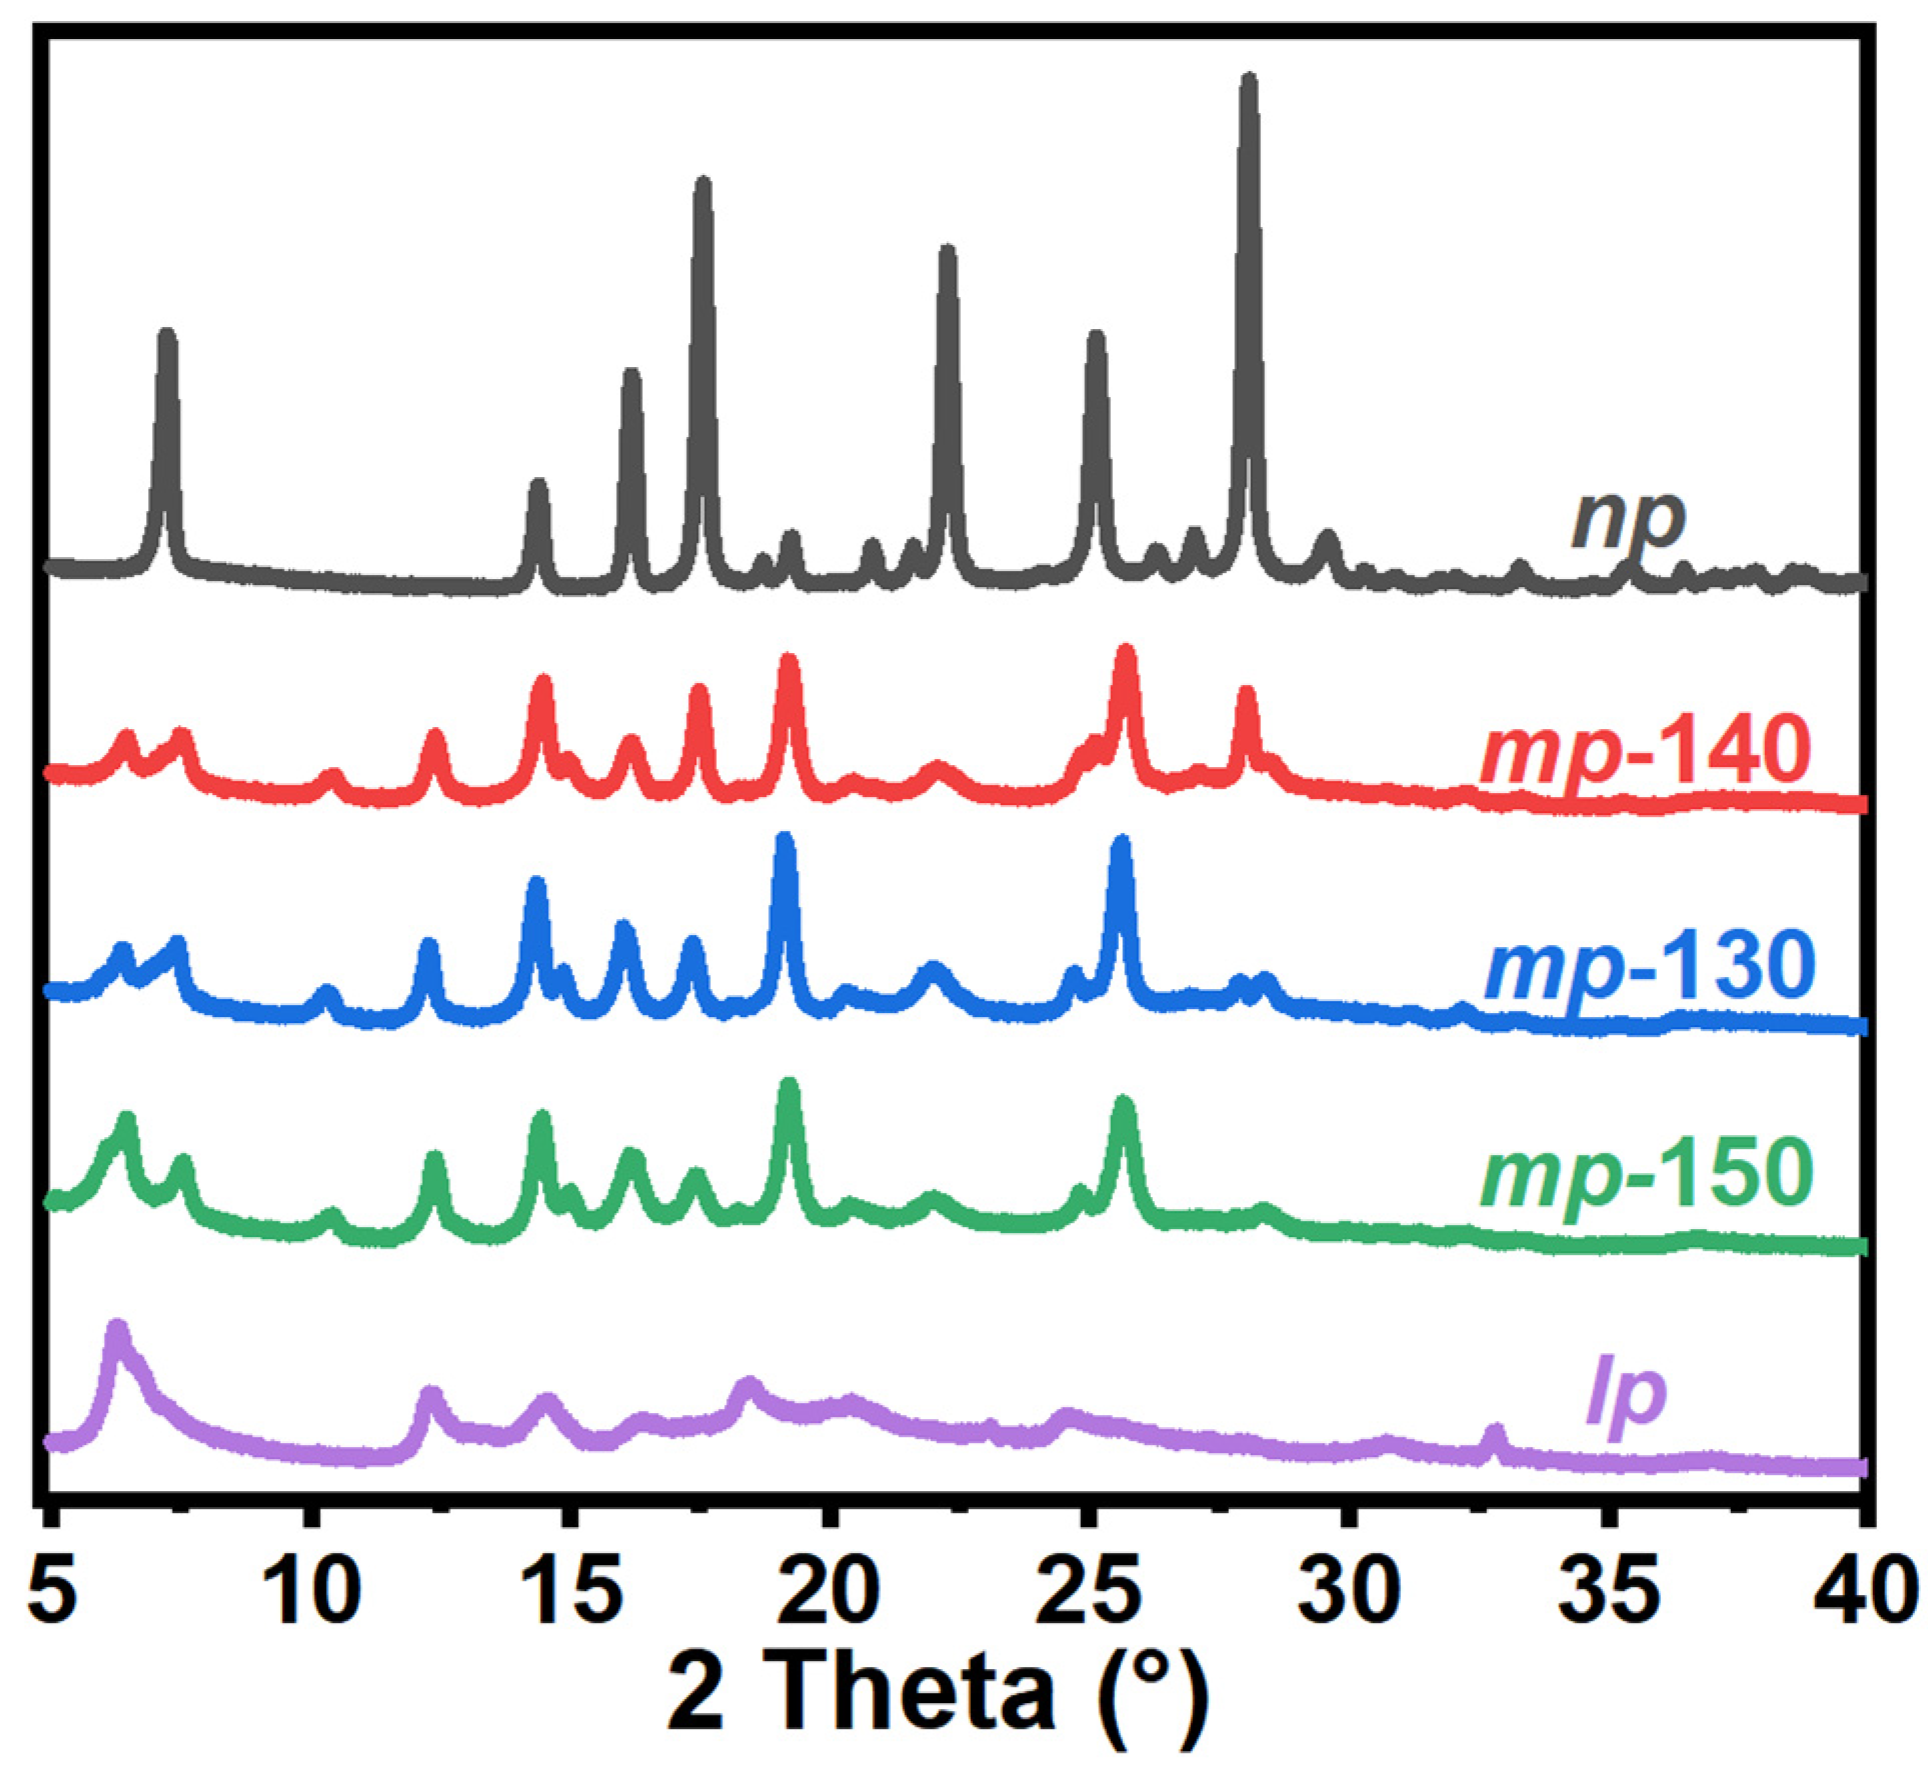
3.1. Structural and Morphological Characterization of Porous MOFs

Al-based MOFs with the different pore sizes were prepared through the hydrothermal method, involving large-pore (lp), narrow-pore (np), and the medium-pore (mp) phases synthesized under different temperatures. The crystallinity and structural integrity of these MOFs were characterized by XRD. The characteristic peak of the typical (002) plane in the np phase could be observed at 7.2° (Figure 1, black line), and this peak could be utilized to evaluate the unit cell dimensions for MOFs [7,34]. For the lp phase, the typical peak of the (002) plane shifted to 6.3° (Figure 1, purple line), suggesting varied cell sizes for the lp phase. Both the lp and np phases showed phase purity as observed from XRD patterns. The mp phases could be acquired by dispersing the lp phase in water, followed by thermal treatment at 150 °C, 140 °C, and 130 °C (labelled as mp-130, mp-140, and mp-150), respectively. It should be noted that two peaks appeared before 10° in the XRD patterns of these mp phases, located at ~6.4/7.4°, ~6.4/7.5°, and ~6.4/7.5° for mp-130, mp-140, and mp-150 (Table S1), respectively. These peaks suggested the gradual transformation between the np and lp phases, and that different phases coexisted in the mp samples. The morphological features of these MOF catalysts were observed by SEM images (Figure S1). The MOFs in the lp phase showed a conical shape with a smooth surface. Cracks appeared for the mp phases under the heating treatment, and the increased treating temperatures resulted in a severe crack from the mp-130 to the mp-150. The np phase showed a cracked morphology. Furthermore, TGA measurements were performed for these MOFs (Figure S2). It could be observed that all the MOFs with different phases did not show significant weight loss until the loss of the organic ligands at the temperatures of 373–386 °C (Table S2). The lp phase exhibited slight weight loss below 160 °C, attributing to the loss of water in the pore channels. These results were in accordance with the previous reports [7], suggesting the good thermal stability and potential applications of the MOFs in the CTL measurements.

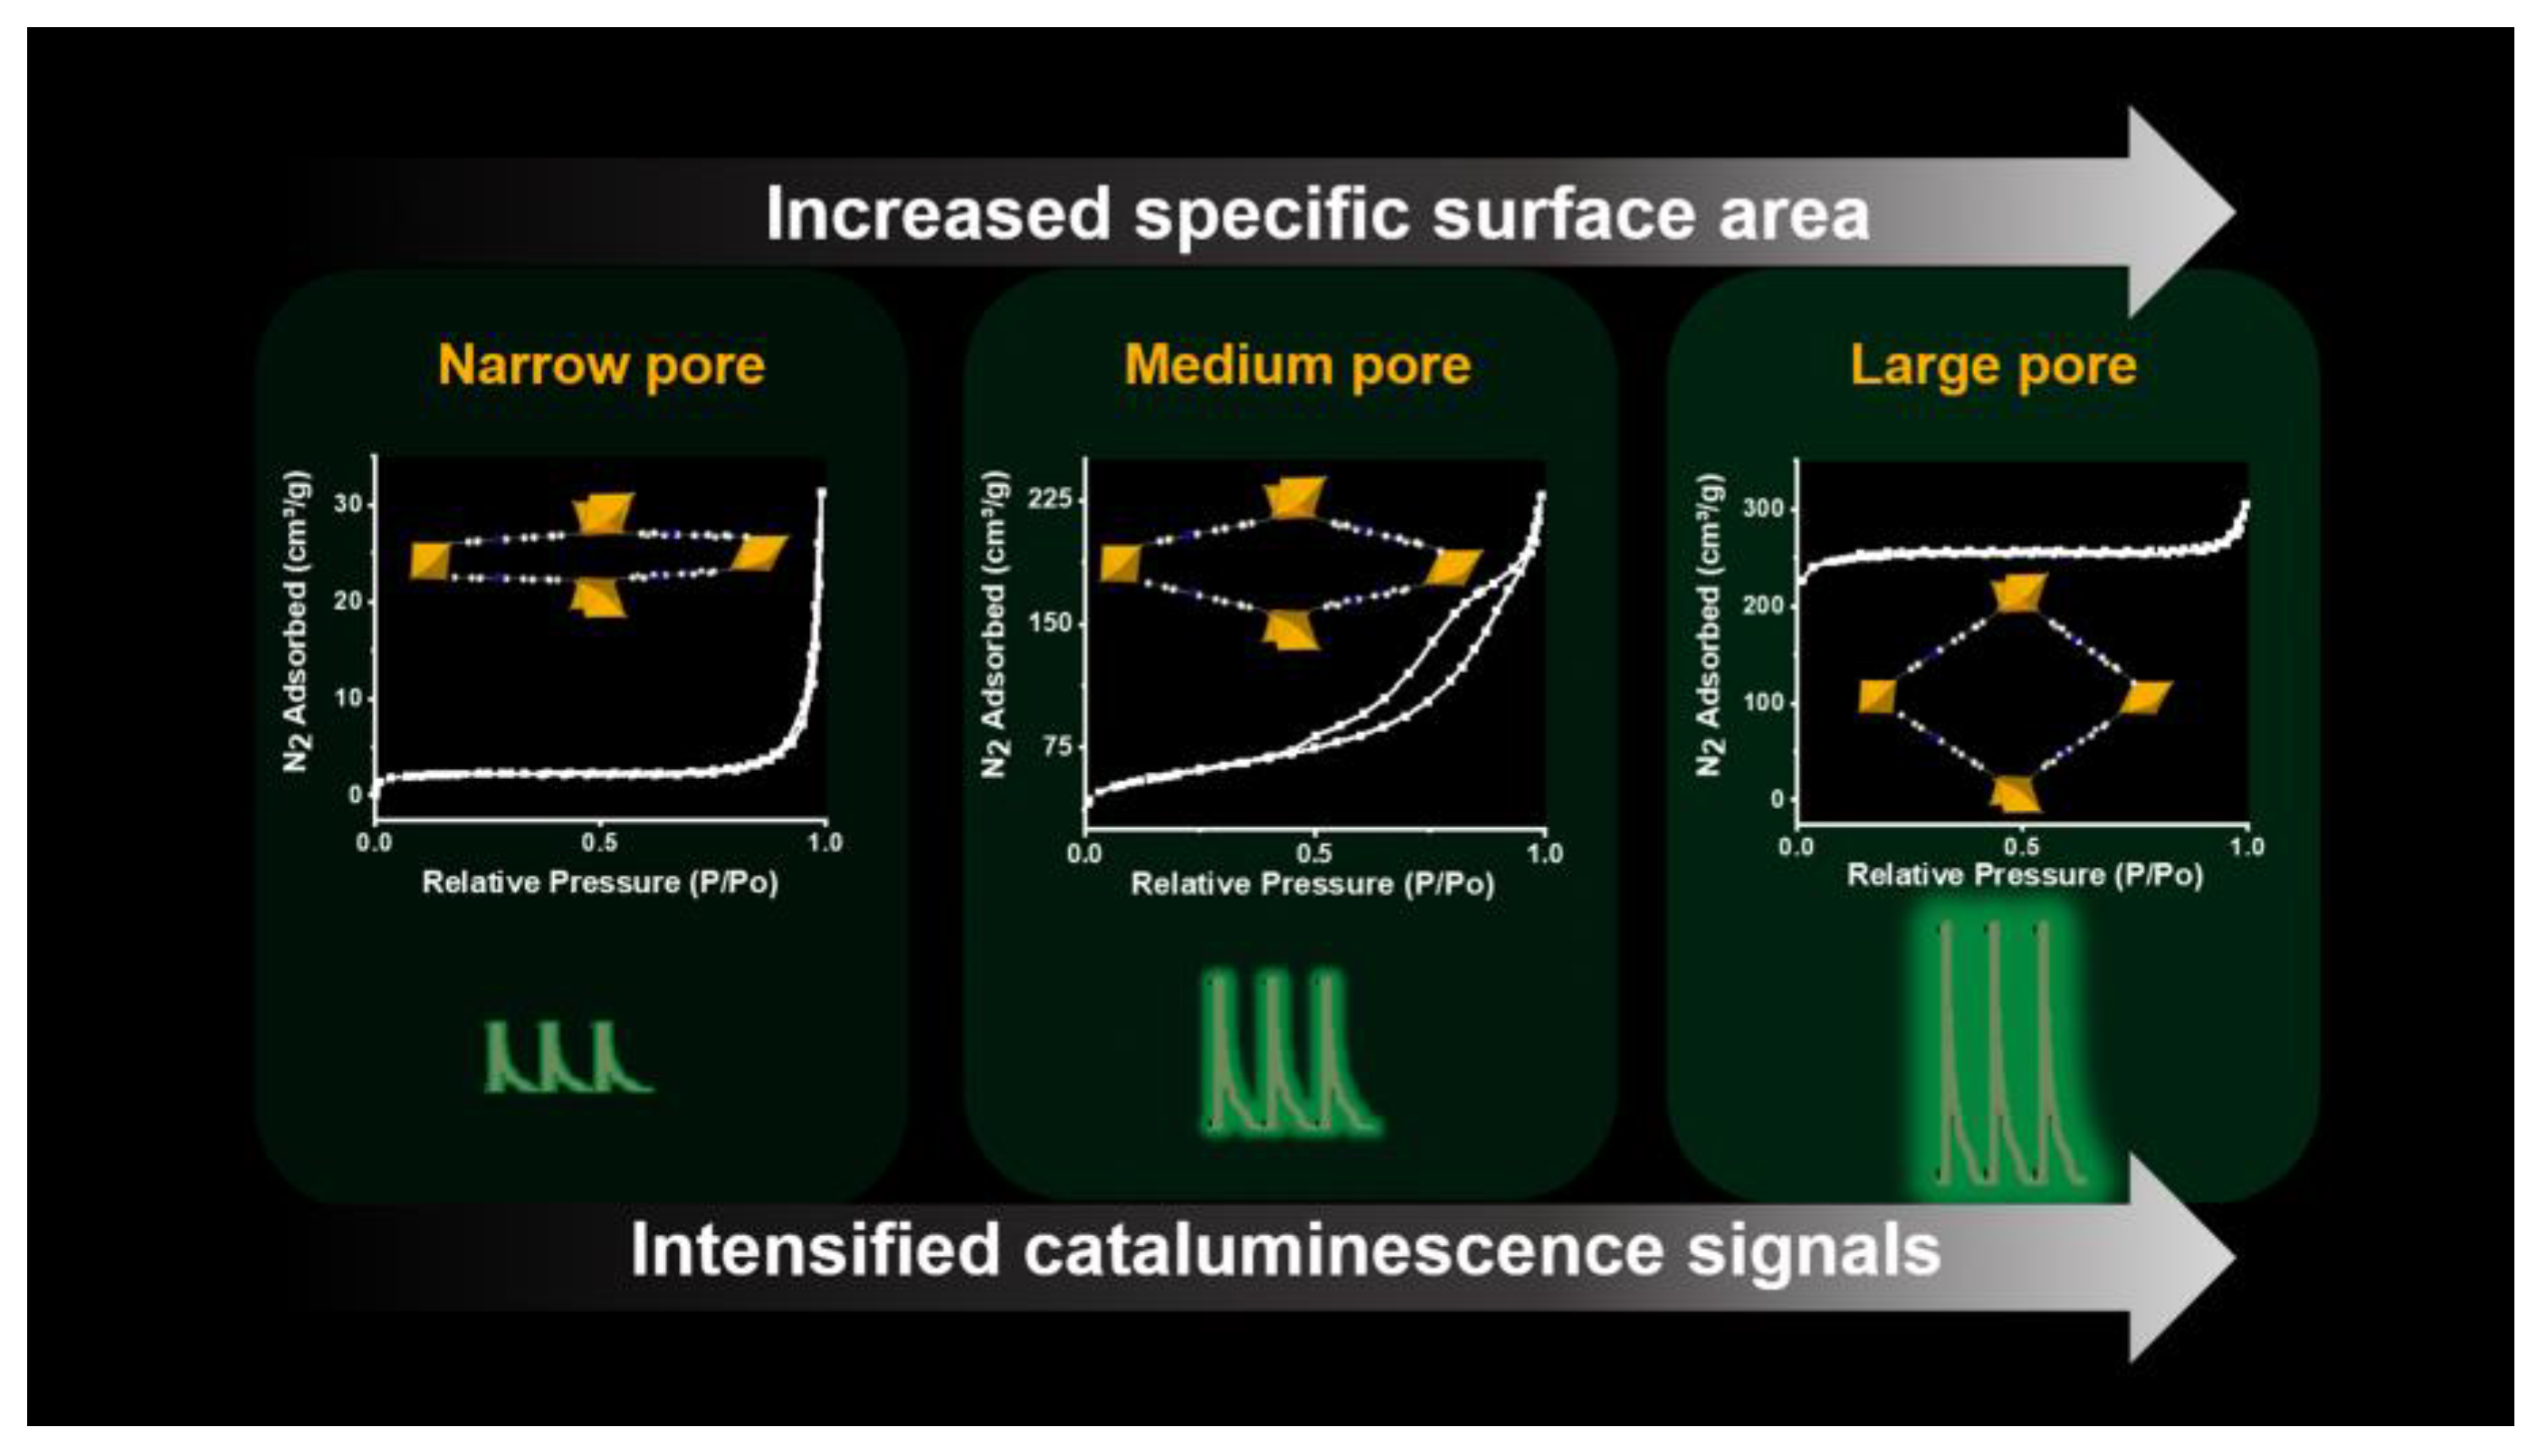
3.2. Cataluminescence of Ethanol Catalyzed by MOFs

The synthesized MOFs were coated on the ceramic heating rod, and ethanol (50 μL) was injected into the flow path system to be catalyzed to emit luminescence. The cataluminescence (CTL) signals for the MOFs with the different phases were monitored continuously. Firstly, we have optimized the reaction temperatures and rates of carrier gas flow for the CTL system, taking lp phase as an example. It could be observed that the CTL intensities increased with the heating voltages, and the highest signal-to-noise (S/N) ratio can be acquired at 115 V (Figure S3a). Similarly, the flow rate was chosen at 240 mL·min−1 with the strongest CTL intensity and stable S/N values (Figure S3b). MOFs with the different phases were used for the CTL measurements. Good repeatability and reproducibility could be acquired from the parallel CTL experiments (Figure 2). These signals are stable and repeatable. Taking the np phase as an example, the average value and the standard deviation of the measurements were 23,715 and 259.72, respectively. It should be noted that the CTL signals of ethanol changed significantly upon the catalytic reaction by the MOFs with the different phases. Specifically, the CTL signal of ethanol catalyzed by the lp phase reached ~67,560, while the intensity for the np phase was only ~23,715. The MOFs in the mp forms showed the dependent CTL intensities on the varied treatment temperatures. Accordingly, the CTL intensity variations of these MOFs followed the sequence as follows: lp > mp-150 > mp-130 > mp-140 > np. These differences in the CTL measurements could be ascribed to the distinct adsorption–desorption and oxidative reaction behaviors of ethanol on the MOFs with differed structural features. Moreover, IR measurements for MOFs before and after CTL measurements were implemented (Figure S4). It could be observed that the absorption peaks at 1690 and 1310 cm−1 were attributed to the vibration of carboxylic acid C=O and C−O bonds. The aromatic C=C bond appeared at 1430 cm−1, and the absorption peaks at 1400, 1480, and 1590 cm−1 can be attributed to stretching of −CO2. After the CTL experiments, no obvious changes could be observed from the IR spectra, illustrating the stability and reusability of these MOFs as catalysts.
In order to explore the CTL mechanism of ethanol in the presence of MOFs, we have recorded the CTL spectra of the reaction system under a series of wavelength filters. It is evident that the maximum CTL intensities could be observed around 550 nm and 620 nm for ethanol on the surfaces of lp, mp, and np phases (Figure 3a,b and Figure S5). These emissions could be ascribed to the characteristic emission peak of CH3CHO*, according to literature reports [30,35]. We have further studied the intermediates produced during the oxidative reaction of ethanol by in-situ FT-IR spectroscopy. Taking the np phase as an example, the absorbance bands ascribed to the −OH (at ~3300 cm−1) and the corresponding C−H tensile vibration (at ~3000 cm−1) decayed gradually with the increased reaction temperatures from 30 °C to 150 °C (Figure 3c). This decrease indicated the gradual consumption of ethanol during the reaction. The peaks around 1735 cm−1 corresponded to the C=O peak in the transition state of CH3CHO. These peaks showed a trend increase and subsequent decrease during the reaction, suggesting that the CH3CHO acted as an intermediate. These phenomena could also be validated by the GC–MS spectra with the peaks at 1.62/1.52 min for CH3CHO (Figure S6). Moreover, the absorption bands at 1586 and 1513 cm−1 indicated the formation of CH3COOH (Figure 3d), as an oxidized product of CH3CHO. Finally, these intermediates were reacted to form gaseous CO2, manifested as the increased peak at 2356 cm−1 (Figure 3c,d). These results demonstrated an oxidative reaction mechanism of ethanol catalyzed by MOFs (Scheme S1). Briefly, the adsorbed ethanol was firstly catalyzed to generate the intermediate CH3CHO*. The intermediate CH3CHO* was transformed to CH3CHO, followed by the conversion to the CH3COOH, and finally CO2. Therefore, the reaction of ethanol in the presence of different MOFs could be revealed by the CTL signals.

3.3. Cataluminesence of Ethanol Catalyzed by MOFs

We have performed the BET measurements on the MOFs with the different phases. The np and lp phases showed the characteristics of type I adsorption isotherms of microporous substances (Figure 4a), and the pore structures were relatively regular. The N2 adsorption curves of mp-150, mp-140, and mp-130 phases according to the type IV adsorption isotherms of microporous substances, manifested as the irregular pore structures [21,24]. The N2 adsorption curve of the mp phase belonged to the H4 type hysteresis loop, and the adsorption branch was composed of the I-type microporous and II-type mesoporous isotherms [36,37]. This phenomenon could be ascribed to the fact that the framework transition of MOFs was a gradual process instead of an abrupt change, and multiple phases coexisted in the mp phases.
The adsorption behaviors of these MOFs were further analyzed by the calculations of pore size and specific surface area. The pore sizes of MOFs with the different phases have been estimated (Figure S7). It could be observed that the lp phase showed the largest pore sizes of 20.59 Å, corresponding to the highest CTL intensity of ethanol. The mp-150 showed a prominent pore size of 19.16 Å, corresponding to a relatively strong CTL intensity of ethanol. Moreover, although the mp-130, mp-140, and np phases shared similar pore sizes, the CTL signal varied. These results suggested that the pore sizes of MOFs were not the determinant factor for the CTL signals of ethanol. The specific surface areas of MOFs have been further investigated. The values of specific surface area for these MOFs increased from 2.66 m2/g for the np phase to 1024.88 m2/g for the lp phase, in accordance with previous reports [7,38]. The values of the specific surface area of these MOFs accorded to a tendency of np < mp-140 < mp-130 < mp-140 < lp (Table S3). It is noteworthy that the specific surface areas of the MOFs were positively correlated with the CTL intensities of ethanol (Figure 4b). The larger the specific surface area of the MOFs, the higher the CTL signal intensities that could be acquired for the oxidation of ethanol. For a better illustration, a quantitative relationship between the surface area and the activity of MOFs was generally needed [39]. The CTL intensity (I) is positively correlated with the specific surface area from BET measurements (SA): I = −4.94 × 10⁴ exp (4.39 × 10⁻³ SA) + 6.88 × 10⁴ (Figure 4c). Such a correlation could be ascribed to the distinct adsorption–desorption behaviors of the MOFs towards ethanol. The different specific surface areas of the MOFs determined the quantities of adsorbed ethanol and thus the varied CTL intensity signals. These results demonstrated the ability of CTL measurement as an indicator to evaluate and discriminate the specific surface area of the MOFs in a cost-effective approach.
The versatility of the proposed strategy on screening the specific surface area of MOFs has been further validated by the other gas molecules, such as methanol and isopropanol. It can be observed that the CTL signals of methanol and isopropanol increased from the np, mp-150, to lp phases, in accordance with the signals of ethanol discussed above (Figure S8). These results demonstrated the accuracy of the proposed CTL method to evaluate the specific surface area of MOFs. Interestingly, the CTL intensity varied with the molecular structures of alcohols in the presence of a same MOF material (Figure S9). Methanol, with the smallest molecular size, showed the highest CTL intensity on these MOFs. With the increase in molecular size from methanol to isopropanol, the CTL intensities decayed accordingly. Therefore, it could be concluded that the highest CTL signal could be acquired for the smallest methanol molecules in the presence of MOFs with the largest pore structures. These results suggested the varied accommodation effect of guest molecules in the host MOFs, leading to the distinguished adsorption–desorption behaviors in the MOFs with different phases. It is anticipated that the proposed strategy could also be utilized to screen the molecules with the different sizes by MOFs.

4. Conclusions

In summary, we have proposed the CTL strategy to screen and evaluate the surface area of MOFs in an efficient and accurate approach. The CTL intensities from the reaction of ethanol varied consistently with the surface area and the adsorption capacity for the MOFs with different phases. The larger the specific surface area for MOFs, the higher the CTL intensities of ethanol that could be acquired after a catalytic oxidation. This work has successfully established an efficient platform to evaluate the structures of MOFs through the luminescence signals from a catalytic chemical reaction. It is anticipated that our approach could be utilized for the rapid screening on the structural and adsorption characteristics for the porous materials.

Supplementary Materials

The following supporting information can be downloaded at: https://www.mdpi.com/article/10.3390/chemosensors11050292/s1. Figure S1: SEM images of (a) np, (b) mp-140, (c) mp-130, (d) mp-150, and (e) lp phases of MOFs. Figure S2: TGA analysis for different MOF materials. Figure S3: Comparisons of the cataluminescence (CTL) intensities and the signal-to-noise (S/N) values of ethanol in the presence of the lp phase at (a) different temperatures (air flow rate of 240 mL·min−1 and integration time of 1 s) and (b) different flow rates (working voltage of 115 V and integration time of 1 s). Figure S4: FT-IR spectra for different MOF materials before and after CTL measurements. Figure S5: CTL spectrum for the oxidation of ethanol in the presence of the mp-150 phase. Figure S6: Gas chromatography–mass spectrometry (GC–MS) measurements for the reaction of ethanol by the (a) np, (b) mp-150, and (c) lp phases. Figure S7: Pore size distribution analysis for lp, mp-150, mp-130, mp-140, and np phases. Figure S8: CTL intensities for (a) methanol, (b) ethanol, and (c) isopropanol in the presence of MOFs with the different phases (the integration time of 0.1 s). Figure S9: CTL intensity variations for methanol, ethanol, and isopropanol in the presence of MOFs with the different phases (the integration time of 0.1 s). Scheme S1: Reaction mechanism and corresponding measurements for the CTL emissions from oxidation of ethanol in the presence of MOFs. Table S1: Peak position analysis for the MOFs with different phases from XRD patterns. Table S2: Weight loss analysis for different MOF materials from TGA measurements. Table S3: CTL intensities and specific surface areas acquired by the Brunauer–Emmett–Teller (BET) measurements for different MOF materials.

Author Contributions

Conceptualization, Z.L., R.T. and C.L.; validation, Z.L. and D.P.; investigation, D.P., R.T. and C.L.; writing—original draft preparation, Z.L., D.P., R.T. and C.L.; writing—review and editing, R.T. and C.L.; supervision, C.L.; funding acquisition, R.T. and C.L. All authors have read and agreed to the published version of the manuscript.

Funding

This work was supported by the National Natural Science Foundation of China (21974008, 21838007 and U22A20397) and Beijing Natural Science Foundation (2222018).

Institutional Review Board Statement

Not applicable.

Informed Consent Statement

Not applicable.

Data Availability Statement

Not applicable.

Conflicts of Interest

The authors declare no competing financial interest.

References

  1. Kurisingal, J.F.; Li, Y.; Sagynbayeva, Y.; Chitumalla, R.K.; Park, D.-W. Porous aluminum-based DUT metal-organic frameworks for the transformation of CO2 into cyclic carbonates: A computationally supported study. Catal. Today 2019, 352, 227–236. [Google Scholar] [CrossRef]
  2. Kustov, L.M.; Isaeva, V.I.; Přech, J.; Bisht, K.K. Metal-organic frameworks as materials for applications in sensors. Mendeleev Commun. 2019, 29, 361–368. [Google Scholar] [CrossRef]
  3. An, B.; Li, Z.; Song, Y.; Zhang, J.; Lin, W. Cooperative copper centres in a metal-organic framework for selective conversion of CO2 to ethanol. Nat. Catal. 2019, 2, 709–717. [Google Scholar] [CrossRef]
  4. Nath, K.; Ahmed, A.; Siegel, D.J.; Matzger, A.J. Microscale determination of binary gas adsorption isotherms in MOFs. J. Am. Chem. Soc. 2022, 144, 20939–20946. [Google Scholar] [CrossRef]
  5. Rowsell, J.L.C.; Yaghi, O.M. Strategies for hydrogen storage in metal-organic frameworks. Angew. Chem. Int. Ed. 2004, 44, 4670–4679. [Google Scholar] [CrossRef] [PubMed]
  6. Eddaoudi, M.; Yaghi, O.M. Systematic design of pore size and functionality in isoreticular MOFs and their application in methane storage. Science 2002, 295, 469–472. [Google Scholar] [CrossRef] [PubMed]
  7. Liang, J.; Li, X.; Xi, R.; Shan, G.; Li, P.-Z.; Liu, J.; Zhao, Y.; Zou, R. A Robust aluminum metal-organic framework with temperature-induced breathing effect. ACS Mater. Lett. 2020, 2, 220–226. [Google Scholar] [CrossRef]
  8. Senkovska, I.; Hoffmann, F.; FröBa, M.; Getzschmann, J.; BöHlmann, W.; Kaskel, S. New highly porous aluminium based metal-organic frameworks: Al(OH)(ndc) (ndc=2,6-naphthalene dicarboxylate) and Al(OH)(bpdc) (bpdc=4,4′-biphenyl dicarboxylate). Microporous Mesoporous Mater. 2009, 122, 93–98. [Google Scholar] [CrossRef]
  9. Wang, H.; Warren, M.; Jagiello, J.; Jensen, S.; Ghose, S.K.; Tan, K.; Yu, L.; Emge, T.J.; Thonhauser, T.; Li, J. Crystallizing atomic xenon in a flexible MOF to probe and understand its temperature-dependent breathing behavior and unusual gas adsorption phenomenon. J. Am. Chem. Soc. 2020, 142, 20088–20097. [Google Scholar] [CrossRef]
  10. Huang, X.; Huang, Z.; Zhang, L.; Liu, R.; Lv, Y. Highly efficient cataluminescence gas sensor for acetone vapor based on UIO-66 metal-organic frameworks as preconcentrator. Sens. Actuators B Chem. 2020, 312, 127952. [Google Scholar] [CrossRef]
  11. Jiao, L.; Seow, J.Y.R.; Skinner, W.S.; Wang, Z.U.; Jiang, H.-L. Metal-organic frameworks: Structures and functional applications. Mater. Today 2019, 27, 43–68. [Google Scholar] [CrossRef]
  12. Kreno, L.E.; Leong, K.; Farha, O.K.; Allendorf, M.; Duyne, R.P.V.; Hupp, J.T. Metal-organic framework materials as chemical sensors. Chem. Rev. 2012, 112, 1105–1125. [Google Scholar] [CrossRef] [PubMed]
  13. Zhang, X.; Xiong, B.; Li, J.; Qian, L.; Liu, L.; Liu, Z.; Fang, P.; He, C. Dependence of dye molecules adsorption behaviors on pore characteristics of mesostructured MOFs fabricated by surfactant template. ACS Appl. Mater. Interfaces 2019, 11, 31441–31451. [Google Scholar] [CrossRef]
  14. Srivastava, S.; Shet, S.P.; Priya, S.S.; Sudhakar, K.; Tahir, M. Molecular simulation of copper based metal-organic framework (Cu-MOF) for hydrogen adsorption. Int. J. Hydrogen Energy 2022, 47, 15820–15831. [Google Scholar] [CrossRef]
  15. Tokalıoğlu, Ş.; Yavuz, E.; Demir, S.; Patat, Ş. Zirconium-based highly porous metal-organic framework (MOF-545) as an efficient adsorbent for vortex assisted-solid phase extraction of lead from cereal, beverage and water samples. Food Chem. 2017, 237, 707–715. [Google Scholar] [CrossRef] [PubMed]
  16. He, H.; Li, R.; Yang, Z.; Chai, L.; Jin, L.; Alhassan, S.I.; Ren, L.; Wang, H.; Huang, L. Preparation of MOFs and MOFs derived materials and their catalytic application in air pollution: A review. Catal. Today 2021, 375, 10–29. [Google Scholar] [CrossRef]
  17. Deng, X.; Qin, Y.; Hao, M.; Li, Z. MOF-253-supported Ru complex for photocatalytic CO2 reduction by coupling with semidehydrogenation of 1,2,3,4-Tetrahydroisoquinoline (THIQ). Inorg. Chem. 2019, 58, 16574–16580. [Google Scholar] [CrossRef] [PubMed]
  18. Gómez-Gualdrón, D.A.; Moghadam, P.Z.; Hupp, J.T.; Farha, O.K.; Snurr, R.Q. Application of consistency criteria to calculate BET areas of micro- and mesoporous metal-organic frameworks. J. Am. Chem. Soc. 2016, 138, 215–224. [Google Scholar] [CrossRef] [PubMed]
  19. Datar, A.; Chung, Y.G.; Lin, L.-C. Beyond the BET analysis: The surface area prediction of nanoporous materials using a machine learning method. J. Phys. Chem. Lett. 2020, 11, 5412–5417. [Google Scholar] [CrossRef]
  20. Thommes, M. Physisorption of gases, with special reference to the evaluation of surface area and pore size distribution (IUPAC Technical Report). Pure Appl. Chem. 2015, 87, 1051–1069. [Google Scholar] [CrossRef]
  21. Islamoglu, T.; Idrees, K.B.; Son, F.A.; Chen, Z.; Lee, S.-J.; Li, P.; Farha, O.K. Are you using the right probe molecules for assessing the textural properties of metal-organic frameworks? J. Mater. Chem. A 2022, 10, 157–173. [Google Scholar] [CrossRef]
  22. Brunauer, S.; Emmett, P.H. The use of van der waals adsorption isotherms in determining the surface arer of iron synthetic ammonia catalysts. J. Am. Chem. Soc. 1935, 57, 1754–1755. [Google Scholar] [CrossRef]
  23. Walton, K.S.; Snurr, R.Q. Applicability of the BET method for determining surface areas of microporous metal-organic frameworks. J. Am. Chem. Soc. 2007, 129, 8552–8556. [Google Scholar] [CrossRef]
  24. Ambroz, F.; Macdonald, T.J.; Martis, V.; Parkin, I.P. Evaluation of the BET theory for the characterization of meso and microporous MOFs. Small Methods 2018, 2, 1800173. [Google Scholar] [CrossRef]
  25. Bau, S.; Witschger, O.; Gensdarmes, F.; Rastoix, O.; Thomas, D. A TEM-based method as an alternative to the BET method for measuring off-line the specific surface area of nanoaerosols. Powder Technol. 2010, 200, 190–201. [Google Scholar] [CrossRef]
  26. Kockler, K.B.; Frisch, H.; Barner-Kowollik, C. Making and breaking chemical bonds by chemiluminescence. Macromol. Rapid Commun. 2018, 39, 1800516. [Google Scholar] [CrossRef] [PubMed]
  27. Kwon, M.S.; Jang, G.; Bilby, D.; Lee, T.S.; Kim, J. Design principles of chemiluminescence (CL) chemodosimeter for self-signaling detection: Luminol protective approach. RSC Adv. 2014, 4, 46488–46493. [Google Scholar] [CrossRef]
  28. Meng, F.; Lu, Z.; Zhang, R.; Li, G. Cataluminescence sensor for highly sensitive and selective detection of iso-butanol. Talanta 2019, 194, 910–918. [Google Scholar] [CrossRef] [PubMed]
  29. Wang, S.; Yuan, Z.; Zhang, L.; Lin, Y.; Lu, C. Recent advances in cataluminescence-based optical sensing systems. Analyst 2017, 142, 1415–1428. [Google Scholar] [CrossRef] [PubMed]
  30. Cheng, W.; Guan, W.; Lin, Y.; Lu, C. Rapid discrimination of adsorbed oxygen and lattice oxygen in catalysts by the cataluminescence method. Anal. Chem. 2022, 94, 1382–1389. [Google Scholar] [CrossRef]
  31. Zhang, L.; Song, H.; Su, Y.; Lv, Y. Advances in nanomaterial-assisted cataluminescence and its sensing applications. Trends Anal. Chem. 2015, 67, 107–127. [Google Scholar] [CrossRef]
  32. Zeng, N.; Long, Y.; Wang, J.; Sun, J.; Ouyang, N.; Na, N. An Acetone Sensor Based on Plasma-Assisted Cataluminescence and Mechanism Studies by Online Ionizations. Anal. Chem. 2019, 91, 15763–15768. [Google Scholar] [CrossRef] [PubMed]
  33. Bloch, E.D.; Britt, D.; Lee, C.; Doonan, C.J.; Uribe-Romo, F.J.; Furukawa, H.; Long, J.R.; Yaghi, O.M. Metal insertion in a microporous metal-organic framework lined with 2,2′-bipyridine. J. Am. Chem. Soc. 2010, 132, 14382–14384. [Google Scholar] [CrossRef] [PubMed]
  34. Yuan, S.; Huang, L.; Huang, Z.; Sun, D.; Qin, J.-S.; Feng, L.; Li, J.; Zou, X.; Cagin, T.; Zhou, H.-C. Continuous variation of lattice dimensions and pore sizes in metal-organic frameworks. J. Am. Chem. Soc. 2020, 142, 4732–4738. [Google Scholar] [CrossRef] [PubMed]
  35. Ye, Q.; Gao, Q.; Zhang, X.-R.; Xu, B.-Q. Cataluminescence and catalytic reactions of ethanol oxidation over nanosized Ce1−xZrxO2 (0≤x≤1) catalysts. Catal. Commun. 2006, 7, 589–592. [Google Scholar] [CrossRef]
  36. de Souza, M.J.B.; Silva, T.H.A.; Ribeiro, T.R.S.; da Silva, A.O.S.; Pedrosa, A.M.G. Thermal and catalytic pyrolysis of polyvinyl chloride using micro/mesoporous ZSM-35/MCM-41 catalysts. J. Therm. Anal. Calorim. 2020, 140, 167–175. [Google Scholar] [CrossRef]
  37. Tanhaei, M.; Mahjoub, A.R.; Safarifard, V. Energy-efficient sonochemical approach for the preparation of nanohybrid composites from graphene oxide and metal-organic framework. Inorg. Chem. Commun. 2019, 102, 185–191. [Google Scholar] [CrossRef]
  38. Yan, B.; Qin, S.-J. A facile indicator box based on Eu3+ functionalized MOF hybrid for the determination of 1-naphthol, a biomarker for carbaryl in urine. Sens. Actuators B Chem. 2018, 259, 125–132. [Google Scholar]
  39. Visa, A.; Mracec, M.; Maranescu, B.; Maranescu, V.; Ilia, G.; Popa, A.; Mracec, M. Structure simulation into a lamellar supramolecular network and calculation of the metal ions/ligands ratio. Chem. Cent. J. 2012, 6, 91. [Google Scholar] [CrossRef]
Scheme 1. Schematic representation of cataluminescence to evaluate the specific surface area for the MOFs.
Chemosensors 11 00292 sch001
Figure 1. XRD patterns of MOF materials with np, mp-140, mp-130, mp-150, and lp phases.
Chemosensors 11 00292 g001
Figure 2. Comparison of CTL intensities by ethanol catalyzed by the MOFs with the different phases (air flow rate of 240 mL·min−1, working voltage of 115 V, and integration time of 1 s).
Chemosensors 11 00292 g002
Figure 3. CTL intensities of ethanol in the presence of (a) lp and (b) np phases. In−situ FT−IR spectra in the range of (c) 4000−850 cm−1 and (d) 2500−1400 cm−1 for ethanol under increased reaction temperatures during the oxidative reaction of ethanol in the presence of MOFs with np phase.
Chemosensors 11 00292 g003
Figure 4. (a) N2 adsorption and desorption curves, (b) variations of CTL intensities and specific surface area of different MOFs, and (c) correlation between the CTL intensities and specific surface area of different MOFs.
Chemosensors 11 00292 g004
Disclaimer/Publisher’s Note: The statements, opinions and data contained in all publications are solely those of the individual author(s) and contributor(s) and not of MDPI and/or the editor(s). MDPI and/or the editor(s) disclaim responsibility for any injury to people or property resulting from any ideas, methods, instructions or products referred to in the content.

