Abstract
In this work, 2-butanone-sensitive Ag-decorated In2O3 nanocomposites were successfully prepared using a facile one-step hydrothermal method to enhance the sensing performance of In2O3 nanocubes. The methods of scanning electron microscopy (SEM), transmission electron microscopy (TEM), high-resolution transmission electron microscopy (HRTEM), X-ray diffraction (XRD), energy dispersive spectroscopy (EDS) analysis, and X-ray photoelectron spectroscopy (XPS) were used to observe the morphology, microstructure, crystalline phase, and the existing state of the elements in the produced nanomaterials, respectively. The gas sensing test results show that the prepared compounds could respond to 100 ppm of 2-butanone with a high response (242), fourfold that of the pure In2O3 material, at the optimum working temperature of 240 °C. Moreover, the Ag@In2O3-based sensor also showed excellent selectivity, good repeatability, and even long-term stability. In addition, noble metal surface modification not only decreased the optimum operating temperature (from 270 °C to 240 °C) but also decreased the lowest detection limit (from 5 ppm to 0.25 ppm). In the final section, the gas sensing mechanism of the Ag@In2O3-based sensor and the probable reason for 2-butanone’s enhanced sensing properties are both discussed.
1. Introduction
2-Butanone, a colorless, transparent, acetone-smelling liquid, has always been used in industrial production as an organic solvent and pharmaceutical production as an intermediate of pharmaceutical products [1]. In addition, as a volatile organic compound (VOC), the inflammable and gasified nature of 2-butanone has also been the focus of attention [2]. In addition, it also has a few toxic features; for example, eyes, nose, throat, and mucous membranes can be irritated as a result of the short-term inhalation of or exposure to a 2-butanone environment [3]. The central system can be inhibited, leading to coma and death as a result of long-term exposure [4]. Furthermore, it can also be used as a medical diagnostic test to detect Helicobacter pylori infection and, thereby, confirm stomach cancer [5]. For the reasons above, the research and development of a device to achieve rapid, precise, long-term in situ monitoring of 2-butanone are of great importance to production safety and human health.
There are so many ways to conduct 2-butanone detection—be it via an optical sensor, a quartz microbalance (QMB) sensor array [6], photochemistry [7], chromatography [8], electrochemistry [9], gas chromatography with a mass spectrometer (CG-MS) [10], or cataluminescence sensors [11]. Though some of the above-mentioned methods can accurately monitor low-concentration target gases, the expense of detection, the inability to perform suit detection, and the complicated detection operation can be a problem.
On the contrary, metal oxide semiconductors (MOS) used as chemo-resistive gas sensors have positive features, such as rapid detection speed, cheap detection cost, and simple operation. However, poor selectivity, high working temperature, and unreachable low detection limit are all problems that researchers need to solve. To deal with the mentioned issues, morphology adjustments, noble metal doping and decoration, heterogeneous structure construction, and the addition of graphene and organic materials are all used to improve the gas properties of MOS. Zito et al. [12] fabricated a nanoparticle-constructed bicone-like ZnO structure using a template-free microwave-assisted method. The material has good sensitivity (29.4) to 100 ppm of butanone with a low detection limit of 0.41 ppm at 400 °C. Oliveira et al. [13] constructed pt-decorated twin-rod ZnO materials that improved 2-butanone response by a factor of nearly three and had a fast response speed at a slight elevation in operating temperature. Zhang et al. [14] synthesized a Cr2O3/WO3 p-n junction using a facile two-step hydrothermal method to enhance the response and decrease the operating temperature of the WO3 nanosheet. However, these materials have a low gas response, a high detection limit, and poor chemical stability.
In2O3, a representative n-type MOS, has been commonly applied in detecting and monitoring different kinds of VOCs because of its wide band gap (3.55 eV–3.75 eV), chemical stability, high response value, and fast response speed [15,16]. An et al. [17] prepared an In2O3-based Zn-In binary compound to detect 50 ppm of n-butanol, achieving a high response (99.5) at a low temperature (180 °C). Gao et al. [18] developed a corundum-based In2O3 nanosheet for NO2 sensing with a response of 167 to 50 ppm of NO2 at 50 °C and an ultra-fast response time of 5 s. However, there are few reports concerning In2O3-based materials detecting 2-butanone.
As a type of noble metal catalyst, Ag has always been used to improve the gas properties of MOS [19,20]. There are also some examples of it improving the gas performance of In2O3 materials and 2-butanone sensing. Liu et al. [21] decorated In2O3 nanotubes with silver nanoparticles, which not only greatly improved the sensitivity of NO2 sensing but also reduced the response and response times by several factors.
Herein, a high selectivity and low detection limit 2-butanone sensing material based on the Ag nanoparticle-decorated n-type semiconductor material In2O3 was fabricated using a one-step hydrothermal method. Subsequently, gas sensing tests were carried out on the prepared materials to obtain the optimum doping ratio. It was found that the Ag@In2O3 decorated with an atomic ratio of 2% maximally increased the response and decreased the operating temperature of In2O3 nanocubes due to its synergistic effect of electronic sensitization and chemical sensitization. XRD, EDS, TEM, SEM, and XPS were applied to characterize the Ag@In2O3 and to investigate the possible gas sensitive mechanism.
2. Experimental
2.1. Materials
All the reagents and solvents, including indium (|||) nitrate tetrahydrate (In(NO3)3·4H2O ≥ 99.99%), silver nitrate (AgNO3 ≥ 99.99%) polyethylene glycol 12000 (PEG 12000 ≥ 99%), urea (≥99%), and ethanol (≥99.5%), which were purchased from Sinopharm Chemical Reagent Co., Ltd., were of analytical grade and used as received without further purification. Ultrapure water was used during the whole experiment.
2.2. Synthesis of Pure In2O3 Materials
The In2O3 nanocubes were prepared via a simple hydrothermal route and the subsequent annealing strategy. The detailed experimental process is shown in Figure 1. In a typical one-pot synthesis method, first of all, 1 mmol of In(NO3)3·4H2O and 6 mmol of urea were dissolved into 16 mL of deionized water in a beaker under violently magnetic stirring for 5 min. Subsequently, 0.25 g of PEG 12000 was quickly added into the above homogeneous solution and continuously stirred for 30 min. After mixing, the prepared transparent solution was transferred into one Teflon-lined stainless-steel autoclave with a volume of 25 mL and heated continuously in an oven at 200 °C for 12 h. After waiting for the oven to naturally cool down to room temperature, the white precursor was collected by centrifugation, washed five times with alternating ethanol and deionized water, and dried in air at 60 °C for 12 h. Finally, the indium oxide precursor was annealed in a tubular furnace at 500 °C for 2 h at a heating rate of 2 °C min−1 to obtain the pale yellow In2O3 powder.
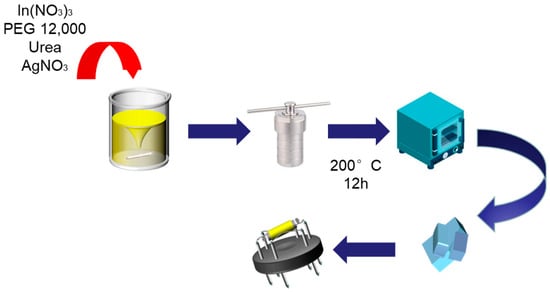
Figure 1.
The detailed experimental process of Ag-decorated In2O3 nanocubes.
2.3. Synthesis of Ag-Decorated In2O3 Materials
The Ag nanoparticle-modified In2O3 nanocomposites were prepared in a similar method. The above operating steps remained unchanged, only different concentrations of silver nitrate were added to the above-mentioned solution to produce the Ag nanoparticle-decorated In2O3 compounds. According to the additive silver-containing reagent amounts, the obtained materials were denoted as In2O3, In-Ag-1, In-Ag-2, and In-Ag-3.
2.4. Characterization
The morphology and microstructure of the prepared materials were observed via scanning electron microscopy (SEM), transmission electron microscopy (TEM), and high-resolution transmission electron microscope (HRTEM). X-ray photoelectron spectroscopy (XPS) was used to analyze the elemental composition on the surface. The element components of the Ag-In-2 were verified by energy dispersive spectroscopy (EDS). The crystal structure of the material was characterized by X-ray diffraction (XRD), with a scanning speed of 5°/min and a scanning 2θ angle range from 20° to 80° using Cu Kα radiation (λ = 0.15418 nm).
2.5. Fabricating and Testing of Gas Sensors
The schematic diagram of the test system is exhibited in Figure 2 [22,23]. The experimental platform was mainly composed of seven parts: a programmable DC power supply DP832A (manufactured by RIGOL Technologies, Beijing, China), a precision digital source unit B2902A (manufactured by KEYSIGHT Technologies,Santa Rosa, CA, USA), a computer, an enclosed gas cylinder (1 L), an air bottle, a thermocouple, and several types of sample gases. The sensors in this paper were all side-heat sensors composed of one ceramic tube, two parallel Au electrodes, a Ni-Cr alloy heater wire, four Pt wires, a rubber base, and coated nanometer materials. Both ends of the Ni-Cr resistance wire were connected to the DP832A to control the operating temperature of the sensor by controlling the power. Four Pt wires were connected to the B2902A to accurately test the changing resistance of the nanomaterials.
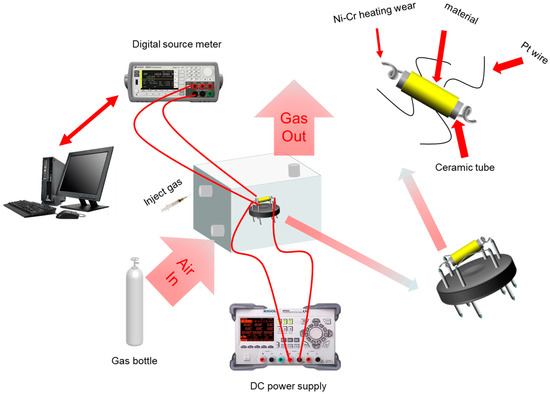
Figure 2.
Schematic diagram of the gas sensor and the test platform.
Before the test, the prepared materials were stirred with a small amount of anhydrous ethanol and then evenly coated on the surface of the ceramic tube to wrap the Au electrode. After coating the prepared materials onto the sensor, one day of thermal aging was required to ensure the sensor produced a stable test. The testing process was achieved in the gas chamber with an 8 V voltage provided by the DC power supply. The testing data were transmitted to the computer through the Labview software. During the test, the sensor was placed in the center of the bottom of the gas chamber. When the resistance value was stable and remained so for a period of time, the gas to be tested was passed in. The round of testing was completed when the sensor reached a new stable point, which was held for some time. Then, the synthetic air was passed in so that the resistance returned to the initial value. In order to eliminate interference and ensure the accuracy of the experiment, synthetic air was pumped into the chamber for a period of time before each test. In this work, the injection concentration of the tested gases was calculated as in Equation (1):
where C is the target gas concentration volume of the measured gas, Vi is the injection volume of the injection gas, Vc is the volume of the gas chamber, and P0 and Pa are the saturation vapor pressure of the injected gas at room temperature (25 °C) and the standard atmospheric pressure, respectively. The dry synthetic air used throughout the experiment consisted of 79% nitrogen and 21% oxygen. Testing the different concentrations of test gases was achieved by varying the syringe size and injection volume. The response value of the fabricated gas sensor to the target gases was calculated according to Equation (2):
where S is the sensitivity of the gas sensor, Ig is the current value of the gas sensor stabilized in a normal gas environment, and Ia is the current value of the gas sensor in the detected gas. In addition, the response time (τres) and the recovery time (τrec) can be defined as the time that the current value climbs and drops to 90% of the maximum variation, respectively.
3. Result and Discussion
3.1. Characterization of the Samples
The relevant crystal phase, the crystal construction message of the corresponding materials, and even the degree of its crystallinity are demonstrated in the XRD characterization results. Figure 3 shows that the XRD patterns of In2O3, In-Ag-1, In-Ag-2, and In-Ag-3 essentially have the same shape. The characteristic peaks of the four samples correspond to the standard PDF card for In2O3 (JCPDS: 71-2194) without any pattern peak for other impurities in the samples, which verifies that all these In2O3-based materials have high purity and crystallinity. The absence of characteristic peaks related to the Ag element in the decorated samples of In-Ag-1, In-Ag-2, and In-Ag-3 can be explained by the fact that the amounts of Ag decoration were mixed and difficult to detect. In order to calculate the crystallize size (d) of the mentioned materials, the Debye–Scherer equation was used.
where k is a constant, k = 0.89, λ is the wavelength of the X-ray, λ = 0.1542 nm, θ is the Bragg diffraction angle, and β is the full width at half maximum (FWHM). The three most intense peaks in the XRD spectrum of the In2O3-based materials corresponding to (222), (440), and (622) diffraction planes were used to calculate the FWHM. The crystalline parameters are shown in Table 1 and the average crystallize sizes of the In2O3, In-Ag-1, In-Ag-2, and In-Ag-3 were 14.4 nm, 14.6 nm, 15.7 nm, and 15.5 nm, respectively. The trend of change in crystallize size matches the trend of change in gas response, which laterally confirms that Ag decoration affected the crystallize size and, thus, enhanced the gas-sensitive properties.
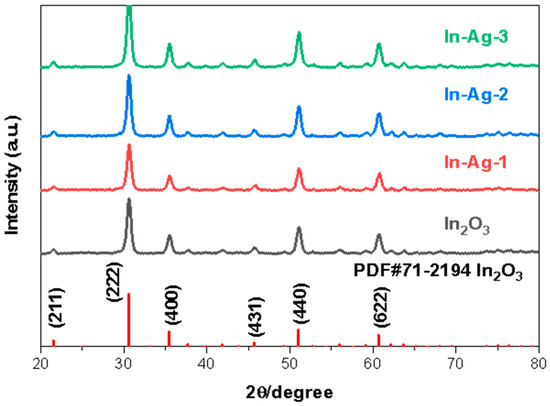
Figure 3.
XRD patterns of the In2O3, In-Ag-1, In-Ag-2, and In-Ag-3.

Table 1.
Crystallize size calculation parameters of In2O3, In-Ag-1, In-Ag-2, and In-Ag-3.
The morphologies of the In2O3, In-Ag-1, In-Ag-2, and In-Ag-3 materials are illustrated through SEM at different magnifications in Figure 4. The cube-like constructions of the four materials can be clearly seen, but the decorated Ag nanoparticles cannot be obviously observed in Figure 4c–f because of their tiny size. Due to the effect of the surfactant PEG 12000, the nanocubes with a thickness range from 3 μm to 5.3 μm were evenly distributed. The increasing amount of the Ag element had a slight impact on the microstructure. However, the saturation and shortage of the noble metal decoration led to a poor gas response.
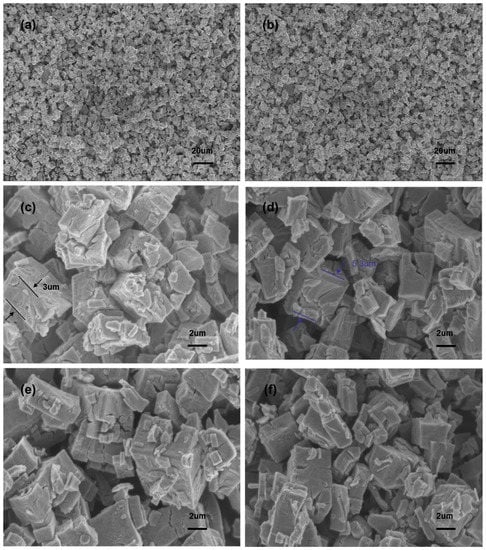
Figure 4.
SEM images of different magnifications: (a,c) In2O3; (d) In-Ag-1; (b,e) In-Ag-2; (f) In-Ag-3.
EDS was used to establish the existence of the Ag element because Ag particles were not observed in SEM. Figure 5a is the EDS diagram of In-Ag-2. The perfect correspondence between several peaks and the three elements of In, O, and Ag proves the existence of In, O, and Ag. It can be observed that the atomic content ratios were 1.8% for Ag, 38.4% for In, and 59.8% for O. Figure 5b–e are the distribution diagrams of each element of a unit of the In-Ag-2 material, which vividly shows the spatial distribution of In, O, and Ag. The above pictures show that In, O, and Ag were all present in the nanocubes and were uniformly distributed.
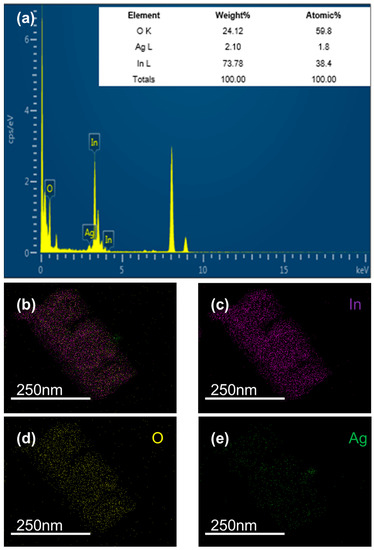
Figure 5.
EDS analysis of (a) In-Ag-2 and elemental mapping images of (b–e) In-Ag-2.
TEM and HRTEM were used to obtain further evidence of the successful decoration and information on the lattice stripe spacing [24]. Figure 6 shows to the TEM and HRTEM images of In-Ag-2 at different magnifications. Among them, Figure 6a–c are TEM images with different magnifications, showing the cubic microstructure of In2O3. In addition, in Figure 6c, it can be observed that Ag nanoparticles with a particle size of about 30 nm adhered to the In2O3 nanocube without changing the morphology and structure of the initial materials. Figure 6d–f show the HRTEM images. The lattice stripe spacings in Figure 6d,e are 0.236 nm and 0.237 nm, which are consistent with the (111) crystal plane of Ag, and in Figure 6f, the lattice stripe spacing is 0.29 nm, which is consistent with the (222) crystal plane of In2O3.
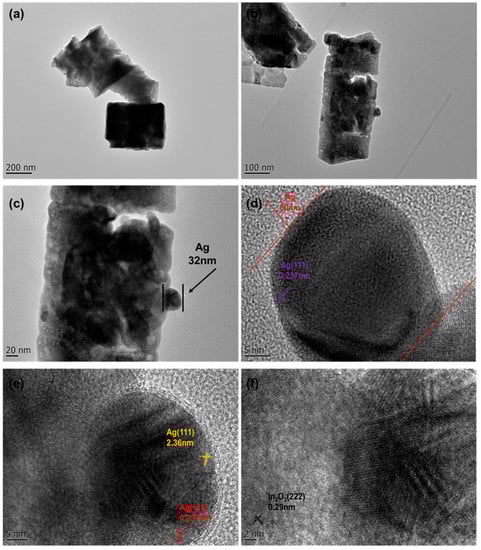
Figure 6.
TEM images of different magnifications: (a–c) In-Ag-2. HRTEM images of different magnifications: (d–f) In-Ag-2.
The surface chemical state of pure In2O3 and In-Ag-2 were investigated using XPS and are shown in Figure 7. In Figure 7a, the element information about In, O, C, and In from pristine In2O3 and In-Ag-2 is marked in the full XPS spectra. Figure 7b shows an amplified spectrum of elemental Ag with two signals at 368.3 eV and 374.2 eV, which correspond to the metal peaks of Ag 3d5/2 and Ag 3d3/2, respectively. Figure 7c is the high-resolution spectra of In 3d. Figure 7c details the XPS spectra of In 3d in In2O3 and In-Ag-2, where In-Ag-2 shows two strong peaks at 452 eV and 444.5 eV and In2O3 at 452 eV and 444.3 eV. Details of the O 1s XPS spectra of the In2O3 nanocubes and In-Ag-2 are shown in Figure 7d. These two peaks at 530 eV and 531.4 eV are lattice oxygen (OL) and chemisorbed oxygen (OC), respectively. Chemisorbed oxygen plays an important role in gas sensing. The spillover effect of silver nanoparticles and the formation of Schottky junctions between Ag and In2O3 can lead to electron transfer between the two, thus changing the oxygen species. According to the well-known spillover effect, Ag particles increase the ability to capture elemental oxygen in air through their catalytic effect, making it easier to convert elemental oxygen into chemisorbed oxygen spillover on the material surface. In addition, it can be observed that the addition of Ag elements transformed the oxygen elements on the material surface, resulting in a lower lattice oxygen content and an increased chemisorbed oxygen content. Both the increasing content of oxygen and the conversion of chemisorbed oxygen content can benefit gas sensing.
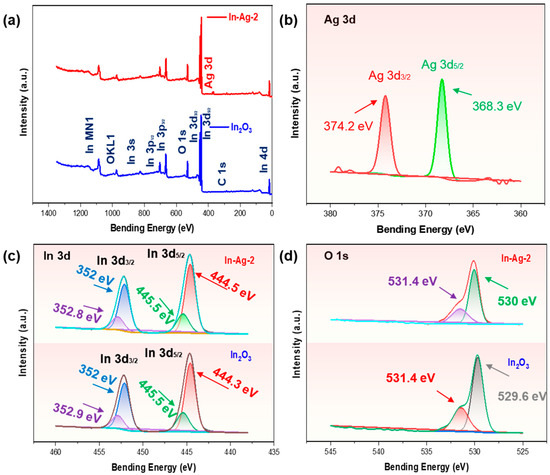
Figure 7.
(a) XPS survey spectra of In-Ag-2 and In2O3; high-resolution elemental spectra of (b) Ag 3d, (c) In 3d, and (d) O 1s in In-Ag-2 and pristine In2O3.
3.2. Gas Sensing Characteristics
It is common knowledge that the optimal operating temperature is one of the most important gas sensing characteristics of MOS gas sensors. Temperature not only regulates the conductivity and carrier mobility of the MOS sensors but also provides active energy for gas adsorption to break the energy barrier between the target gas and the adsorbed oxygen [25,26]. As is shown in Figure 8a, the optimal operating temperatures of In2O3, In-Ag-1, In-Ag-2, and In-Ag-3 were 250 °C, 230 °C, 240 °C, and 270 °C, respectively. Obviously, Ag decoration reduced the optimal working temperature from 270 °C to 240 °C and improved the response from 53 to 242. The optimum operating temperature curves for all four materials show an increasing–maximum–decreasing trend. The essence is that when the operating temperature is below the peak point, the 2-butanone molecules are less adsorbed and do not have enough energy to react with the adsorbed oxygen on the sensor, leading to the response value not being sufficient to reach the maximum. As the operating temperature gradually increases, the 2-butanone gains more energy to react faster. However, at too high a temperature, the 2-butanone gas rapidly detaches from the sensor and cannot react with the adsorbed oxygen, and the response value gradually decreases. The decrease in operating temperature is probably due to the catalytic properties of the element Ag, which reduces the energy required for the reaction.
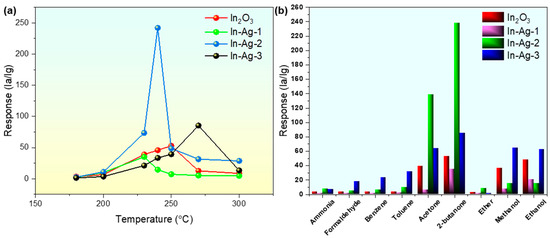
Figure 8.
(a) Sensitivity of gas sensors based on the In2O3, In-Ag-1, In-Ag-2, and In-Ag-3 to 100 ppm of 2-butanone gas from 180 °C to 300 °C; (b) selectivity of the In2O3, In-Ag-1, In-Ag-2, and In-Ag-3 gas sensors.
As is universally known, selectivity is a challenge for In2O3-based gas sensors. In general, the selectivity of In2O3, In-Ag-1, In-Ag-2, and In-Ag-3 is evaluated by examining the response of the four sensors to several different gaseous molecules (ammonia, formaldehyde, benzene, toluene, acetone, 2-butanone, ethyl ether, methanol, and ethanol) at the same concentration (100 ppm) at 240 °C. As shown in Figure 8b, it was clearly demonstrated that the response of the In-Ag-2 sensor toward 100 ppm of 2-butanone was at least tenfold that of the other seven reducing gases, and twofold that of acetone. However, it produced a similar response to the pure In2O3 sensor for 100 ppm of 2-butanone, ethanol, and acetone. According to the result above, the noble metal-decorated method enhanced the gas selectivity properties of the In-Ag-2 gas sensor to 2-butanone.
The response time and recovery time are also two of the main sensing performance targets of gas sensors. The dynamic test curves of the In2O3, In-Ag-1, In-Ag-2, and In-Ag-3 gas sensors to 100 ppm of 2-butanone gas at their optimal operating temperature are shown in Figure 9. Among them, In-Ag-3 and In-Ag-2 had the fastest response time (13) and recovery time (16), respectively. It is obvious that the response time of Ag-decorated sensors was quicker than the pure In2O3 sensors. The phenomenon indicates that Ag nanoparticles can be used to quicken the response/recovery time. The different response/recovery times might be explained by the diffusion of the gas molecule in the sensing body and the catalytic effect of the noble metal silver. The addition of Ag improved the catalytic efficiency and decreased the reactive energy. In addition, the fast response time/recovery time of In-Ag-3 might be because high temperature provided more energy to adsorb and desorb target gas. Finally, the reason for the different response shapes of In-Ag-3 from the other three is explained below. The high temperature and the noble metal catalytic effect caused the response to quickly reach its peak. However, the high temperature, in part, also led to the desorption of 2-butanone, causing the response value to decrease. The sensor response tended to be a balance condition in the process of desorption and adsorption.
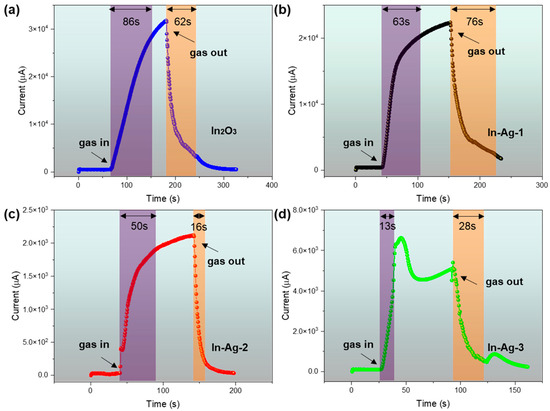
Figure 9.
Response/recovery time of (a) In2O3, (b) In-Ag-1, (c) In-Ag-2, and (d) In-Ag-3 sensors to 100 ppm of 2-butanone at operating temperatures.
The real-time response value curves of the gas sensor based on the In-Ag-2 nanocubes to different 2-butanone concentrations and the following fitting curve are presented in Figure 10. Figure 10c shows the increasing response trends of the In2O3 sensor in the 2-butanone concentration range of 5 ppm to 800 ppm. Figure 10a,b reveal the increasing response trends of the In-Ag-2 sensor in the 2-butanone concentration range of 250 ppb to 800 ppm. The lowest detection was 20 times lower than that of the In2O3 sensor. In addition, the lowest detection of the In-Ag-2 gas sensor reached 250 ppb and had a response of 2.25. The results revealed that the gas sensor based on In-Ag-2 had a higher response and a lower detection limit at a lower working temperature [27].
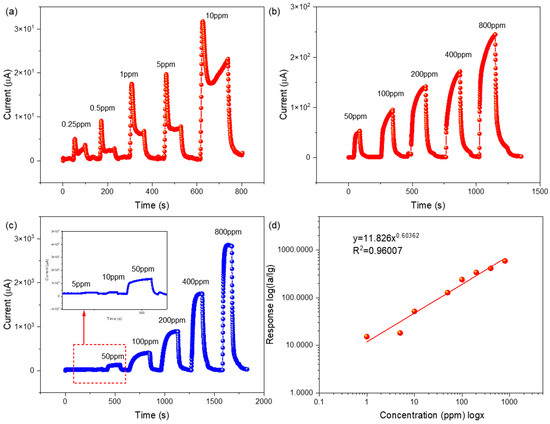
Figure 10.
Response value curves of (a,b) the In-Ag-2 gas sensor from 0.25 ppm to 800 ppm to 2-butanone at 240 °C, and (c) the In2O3 gas sensor from 5 ppm to 800 ppm to 2-butanone at 250 °C; (d) fitting curve of response to different concentrations of 2-butanone.
Moreover, the corresponding fitting curve between the concentration and response values of the In-Ag-2 gas sensor to 2-butanone at the operating temperature of 240 °C can be seen in Figure 10d. It obviously depicts a climbing trend when the concentration of the 2-butanone gas gradually increased. This might have been due to the increased amount of 2-butanone molecules added being involved in the reaction with adsorbed oxygen. However, an interesting phenomenon is that the response values of the sensor show a form of linear increase at low concentrations and another type of nonlinear rise at high concentrations, i.e., logarithmic fitting. In-Ag-2 conformed to the power law property of the sensor. That is to say, there was a good correlation between the resistance R of the sensor and the partial pressure of the target gas in question. The resistance value was fixed at a stable baseline in the air. After exposure to the reducing gas, the O− ions were consumed by the reaction, causing them to decrease to a determined new stable value. However, if the pressure of 2-butanone was too low, the O− rate consumed by the reaction could not exceed the desorption rate of O− in the internal process. Under these conditions, the reaction could not effectively reduce O− or R. This situation corresponds to the situation described. Only when the gas pressure was sufficiently high could the reaction effectively reduce O− [28]. This is a form of the dynamic balance of the adsorption and desorption of 2-butanone molecules on the material surface [29]. It is thought that the decrease in the response increasing rate and the saturation condition was caused by the working temperature not providing enough energy to adsorb so many 2-butanone molecules or there not being enough area on the material surface to supply reaction sites.
The sensor repeatability shows that the equipment operated smoothly. Figure 11a reveals a repeatability test curve of the gas sensor based on In-Ag-2 for 100 ppm of 2-butanone at the optimum working temperature of 240 °C. After five cycles of testing, the observed value and shape from the five consecutive response curves of the In-Ag-2 gas sensor did not have much difference among them, indicating the In-Ag-2-based gas sensor possessed good reproducibility.
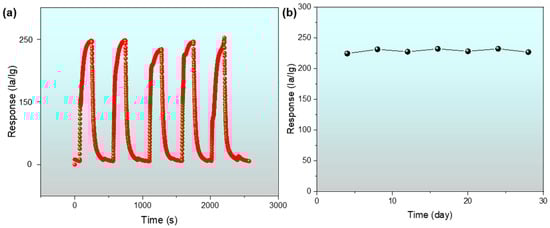
Figure 11.
(a) Repeatability test of the In-Ag-2 sensor to 100 ppm of 2-butanone at 240 °C; (b) the long-term stability curve of the In-Ag-2 sensor.
Additionally, the long-term stability of a gas sensor is of great practical importance. The long-term stability of sensors determines the service life of the equipment. Figure 11b vividly exhibits a one-month stability value test curve for the In-Ag-2 nanomaterial sensor to 100 ppm of 2-butanone at 240 °C every four days. The response curves of the sensor fluctuated less than 3% in one month, demonstrating the improved stability of the In-Ag-2 composite material [30].
Furthermore, the In-Ag-2 sensors were compared with those from previous studies as shown in Table 2. The In-Ag-2 sensor has good properties in terms of response and low detection limit.
Table 2.
Performance comparison of 2-butanone gas sensors from the previous literature and this work.
3.3. Sensing Mechanism of the Ag@In2O3
The 2-butanone gas detection mechanism of the Ag@In2O3 sensor is shown in Figure 12. MOS gas sensors detect hazardous gases by adsorbing gases, which change their resistance values. It is general knowledge that In2O3 is a typical n-type MOS with a broad band gap (3.55 eV–3.75 eV). The gas sensing mechanism can be explained by the electron depletion layer (EDL) theory. In addition, Equations (4)–(7) are oxygen adsorption chemical equations. The equations can be explained as follows: when the material is exposed to normal air conditions, the material adsorbs oxygen from the air, turning free oxygen into adsorbed oxygen [38]. The adsorbed oxygen then traps electrons from the conduction band of the material to become negatively charged oxygen with a different charge and forms an EDL on the surface of the materials, increasing the resistance of the material [25]. Moreover, the reason that the adsorption oxygen type is mostly O− is because the operating temperature of Ag@In2O3 is 240 °C.
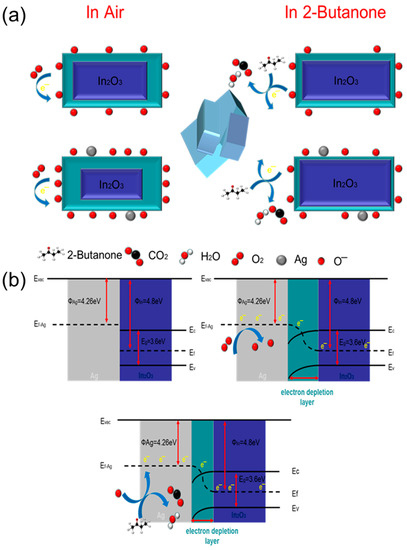
Figure 12.
(a) The gas adsorption sensing mechanism diagram and (b) the energy band graph of the Ag-decorated In2O3 gas sensor.
2-Butanone is a VOC with a reducing property. When the sensor is exposed to 2-butanone, the sensor adsorbs the 2-butanone from the gas onto the sensor surface. It then reacts with the adsorbed oxygen (O−) on the sensor surface. During the reaction, the adsorbed oxygen loses electrons and the material regains electrons, resulting in a narrowing of the EDL. Moreover, the reaction produces new products: water and carbon dioxide [24]. The reaction is depicted in Equation (8).
The excellent sensing properties of the Ag@In2O3 sensor for 2-butanone can be attributed to several characteristics. The SEM and TEM images show good dispersion and a unique three-dimensional cubic structure, both of which provide a sufficient number of adsorption sites and reaction scenarios for the adsorption of oxygen and 2-butanone. The gas adsorption diagram is depicted in Figure 12a.
Precious metal decoration also plays an important role in the performance of Ag@In2O3 sensors. As a typical catalyst material, Ag nanoparticles have been frequently used in many previous studies for doping or decoration to enhance the gas-sensitive properties of MOS gas sensors. The synergistic effect of electronic and chemical sensitization of Ag nanoparticles leads to a significant increase in the sensitivity of Ag@In2O3 sensors and a substantial decrease in the lower detection limit. Chemical sensitization refers to the use of Ag as a reaction catalyst to reduce the activation energy of the reaction between the reducing gas and the sensor, thereby improving the performance of the sensor [39]. Electronic sensitization can be explained by the significant increase in the adsorbed oxygen content of the material due to Ag decoration and the consequent thickening of the EDL layer to a larger resistance value, providing a larger resistance variation interval [40]. In addition, due to the spillover effect of the noble metal, more active O− spills over from the Ag nanoparticles to the outside of the composite and is uniformly dispersed, creating more active sites. Furthermore, when the noble metal Ag functionally modifies In2O3, electrons leap from Ag to the conductive layer of In2O3 until the Fermi energy levels of both reach equilibrium, as shown in Figure 12b. Moreover, energy band bending occurs at the boundary, prompting the formation of a Schottky barrier between Ag and In2O3, leading to a downward extension of the EDL. When the Ag@In2O3 sensor is in contact with 2-butanone, the 2-butanone molecule reacts with adsorbed O−, and electrons return to the In2O3 conduction band, leading to a simultaneous decrease in the Schottky barrier height and sensor resistance value [41,42]. In addition, the size of the particles was calculated using the Debye–Scherer equation. The result shows that the sensor coated with the Ag-decorated material in the ratio of 2 at% had the highest sensitivity and the largest change in particle size. Consequently, it can be assumed that the improvement in the particle size of the In2O3-based composite as a result of Ag nanoparticle decoration was an important factor in improving the sensitivity.
4. Conclusions
In this article, Ag nanoparticle-decorated In2O3 nanocubes with excellent 2-butanone sensing properties were successfully prepared via a one-pot hydrothermal method, using PEG 12000 as a structure-directing and porogenic agent. Following surface modification, the sensitivity of Ag@In2O3 nanocomposites to 100 ppm of 2-butanone reached 242, fourfold the value of the pure In2O3 nanomaterials, at an optimum operating temperature of 240 °C. Moreover, the lowest detection decreased from 5 ppm to 250 ppb, which is a relatively low level, and the higher detection concentration gradually reached saturation beyond 400 ppm of 2-butanone gas molecules. In addition, there was a degree of reduction (from 270 °C to 240 °C) in the optimum operating temperature, which cut the power consumption. The response time/recovery time also decreased a lot (from 86/62 to 50/16). The enhanced gas sensing performance of the Ag@In2O3 compound sensor could be attributed to the three-dimensional microstructure and catalytic effect of the noble metal. Hence, it might serve as a potential and promising material in 2-butanone detection.
Author Contributions
Conceptualization, F.M.; methodology, F.M.; writing—review and editing, Y.G.; funding acquisition, F.M.; data analysis, H.G.; Data curation, Y.G.; visualization, Y.G. and F.M.; supervision, H.Z., H.G. and F.M.; investigation, Y.G.; resources, F.M.; writing—original draft preparation, Y.G.; project administration, H.Z.; validation, Y.G. All authors have read and agreed to the published version of the manuscript.
Funding
This work was supported by the National Natural Science Foundation of China (62071112, 62033002, 62271006, and 61973058), the Fundamental Research Funds for the Central Universities in China (N2201008), the 111 Project (B16009), the Hebei Natural Science Foundation (F2020501040).
Institutional Review Board Statement
Not applicable.
Informed Consent Statement
Not applicable.
Data Availability Statement
Not applicable.
Conflicts of Interest
The authors declare no conflict of interest.
References
- Perfecto, T.M.; Zito, C.A.; Volanti, D.P. Effect of NiS nanosheets on the butanone sensing performance of ZnO hollow spheres under humidity conditions. Sens. Actuators B Chem. 2021, 334, 129684. [Google Scholar] [CrossRef]
- Zhang, Y.; Wang, C.; Liu, F.; Sun, X.; Guo, X.; Zhao, L.; Lu, G. 3-Aminopropyltriethoxysilane functionalized ZnO materials for improving the gas sensitivity to 2-butanone. Sens. Actuators B Chem. 2022, 363, 131845. [Google Scholar] [CrossRef]
- Song, B.-Y.; Li, C.; Zhang, X.-F.; Gao, R.; Cheng, X.-L.; Deng, Z.-P.; Xu, Y.-M.; Huo, L.-H.; Gao, S. A highly sensitive and selective nitric oxide/butanone temperature-dependent sensor based on waste biomass-derived mesoporous SnO2 hierarchical microtubes. J. Mater. Chem. A 2022, 10, 14411–14422. [Google Scholar] [CrossRef]
- Liu, Y.; Ji, H.; Yuan, Z.; Meng, F. Conductometric butanone gas sensor based on Co3O4 modified SnO2 hollow spheres with ppb-level detection limit. Sens. Actuators B Chem. 2023, 374, 132787. [Google Scholar] [CrossRef]
- Weng, Y.; Zhang, L.; Zhu, W.; Lv, Y. One-step facile synthesis of coral-like Zn-doped SnO2 and its cataluminescence sensing of 2-butanone. J. Mater. Chem. A 2015, 3, 7132–7138. [Google Scholar] [CrossRef]
- Hamacher, T.; Niess, J.; Schulze Lammers, P.; Diekmann, B.; Boeker, P. Online measurement of odorous gases close to the odour threshold with a QMB sensor system with an integrated preconcentration unit. Sens. Actuators B Chem. 2003, 95, 39–45. [Google Scholar] [CrossRef]
- Rella, R.; Spadavecchia, J.; Ciccarella, G.; Siciliano, P.; Vasapollo, G.; Valli, L. Optochemical vapour detection using spin coated thin films of metal substituted phthalocyanines. Sens. Actuators B Chem. 2003, 89, 86–91. [Google Scholar] [CrossRef]
- Zhou, M.; Lee, J.; Zhu, H.; Nidetz, R.; Kurabayashi, K.; Fan, X. A fully automated portable gas chromatography system for sensitive and rapid quantification of volatile organic compounds in water. RSC Adv. 2016, 6, 49416–49424. [Google Scholar] [CrossRef]
- Zhang, Y.; Gao, G.; Liu, H.; Fu, H.; Fan, J.; Wang, K.; Chen, Y.; Li, B.; Zhang, C.; Zhi, X.; et al. Identification of volatile biomarkers of gastric cancer cells and ultrasensitive electrochemical detection based on sensing interface of Au-Ag alloy coated MWCNTs. Theranostics 2014, 4, 154–162. [Google Scholar] [CrossRef]
- Delgado-Rodríguez, M.; Ruiz-Montoya, M.; Giraldez, I.; López, R.; Madejón, E.; Díaz, M.J. Use of electronic nose and GC-MS in detection and monitoring some VOC. Atmos. Environ. 2012, 51, 278–285. [Google Scholar] [CrossRef]
- Zhang, R.K.; Wang, J.X.; Cao, H. High-Performance Cataluminescence Sensor Based on Nanosized V(2)O(5) for 2-Butanone Detection. Molecules 2020, 25, 3552. [Google Scholar] [CrossRef] [PubMed]
- Zito, C.A.; Perfecto, T.M.; Oliveira, T.N.T.; Volanti, D.P. Bicone-like ZnO structure as high-performance butanone sensor. Mater. Lett. 2018, 223, 142–145. [Google Scholar] [CrossRef]
- Oliveira, T.N.T.; Zito, C.A.; Perfecto, T.M.; Azevedo, G.M.; Volanti, D.P. ZnO twin-rods decorated with Pt nanoparticles for butanone detection. New J. Chem. 2020, 44, 15574–15583. [Google Scholar] [CrossRef]
- Zhang, Q.; Xu, M.; Shen, Z.; Wei, Q. A nanostructured Cr2O3/WO3 p–n junction sensor for highly sensitive detection of butanone. J. Mater. Sci. Mater. Electron. 2017, 28, 12056–12062. [Google Scholar] [CrossRef]
- Yang, H.; Liu, L.; Liang, H.; Wei, J.; Yang, Y. Phase-controlled synthesis of monodispersed porous In2O3 nanospheres via an organic acid-assisted hydrothermal process. CrystEngComm 2011, 13, 5011–5016. [Google Scholar] [CrossRef]
- Park, S.; Kim, S.; Sun, G.-J.; Choi, S.; Lee, S.; Lee, C. Ethanol sensing properties of networked In2O3 nanorods decorated with Cr2O3-nanoparticles. Ceram. Int. 2015, 41, 9823–9827. [Google Scholar] [CrossRef]
- An, D.; Wang, Q.; Tong, X.; Lian, X.; Zou, Y.; Li, Y. ZnO-enhanced In2O3-based sensors for n-butanol gas. Ceram. Int. 2019, 45, 6869–6874. [Google Scholar] [CrossRef]
- Gao, L.; Cheng, Z.; Xiang, Q.; Zhang, Y.; Xu, J. Porous corundum-type In2O3 nanosheets: Synthesis and NO2 sensing properties. Sens. Actuators B Chem. 2015, 208, 436–443. [Google Scholar] [CrossRef]
- Ying, Z.; He, X.; Feng, C.; Li, L.; Wen, F.; Zheng, X.; Zheng, P.; Wang, G. Phenylalanine Dipeptide-Regulated Ag/In2O3 Nanocomposites for Enhanced NO2 Gas Sensing at Room Temperature with UV Illumination. ACS Appl. Nano Mater. 2021, 4, 13018–13026. [Google Scholar] [CrossRef]
- Li, D.; Li, Y.; Wang, X.; Sun, G.; Cao, J.; Wang, Y. Improved TEA Sensitivity and Selectivity of In(2)O(3) Porous Nanospheres by Modification with Ag Nanoparticles. Nanomaterials 2022, 12, 1532. [Google Scholar] [CrossRef]
- Liu, Y.; Li, S.; Xiao, S.; Du, K. In2O3 microtubes decorated with Ag nanoparticles for NO2 gas detection at room temperature. Vacuum 2022, 202, 111197. [Google Scholar] [CrossRef]
- Ji, H.; Qin, W.; Yuan, Z.; Meng, F. Qualitative and quantitative recognition method of drug-producing chemicals based on SnO2 gas sensor with dynamic measurement and PCA weak separation. Sens. Actuators B Chem. 2021, 348, 130698. [Google Scholar] [CrossRef]
- Meng, F.; Shi, X.; Yuan, Z.; Ji, H.; Qin, W.; Shen, Y.; Xing, C. Detection of four alcohol homologue gases by ZnO gas sensor in dynamic interval temperature modulation mode. Sens. Actuators B Chem. 2021, 350, 130867. [Google Scholar] [CrossRef]
- Qin, W.; Yuan, Z.; Gao, H.; Zhang, R.; Meng, F. Perovskite-structured LaCoO3 modified ZnO gas sensor and investigation on its gas sensing mechanism by first principle. Sens. Actuators B Chem. 2021, 341, 130015. [Google Scholar] [CrossRef]
- Meng, F.; Wang, H.; Yuan, Z.; Zhang, R.; Li, J. Ppb-Level Triethylamine Gas Sensors Based on Palladium Nanoparticles Modified Flower-Like In2O3 Grown on rGO Nanosheets Operating at Low Temperature. IEEE Trans. Instrum. Meas. 2022, 71, 9507909. [Google Scholar] [CrossRef]
- Meng, F.; Qi, T.; Zhang, J.; Zhu, H.; Yuan, Z.; Liu, C.; Qin, W.; Ding, M. MoS2-Templated Porous Hollow MoO3 Microspheres for Highly Selective Ammonia Sensing via a Lewis Acid-Base Interaction. IEEE Trans. Ind. Electron. 2022, 69, 960–970. [Google Scholar] [CrossRef]
- Xing, R.; Xu, L.; Song, J. Preparation and gas sensing properties of In2O3/Au nanorods for detection of volatile organic compounds in exhaled breath. Sci. Rep. 2015, 5, 10717. [Google Scholar] [CrossRef]
- Yamazoe, N.; Shimanoe, K. Theory of power laws for semiconductor gas sensors. Sens. Actuators B Chem. 2008, 128, 566–573. [Google Scholar] [CrossRef]
- Meng, F.; Li, X.; Yuan, Z.; Lei, Y.; Qi, T.; Li, J. Ppb-Level Xylene Gas Sensors Based on Co3O4 Nanoparticle-Coated Reduced Graphene Oxide (rGO) Nanosheets Operating at Low Temperature. IEEE Trans. Instrum. Meas. 2021, 70, 9511510. [Google Scholar] [CrossRef]
- Bai, S.; Chen, S.; Zhao, Y. Gas sensing properties of Cd-doped ZnO nanofibers synthesized by the electrospinning method. J. Mater. Chem. A 2014, 2, 16697–16706. [Google Scholar] [CrossRef]
- Weng, Y.-C.; Yang, Y.-H.; Lu, I.T. Detection of 2-Butanone for the Diagnosis of Helicobacter Pylori Using Graphene and ZnO Nanorod Electrodes. J. Nanosci. Nanotechnol. 2016, 16, 7077–7084. [Google Scholar] [CrossRef]
- Zhang, Q.; Zhang, H.; Xu, M.; Shen, Z.; Wei, Q. A WO3 nanorod-Cr2O3 nanoparticle composite for selective gas sensing of 2-butanone. Chin. Chem. Lett. 2018, 29, 538–542. [Google Scholar] [CrossRef]
- Liu, X.; Qin, X.; Ji, H.; Wang, M. An enhanced butanone sensing performance of Er0.7Yb0.3FeO3 material with the proper electronic structure. J. Alloys Compd. 2019, 772, 263–271. [Google Scholar] [CrossRef]
- Vioto, G.C.N.; Perfecto, T.M.; Zito, C.A.; Volanti, D.P. Enhancement of 2-butanone sensing properties of SiO2@CoO core-shell structures. Ceram. Int. 2020, 46, 22692–22698. [Google Scholar] [CrossRef]
- Zhang, Y.; Wang, C.; Zhao, L.; Liu, F.; Sun, X.; Hu, X.; Lu, G. Preparation of Ce-doped SnO2 cuboids with enhanced 2-butanone sensing performance. Sens. Actuators B Chem. 2021, 341, 130039. [Google Scholar] [CrossRef]
- Sun, P.; Yu, Y.; Xu, J.; Sun, Y.; Ma, J.; Lu, G. One-step synthesis and gas sensing characteristics of hierarchical SnO2 nanorods modified by Pd loading. Sens. Actuators B Chem. 2011, 160, 244–250. [Google Scholar] [CrossRef]
- Jiang, Z.; Guo, Z.; Sun, B.; Jia, Y.; Li, M.; Liu, J. Highly sensitive and selective butanone sensors based on cerium-doped SnO2 thin films. Sens. Actuators B Chem. 2010, 145, 667–673. [Google Scholar] [CrossRef]
- Li, Z.; Yan, S.; Sun, M.; Li, H.; Wu, Z.; Wang, J.; Shen, W.; Fu, Y.Q. Significantly enhanced temperature-dependent selectivity for NO2 and H2S detection based on In2O3 nano-cubes prepared by CTAB assisted solvothermal process. J. Alloys Compd. 2019, 816, 152518. [Google Scholar] [CrossRef]
- Naberezhnyi, D.; Rumyantseva, M.; Filatova, D.; Batuk, M.; Hadermann, J.; Baranchikov, A.; Khmelevsky, N.; Aksenenko, A.; Konstantinova, E.; Gaskov, A. Effects of Ag Additive in Low Temperature CO Detection with In(2)O(3) Based Gas Sensors. Nanomaterials 2018, 8, 801. [Google Scholar] [CrossRef]
- Bai, J.; Kong, Y.; Liu, Z.; Yang, H.; Li, M.; Xu, D.; Zhang, Q. Ag modified Tb-doped double-phase In2O3 for ultrasensitive hydrogen gas sensor. Appl. Surf. Sci. 2022, 583, 152521. [Google Scholar] [CrossRef]
- Hu, J.; Sun, Y.; Xue, Y.; Zhang, M.; Li, P.; Lian, K.; Zhuiykov, S.; Zhang, W.; Chen, Y. Highly sensitive and ultra-fast gas sensor based on CeO2-loaded In2O3 hollow spheres for ppb-level hydrogen detection. Sens. Actuators B Chem. 2018, 257, 124–135. [Google Scholar] [CrossRef]
- Mishra, R.K.; Murali, G.; Kim, T.-H.; Kim, J.H.; Lim, Y.J.; Kim, B.-S.; Sahay, P.P.; Lee, S.H. Nanocube In2O3@RGO heterostructure based gas sensor for acetone and formaldehyde detection. RSC Adv. 2017, 7, 38714–38724. [Google Scholar] [CrossRef]
Disclaimer/Publisher’s Note: The statements, opinions and data contained in all publications are solely those of the individual author(s) and contributor(s) and not of MDPI and/or the editor(s). MDPI and/or the editor(s) disclaim responsibility for any injury to people or property resulting from any ideas, methods, instructions or products referred to in the content. |
© 2023 by the authors. Licensee MDPI, Basel, Switzerland. This article is an open access article distributed under the terms and conditions of the Creative Commons Attribution (CC BY) license (https://creativecommons.org/licenses/by/4.0/).