Abstract
Ammonium (NH4+) ions are a primary contaminant in the river and along the waterside near an agricultural area, therefore, necessitating sensitive detection of pollutants before irreversibly damaging environment. Herein, a new approach of metal-organic framework-derived tungsten ethoxide/polypyrrole-reduced graphene oxide (MOFs-W(OCH2CH3)6/Ppy-rGO) electrochemical sensors are introduced. Through a simple hydrothermal process, Ppy-rGO is linked to tungsten ethoxide as an organic linker. This creates the MOFs-W(OCH2CH3)6/Ppy-rGO nanocrystal through hydrogen bonding. The synergistic combination of tungsten ethoxide and Ppy-rGO provides three-fold advantages: stabilization of Ppy-rGO for extended usage, enabling detection of analytes at ambient temperature, and availability of multiple pathways for effective detection of analytes. This is demonstrated through excellent detection of NH4+ ions over a dynamic concentration range of 0.85 to 3.35 µM with a ppb level detection limit of 0.278 µM (9.74 ppb) and a quantitation limit of 0.843 µM (29.54 ppb). The increment in the concentration of NH4+ ions contributes to the increment in proton (H+) concentration. The increment in proton concentration in the solution will increase the bonding activity and thus increase the conductivity. The cyclic voltammetry curves of all concentrations of NH4+ analytes at the operating potential window between −1.5 and 1.5 V exhibit a quasi-rectangular shape, indicating consistent electronic and ionic transport. The distinctive resistance changes of the MOFs-W(OCH2CH3)6/Ppy-rGO to various NH4+ ion concentrations and ultrasensitive detection provide an extraordinary platform for its application in the agriculture industry.
1. Introduction
Ammonia or ammonium ions (NH4+) can be found largely in agricultural vegetation sites. Additionally, the major usage of ammonia in industry, especially fertilizer production for plantations, is a leading source of NH4+ ion discharge in running water sources such as rivers. NH4+ ions are the main part of the nitrogen cycle and the metabolic product of many substances [1]. At a low concentration of approximately <3 mM, NH4+ ions are an important nitrogen source for plants. However, it will be detrimental to plants and affect the balance of the ecosystem when it is above the threshold. NH4+ ions introduced to terrestrial and aquatic systems are a source of acidity in the water through the biological uptake of NH4+ ions contributed by pollution and the nitrification process, which produces hydrogen ions [2,3]. The abundance of NH4+ ions in ecosystems can be determined by many factors, including the chemical nature of the soil, the accumulation of organic compounds, temperature, pH, light, CO2, and oxygenation [4]. Soils with low pH and anoxic conditions indicate higher ammonification than nitrification rates, which are rich in NH4+ ions. Therefore, comprehensive monitoring of NH4+ ion content in the environment especially close to industrial areas is crucial for early screening and subsequent preventive measures [5].
Numerous methods have been introduced for monitoring NH4+ ions in water surroundings. Ions are naturally unstable, so immediate quantification is crucial after collection. In the earliest methods of analysis, the most common classical methods used for NH4+ ion detection are spectrophotometric, such as ultraviolet-visible (UV-Vis), infrared (IR), and fluorimetric, and electroanalytical analyses, including potentiometric based on the use of ion-selective electrodes, amperometric, coulometric, and voltamperometric [6]. The method for the determination of NH4+ ions or NH3 was proposed by Nessler in 1856. In this method, Nessler reagent or an alkaline solution of potassium tetraiodomercurate (II) (K2HgI4) would react with the ions to give a color complex [7,8]. Unfortunately, this method suffers from poor selectivity, and the elimination of other ions’ interference is difficult. NH4+ ions were often determined by a colorimetric indophenol titration method and a potentiometric method with an ion-selective electrode [9]. Meanwhile, the ion chromatography method offered simultaneous determination of a few nitrogen-contained ions in small-volume samples and the possibility of using different detectors such as UV-vis and mass spectrometry [10]. However, this method has low selectivity and sensitivity with poor repeatability in the analyte detections.
Although the aforementioned techniques have been in practice for over a decade, they are complicated and require a long time for data processing. Amperometric and potentiometric methods are simpler methods that require selective electrodes for NH4+ ion detection due to ions’ interference, particularly Fe2+, Ni2+, P+, K+, and Na+ [11]. Though the sensor signal is not predicted to be highly affected by the presence of certain ions, the selectivity test is essential to conduct for the possibility of ion interference. This is to ensure the optimum sensing performance of the sensor for real time monitoring as these ions present in the natural water resources. Meanwhile, other techniques such as spectrophotometric, colorimetric, and fluorometric methods are straightforward and cost-effective. However, it requires elaborate sample pre-treatment to eliminate background interferences and the use of several reagents for color formation. Among the approaches to the detection of ammonium ions quantitatively, electrochemical detection gives the possibility of real-time monitoring with the advantages of high sensitivity and selectivity, low cost, and independence of the sample color and turbidity. Various types of ammonium ion sensors have been developed, with the main obstacle primarily focused on choosing suitable ion-selective components and enzymes.
The high potential of conducting polymers, 2-dimensional layered materials, and metal-organic frameworks (MOFs) has been widely recognized for sensing applications. MOFs consist of inorganic metal centers and organic linkers with a rich hydrogen bonding network that exhibits various unique features such as high porosity, tunable pore size, and large surface area. MOFs are an attractive proposition for sensing applications due to their ability to be tuned to detect specific analytes, thus offering good adsorption or active sites and thereby promoting lower detection limits. The choice of ligand or organic linker is highly crucial when designing MOFs with excellent electronic conductivity. MOFs with a large pore size are not enough for the efficient detection of toxic liquids. The active functionalizations on the pore surface can contribute to unique and specific molecular recognition between host porous frameworks and guest analytes, which then enhances the sensing performance of MOFs. Common ligands used as organic linkers are 1,3,5-benzenetricarboxylate (BTC) [12], tetrakis-4-carboxyphenyl ethylene (TCPE) [13], 2,5-dihydrobenzene-1,4-dicarboxylate (H2HBDC) [13], hydroquinone [14], 5-(dihydroxyphosphoryl)isophthalic acid (DPPA) [15], and 2,5-dihydroxy terephthalic acid or benzene dicarboxylate (BDH-(OH)2) [16]. The porosity, surface area, conductivity, and functionalization of the complex material can be tuned by the type of ligand.
There are two strategies to design and prepare good, functionalized MOFs with excellent proton-conductive properties. Firstly, by choosing and introducing acidic organic linkers, such as phosphate groups, sulfonic groups, carboxyl groups, and other groups as well, into the MOFs. Secondly, by adding additional protonic molecules or carriers into the pores of the MOFs. In this study, rGO is used as the organic linker, while the additional protonic molecules would be from the polypyrrole chain attached to the graphene oxide. Concerning ammonium ions, the ideal sorbent might have a high density of reactive or adsorption sites for ammonia and thus be prone to having an affinity for NH4+ ions. The incorporation of metal oxide and structural defects (rGO) can impart a high density, and thus metal-ammonia bonding can occur.
Graphene is a sp2-hybridized carbon atom arranged in a two-dimensional hexagonal conjugated structure. The extraordinary physical properties, such as high carrier mobility with remarkable electrical and antimicrobial properties, are undeniably incredible. Graphene is also known for its great refractive index and optical transparency of up to 97.7% for single-layer graphene [17], its high mechanical strength with Young’s modulus of 1 TPa, and its fracture strength of 130 GPa [18]. It has a remarkable thermal conductivity of approximately ~50,000 W/mK [19], a large surface area of 2630 m2/g [20], and is thermally stable. Further, reduced graphene oxide (rGO) has spectacular flexibility that sustains sensing performance stability in devices even under extreme bending stress [21,22]. The GO is well-known for its strong oxidizing properties and can act as an oxidizing agent for the oxidative polymerization of pyrrole during the reduction process. This characteristic of graphene makes it a perfect candidate to be an organic ligand.
Likewise, tungsten oxide is a very promising material because it has a high theoretical capacity, excellent chemical stability, and good conductivity. It is an n-type semiconductor that works best as a negative electrode as it has many oxidation states and is known for its high energy and packing density with massive pseudocapacitance [23]. It has been widely used in many applications, such as secondary batteries [24], photocatalysis [25], electrochemical [26], dye-solar cells [27], sensing devices [28], and flexible and portable supercapacitors [29]. It also shows an exceptionally high surface area, which is good for sensing performance. Thus, the combination between tungsten ethoxide and pyrrole-reduced graphene oxide could enhance the surface area, mobility, and active sites for ion detection, therefore developing a MOF.
In this work, the synergistic combination of tungsten ethoxide and reduced graphene oxide would be beneficial for room temperature sensor operation as compared to the high-temperature operation of tungsten-based sensors as reported in various literature [30,31]. Metal-organic frameworks-derived tungsten ethoxide/polypyrrole-reduced graphene oxide (MOFs-W(OCH2CH3)6/Ppy-rGO) nanocrystals as the sensing elements were developed, and their performance in detecting NH4+ ions at different concentrations (0, 0.84, 1.26, 1.68, 2.52, and 3.35 µM) were thoroughly studied. The as-synthesized MOFs-W(OCH2CH3)6/Ppy-rGO nanocrystal is in black powder form, and it was mixed with Nafion and dimethylformamide (DMF) to become a viscous liquid. The MOFs-W(OCH2CH3)6/Ppy-rGO solution is then dropped onto the working electrode of the screen-printed electrode (SPE). The Ppy-rGO is astonishingly well-known for its high mobility, which is due to its excellent electroactive surface sites. The addition of metal oxide, which is tungsten ethoxide, can enhance the performance of graphene. It is expected to be extremely sensitive to the presence of NH4+ ions. Consequently, the fabricated electrochemical sensor demonstrates the extremely sensitive determination of NH4+ ions over a concentration range of 0.84 µM to 3.35 µM with a limit of detection (LOD) of 0.385 µM, limit of quantification (LOQ) of 1.166 µM. The developed electrochemical sensor demonstrates good reproducibility and stability for the detection of NH4+ ions in water.
2. Materials and Methods
2.1. Materials
Freeze-dried powder of GO was received from Universiti Putra Malaysia (Serdang, Selangor, Malaysia) [32]. Pyrrole (C4H5N, 97%), ammonia solution (NH3.H2O), and N,N-dimethylformamide (C3H7NO) were obtained from Merck (Shah Alam, Malaysia). Ultrapure deionized water was obtained from THE Direct-Q 8 UV system (Darmstadt, German). Tungsten(VI) ethoxide (W(OCH2CH3)6, 99.8%) was received from Alfa Aesar (Ward Hill, MA, United States). Ethanol (CH3CH2OH) was obtained from VWR BDH Chemicals (Rosny-sous-Bois cedex, France). Phosphate buffer solution (PBS) of ultra-pure grade is obtained from 1st Base (Selangor, Malaysia) (containing 137 mM NaCl, 2.7 mM KCl, 10 mM Na2HPO4 and 1.8 mM KH2PO4; pH 7.4 at 25 °C; 0.1 M). Distilled water was obtained from Apex WS 4L (Kuala Lumpur, Malaysia). The screen-printed carbon electrode (SPCE) transducer, equipped with a working electrode with a diameter of 4 mm, a counter electrode made of carbon, a reference electrode or electric contacts made of Ag/AgCl, and a carbon ring, was purchased from Metrohm Sdn. Bhd. (Selangor, Malaysia).
2.2. Preparation of Polypyrrole-Reduced Graphene Oxide
The as-received GO powder (0.1 g) was mixed with pyrrole (0.1 mL) at a 1:1 mass-to-volume ratio and then subsequently subjected to a vaporizing process at 50 °C for a duration of 18 h. This process will reduce the GO, which can be clearly observed by the reduction of the carboxyl group and the hydroxyl group in Fourier transform infrared (FTIR) and X-ray photoelectron spectroscopy (XPS). This was followed by annealing at 120 °C for 5 h in a flow of argon gas at atmospheric pressure.
2.3. Preparation of Metal-Organic Frameworks Derived Tungsten Ethoxide/Polypyrrole-Reduced Graphene Oxide
Ppy-rGO is a polymer chain attached to a graphene structure with an oxygenated-functional group that would act as an organic ligand. Tungsten ethoxide provides metal ions with possible attachment or bonding to oxygenated-functional groups in Ppy-rGO. The well-prepared Ppy-rGO of 30 wt% was added to well-dissolved tungsten ethoxide in N,N-dimethylformamide (DMF). The 30 wt% of Ppy-rGO is chosen after optimization of weight percentage usage explained in the supplementary information referring to Figure S3B and Table S1. The mixture was then sonicated for 5 min before being stirred for 30 min and later poured into a 100 mL Teflon liner. The liner was then placed in a Parr acid digestion vessel and continuously heated to 150 °C for 4 days. The vessel was progressively cooled to room temperature for 24 h. The powder formed after 10 h of drying at 80 °C in the oven, as illustrated in Figure S1. The synthesized product was kept in the desiccator to avoid oxidation and contamination. The synthesis was similar to the previous work [33].
2.4. Characterizations
Fourier transform infrared spectroscopy (FTIR) spectra were obtained using Perkin Elmer (Waltham, MA, United States) with the sample in a KBr pellet. A linear baseline was removed from all spectra. X-ray photoelectron spectroscopy (XPS) spectra were received and analyzed using Thermo Scientific (NE Dawson Creek Drive Hillsboro, OR, United States) (Al Kα radiation, hv = 1486.7 eV). Raman spectra were acquired from Horiba Jobin Yvon Scientific (Kyoto, Japan) (HR800) with wavelengths ranging from 200–4000 nm and powers ≤ 300 mW. Brunauer, Emmett, and Teller (BET) data were received by N2 adsorption at 77 K using a surface area and porosimetry analyzer (SAP) from Micromeretics (Tristar 3020) (Norcross, GA, United States) with a degassing temperature of 150 °C for a 240 min period. The BET methods were used to measure the pore size distribution and calculate the surface area of the nanocomposites. The total pore volume was measured at a relative pressure (P/Po) of 0.99. X-ray Diffraction (XRD) spectra were obtained from Xpert3 powder PANalytical with step scan mode between 2θ = 10–90° and a scan rate of 0.01°/min using Cu Kα of 1.5406 Å. Elemental composition, which consists of carbon, hydrogen, nitrogen, sulfur, and oxygen, was analyzed using the CHNS/O elemental analyzer (Thermo Scientific, UKM, Malaysia). The surface morphology, phase structure, and elemental composition of the composites were studied using a field emission scanning electron microscope (FESEM) with energy dispersive X-ray spectroscopy (EDX) (Zeiss, Oberkochen, Germany, Supra 55VP) at 5 keV. The EDX spot pattern and mapping scanning analysis were performed by the FESEM attachment. High-resolution transmission electron microscopic (HRTEM) images were performed using a Hitachi (Tokyo, Japan) (HT7830) at magnifications of 10 to 300,000 times with a virtual depth of field.
2.5. Ammonium Ion Sensing Measurement
The screen-printed electrode (SPE), purchased from DropSens (DRP-110), Metrohm Malaysia Sdn Bhd, was composed of a carbon counter electrode, an Ag pseudo-reference electrode, and a printed graphene working electrode (diameter, Ø = 4 mm). The device was cleaned with 70% ethanol and dried at room temperature. 0.08 g of MOFs-W(OCH2CH3)6/Ppy-rGO and 0.2 mL (2 × 10⁻³ wt%) Nafion were mixed with 1 mL DMF under ultrasonication for 30 min to obtain a black suspension. 1.2 µL of the suspension is dropped onto SPE and allowed to dry at room temperature. Metrohm Autolab/PGSTAT302N Potentiostat/Galvanostat NOVA 2.1 was used to measure the sensitivity using EIS and CV. For stability analysis, both EIS and CV were performed three times at room temperature for four weeks. EIS assays were conducted using five ammonia solutions with different concentrations spiked in distilled water (0.84 µM, 1.26 µM, 1.68 µM, 2.52 µM and 3.35 µM), at a standard potential of +0.10 V, using the sinusoidal amplitude of 10 mV and a frequency of 50 Hz, logarithmically distributed over a frequency range of 10–100 kHz. Impedance data were fitted to a [R (RQ)] circuit to determine the simplified Randles circuit using NOVA 2.1 software. This circuit included solution resistance (Rs), constant phase element (CPE), and charge transfer resistance (Rct) components, where CPE and Rct are in parallel. The 0 μM ammonia concentration means the W-MOF/Ppy-rGO/SPE device was analyzed by EIS and CV analyses in PBS. The solution was prepared by mixing PBS with ultrapure water in a 1:9 ratio. Meanwhile, CV measurements were conducted in the same ammonia solution using a potential scan from −1.0 to +1.0 V at 100 mV/s.
3. Results and Discussion
Thermal and chemical reduction routes are the most commonly utilized techniques to prepare rGO from GO. In this study, chemical reduction is used to synthesize Ppy-rGO nanocomposites with pyrrole as the oxidizing agent as it is a more feasible method that produces a higher percentage yield and gives a better response to the targeted analytes [34]. In addition, hydrothermal is the most preferable method to obtain the MOFs-W(OCH2CH3)6/Ppy-rGO due to the excellent sensing performance reported [35]. GO was synthesized using a simplified version of Hummer’s method [32]. When pyrrole was added, the GO sheets became crumpled and wrinkled (Figure 1e) due to the presence of oxygen functional groups. The folded sheets also confirmed the growth of polypyrrole along the GO sheets. The tungsten nanoparticles were observed to be dispersed evenly on the surface of Ppy-rGO wrinkled sheets, which can be seen in Figure 1f. The degradation FESEM images of Ppy-rGO and MOFs-W(OCH2CH3)6/Ppy-rGO are less comparable as shown in Figure S7.
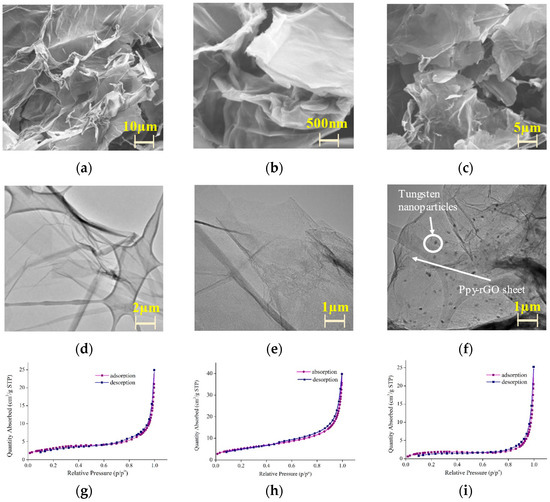
Figure 1.
FESEM images of (a) GO; (b) Ppy-rGO; (c) MOFs-W(OCH2CH3)6/Ppy-rGO; HRTEM images of (d) GO, (e) Ppy-rGO; (f) MOFs-W(OCH2CH3)6/Ppy-rGO; and an isotherm linear plot for (g) GO and (h) Ppy-rGO; (i) MOFs-W(OCH2CH3)6/Ppy-rGO.
As for the BET linear isotherm, it is observed to be a Type II isotherm based on the linear plot. At lower relative pressure, there is positive isothermal curvature, giving the first isothermal knee. This is due to the fact that the initial absorption occurred on an energetically more favorable surface area before being located on a less favorable one at low pressure. This indicates that most small pores will be filled up with a monolayer in the initial phase. Consequently, the monolayer absorption volume can be calculated, followed by specific surface areas that are to be 11.678, 19.263, and 6.312 m2/g for GO, Ppy-rGO, and MOFs-W(OCH2CH3)6/Ppy-rGO, respectively. The second region of absorption occurs at higher relative pressure which took place as saturation was approached. Essentially, the increment of absorption volume was asymptotic to the volume axis. At higher relative pressure, the profile showed an increase in adsorption volume. There were many possibilities for this occurrence, such as either multilayer adsorbate on adsorbate absorption of a non-porous sample or incomplete filling of a porous sample for nitrogen absorption at 77 K. This could also occur in a sample with a macroporous structure that possesses large pores to be filled by nitrogen molecules as saturation is approached. However, for this case, the pore sizes of GO, Ppy-rGO, and MOFs-W(OCH2CH3)6/Ppy-rGO are 10.607, 11.152, and 18.886 nm, respectively. Thus, the porosity size range of 2 nm to 50 nm has been defined as mesoporous composites. There was a high probability of inconsistency in porosity size, which caused some pores to remain incompletely filled. This was supported by the appearance of a hysteresis loop at high relative pressure in the gas desorption isotherm linear plot as depicted in Figure 1g–i. Hysteresis was observed when there was more than one pore size. Moreover, hysteresis occurred due to the incomplete evaporation of nitrogen molecules from the poor neck or body of pores. Consequently, this will give less information on pore sizes from the desorption isotherm.
Based on the calculated percentage of elements obtained from the carbon, hydrogen, nitrogen, sulfur, and oxygen databases (Table S2), it can be clearly seen that the reduction of GO occurs as the calculated number of oxygen atoms is reduced from 41 to 27. Meanwhile, nitrogen atoms were observed after reduction, attributed to the presence of a reducing agent. This result was supported by the hyperchromic shift observed in the Raman spectrum of Ppy-rGO as compared to GO (Figure S3A). Raman spectroscopy is used to distinguish ordered and disordered compound structures of carbon and solid-state materials. The upright shifting was caused by the addition of pyrrole as a reducing agent. Referring to the data in Table 1, the intensity increment in the D peak over the G peak is attributed to the increment in defect concentration present in Ppy-rGO relative to that of GO. The defect could be at the edges, a dislocation, cracks, or vacancies. Furthermore, the intensity ratios (ID/IG) of the GO and Ppy-rGO are 0.949 and 1.146, respectively. The ID/IG is used to determine the degree of disorder within the graphitic lattice. The increment in ID/IG of Ppy-rGO as compared to that of GO is attributed to the formation of the sp2 domain, or unsaturated carbon [36]. The D and G peaks are left-shifted after the reduction of GO nanocomposites, as shown in Figure 2. The left-shifting occurred due to mechanical strain, polarity change, or charge transfer [37,38].

Table 1.
Raman shifts and intensity ratios of GO, Ppy-rGO, and MOFs-W(OCH2CH3)6/Ppy-rGO.
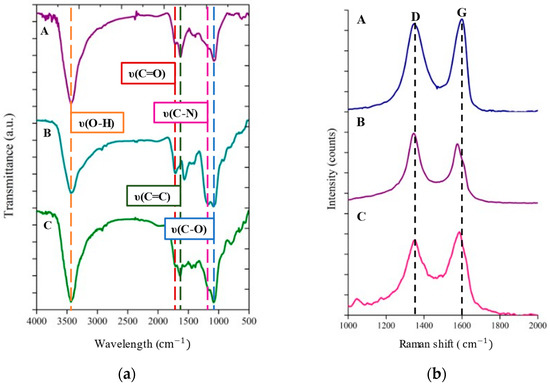
Figure 2.
(a) FTIR spectra and (b) Raman spectra of (A) GO, (B) Ppy-rGO prepared in deionized water, and (C) MOFs-W(OCH2CH3)6/Ppy-rGO prepared in DMF.
Meanwhile, the right-shifted D and G peaks of the MOFs-W(OCH2CH3)6/Ppy-rGO Raman spectrum relative to Ppy-rGO were generated upon the addition of tungsten or a new disorder that was attributed to the modification of the fine structure of graphene. The right-shifting peak was related to the increment in stacked layers of graphene, which can be seen in color intensity in EDX images (Figure S2), multiple peaks in 2D peaks of the Raman spectrum (Figure S3A) [39], and the increment number of carbon in the CHNS/O database of MOFs-W(OCH2CH3)6/Ppy-rGO (Table S2). The structure of MOFs-W(OCH2CH3)6/Ppy-rGO nanocrystal was more disordered than the structure of Ppy-rGO. Table 1 shows the Raman spectra of GO, Ppy-rGO, and MOFs-W(OCH2CH3)6/Ppy-rGO.
The degree of the defect increases simultaneously with an increment in the ID/IG ratio and intensity in the D peak over the G peak. The intensity ratio between Ppy-rGO and MOFs-W(OCH2CH3)6/Ppy-rGO was decreased due to the electronic interaction between the metal oxide and Ppy-rGO nanomaterials, which forms multiple layers [40]. The decrease in intensity of the D band of the MOFs-W(OCH2CH3)6/Ppy-rGO nanocrystal was attributed to the rearrangement of the sp2 structure upon the bond interaction between them. This result was supported by the low-intensity 2D peaks of MOFs-W(OCH2CH3)6/Ppy-rGO nanocrystal, which indicates the low crystallinity of graphene. The low crystallinity of MOFs-W(OCH2CH3)6/Ppy-rGO nanocrystals was related to the low intensity of the D peak over the G peak, or low ID/IG ratio. XRD spectra confirm the characteristic peaks of the as-prepared MOFs-W(OCH2CH3)6/Ppy-rGO samples [41,42,43,44], as shown in Figure S5 and Table S2. Briefly, the ID/IG ratio will start to decrease as an increasing defect density results in a more amorphous carbon structure [45]. Peaks located at 2738.8 cm−1 in the GO spectrum, 2714.1 cm−1 in the Ppy-rGO spectrum, and 2736.0 cm−1 in the GO spectrum were 2D lines representing the overtone of the D line, which results from an inelastic scattering from a second phonon, as shown in Figure S3A.
The FTIR spectra of GO, Ppy-rGO, and MOFs-W(OCH2CH3)6/Ppy-rGO nanocrystals were recorded in the region of 500–4000 cm−1. More oxygen-functional groups, such as carboxyl, hydroxyl, and carbonyl groups, were observed with respect to the presence of the reducing agent, pyrrole. The presence of oxygenated functional groups decreased as reduction and hydrothermal processes were conducted. In Figure 2a, the intense peaks observed at 3435, 3434, and 3433 cm−1 are ascribed to the stretching vibration of O-H for GO, Ppy-rGO, and MOFs-W(OCH2CH3)6/Ppy-rGO nanocomposites, respectively [46,47]. The peaks located at 1714, 1708, and 1675 cm−1 illustrated the stretching vibration of the C=O carboxyl group of GO, Ppy-rGO, and MOFs-W(OCH2CH3)6/Ppy-rGO from a conjugated dimer acid [48,49], respectively. Since all the nanocomposites have a sp2 hybridized conjugated hexagonal structure, it was possible to observe the dimer stretch peaks. Meanwhile, peaks located at 1630, 1659, and 1634 cm−1 were attributed to the C=C aromatic stretch peaks of GO, Ppy-rGO, and MOFs-W(OCH2CH3)6/Ppy-rGO, respectively, for cyclic conjugated cyclic alkenes. Additionally, the peaks located at 1565 and 1563 cm−1 were ascribed to N-H bending of Ppy-rGO and MOFs-W(OCH2CH3)6/Ppy-rGO, which described the interaction between pyrrole and GO after the reduction process. The peaks found at 1158, 1164, and 1131 cm−1 were due to the C-N stretch peaks of GO, Ppy-rGO, and MOFs-W(OCH2CH3)6/Ppy-rGO, respectively. However, the high-intensity ratio for the C-N stretch peak observed in the Ppy-rGO spectrum showed the interaction between nitrogen and carbon atoms upon the reduction process. The peaks located at 1079, 1087, and 1078 cm−1 were attributed to C-O bending or GO, Ppy-rGO, and MOFs-W(OCH2CH3)6/Ppy-rGO [50], respectively. Upon reduction of GO, the O-H stretch peak in the Ppy-rGO spectrum was reduced. Two possibilities might have occurred: first, the interaction of oxygen from hydroxyl groups with pyrrole, and second, the reduction of the hydroxyl group into a carbonyl group. In the FTIR spectrum shown in Figure 2, the transmittance of C-O increased as more epoxy groups were produced due to the interaction between tungsten ethoxide and Ppy-rGO. The O-H stretch peak at MOFs-W(OCH2CH3)6/Ppy-rGO spectrum was greatly intense due to the possibility that some of the oxygen in tungsten ethoxide has changed into a hydroxyl group.
Figure 3 illustrates XPS spectra exhibiting the chemical composition in the GO, Ppy-rGO, and MOFs-W(OCH2CH3)6/Ppy-rGO samples. Based on the spectra in Figure 4A, the profound peaks located at 284.3 eV and 284.8 eV represent C sp2 for aromatic molecules of Ppy-rGO and MOFs-W(OCH2CH3)6/Ppy-rGO nanocrystal, respectively. The peak found at 285.1 eV in the MOFs-W(OCH2CH3)6/Ppy-rGO XPS C 1s spectrum represents C sp3, caused by the rearrangement of the aromatic structure after the interaction between the metal oxide compound and Ppy-rGO. Further, the peaks found at 285.9, 287.8, and 290.9 eV represent the oxygen-containing functional groups such as (C=O) carbonyl, (C-O) hydroxyl, and (C-OOH) carboxyl [51], respectively. In Figure 3b, the sharp peak found at 532.8 eV, for both the Ppy-rGO and MOFs-W(OCH2CH3)6/Ppy-rGO spectra, stands for the (C=O) carboxyl group and (W-O) [52]. Additionally, two peaks that were found at 533.3 and 535.3 eV both represent (C-O) carbonyl and (C-O) hydroxyl, respectively. As for the N1s spectra (Figure 3c), the strong peak located at 400.2 eV represents pyrrolic N molecules. Meanwhile, peaks located at 397.9, 398.5, 401.7, and 402.7 eV represent peaks for graphene-N, graphene-NH2, graphitic N, and N-O, respectively [53,54]. According to the XPS spectra, the existence of an amide group in the rGO compound due to the pyrrole-reduction of GO and oxygen-containing functional groups was clearly observed. The absence of the N1s spectrum of GO can be proven from the full electron spectroscope (SPCA) energy spectrum in Figure S3C–E. The presence of oxygen-containing functional groups such as carbonyl, carboxyl, and hydroxyl improve the capability of the nanocomposites in the detection of ammonium analytes. All the assigned peaks were referred to the XPS Casa database.
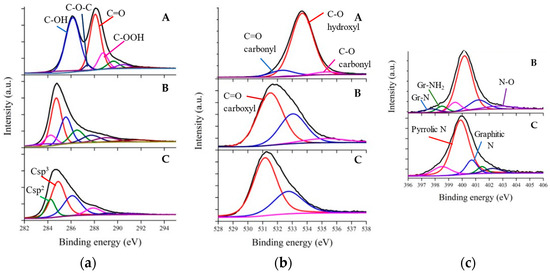
Figure 3.
Deconvoluted XPS spectra of the (a) C1s (b) O1s and (c) N1s region of (A) GO, (B) Ppy-rGO, and (C) MOFs-W(OCH2CH3)6/Ppy-rGO, respectively.
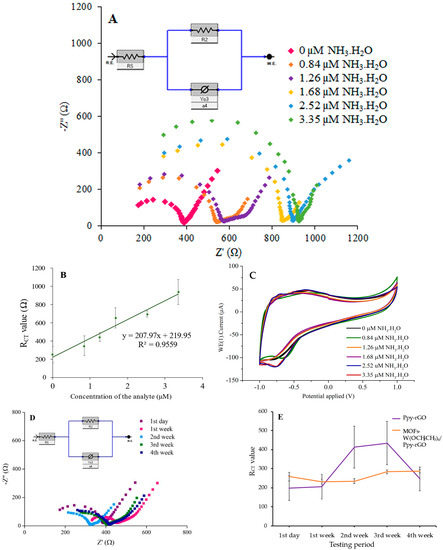
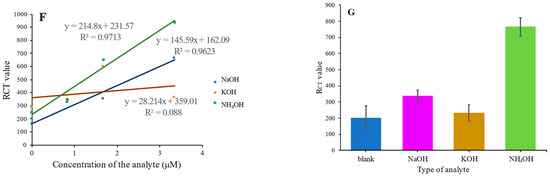
Figure 4.
(A) EIS curve and the fitted equivalent circuit; (B) regression linear plot; (C) CV curve at different concentrations in an OPW between −1.0 to 1.0 V; (D) EIS curve of the stability test for MOFs-W(OCH2CH3)6/Ppy-rGO; (E) the stability performance comparison of MOFs-W(OCH2CH3)6/Ppy-rGO and Ppy-rGO; (F) regression linear plot of MOFs-W(OCH2CH3)6/Ppy-rGO drop-casted by NaOH, KOH and NH4OH analytes; and (G) the selectivity performance of MOFs-W(OCH2CH3)6/Ppy-rGO upon detection of NH4+, K+, and Na+ ions.
Stoichiometry tungsten ethoxide (W(OCH2CH3)6) consists of covalent bonds formed by sharing a total of six electrons from the oxygen of ethoxy groups to fill up six valence electrons of the tungsten to achieve octet rule. The shared electrons are less attracted by the nucleus of W as it increases the Coulombian force of attraction for the remaining core-level electrons, leading to an increment in their binding energy (B.E.). Nevertheless, all electrons surround the nucleus of W metallic alone. As for WO3, it is attracted to electronegative oxygen. The energy needed to eject electrons from the positive center (W or WO3) is higher as compared to the neutral center or W in metal form. Therefore, the B.E. of the tungsten in WO6 is much greater than that of W in metal form. Likewise, the value of B.E. of core level electrons will be observed as being lower if there is oxygen vacancy present in WO6 than in stoichiometric WO6. In Figure S4, WO6 was observed to acquire a lesser B.E. value than those of metallic tungsten and lower than those of stoichiometric WO6, affirming the existence of sub-stoichiometric WO6. Tungsten was presented in two chemical states, namely W6+ and W5+. The deconvolution of the 4f core level into a doublet was due to spin–orbit coupling of electrons. A spectrum split into a doublet proves there were two chemical states of tungsten [55,56]. An intense doublet at a higher energy level incredibly illustrates the W6+ oxidation states with B.E. located at 35.78 and 37.98 eV, which correspond to 4f5/2 and 4f7/2, respectively. In addition, a doublet with a considerably low intensity represents the W5+ oxidation state. The existence of W in the W5+ oxidation state verifies the oxygen deficiency that is responsible for the lower electrical conductivity of the W(OCH2CH3)6 nanocrystal.
EIS is a useful tool that can be used to find out about internal resistance and make electrochemical label-free detection easier. The resulting Nyquist plots state that a high-frequency range corresponds to the equivalent series resistance (Rs), and the medium- to high-frequency range corresponds to the charge transfer resistance (Rct) of the cells. MOFs-W(OCH2CH3)6/Ppy-rGO is an n-type semiconductor sensor. For an n-type sensor, the surface absorbs oxygen molecules when exposed to air. Eventually, the oxygen molecules absorbed on the surface absorb electrons from MOFs-W(OCH2CH3)6/Ppy-rGO, which decreases the concentration of electrons and increases the resistance of the material. The chemical reaction can be described as follows [57,58]:
When surface-depleted metal oxides come into contact with the reducing ammonium ion, electrons will be transported back to the material to reduce its resistance. However, the resistance of the material increases as the concentration of ammonium solution increases. Presumably, when the ammonium hydroxide concentration is diluted to a certain lower concentration, two ions will be produced, specifically NH4+ and OH−, as shown in Equation (4). The ammonium ions can dissociate into ammonia gas (NH3) and hydrogen ions (H+) as written in Equation (5).
The addition of ammonium ions caused the formation of a complex between W(VI) and neutral ammonia, which is easily oxidized by dissolved oxygen to W(VII) (Equation (6)) [59], followed by electrochemical reduction back to W(VI), which can be observed as a cathodic current increase (Equation (7)). The formation of tungsten and water is the product of a reduction reaction, in which water is the by-product (Equation (8)). That reduction reaction may cause a slight increment of resistance. As the concentration is higher, there will be an increment in the number of ions, which increases the resistance value as observed in Figure 4A.
The Nyquist plots portrayed a depressed semi-circle and a spike in the high- and low-frequency ranges. EIS was carried out to illustrate and explore the sensing performance of MOFs-W(OCH2CH3)6/Ppy-rGO nanocomposite. The semi-circle diameter on the abscissa of the Nyquist plot in the high-frequency range of the electrochemical systems was attributed to the charge-transfer resistance (Rct). Meanwhile, the lower value of Rct indicated a higher conductivity with a high ion transfer or diffusion rate into the electrodes. Impedance measurements usually generate Nyquist plots that can be categorized into three types. (i) a depressed semi-circle, (ii) a tilted spike, or (iii) a depressed semi-circle Nyquist plot with a tilted spike. A depressed semi-circle was formed when a constant phase element with a resistor connected in parallel was present in an equivalent circuit, as shown in Figure 4A,D. The constant phase element (CPE) or “leaky capacitor,” which is connected in series with a resistor, can be observed by the plot as a shape of a spike. Thus, the Nyquist plot that appears with a depressed semi-circle and a tilted spike corresponds to a combination of a parallel connection of a resistor and CPE that are connected in series with another resistor or CPE. The depressed semi-circle corresponds to the bulk material, while the tilted spike represents the electrical double layer. The electrochemical sensor showed remarkable stability with repetitive detection of NH4+ ions for four weeks consecutively at RT and a subsequent washing process with PBS solution (Table S5 and S6). The improved stability of MOFs-W(OCH2CH3)6/Ppy-rGO as compared to Ppy-rGO is due to the presence of tungsten, as discussed earlier in Raman and XPS analyses. The redox peak current has increased correspondingly to an increment of scan rate from 20 mVs−1 to 100 mVs−1, as confirmed by linear regression with an R2 of 0.9559 as shown in Figure S6A.
The LOD and LOQ were used to measure the sensitivity of the sensor based on the concentration of ammonium solution. LOD is the minimum number of analytes a sensor can detect. Meanwhile, LOQ is the smallest amount of the minimum concentration of a substance that is possible to determine with acceptable precision, accuracy, and uncertainty. Both LOD and LOQ values were analyzed using regression analysis and calculated using the formula equation as followed:
where SD is the standard deviation (µM), and m is the gradient of the linear equation of bulk resistance measured (Ω) versus the concentration of the analytes (µM). The standard deviation (SD) is calculated using the following formula:
where SE represents the standard error after regression analysis. Meanwhile, N represents four different concentrations of analytes: 0 µM, 0.85 µM, 1.26 µM, 1.68 µM, 2.52 µM, and 3.35 µM. The MOFs-W(OCH2CH3)6/Ppy-rGO sample was placed on SPE device and the analytes were drop cast on the sample accordingly starting from 0 µM analytes to the highest concentrated analytes.
In this regression analysis, the dependable variable is the concentration of the targeted analytes, whereas the independent variable is the Rct values, which were tabulated in Table S4. The linear graph of Rct against concentration is plotted as in Figure 4B to obtain the linear equation, which is Y = mX + C, where m is the gradient of the linear plot, C is the y-intercept, Y is the y-axis and X is the x-axis. The regression coefficient (R2) can be obtained in two ways: through regression analysis and a linear plot. The R2 value is a measure of how well a linear regression model fits the data. In other words, the closer the R2 value is to 1, the more variability the model explains. The standard error (SE) obtained from the regression analysis was 37.565 µM. Hence, by using Equation (11), the SD was calculated to be 15.336 µM. Based on the calculation formulas in Equations (9) and (10), the LOD and LOQ obtained were 0.278 and 0.843 µM, respectively. The fitting curve of EIS in the electrolytes is shown in Figure 4A. The electrochemical performance of the MOFs-W(OCH2CH3)6/Ppy-rGO SPE was evaluated every after drop-casted with a constant volume of ammonium solution electrolyte at 5 concentrations.
CV measurement is an electrochemical method that is widely used to understand the electrochemical behavior of materials. The CV curves were recorded at similar scan rates and operating potential windows (OPW) from −1.0 to 1.0 V, as shown in Figure 5c. CV measurements of the W-MOF/Ppy-rGO were performed at a scan rate of 100 mVs−1. The CV curves portrayed a quasi–rectangular shape with no faradic peaks representing double–layer capacitance. Double–layer capacitance (Cdl) can also be expressed as a constant–phase element (CPE). The Cdl or CPE are obtained from the impedance if and only if the polarizable electrode is illustrated as a connection of the Rs and Cdl. The coupling of the resistance with the surface capacitance, the adsorption of ions, and the chemical inhomogeneities of the surface are the results of the polarizable electrode. The CV curve of every concentration exhibited a similar pattern at the same scan rate without any apparent distortion, which contributes to great electronic and ionic transport inside the supercapacitor electrode material [60].
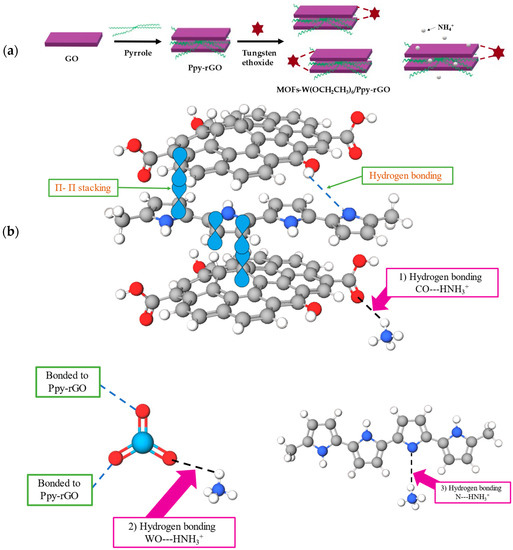
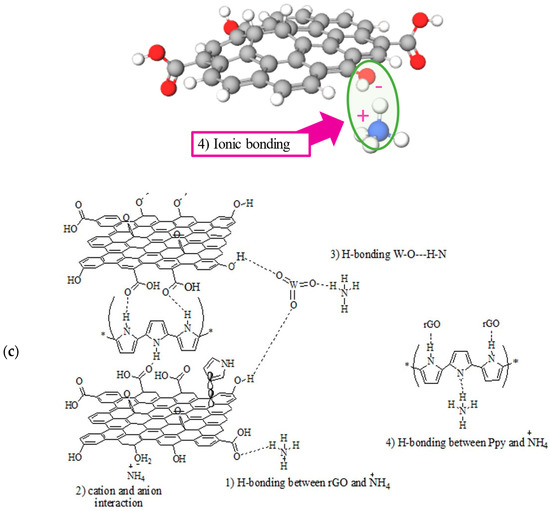
Figure 5.
Schematic illustration of the (a) preparation of MOFs-W(OCH2CH3)6/Ppy-rGO nanocrystal and detection of ammonium ions, (b,c) multiple ways of ion sensing of MOFs-W(OCH2CH3)6/Ppy-rGO nanocrystal upon detection of ammonium ions.
Ammonium ion solution is a weak base. It dissociates partially in the aqueous solution, which gives insufficient NH4+ and OH− ions and is thus less conductive. As the concentration increases, there will be an increase in the number of ions, which in turn increases the resistance value. Whereas the NaOH and KOH solutions are strong bases. They would dissociate completely into Na+, K+, and OH- ions in an aqueous solution. In addition, they are very conductive and corrosive, which reduces the thickness of the MOFs-W(OCH2CH3)6/Ppy-rGO nanocomposite. As a result, the Rs value shifted inconsistently, as observed in Figure S6B,C, which is correlated to the CV curve in Figure S6D,E. The Rs value is linearly proportional to the thickness of the drop-casted nanocomposites [61]. However, due to their high conductivity, the resistivity value of each concentration of Na+ and K+ ion solution is low. Rct value are tabulated in the Table S7. In fact, resistivity is inversely proportional to conductivity values. Hence, as expected, the EIS-fitted curves of the strong base solution showed a low resistivity value.
PBS was dropped on the material to help the device maintain n-type behavior such that electrons are the majority carriers with a larger electron concentration as compared to hole concentration. This solution has critical effects on the sensing performance of MOFs-W(OCH2CH3)6/Ppy-rGO. It consists of ions that influence the surface charges that exist on the nanocomposites’ surface. After a quick wash with PBS solution, the ammonium solution was dropped onto the material, and EIS and CV analyses were performed. The synergistic combination of the n-type properties of tungsten and the intrinsic characteristics of rGO led to an increase in the number of active sites and in the electrical conductivity needed to detect ammonium ions spiked in distilled water. Polypyrrole was anchored on the surface of the rGO nanosheets by two types of interaction: hydrogen bonding and π-π stacking, as shown in Figure 5b. The combination of these compounds has resulted in a large surface area for the fast transport of charge carriers and high availability of active surface sites for NH4+ ions. The addition of tungsten ethoxide to Ppy-rGO has enhanced the sensitivity due to the availability of multiple pathways for the detection of NH4+. The performance of MOFs-W(OCH2CH3)6/Ppy-rGO is attributed to the hydrogen bonding between W(OCH3CH5)6 and Ppy-rGO, which led to the p-n junction structure [62] as shown in Figure 5. As the NH4+ ions are adsorbed onto the sensor, the resistance increases due to the presence of electrons from the conduction band, which were transferred via efficient pathways provided by rGO. Particularly, there are four possible ways of NH4+ ion detection: hydrogen bonding between pyrrole and analytes; phenoxy groups from rGO and analytes; tungsten ethoxy and the analytes; and ion interaction between oxygen anion and NH4+ ion (Figure 5).
There are many transduction techniques for NH4+ ion detection, such as potentiometry, differential pulse voltammetry, square-wave voltammetry, colorimetry, amperometry, conductometry, impedance spectrometry, spectrophotometry, field-effect transistors (FET), and CV. Common reagents used to detect NH4+ ions are Nessler, indophenol blue (IPB), Berthelot, and Riegler to be used in the spectrophotometry technique. This technique provides highly accurate data and presents obvious color changes with the presence of NH4+ ions, as shown in Table S8 [7,8,9,59,63,64,65,66,67,68,69]. However, the reagents used have a negative effect on the environment, as most of them are toxic and corrosive [70]. This optical approach also requires complicated sample pretreatment and experimental operations [71]. Another approach will be using a FET-based sensor, which is very convenient due to its fast measurement capabilities, is portable, and allows operation under harsh and corrosive environmental conditions [72]. However, the consistency and reliability of sensing performance will be poor due to the corrosion of electrodes.
4. Conclusions
In summary, facile synthesis of MOFs-W(OCH2CH3)6/Ppy-rGO nanocrystals has been demonstrated through chemical reduction and hydrothermal techniques. The combination of graphene in tungsten-MOF provides high current mobility for improved NH4+ ion detection. The developed electrochemical sensor demonstrates high sensitivity as observed from the linear increment in the resistivity of the MOFs-W(OCH2CH3)6/Ppy-rGO electrode against increasing concentrations of NH4+ ions. The MOFs-W(OCH2CH3)6/Ppy-rGO electrode exhibited excellent stability towards NH4+ ion detection and good recovery for a four-week testing period at RT. The cyclic voltammetry showed a large redox peak current at a scan rate of 100 mVs−1. The LOD and LOQ of the MOFs-W(OCH2CH3)6/Ppy-rGO upon detection of NH4+ ions reached ppb levels at 0.278 µM (9.74 ppb) and 0.843 µM (29.54 ppb), respectively. The CV curves have remained consistent for all concentrations, showing excellent electronic and ionic transport in MOFs-W(OCH2CH3)6/Ppy-rGO nanocomposites. The improved electrochemical performance of the MOFs-W(OCH2CH3)6/Ppy-rGO after the drop-casted ammonium ions solution was attributed primarily to the synergistic effects of MOFs-W(OCH2CH3)6/Ppy-rGO, which provide outstanding electrochemical performance and, in turn, high charge capacity. The mobility properties of Ppy-rGO were enhanced with the presence of tungsten ethoxide, resulting in better ion detection. The outcome of this work based on MOFs-W(OCH2CH3)6/Ppy-rGO is expected to be of interest to sensing in agricultural areas.
Supplementary Materials
The following supporting information can be downloaded at: https://www.mdpi.com/article/10.3390/chemosensors11030201/s1. Figure S1: Schematic illustration of (A) preparation of MOFs-W(OCH2CH3)6/Ppy-rGO-based electrochemical sensor device and analysis method, and (B) the schematic illustration of SPE device preparation and detection of NH4+ ions; Figure S2: Compilation of EDX image of (A) GO, (B) Ppy-rGO, and (C) MOFs-W(OCH2CH3)6/Ppy-rGO, and elemental mapping of carbon for (D) GO, (E) Ppy-rGO, and (F) MOFs-W(OCH2CH3)6/Ppy-rGO; nitrogen for (G) Ppy-rGO, and (H) MOFs-W(OCH2CH3)6/Ppy-rGO; oxygen for (I) GO, (J) Ppy-rGO, and (K) MOFs-W(OCH2CH3)6/Ppy-rGO; sulfur for (L) GO, (M) Ppy-rGO, and (N) MOFs-W(OCH2CH3)6/Ppy-rGO; and tungsten for (O) MOFs-W(OCH2CH3)6/Ppy-rGO, respectively; Figure S3: Full Raman spectra of (A) GO, Ppy-rGO, and MOFs-W(OCH2CH3)6/Ppy-rGO, and (B) MOFs-W(OCH2CH3)6/Ppy-rGO at 30 wt%, 60 wt%, and 90 wt% of Ppy-rGO added to tungsten ethoxide, and the full electron spectroscope for chemical analysis (SPCA) energy spectrum for (C) GO, (D) Ppy-rGO, and (E) MOFs-W(OCH2CH3)6/Ppy-rGO; Table S1: Raman shifts and intensity ratios of GO, Ppy-rGO, and MOFs-W(OCH2CH3)6/Ppy-rGO; Figure S4: Deconvoluted narrow scan XPS spectrum of the W4f of MOFs-W(OCH2CH3)6/Ppy-rGO; Figure S5: XRD spectra of (a) GO, Ppy-rGO, and MOFs-W(OCH2CH3)6/Ppy-rGO, and (b) W(OCH2CH3)6; Table S2: Crystallite size and XRD data of the triclinic phase of the nanocomposites; Table S3: Empirical formula calculation based on CHNS/O database for GO, Ppy-rGO, and MOFs-W(OCH2CH3)6/Ppy-rGO; Table S4: Concentrations of the targeted analytes and the recorded charge transfer resistance; Table S5: Weekly RCT value for four weeks of the testing period; Figure S6: (A) CV curve of W-MOF/Ppy-rGO at different scan rates, EIS curve of MOFs-W(OCH2CH3)6/Ppy-rGO drop-casted by (B) NaOH and (C) KOH analytes, and CV curve of (D) NaOH and (E) KOH analytes; Table S6: Reproducibility test with concentrations of the targeted analytes and the recorded charge transfer resistance; Table S7: Selectivity test with concentrations of NH4+, Na+, and K+ analytes solution and recorded charge transfer resistance; Figure S7: FESEM images of (A) Ppy-rGO and (B) MOFs-W(OCH2CH3)6/Ppy-rGO after degradation; Table S8: The performance comparison of the W-MOF/Ppy-rGO-SPE device as an ammonium ions sensor with the developed ammonium ions sensor. References [7,8,9,39,41,42,43,44,59,60,63,64,65,66,67,68,69] are cited in the supplementary materials.
Author Contributions
Writing–reviewing, methodology, and original draft preparation: S.M.M.H., Conceptualization, editing–reviewing supervision, project administration: M.S.M.S. All authors have read and agreed to the published version of the manuscript.
Funding
This research was funded by the Lloyd’s Register Foundation International Consortium of Nanotechnologies (LRF-ICON) grant number 015ME0-117.
Institutional Review Board Statement
Not applicable.
Informed Consent Statement
Not applicable.
Data Availability Statement
Not applicable.
Acknowledgments
The authors extend their appreciation to Universiti Teknologi PETRONAS and the Center of Innovative Nanostructures and Nanodevices (COINN) for providing technical support and research facilities.
Conflicts of Interest
The authors declare no conflict of interest.
References
- Vitousek, P.M.; Aber, J.D.; Howarth, R.W.; Likens, G.E.; Matson, P.A.; Schindler, D.W.; Schlesinger, W.H.; Tilman, D.G. Human alteration of the global nitrogen cycle: Sources and consequences. Ecol. Appl. 1997, 7, 737–750. [Google Scholar] [CrossRef]
- Esteban, R.; Ariz, I.; Cruz, C.; Moran, J.F. Mechanisms of ammonium toxicity and the quest for tolerance. Plant Sci. 2016, 248, 92–101. [Google Scholar] [CrossRef] [PubMed]
- Ouyang, Y.; Norton, J.M.; Stark, J.M.; Reeve, J.R.; Habteselassie, M.Y. Ammonia-oxidizing bacteria are more responsive than archaea to nitrogen source in an agricultural soil. Soil Biol. Biochem. 2016, 96, 4–15. [Google Scholar] [CrossRef]
- Vega-Mas, I.; Marino, D.; Sanchez-Zabala, J.; Gonzalez-Murua, C.; Estavillo, J.M.; González-Moro, M.B. CO2 enrichment modulates ammonium nutrition in tomato adjusting carbon and nitrogen metabolism to stomatal conductance. Plant Sci. 2015, 241, 32–44. [Google Scholar] [CrossRef] [PubMed]
- Zheng, M.; Chen, J.; Zhang, L.; Cheng, Y.; Lu, C.; Liu, Y.; Singh, A.; Trivedi, M.; Kumar, A.; Liu, J. Metal Organic Framework as an Efficient Adsorbent for Drugs from Wastewater. Mater. Today Commun. 2022, 31, 103514. [Google Scholar] [CrossRef]
- Moorcroft, M.J.; Davis, J.; Compton, R.G. Detection and determination of nitrate and nitrite: A review. Talanta 2001, 54, 785–803. [Google Scholar] [CrossRef] [PubMed]
- Amirjani, A.; Fatmehsari, D.H. Colorimetric detection of ammonia using smartphones based on localized surface plasmon resonance of silver nanoparticles. Talanta 2018, 176, 242–246. [Google Scholar] [CrossRef]
- Ling, T.L.; Ahmad, M.; Heng, L.Y. UV-vis spectrophotometric and artificial neural network for estimation of ammonia in aqueous environment using cobalt (II) ions. Anal. Methods 2013, 5, 6709–6714. [Google Scholar] [CrossRef]
- Azmi, N.E.; Ahmad, M.; Abdullah, J.; Sidek, H.; Heng, L.Y.; Karuppiah, N. Biosensor based on glutamate dehydrogenase immobilized in chitosan for the determination of ammonium in water samples. Anal. Biochem. 2009, 388, 28–32. [Google Scholar] [CrossRef]
- Jackson, P.E. Ion chromatography in environmental analysis. In Encyclopedia of Analytical Chemistry; John Wiley & Sons Ltd.: Chichester, UK, 2000; pp. 2779–2801. [Google Scholar]
- Kazanskaya, N.; Kukhtin, A.; Manenkova, M.; Reshetilov, N.; Yarysheva, L.; Arzhakova, O.; Volynskii, A.; Bakeyev, N. FET-based sensors with robust photosensitive polymer membranes for detection of ammonium ions and urea. Biosens. Bioelectron. 1996, 11, 253–261. [Google Scholar] [CrossRef]
- Bhardwaj, S.K.; Mohanta, G.C.; Sharma, A.L.; Kim, K.-H.; Deep, A. A three-phase copper MOF-graphene-polyaniline composite for effective sensing of ammonia. Anal. Chim. Acta 2018, 1043, 89–97. [Google Scholar] [CrossRef] [PubMed]
- Shustova, N.B.; Cozzolino, A.F.; Reineke, S.; Baldo, M.; Dincă, M. Selective turn-on ammonia sensing enabled by high-temperature fluorescence in metal–organic frameworks with open metal sites. J. Am. Chem. Soc. 2013, 135, 13326–13329. [Google Scholar] [CrossRef]
- Li, Y.-P.; Li, S.-N.; Jiang, Y.-C.; Hu, M.-C.; Zhai, Q.-G. A semiconductor and fluorescence dual-mode room-temperature ammonia sensor achieved by decorating hydroquinone into a metal–organic framework. Chem. Commun. 2018, 54, 9789–9792. [Google Scholar] [CrossRef]
- Liu, R.; Zhao, L.; Yu, S.; Liang, X.; Li, Z.; Li, G. Enhancing Proton Conductivity of a 3D Metal–Organic Framework by Attaching Guest NH3 Molecules. Inorg. Chem. 2018, 57, 11560–11568. [Google Scholar] [CrossRef] [PubMed]
- Katz, M.J.; Howarth, A.J.; Moghadam, P.Z.; DeCoste, J.B.; Snurr, R.Q.; Hupp, J.T.; Farha, O.K. High volumetric uptake of ammonia using Cu-MOF-74/Cu-CPO-27. Dalton Trans. 2016, 45, 4150–4153. [Google Scholar] [CrossRef] [PubMed]
- Nair, R.R.; Blake, P.; Grigorenko, A.N.; Novoselov, K.S.; Booth, T.J.; Stauber, T.; Peres, N.M.; Geim, A.K. Fine structure constant defines visual transparency of graphene. Science 2008, 320, 1308. [Google Scholar] [CrossRef] [PubMed]
- Lee, C.; Wei, X.; Kysar, J.W.; Hone, J. Measurement of the elastic properties and intrinsic strength of monolayer graphene. Science 2008, 321, 385–388. [Google Scholar] [CrossRef]
- Balandin, A.A.; Ghosh, S.; Bao, W.; Calizo, I.; Teweldebrhan, D.; Miao, F.; Lau, C.N. Superior thermal conductivity of single-layer graphene. Nano Lett. 2008, 8, 902–907. [Google Scholar] [CrossRef]
- Demon, S.Z.N.; Kamisan, A.I.; Abdullah, N.; Noor, S.A.M.; Khim, O.K.; Kasim, N.A.M.; Yahya, M.Z.A.; Manaf, N.A.A.; Azmi, A.F.M.; Halim, N.A. Graphene-based Materials in Gas Sensor Applications: A Review. Sens. Mater. 2020, 32, 759–777. [Google Scholar] [CrossRef]
- Singh, E.; Meyyappan, M.; Nalwa, H.S. Flexible graphene-based wearable gas and chemical sensors. ACS Appl. Mater. Interfaces 2017, 9, 34544–34586. [Google Scholar] [CrossRef]
- Gong, X.; Liu, G.; Li, Y.; Yu, D.Y.W.; Teoh, W.Y. Functionalized-graphene composites: Fabrication and applications in sustainable energy and environment. Chem. Mater. 2016, 28, 8082–8118. [Google Scholar] [CrossRef]
- Zheng, H.; Tachibana, Y.; Kalantar-Zadeh, K. Dye-sensitized solar cells based on WO3. Langmuir 2010, 26, 19148–19152. [Google Scholar] [CrossRef]
- Cao, J.; Zhang, D.; Yue, Y.; Wang, X.; Srikhaow, A.; Sriprachuabwong, C.; Tuantranont, A.; Zhang, X.; Wu, Z.-S.; Qin, J. Strongly coupled tungsten oxide/carbide heterogeneous hybrid for ultrastable aqueous rocking-chair zinc-ion batteries. Chem. Eng. J. 2021, 426, 131893. [Google Scholar] [CrossRef]
- Yang, G.; Zhu, X.; Cheng, G.; Chen, R.; Xiong, J.; Li, W.; Wei, Y. Engineered tungsten oxide-based photocatalysts for CO2 reduction: Categories and roles. J. Mater. Chem. A 2021, 9, 22781–22809. [Google Scholar] [CrossRef]
- Han, W.; Shi, Q.; Hu, R. Advances in electrochemical energy devices constructed with tungsten oxide-based nanomaterials. Nanomaterials 2021, 11, 692. [Google Scholar] [CrossRef] [PubMed]
- Zhang, Y.; Yun, S.; Wang, C.; Wang, Z.; Han, F.; Si, Y. Bio-based carbon-enhanced tungsten-based bimetal oxides as counter electrodes for dye-sensitized solar cells. J. Power Sources 2019, 423, 339–348. [Google Scholar] [CrossRef]
- Jeevitha, G.; Mangalaraj, D. Ammonia sensing at ambient temperature using tungsten oxide (WO3) nanoparticles. Mater. Today Proc. 2019, 18, 1602–1609. [Google Scholar] [CrossRef]
- Gupta, S.P.; More, M.A.; Late, D.J.; Walke, P.S. High-rate quasi-solid-state hybrid supercapacitor of hierarchical flowers of hydrated tungsten oxide nanosheets. Electrochim. Acta 2021, 366, 137389. [Google Scholar] [CrossRef]
- Jaroenapibal, P.; Boonma, P.; Saksilaporn, N.; Horprathum, M.; Amornkitbamrung, V.; Triroj, N. Improved NO2 sensing performance of electrospun WO3 nanofibers with silver doping. Sens. Actuators B Chem. 2018, 255, 1831–1840. [Google Scholar] [CrossRef]
- Ma, J.; Ren, Y.; Zhou, X.; Liu, L.; Zhu, Y.; Cheng, X.; Xu, P.; Li, X.; Deng, Y.; Zhao, D. Pt nanoparticles sensitized ordered mesoporous WO3 semiconductor: Gas sensing performance and mechanism study. Adv. Funct. Mater. 2018, 28, 1705268. [Google Scholar] [CrossRef]
- Ban, F.; Majid, S.R.; Huang, N.M.; Lim, H. Graphene oxide and its electrochemical performance. Int. J. Electrochem. Sci. 2012, 7, 4345–4351. [Google Scholar]
- Hizam, S.M.M.; Soaid, N.I.; Saheed, M.S.M.; Mohamed, N.M.; Kait, C.F. Study of Electrical Conductivity of Pyrrole-Reduced Graphene Oxide Pellet. In Proceedings of the 2021 IEEE International Conference on Sensors and Nanotechnology (SENNANO), Port Dickson, Malaysia, 22–24 September 2021; pp. 150–154. [Google Scholar]
- Wang, Y.; Zhang, L.; Hu, N.; Wang, Y.; Zhang, Y.; Zhou, Z.; Liu, Y.; Shen, S.; Peng, C. Ammonia gas sensors based on chemically reduced graphene oxide sheets self-assembled on Au electrodes. Nanoscale Res. Lett. 2014, 9, 251. [Google Scholar] [CrossRef] [PubMed]
- Esfandiar, A.; Irajizad, A.; Akhavan, O.; Ghasemi, S.; Gholami, M.R. Pd–WO3/reduced graphene oxide hierarchical nanostructures as efficient hydrogen gas sensors. Int. J. Hydrogen Energy 2014, 39, 8169–8179. [Google Scholar] [CrossRef]
- Lee, A.Y.; Yang, K.; Anh, N.D.; Park, C.; Lee, S.M.; Lee, T.G.; Jeong, M.S. Raman study of D* band in graphene oxide and its correlation with reduction. Appl. Surf. Sci. 2021, 536, 147990. [Google Scholar] [CrossRef]
- Xu, H.; Wu, X.; Li, X.; Luo, C.; Liang, F.; Orignac, E.; Zhang, J.; Chu, J. Properties of graphene-metal contacts probed by Raman spectroscopy. Carbon 2018, 127, 491–497. [Google Scholar] [CrossRef]
- Vidano, R.; Fischbach, D.; Willis, L.; Loehr, T. Observation of Raman band shifting with excitation wavelength for carbons and graphites. Solid State Commun. 1981, 39, 341–344. [Google Scholar] [CrossRef]
- Saheed, M.S.M.; Mohamed, N.M.; Singh, B.S.M.; Saheed, M.S.M. Precursor and pressure dependent 3D graphene: A study on layer formation and type of carbon material. Diamond Relat. Mater. 2017, 79, 93–101. [Google Scholar] [CrossRef]
- Peng, F.; Wang, S.; Yu, W.; Huang, T.; Sun, Y.; Cheng, C.; Chen, X.; Hao, J.; Dai, N. Ultrasensitive ppb-level H2S gas sensor at room temperature based on WO3/rGO hybrids. J. Mater. Sci. Mater. Electron. 2020, 31, 5008–5016. [Google Scholar] [CrossRef]
- Wojtoniszak, M.; Chen, X.; Kalenczuk, R.J.; Wajda, A.; Łapczuk, J.; Kurzewski, M.; Drozdzik, M.; Chu, P.K.; Borowiak-Palen, E. Synthesis, dispersion, and cytocompatibility of graphene oxide and reduced graphene oxide. Colloids Surf. B 2012, 89, 79–85. [Google Scholar] [CrossRef]
- Zhu, Y.; Murali, S.; Cai, W.; Li, X.; Suk, J.W.; Potts, J.R.; Ruoff, R.S. Graphene and graphene oxide: Synthesis, properties, and applications. Adv. Mater. 2010, 22, 3906–3924. [Google Scholar] [CrossRef]
- Zhang, Y.; Park, S.-J. In situ shear-induced mercapto group-activated graphite nanoplatelets for fabricating mechanically strong and thermally conductive elastomer composites for thermal management applications. Compos. Part A Appl. Sci. Manuf. 2018, 112, 40–48. [Google Scholar] [CrossRef]
- Ansari, S.M.; Khan, M.Z.; Anwar, H.; Ikram, M.; Sarfraz, Z.; Alam, N.; Khan, Y. Tungsten Oxide–reduced Graphene Oxide Composites for Photoelectrochemical Water Splitting. Arab. J. Sci. Eng. 2021, 46, 813–825. [Google Scholar] [CrossRef]
- Childres, I.; Jauregui, L.A.; Park, W.; Cao, H.; Chen, Y.P. Raman spectroscopy of graphene and related materials. In New Developments in Photon and Materials Research; Nova Science: Hauppauge, NY, USA, 2013; Volume 1, pp. 1–20. [Google Scholar]
- Hu, N.; Yang, Z.; Wang, Y.; Zhang, L.; Wang, Y.; Huang, X.; Wei, H.; Wei, L.; Zhang, Y. Ultrafast and sensitive room temperature NH3 gas sensors based on chemically reduced graphene oxide. Nanotechnology 2013, 25, 025502. [Google Scholar] [CrossRef] [PubMed]
- Jeevitha, G.; Abhinayaa, R.; Mangalaraj, D.; Ponpandian, N. Tungsten oxide-graphene oxide (WO3-GO) nanocomposite as an efficient photocatalyst, antibacterial and anticancer agent. J. Phys. Chem. Solids 2018, 116, 137–147. [Google Scholar] [CrossRef]
- Qin, L.; Liang, F.; Li, Y.; Wu, J.; Guan, S.; Wu, M.; Xie, S.; Luo, M.; Ma, D. A 2D porous zinc-organic framework platform for loading of 5-fluorouracil. Inorganics 2022, 10, 202. [Google Scholar] [CrossRef]
- Qin, L.; Li, Y.; Liang, F.; Li, L.; Lan, Y.; Li, Z.; Lu, X.; Yang, M.; Ma, D. A microporous 2D cobalt-based MOF with pyridyl sites and open metal sites for selective adsorption of CO2. Microporous Mesoporous Mater. 2022, 341, 112098. [Google Scholar] [CrossRef]
- Tiwari, D.C.; Atri, P.; Sharma, R. Sensitive detection of ammonia by reduced graphene oxide/polypyrrole nanocomposites. Synth. Met. 2015, 203, 228–234. [Google Scholar] [CrossRef]
- Kang, M.-A.; Ji, S.; Kim, S.; Park, C.-Y.; Myung, S.; Song, W.; Lee, S.S.; Lim, J.; An, K.-S. Highly sensitive and wearable gas sensors consisting of chemically functionalized graphene oxide assembled on cotton yarn. RSC Adv. 2018, 8, 11991–11996. [Google Scholar] [CrossRef]
- Vasilopoulou, M.; Soultati, A.; Georgiadou, D.; Stergiopoulos, T.; Palilis, L.; Kennou, S.; Stathopoulos, N.; Davazoglou, D.; Argitis, P. Correction: Hydrogenated under-stoichiometric tungsten oxide anode interlayers for efficient and stable organic photovoltaics. J. Mater. Chem. A 2016, 4, 17875. [Google Scholar] [CrossRef]
- Han, Y.; Wang, T.; Li, T.; Gao, X.; Li, W.; Zhang, Z.; Wang, Y.; Zhang, X. Preparation and electrochemical performances of graphene/polypyrrole nanocomposite with anthraquinone-graphene oxide as active oxidant. Carbon 2017, 119, 111–118. [Google Scholar] [CrossRef]
- Dai, S.; Liu, Z.; Zhao, B.; Zeng, J.; Hu, H.; Zhang, Q.; Chen, D.; Qu, C.; Dang, D.; Liu, M. A high-performance supercapacitor electrode based on N-doped porous graphene. J. Power Sources 2018, 387, 43–48. [Google Scholar] [CrossRef]
- Ganbavle, V.; Agawane, G.; Moholkar, A.; Kim, J.; Rajpure, K. Structural, optical, electrical, and dielectric properties of the spray-deposited WO 3 thin films. J. Mater. Eng. Perform. 2014, 23, 1204–1213. [Google Scholar] [CrossRef]
- Kalanur, S.S. Structural, optical, band edge and enhanced photoelectrochemical water splitting properties of tin-doped WO3. Catalysts 2019, 9, 456. [Google Scholar] [CrossRef]
- Yuan, Z.; Zhang, J.; Meng, F.; Li, Y.; Li, R.; Chang, Y.; Zhao, J.; Han, E.; Wang, S. Highly Sensitive Ammonia Sensors Based on Ag-Decorated WO 3 Nanorods. IEEE Trans. Nanotechnol. 2018, 17, 1252–1258. [Google Scholar] [CrossRef]
- Chen, T.-Y.; Chen, H.-I.; Hsu, C.-S.; Huang, C.-C.; Wu, J.-S.; Chou, P.-C.; Liu, W.-C. Characteristics of ZnO nanorods-based ammonia gas sensors with a cross-linked configuration. Sens. Actuators B Chem. 2015, 221, 491–498. [Google Scholar] [CrossRef]
- Zhybak, M.T.; Vagin, M.Y.; Beni, V.; Liu, X.; Dempsey, E.; Turner, A.P.; Korpan, Y.I. Direct detection of ammonium ion by means of oxygen electrocatalysis at a copper-polyaniline composite on a screen-printed electrode. Microchim. Acta 2016, 183, 1981–1987. [Google Scholar] [CrossRef]
- Biswas, S.; Drzal, L.T. Multilayered nanoarchitecture of graphene nanosheets and polypyrrole nanowires for high performance supercapacitor electrodes. Chem. Mater. 2010, 22, 5667–5671. [Google Scholar] [CrossRef]
- Khataee, A.; Dražević, E.; Catalano, J.; Bentien, A. Performance optimization of differential pH quinone-bromide redox flow battery. J. Electrochem. Soc. 2018, 165, A3918. [Google Scholar] [CrossRef]
- Hashemi, S.A.; Mousavi, S.M.; Naderi, H.R.; Bahrani, S.; Arjmand, M.; Hagfeldt, A.; Chiang, W.-H.; Ramakrishna, S. Reinforced polypyrrole with 2D graphene flakes decorated with interconnected nickel-tungsten metal oxide complex toward superiorly stable supercapacitor. Chem. Eng. J. 2021, 418, 129396. [Google Scholar] [CrossRef]
- Ahmad, R.; Tripathy, N.; Khan, M.Y.; Bhat, K.S.; Ahn, M.-s.; Hahn, Y.-B. Ammonium ion detection in solution using vertically grown ZnO nanorod based field-effect transistor. RSC Adv. 2016, 6, 54836–54840. [Google Scholar] [CrossRef]
- Ribeiro, A.; Silva, F.; Pereira, C.M. Electrochemical sensing of ammonium ion at the water/1, 6-dichlorohexane interface. Talanta 2012, 88, 54–60. [Google Scholar] [CrossRef] [PubMed]
- Zazoua, A.; Kazane, I.; Khedimallah, N.; Dernane, C.; Errachid, A.; Jaffrezic-Renault, N. Evidence of ammonium ion-exchange properties of natural bentonite and application to ammonium detection. Mater. Sci. Eng. C 2013, 33, 5084–5089. [Google Scholar] [CrossRef] [PubMed]
- Heng, L.Y.; Alva, S.; Ahmad, M. Ammonium ion sensor based on photocured and self-plasticising acrylic films for the analysis of sewage. Sens. Actuators B 2004, 98, 160–165. [Google Scholar] [CrossRef]
- Ling, T.L.; Ahmad, M.; Heng, L.Y.; Seng, T.C. The effect of multilayer gold nanoparticles on the electrochemical response of ammonium ion biosensor based on alanine dehydrogenase enzyme. J. Sens. 2011, 2011, 754171. [Google Scholar] [CrossRef]
- Tan, L.L.; Musa, A.; Lee, Y.H. Reflectance based optical fibre sensor for ammonium ion using solid-state Riegler’s reagent. Sens. Actuators B 2012, 173, 614–619. [Google Scholar] [CrossRef]
- Tan, L.L.; Ahmad, M.; Lee, Y.H. A novel optical ammonia sensor based on reflectance measurements for highly polluted and coloured water. Sens. Actuators B 2012, 171, 994–1000. [Google Scholar] [CrossRef]
- Li, D.; Xu, X.; Li, Z.; Wang, T.; Wang, C. Detection methods of ammonia nitrogen in water: A review. TrAC Trends Anal. Chem. 2020, 127, 115890. [Google Scholar] [CrossRef]
- Giakisikli, G.; Anthemidis, A.N. Automatic pressure-assisted dual-headspace gas-liquid microextraction. Lab-in-syringe platform for membraneless gas separation of ammonia coupled with fluorimetric sequential injection analysis. Anal. Chim. Acta 2018, 1033, 73–80. [Google Scholar] [CrossRef]
- Bushra, K.A.; Prasad, K.S. Based field-effect transistor sensors. Talanta 2022, 239, 123085. [Google Scholar] [CrossRef]


Disclaimer/Publisher’s Note: The statements, opinions and data contained in all publications are solely those of the individual author(s) and contributor(s) and not of MDPI and/or the editor(s). MDPI and/or the editor(s) disclaim responsibility for any injury to people or property resulting from any ideas, methods, instructions or products referred to in the content. |
© 2023 by the authors. Licensee MDPI, Basel, Switzerland. This article is an open access article distributed under the terms and conditions of the Creative Commons Attribution (CC BY) license (https://creativecommons.org/licenses/by/4.0/).