
Highly Sensitive p-SmFeO3/p-YFeO3 Planar-Electrode Sensor for Detection of Volatile Organic Compounds

 ,
,
Abstract
1. Introduction
2. Materials and Methods
2.1. Preparation of Nanomaterials
2.2. Materials Characterization
2.3. Fabrication and Measurement of Gas Sensors
3. Results
3.1. Nanomaterial Characterization
3.2. Gas-Sensing Characteristics
3.3. Mechanism Discussion
4. Conclusions
Author Contributions
Funding
Institutional Review Board Statement
Informed Consent Statement
Data Availability Statement
Acknowledgments
Conflicts of Interest
References
- Boots, A.W.; van Berkel, J.J.; Dallinga, J.W.; Smolinska, A.; Wouters, E.F.; van Schooten, F.J. The versatile use of exhaled volatile organic compounds in human health and disease. J. Breath. Res. 2012, 6, 027108. [Google Scholar] [CrossRef]
- Park, A.S.; Ritz, B.; Ling, C.; Cockburn, M.; Heck, J.E. Exposure to ambient dichloromethane in pregnancy and infancy from industrial sources and childhood cancers in California. Int. J. Hyg. Environ. Health 2017, 220, 1133–1140. [Google Scholar] [CrossRef]
- Int Panis, L.; de Geus, B.; Vandenbulcke, G.; Willems, H.; Degraeuwe, B.; Bleux, N.; Mishra, V.; Thomas, I.; Meeusen, R. Exposure to particulate matter in traffic: A comparison of cyclists and car passengers. Atmos. Environ. 2010, 44, 2263–2270. [Google Scholar] [CrossRef]
- Jiang, Q.; Guo, X.; Wang, C.; Jia, L.; Zhao, Z.; Yang, R.; Wang, P.; Deng, Q. Polyvinylpyrrolidone-mediated Co3O4 microspheres assembled in size-tunable submicron spheres with porous core-shell structure for high-performance gases sensing. J. Alloys Compd. 2023, 935, 167976. [Google Scholar] [CrossRef]
- Jin, Z.; Wang, C.; Wu, L.; Liu, H.; Shi, F.; Zhao, J.; Liu, F.; Fu, K.; Wang, F.; Wang, Z.; et al. Construction of Pt/Ce-In2O3 hierarchical microspheres for superior triethylamine detection at low temperature. Colloids Surf. A 2023, 659, 130738. [Google Scholar] [CrossRef]
- Sun, B.; Shi, G.; Tang, Z.; Zhang, P.; Guo, Y.; Zhu, S.; Liu, J. Rapid gas-sensing detection of carbon disulfide by a CdS/SnS nanocomposite-based cataluminescence sensor. Chemosensors 2023, 11, 10. [Google Scholar] [CrossRef]
- Liu, M.; Xue, L.; Feng, Q.; Wang, Y.; Liu, J.; Zhang, S.; Hu, W. Facile preparation of Co3O4 hollow dodecahedron with superior peroxidase-like activity for selective detection of cholesterol. Chemosensors 2023, 11, 27. [Google Scholar] [CrossRef]
- Cui, X.; Lu, Z.; Wang, Z.; Zeng, W.; Zhou, Q. Highly sensitive SF6 decomposition byproducts sensing platform based on CuO/ZnO heterojunction nanofibers. Chemosensors 2023, 11, 58. [Google Scholar] [CrossRef]
- Torai, S.; Ueda, T.; Kamada, K.; Hyodo, T.; Shimizu, Y. Effects of addition of CuxO to porous SnO2 microspheres prepared by ultrasonic spray pyrolysis on sensing properties to volatile organic compounds. Chemosensors 2023, 11, 59. [Google Scholar] [CrossRef]
- Li, J.; Jin, Z.; Chao, Y.; Wang, A.; Wang, D.; Chen, S.; Qian, Q. Synthesis of graphene-oxide-decorated porous ZnO nanosheet composites and their gas sensing properties. Chemosensors 2023, 11, 65. [Google Scholar] [CrossRef]
- Ur Rahman, Z.; Shah, U.; Alam, A.; Shah, Z.; Shaheen, K.; Bahadar Khan, S.; Ali Khan, S. Photocatalytic degradation of cefixime using CuO-NiO nanocomposite photocatalyst. Inorg. Chem. Commun. 2023, 148, 110312. [Google Scholar] [CrossRef]
- Chen, Y.; Qin, H.; Cao, Y.; Zhang, H.; Hu, J. Acetone sensing properties and mechanism of SnO2 thick-films. Sensors 2018, 18, 3425. [Google Scholar] [CrossRef] [PubMed]
- Li, J.; Wu, J.; Yu, Y. DFT exploration of sensor performances of two-dimensional WO3 to ten small gases in terms of work function and band gap changes and I-V responses. Appl. Surf. Sci. 2021, 546, 149104. [Google Scholar] [CrossRef]
- Castello Lux, K.; Fajerwerg, K.; Hot, J.; Ringot, E.; Bertron, A.; Collière, V.; Kahn, M.L.; Loridant, S.; Coppel, Y.; Fau, P. Nano-structuration of WO3 nanoleaves by localized hydrolysis of an organometallic Zn precursor: Application to photocatalytic NO2 abatement. Nanomaterials 2022, 12, 4360. [Google Scholar] [CrossRef] [PubMed]
- Chumakova, V.; Marikutsa, A.; Platonov, V.; Khmelevsky, N.; Rumyantseva, M. Distinct roles of additives in the improved sensitivity to CO of Ag- and Pd-modified nanosized LaFeO3. Chemosensors 2023, 11, 60. [Google Scholar] [CrossRef]
- Sheng, H.; Ma, S.; Han, T.; Yun, P.; Yang, T.; Ren, J. A highly sensitivity and anti-humidity gas sensor for ethanol detection with NdFeO3 nano-coral granules. Vacuum 2022, 195, 110642. [Google Scholar] [CrossRef]
- Rajaitha, P.M.; Hajra, S.; Padhan, A.M.; Panda, S.; Sahu, M.; Kim, H.J. An electrochemical sensor based on multiferroic NdFeO3 particles modified electrode for the detection of H2O2. J. Alloys Compd. 2022, 915, 165402. [Google Scholar] [CrossRef]
- Zhang, H.; Xiao, J.; Chen, J.; Zhang, L.; Zhang, Y.; Jin, P. Au modified PrFeO3 with hollow tubular structure can be efficient sensing material for H2S detection. Front. Bioeng. Biotechnol. 2022, 10, 969870. [Google Scholar] [CrossRef]
- Cai, Z.; Park, S. A superior sensor consisting of porous, Pd nanoparticle–decorated SnO2 nanotubes for the detection of ppb-level hydrogen gas. J. Alloys Compd. 2022, 907, 164459. [Google Scholar] [CrossRef]
- Bhardwaj, R.; Hazra, A. Pd functionalized SrTiO3 hollow spheres for humidity-tolerant ethanol sensing. Sens. Actuators B 2022, 372, 132615. [Google Scholar] [CrossRef]
- Yin, Y.; Shen, Y.; Zhao, S.; Bai, J.; Qi, Y.; Han, C.; Wei, D. Effect of noble metal elements on ethanol sensing properties of ZnSnO3 nanocubes. J. Alloys Compd. 2021, 887, 161409. [Google Scholar] [CrossRef]
- Han, T.; Ma, S.; Xu, X.; Cao, P.; Liu, W.; Xu, X.; Pei, S. Electrospinning synthesis, crystal structure, and ethylene glycol sensing properties of orthorhombic SmBO3 (B. = Fe, Co) perovskites. J. Alloys Compd. 2021, 876, 160211. [Google Scholar] [CrossRef]
- Yang, T.T.; Ma, S.Y.; Cao, P.F.; Xu, X.L.; Wang, L.; Pei, S.T.; Han, T.; Xu, X.H.; Yun, P.D.; Sheng, H. Synthesis and characterization of ErFeO3 nanoparticles by a hydrothermal method for isopropanol sensing properties. Vacuum 2021, 185, 110005. [Google Scholar] [CrossRef]
- Meng, F.; Hu, J.; Liu, C.; Tan, Y.; Zhang, Y. Highly sensitive and low detection limit of acetone gas sensor based on porous YbFeO3 nanocrystallines. Chem. Phys. Lett. 2021, 780, 138925. [Google Scholar] [CrossRef]
- Aranthady, C.; Jangid, T.; Gupta, K.; Mishra, A.K.; Kaushik, S.D.; Siruguri, V.; Rao, G.M.; Shanbhag, G.V.; Sundaram, N.G. Selective SO2 detection at low concentration by Ca substituted LaFeO3 chemiresistive gas sensor: A comparative study of LaFeO3 pellet vs thin film. Sens. Actuators B 2021, 329, 129211. [Google Scholar] [CrossRef]
- Chen, Y.; Wang, D.; Qin, H.; Zhang, H.; Zhang, Z.; Zhou, G.; Gao, C.; Hu, J. CO2 sensing properties and mechanism of PrFeO3 and NdFeO3 thick film sensor. J. Rare Earth 2019, 37, 80–87. [Google Scholar] [CrossRef]
- Zhang, H.; Qin, H.; Cheng, B.; Cao, Y.; Chen, Y.; Xie, J.; Liu, W.; Gao, C.; Zhou, G.; Hu, J. Pd:LaFe0.9Mg0.1O3: Planar type acetone sensor with high sensitivity. Mater. Sci. Semicond. Process. 2019, 96, 91–98. [Google Scholar] [CrossRef]
- Zhang, P.; Qin, H.; Zhang, H.; Lv, W.; Hu, J. CO2 gas sensors based on Yb1−xCaxFeO3 nanocrystalline powders. J. Rare Earth 2017, 35, 602–609. [Google Scholar] [CrossRef]
- Zhang, H.; Xiao, J.; Wang, Y.; Zhang, L.; Zhao, G.; Yang, H.; Wang, H. A portable acetone detector based on SmFeO3 can pre-diagnose diabetes through breath analysis. J. Alloys Compd. 2022, 922, 166160. [Google Scholar] [CrossRef]
- Han, T.; Ma, S.Y.; Xu, X.L.; Xu, X.H.; Pei, S.T.; Tie, Y.; Cao, P.F.; Liu, W.W.; Wang, B.J.; Zhang, R.; et al. Rough SmFeO3 nanofibers as an optimization ethylene glycol gas sensor prepared by electrospinning. Mater. Lett. 2020, 268, 127575. [Google Scholar] [CrossRef]
- Tasaki, T.; Takase, S.; Shimizu, Y. Improvement of sensing performance of impedancemetric C2H2 sensor using SmFeO3 thin-films prepared by a polymer precursor method. Sensors 2019, 19, 773. [Google Scholar] [CrossRef] [PubMed]
- Zhang, H.; Xiao, J.; Chen, J.; Zhang, L.; Zhang, Y.; Pei, X. Pd-modified SmFeO3 with hollow tubular structure under light shows extremely high acetone gas sensitivity. Rare Met. 2023, 42, 545–557. [Google Scholar] [CrossRef]
- Han, T.; Ma, S.; Yun, P.; Sheng, H.; Xu, X.; Cao, P.; Pei, S.; Alhadi, A. Synthesis and characterization of Ho-doped SmFeO3 nanofibers with enhanced glycol sensing properties. Vacuum 2021, 191, 110378. [Google Scholar] [CrossRef]
- Zhang, H.; Qin, H.; Zhang, P.; Hu, J. High sensing properties of 3wt% Pd-doped SmFe1-xMgxO3 nanocrystalline powders to acetone vapor with ultralow concentrations under light illumination. ACS Appl. Mater. Interf. 2018, 10, 15558–15564. [Google Scholar] [CrossRef] [PubMed]
- Li, L.; Qin, H.; Zhang, L.; Hu, J. Ultrasensitive sensing performances to sub-ppb level acetone for Pd-functionalized SmFeO3 packed powder sensors. RSC Adv. 2016, 6, 6967–6974. [Google Scholar]
- Zhang, H.; Qin, H.; Zhang, P.; Chen, Y.; Hu, J. Low concentration acetone gas sensing properties of 3 wt% Pd-doped SmCoxFe1-xO3 nanocrystalline powders under UV light illumination. Sens. Actuators B 2018, 260, 33–41. [Google Scholar] [CrossRef]
- Li, K.; Chen, M.; Rong, Q.; Zhu, Z.; Liu, Q.; Zhang, J. High selectivity methanol sensor based on Co-Fe2O3/SmFeO3 p-n heterojunction composites. J. Alloys Compd. 2018, 765, 193–200. [Google Scholar] [CrossRef]
- Anajafi, Z.; Naseri, M.; Neri, G. Acetone sensing behavior of p-SmFeO3/n-ZnO nanocomposite synthesized by thermal treatment method. Sens. Actuators B 2020, 304, 127252. [Google Scholar] [CrossRef]
- Liu, H.; Cao, Y.; Liu, W.; Chen, J.; Hu, J. Gas response of SmFeO3 planar electrode sensor to volatile organic compounds gases under light illumination. Mater. Lett. 2022, 326, 133009. [Google Scholar] [CrossRef]
- Liu, H.; Miao, T.; Liu, W.; Chen, J.; Cheng, B.; Qin, H.; Hu, J. Highly sensitive acetone gas sensor based on YFeO3 planar electrode under multi-wavelength light illumination. Mater. Lett. 2023, 333, 133596. [Google Scholar] [CrossRef]
- Wang, M.; Wang, T.; Song, S.; Tan, M. Structure-controllable synthesis of multiferroic YFeO3 nanopowders and their optical and magnetic properties. Materials 2017, 10, 626. [Google Scholar] [CrossRef]
- Liu, Y.; Kuo, Y.; Liu, W.; Chou, W. Photoelectrocatalytic activity of perovskite YFeO3/carbon fiber composite electrode under visible light irradiation for organic wastewater treatment. J. Taiwan Inst. Chem. Eng. 2021, 128, 227–236. [Google Scholar] [CrossRef]
- Guo, Y.; Zhang, N.; Huang, H.; Li, Z.; Zou, Z. A novel wide-spectrum response hexagonal YFeO3 photoanode for solar water splitting. RSC Adv. 2017, 7, 18418–18420. [Google Scholar] [CrossRef]
- Zhang, R.; Chen, C.; Jin, K.; Niu, L.; Xing, H.; Luo, B. Dielectric behavior of hexagonal and orthorhombic YFeO3 prepared by modified sol-gel method. J. Electroceram. 2014, 32, 187–191. [Google Scholar] [CrossRef]
- Liu, J.; He, F.; Chen, L.; Qin, X.; Zhao, N.; Huang, Y.; Peng, Y. Novel hexagonal-YFeO3/α-Fe2O3 heterojunction composite nanowires with enhanced visible light photocatalytic activity. Mater. Lett. 2016, 165, 263–266. [Google Scholar] [CrossRef]
- Hu, Q.; Yue, B.; Yang, D.; Zhang, Z.; Wang, Y.; Liu, J. Electrochemical and magnetic properties of electrospun SmFeO3 and SmCoO3 nanofibers. J. Am. Ceram. Soc. 2022, 105, 1149–1158. [Google Scholar] [CrossRef]
- Zhang, Y.; Zou, H.; Peng, J.; Duan, Z.; Ma, M.; Xin, X.; Li, W.; Zheng, X. Enhanced humidity sensing properties of SmFeO3-modified MoS2 nanocomposites based on the synergistic effect. Sens. Actuators B 2018, 272, 459–467. [Google Scholar] [CrossRef]
- Alizadeh, A.; Shariatinia, Z. Unveiling the influence of SmFeO3-TiO2 nanocomposites as high performance photoanodes of dye-sensitized solar cells. J. Mol. Liq. 2022, 348, 118070. [Google Scholar] [CrossRef]
- Nand, M.; Tripathi, S.; Rajput, P.; Kumar, M.; Kumar, Y.; Mandal, S.K.; Urkude, R.; Gupta, M.; Dawar, A.; Ojha, S.; et al. Different polymorphs of Y doped HfO2 epitaxial thin films: Insights into structural, electronic and optical properties. J. Alloys Compd. 2022, 928, 167099. [Google Scholar] [CrossRef]
- Cao, E.; Qin, Y.; Cui, T.; Sun, L.; Hao, W.; Zhang, Y. Influence of Na doping on the magnetic properties of LaFeO3 powders and dielectric properties of LaFeO3 ceramics prepared by citric sol-gel method. Ceram. Int. 2017, 43, 7922–7928. [Google Scholar] [CrossRef]
- Hao, P.; Qu, G.; Song, P.; Yang, Z.; Wang, Q. Synthesis of Ba-doped porous LaFeO3 microspheres with perovskite structure for rapid detection of ethanol gas. Rare Met. 2021, 40, 1651–1661. [Google Scholar] [CrossRef]
- Haryadi, H.; Suprayoga, E.; Suhendi, E. An analysis of electronic properties of LaFeO3 using density functional theory with generalized gradient approximation-perdew-burke-ernzerhof method for ethanol gas sensors. Mater. Res. 2022, 25, 554. [Google Scholar] [CrossRef]
- Cao, Y.; Zhou, C.; Qin, H.; Hu, J. High-performance acetone gas sensor based on ferrite–DyFeO3. J. Mater. Sci. 2020, 55, 16300–16310. [Google Scholar] [CrossRef]
- Ma, L.; Ma, S.Y.; Shen, X.F.; Wang, T.T.; Jiang, X.H.; Chen, Q.; Qiang, Z.; Yang, H.M.; Chen, H. PrFeO3 hollow nanofibers as a highly efficient gas sensor for acetone detection. Sens. Actuators B 2018, 255, 2546–2554. [Google Scholar] [CrossRef]
- Pei, S.; Ma, S.; Xu, X.; Xu, X.; Almamoun, O. Modulated PrFeO3 by doping Sm3+ for enhanced acetone sensing properties. J. Alloys Compd. 2021, 856, 158274. [Google Scholar] [CrossRef]
- Lou, Z.; Li, Y.; Zhu, L.; Xie, W.; Niu, W.; Song, H.; Ye, Z.; Zhang, S. The crystalline/amorphous contact in Cu2O/Ta2O5 heterostructures: Increasing its sunlight-driven overall water splitting efficiency. J. Mater. Chem. A 2017, 5, 2732–2738. [Google Scholar] [CrossRef]
- Bai, S.; Tian, K.; Han, N.; Guo, J.; Luo, R.; Li, D.; Chen, A. A novel rGO-decorated ZnO/BiVO4 heterojunction for the enhancement of NO2 sensing properties. Inorg. Chem. Front. 2020, 7, 1026–1033. [Google Scholar] [CrossRef]
- Bai, S.; Tian, K.; Meng, J.C.; Zhao, Y.; Sun, J.; Zhang, K.; Feng, Y.; Luo, R.; Li, D.; Chen, A. Reduced graphene oxide decorated SnO2/BiVO4 photoanode for photoelectrochemical water splitting. J. Alloys Compd. 2021, 855, 156780. [Google Scholar] [CrossRef]


| Materials | Gas | Tem. (°C) | Con. (ppm) | Res. | Refs. |
|---|---|---|---|---|---|
| NdFeO3 | ethanol | 250 | 100 | 150 | [16] |
| La0.98Ba0.02FeO3 | ethanol | 200 | 100 | 79.3 | [51] |
| Au-LaFeO3 | ethanol | 200 | 100 | 44 | [52] |
| SmFeO3 | acetone | 210 | 1 | 5.92 | [29] |
| Pd-SmFeO3 | acetone | 220 | 1 | 10.73 | [32] |
| SmFeO3/ZnO | acetone | 350 | 10 | 45 | [38] |
| YFeO3 | acetone | 110 | 30 | 128.1 | [40] |
| DyFeO3 | acetone | 190 | 2 | 3.81 | [53] |
| PrFeO3 | acetone | 180 | 10 | 6 | [54] |
| Sm-PrFeO3 | acetone | 270 | 50 | 44.94 | [55] |
| Co-Fe2O3/SmFeO3 | methanol | 155 | 5 | 19.7 | [37] |
| SmFeO3 | methanol | 120 | 30 | 26.41 | [39] |
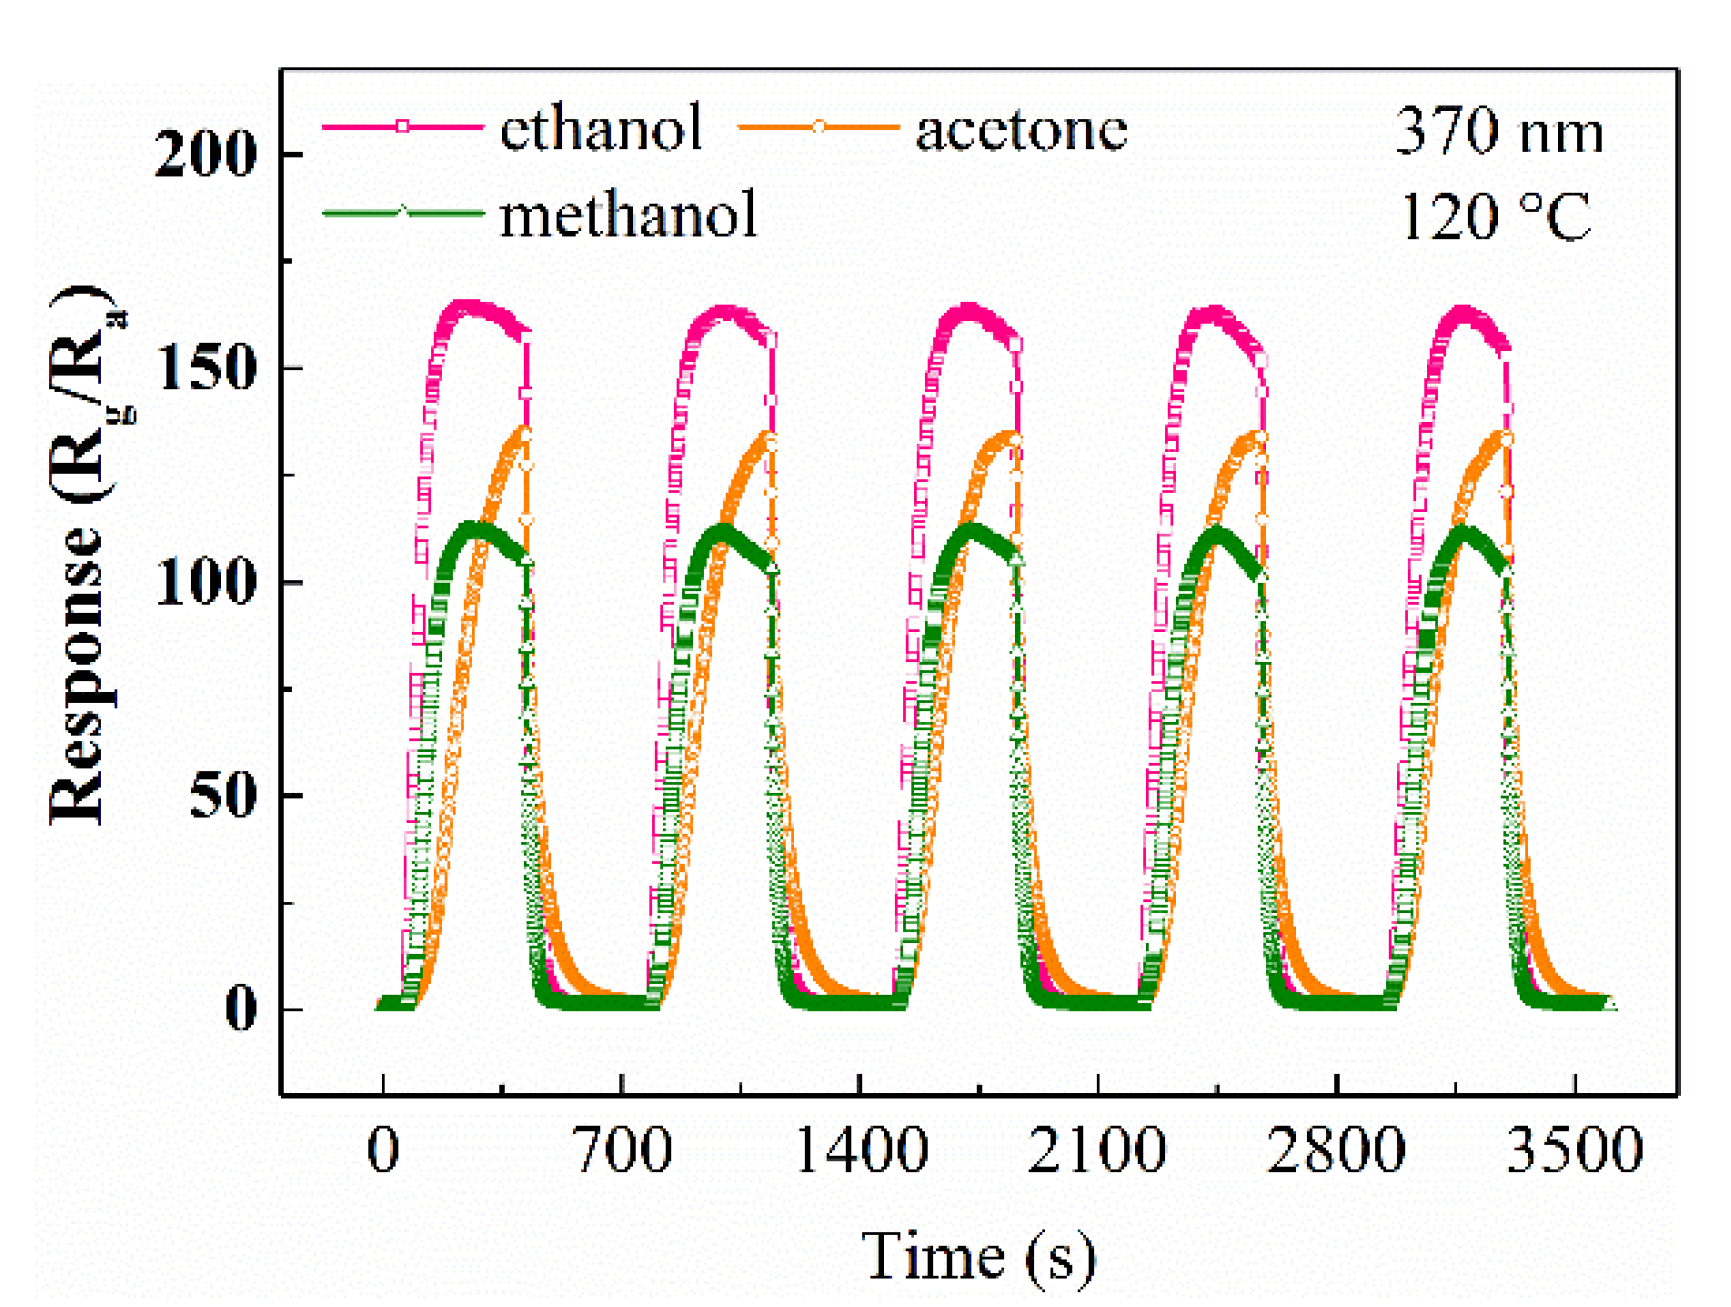
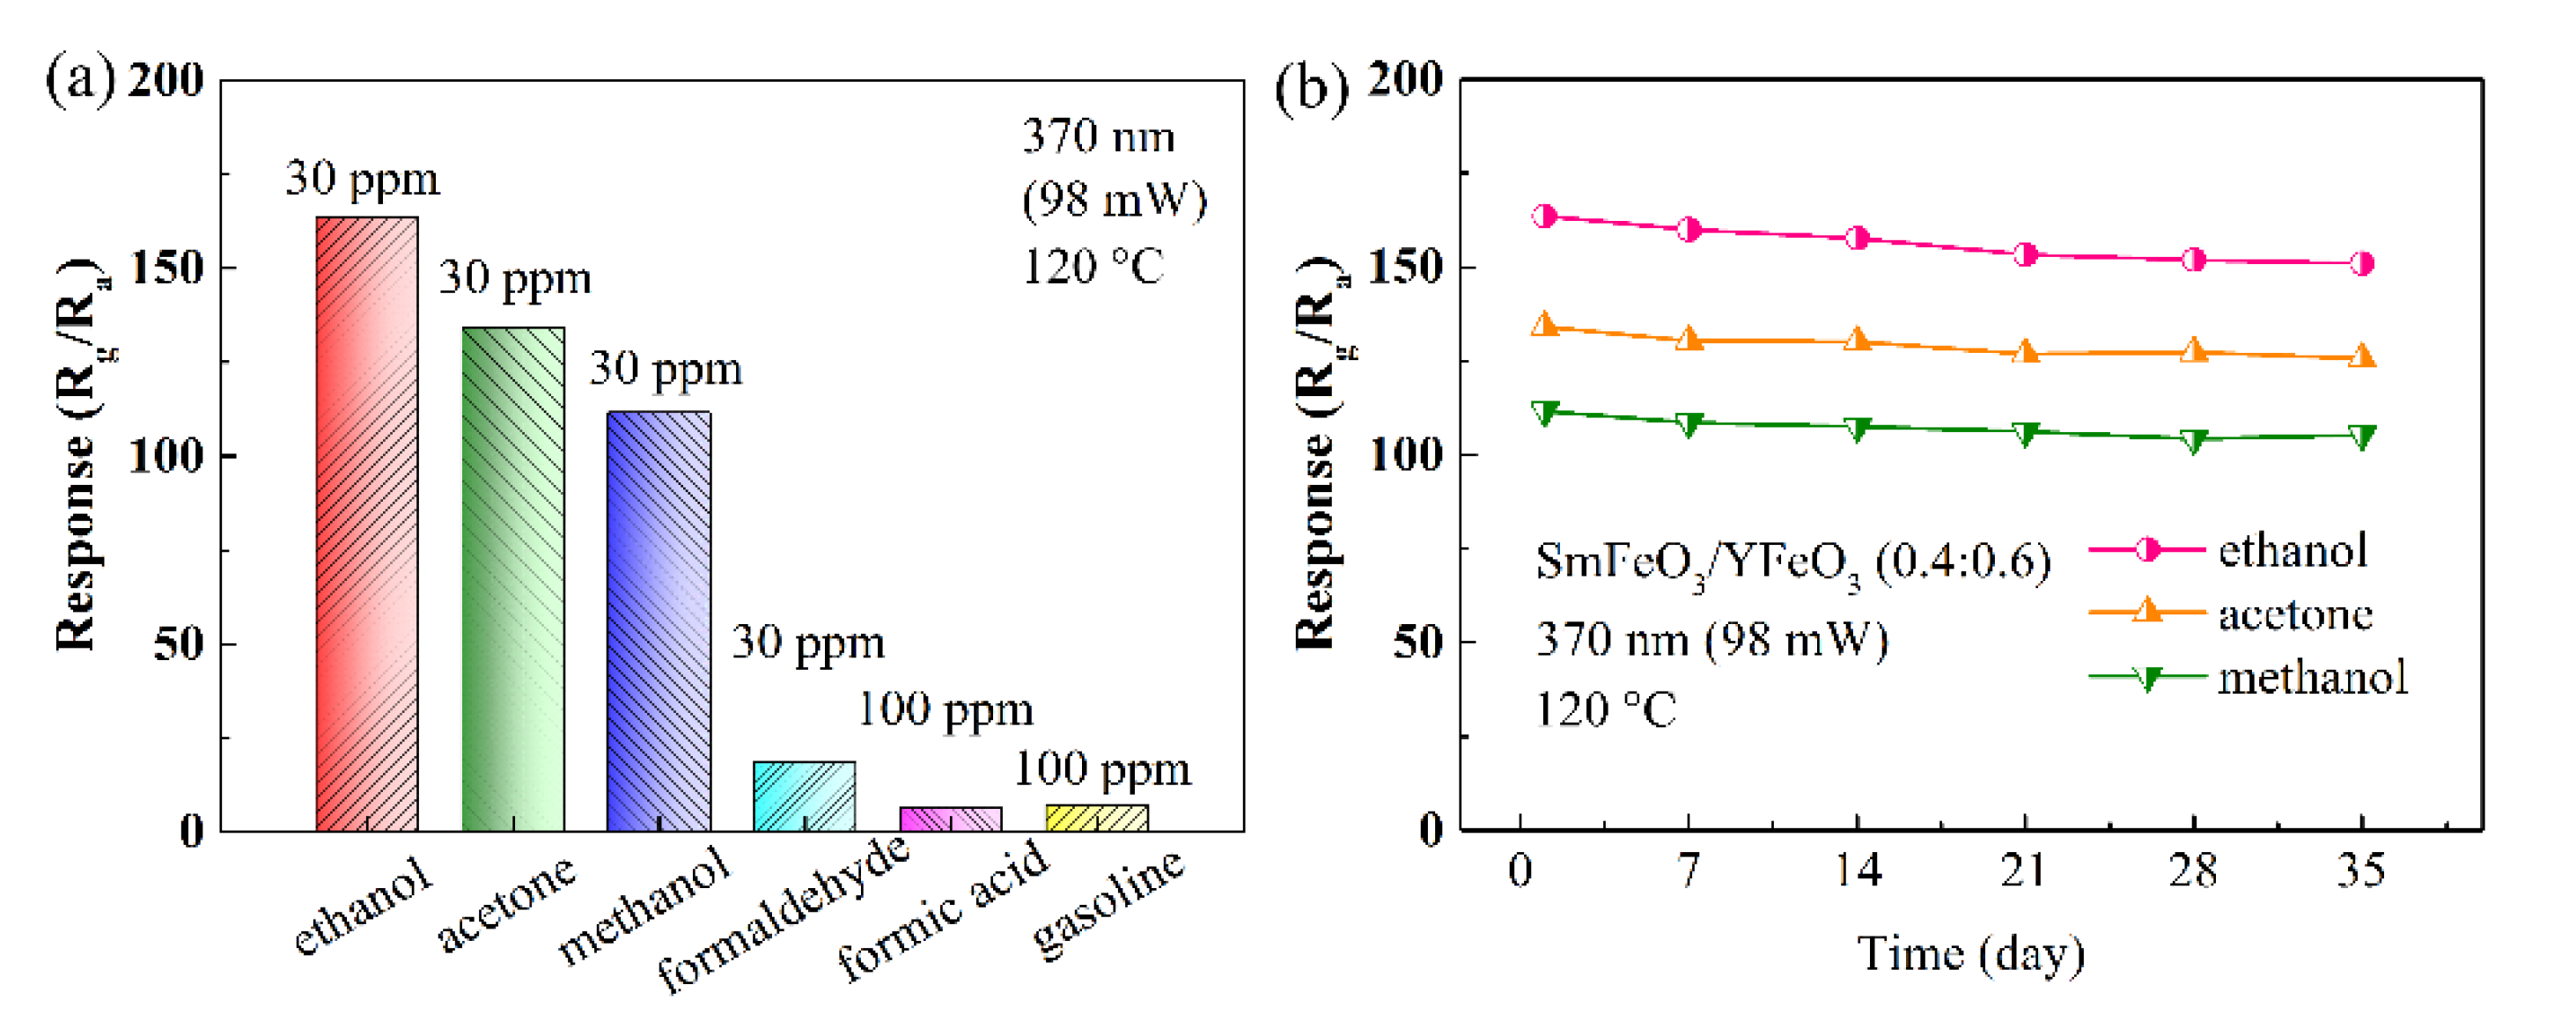
| SmFeO3/YFeO3 | ethanol | 120 | 30 | 163.593 | this work |
| SmFeO3/YFeO3 | acetone | 120 | 30 | 134.023 | this work |
| SmFeO3/YFeO3 | methanol | 120 | 30 | 111.637 | this work |
Disclaimer/Publisher’s Note: The statements, opinions and data contained in all publications are solely those of the individual author(s) and contributor(s) and not of MDPI and/or the editor(s). MDPI and/or the editor(s) disclaim responsibility for any injury to people or property resulting from any ideas, methods, instructions or products referred to in the content. |
© 2023 by the authors. Licensee MDPI, Basel, Switzerland. This article is an open access article distributed under the terms and conditions of the Creative Commons Attribution (CC BY) license (https://creativecommons.org/licenses/by/4.0/).
Share and Cite
Liu, H.; Zhu, D.; Miao, T.; Liu, W.; Chen, J.; Cheng, B.; Qin, H.; Hu, J. Highly Sensitive p-SmFeO3/p-YFeO3 Planar-Electrode Sensor for Detection of Volatile Organic Compounds. Chemosensors 2023, 11, 187. https://doi.org/10.3390/chemosensors11030187
Liu H, Zhu D, Miao T, Liu W, Chen J, Cheng B, Qin H, Hu J. Highly Sensitive p-SmFeO3/p-YFeO3 Planar-Electrode Sensor for Detection of Volatile Organic Compounds. Chemosensors. 2023; 11(3):187. https://doi.org/10.3390/chemosensors11030187
Chicago/Turabian StyleLiu, Huiyang, Denghui Zhu, Tingting Miao, Weikang Liu, Juan Chen, Bin Cheng, Hongwei Qin, and Jifan Hu. 2023. "Highly Sensitive p-SmFeO3/p-YFeO3 Planar-Electrode Sensor for Detection of Volatile Organic Compounds" Chemosensors 11, no. 3: 187. https://doi.org/10.3390/chemosensors11030187
APA StyleLiu, H., Zhu, D., Miao, T., Liu, W., Chen, J., Cheng, B., Qin, H., & Hu, J. (2023). Highly Sensitive p-SmFeO3/p-YFeO3 Planar-Electrode Sensor for Detection of Volatile Organic Compounds. Chemosensors, 11(3), 187. https://doi.org/10.3390/chemosensors11030187