Abstract
The time involved and the high economic cost of using oak barrels to age wines have led to a significant price difference compared to non-oak barrel aged wines and may lead to some fraudulent sales in the market. In this study, an untargeted metabolomic strategy was developed to detect the metabolite composition of oak barrel aged and non-oak barrel aged wines in both positive and negative ion modes by using UHPLC–HRMS combined with the recently developed chemometric method AntDAS. The results of partial least squares discrimination analysis (PLS-DA) showed that the samples were characterized into two categories. Finally, 51 compounds were identified in positive ion mode, while 26 compounds were identified in negative ion mode. The results indicate that combining UHPLC–HRMS with AntDAS can reveal the material basis of wines and has excellent potential to differentiate between oak barrel aged and non-oak barrel aged wines.
1. Introduction
Wine is a popular alcoholic beverage that has been consumed for hundreds of years [1]. Wine constitutes a reliable and rich source of biologically active phytochemicals, specifically phenolic acids and polyphenols, whose individual and summated actions are believed to provide health benefits [2]. In addition, wine is widely consumed by the public for its pleasant organoleptic properties. According to the literature [3], the organoleptic characteristics of wine, such as smell, taste, and color, largely depend on the wine-making and aging techniques used. The aging of wine is a process widely used in oenology to provide added value to the wine [4]. During the production process, wine-making methods, such as maceration, fermentation, clarification, and aging, can significantly alter the composition and concentration of compounds [5] and substantially enhance the complexity of wine by combining these compounds with important aging characteristic volatiles [6]; this, in turn, affects the wine’s composition and sensory characteristics. During ageing processes wine penetrates oak wood, Maximum sorption capacity depends principally on wood type [7]. Because of the time involved (6 to 18 months in barrels) and the high economic cost [8], the price difference between commercially available oak barrel aged wines and non-oak barrel aged wines is significant, leading to several consumer detriments and fraudulent sales. Therefore, there is a great need to establish a scientific and effective method to distinguish between oak barrel aged and non-oak barrel aged wines. This would not only provide protection for consumers but also provide solid theoretical support for the Chinese wine industry and government supervision.
Nowadays, the emergence of analytical instruments with high separation efficiency, high resolution, and excellent sensitivity coupled with advanced chemometric techniques provides new research perspectives and approaches for analyzing wines and assessing their authenticity. For example, Arapitsas et al. used an untargeted LC–MS method to identify several metabolite markers, including ascorbic acid and tartaric acid, as well as the first identified sulfonated compounds [9]. Gil et al. used ultra-performance liquid chromatography coupled with quadrupole/time of flight mass spectrometry (UPLC–QTOF-MS) to obtain high-resolution mass spectrometric metabolomic fingerprints of rosé wines and then applied a statistical analysis to investigate the discrimination of rosé wines by origin [10]. Ontañón et al. used non-targeted liquid chromatography–mass spectrometry (LC–MS) to analyze the metabolomic space introduced by wine storage under different conditions. Credible markers that may reveal major chemical changes related to storage conditions were also found [11]. In addition to the above studies, other researchers endeavored to explore the organoleptic properties of aged wines, such as Laureati et al., who used gas chromatography–mass spectrometry (GC–MS), gas chromatography–flame ionization detection (GC–FID), and sensory analysis by a wine tasting panel to evaluate the organoleptic characteristics of wines aged for extended periods (up to 15 years) [12].
As a general overview, the existing studies all describe the application of wine-based metabolomics in the discovery of novel compounds, characterization and identification of wine groups [13], prediction of sensory attributes [14], monitoring of storage and aging processes [15,16], and traceability to their varietal and geographical origin [17,18]. It is important to note that little attention has been paid to the effects of the wine barrel aging process on the specific distribution of compounds and the exploration of characteristic compounds between oak barrel aged and non-oak barrel aged wines. Consequently, it is necessary to establish a scientific and effective method to explore the characteristic compounds to distinguish oak barrel aged and non-oak barrel aged wines.
An untargeted metabolomic analysis based on UHPLC–HRMS combined with chemometrics was chosen for this study to detect the metabolite composition of oak barrel aged and non-oak barrel aged wines. This approach aims to compare the metabolite patterns of wines before and after aging to distinguish oak barrel aged wines from non-oak barrel aged wines. The metabolite features were effectively extracted with the automatic target-free data analysis strategy (AntDAS) [19], developed by Yu Yongjie’s research group, to reveal the differences between the metabolites of the two species. In addition, to better exploit the potential of the data, clustering and discriminant analysis were performed using methods including principal component analysis (PCA) and partial least squares discriminant analysis (PLS-DA). The differences in the chemical basis of oak barrel aged and non-oak barrel aged wines were explored and evaluated.
2. Materials and Methods
2.1. Samples and Chemicals
In this study, 66 wine samples from the wine produced in the eastern foothills of Helan Mountain, Ningxia, China, were collected in 2022, including both oak barrel aged (n = 12) and non-oak barrel aged (n = 54) wines. The samples were stored in a refrigerator at −18 °C and protected from light until further use. In addition, the chemical reagents used in this study included HPLC-grade methanol obtained from J.T. Baker, Avantor (Radnor, PA, USA), and HPLC-grade formic acid from Aladdin (Shanghai, China). The LC–MS-grade ammonium acetate that was used as a mobile phase additive was purchased from Fisher Chemical (Waltham, MA, USA). The distilled water was obtained from Watson’s Food & Beverage (Guangzhou, China).
2.2. Sample Preparation
Prior to analysis, the wine samples were removed from the −18 °C refrigerator and thawed. A total of 1.5 mL of wine was placed in a 2 mL centrifuge tube, which was centrifuged at 13,000 r/min for 10 min followed by transferring 1 mL of the supernatant to a chromatography vial for subsequent UHPLC–HRMS analysis. Furthermore, quality control (QC) samples were prepared by mixing all wine samples to be measured in equal volumes under the same conditions to investigate the stability of the method.
2.3. UHPLC–QTOF-MS Analysis
For the untargeted analysis of the wine, an UltiMate 3000 ultra-high-performance liquid chromatograph coupled with a Q Exactive-Orbitrap Mass Spectrometer (Thermo Fisher Scientific, Waltham, MA, USA) was used. The chromatographic separation was performed using an Agilent ZORBAX SB-C18 column (2.1 × 100 mm, 1.8 μm) (Agilent, Santa Clara, CA, USA) with the column temperature set at 40 °C. The mobile phase consisted of 0.1% formic acid in water (solvent A) and 0.1% formic acid in acetonitrile (solvent B). The flow rate was set to 0.2 mL/min, and the gradient elution procedure was as follows: 0–1.00 min, 5–8% B; 1.00–7.00 min, 8–12% B; 7.00–13.00 min, 12–20% B; 13.00–20.00 min, 20–35% B; 20.00–24.00 min, 35–55% B; 24.00–25.00 min, 55–97% B; 25.00–30.00 min, 97–100% B; 30.00–35.00 min, 100–100% B; 35.00–35.50 min, 100–5% B. Sequential sampling analysis was performed with an injection volume of 2μL, and QC was added once for every 10 samples.
Mass spectrometry was performed using an electrospray ionization source (ESI) in positive and negative ion modes. Full scan and data-dependent MS/MS acquisition modes (FULLMS/ddMS2) were selected for the data collection. The optimal source parameters were optimized as follows: For the parameter setting of MS1, the capillary temperature was set to 320 °C; the spray voltage was 3.5 kV; the resolution was 35,000; the AGC target was 5 × 10⁶; and the maximum IT was set to 100 ms for scanning in the range of 120~1000 Da. The auxiliary gas and sheath gas flow rates were 10 and 30 arcs, respectively. The optimized parameters of dd-MS2 were as follows: collision energy 20 eV; resolution 17,500; and AGC target 5× 10⁶, where the minimum AGC target was 5 × 10³ with an intensity threshold 2 × 10⁵ and dynamic exclusion 4.5 s. Unlike MS1, the maximum IT of dd-MS2 was set to 25 ms. The isolation window was set to 0.4 Da.
2.4. Data Analysis
Data processing and analysis were performed with AntDAS, a data processing software. It can directly analyze the raw data collected by the instrument, including extract ion chromatograpy (EIC) automatic peak construction, EIC peak extraction, peak labeling, sample time shift correction, etc. [20]. After data processing, a list of compound information with sample × peak area was obtained. Analysis of variance (ANOVA) was used to screen for differential components and their MS/MS spectra. Principal component analysis (PCA), partial least squares discriminant analysis (PLS-DA), and heat map analysis were performed on the screened differential components to evaluate the differences in chemical basis between the oak barrel aged and non-oak barrel aged wines. Additionally, AntDAS completed the metabolite identification by matching the compound mass spectra to third-party databases (http://prime.psc.riken.jp/compms/msdial/main.html (accessed on 25 February 2023).
3. Results and Discussion
3.1. UHPLC–HRMS Untargeted Metabolomic Analysis of Oak Barrel Aged and Non-Oak Barrel Aged Wines
The total ion chromatograms (TICs) collected in the positive and negative ionization modes are shown in Figure 1. The TIC peaks in both modes are basically well-separated throughout the outflow section. It is also noteworthy that there is a significant difference between the two TICs. Overall, the number of peaks collected in the positive ion mode (39,104) is more abundant than in the negative ion mode (31,944). However, extra consideration needs to be given to the fact that some metabolites may lead to ionization in only one ionization mode due to their unique chemical properties. If only one ionization mode is used for data acquisition, a number of key metabolites may be neglected. Given these considerations, both positive and negative ionization modes were used for the data analysis and screening of the metabolic markers in this study.
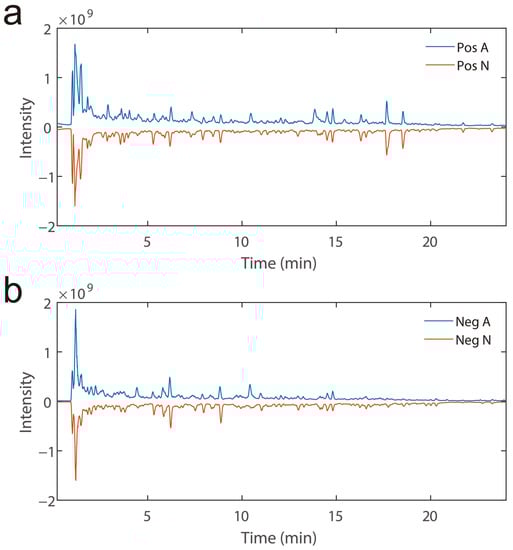
Figure 1.
(a) Comparison of the total ion chromatograms in the positive (Pos) for oak barrel aged (A) and non-oak barrel aged (N) wine samples. (b) Comparison of the total ion chromatograms in the negative (Neg) for oak barrel aged (A) and non-oak barrel aged (N) wine samples.
To obtain the data matrix, including retention time (RT), m/z, and peak intensity for each sample, the collected raw data were imported into the AntDAS [21] data automation parsing software for data analysis. A list of compound information of 39,104 × 74 was obtained in the positive ionization mode, where 39,104 is the number of EIC peaks and 74 is the number of samples (containing sixty-six samples and eight QCs). For the same samples collected in the negative ionization mode, a data matrix of 31,944 × 74 was obtained. In order to demonstrate the potential of AntDAS peak extraction, [M+H]+ and [M−H]− peaks were extracted from the compounds with an accurate molecular weight of 304.0583. The results are shown in Figure 2a, b. Figure 2a shows the extraction of the m/z 305.0655 peaks under positive ions from which it is clear that 21 EIC peaks were well extracted. Another peak extraction at m/z 303.0560 under negative ions is shown in Figure 2b, where 15 EIC peaks were extracted. On the whole, most of the EIC peaks basically achieved baseline separation. As shown in the local magnification of the peak extraction results in Figure 2a, b, AntDAS demonstrates the ability to achieve a more reasonable segmentation of the overlapping signals of the compounds in both positive and negative ion modes. On this basis, it can accurately identify the EIC peaks of the compounds from the background noise of the instrument and accurately estimate the outflow range of the compounds.
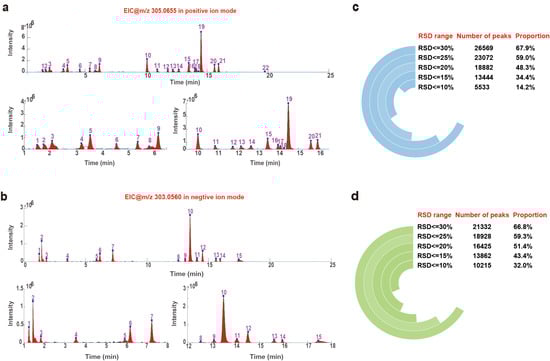
Figure 2.
(a) EIC extraction and detail diagram example in the positive ion mode. (b) EIC extraction and detail diagram example in the negative ion mode. The data quality assessment diagram in the ESI+ mode (c) and the ESI− mode (d).
To examine the reproducibility and stability of the instrument, the data quality of the QC samples was evaluated. The data quality was assessed by calculating the relative standard deviation (RSD) of each EIC peak area of the QC samples with the positive and negative ion pattern results shown in Figure 2c,d. From the figure, it can be determined that the number of peaks with a RSD ≤ 30% in the positive ion mode is 26,569, accounting for 67.9% of the total number of peaks, compared to 21,332 peaks with a RSD ≤ 30% in the negative ion mode, accounting for 66.8% of the total number of peaks. The number of peaks with a RSD ≤ 20% in the positive ion mode was 18,882, accounting for 48.3% of the total number of peaks, while the number of peaks in this range in the negative ion mode was 16,425, accounting for 51.4% of the total number of peaks. At the level of RSD ≤ 10%, the number of peaks in the negative ion mode still exceeded 32% of the total number of peaks. The data given in the above figures indicate that the method is stationary during this batch injection process, and the quality of the acquired data is reliable for subsequent metabolomics research.
3.2. Chemometric Analysis of High-Throughput Metabolomic Data
To explore the large amount of information implied in the already established data matrix, this study used a rational mathematical and statistical approach to transform the chemical model into a mathematical model in order to permit the maximum collection and extraction of useful information [22]. In this study, the EIC peaks of the registered compounds were screened and analyzed using ANOVA at a p-value of 0.05. Approximately 774 EIC peaks that differed between the groups were screened in the positive ion mode, while 766 differential compounds were screened in the negative ion mode. Based on the differential compounds screened above, the principal component analysis (PCA), which is the unsupervised pattern recognition method [23], was first used in this study to investigate the chemical differences between the oak barrel aged and non-oak barrel aged wines. The PCA plots for the positive and negative ionization pattern data are shown in Figure 3a, b. As can be observed from the figure, the first two principal components (PCs), which are used to explain the matrix information, account for only 36.3% in the ESI+ mode (Figure 3a) and 36.7% in the ESI− mode (Figure 3b). The samples of oak barrel aged wine are not well distinguished from the samples of non-oak barrel aged wine. The data indicate that, according to the unsupervised PCA analysis, no distinction can be made between the oak barrel aged and non-oak barrel aged wines in both the positive and negative ion modes. The analytical results might be due to the large sample difference within the same group, and the difference between the different groups was difficult to find using the unsupervised analysis method.
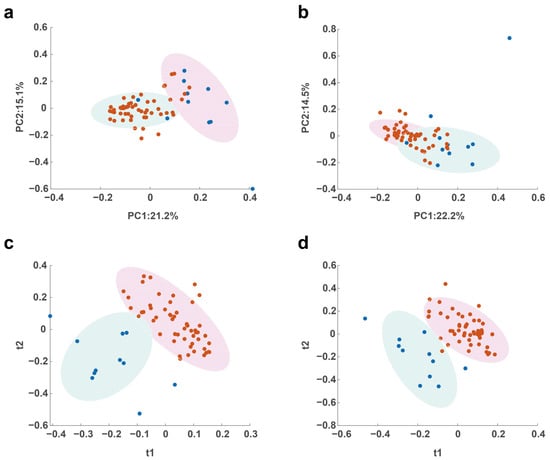
Figure 3.
Multivariate analysis of metabolomics distinguishes the oak barrel aged and non-oak barrel aged wines: (a) The PCA score plot in the positive ion mode; (b) the PCA score plot in the negative ion mode; (c) the PLS-DA score plot in the positive ion mode; (d) the PLS-DA score plot in the negative ion mode.
In view of this, to solve the problems encountered in the unsupervised analysis and observe the overall clustering effect and classification trend of the data matrix, a widely used supervised pattern recognition method, PLS-DA [24], was adopted. The cluster analysis plots obtained with PLS-DA are shown in Figure 3c, d. Initially, in the positive ionization mode, Figure 3c presents a well-clustered effect and a trend of better classification between the oak barrel aged and non-oak barrel aged wine samples. The clustering effect in the negative ionization mode shown in Figure 3d is quite similar to that in Figure 3c. As can be observed, some of the non-oak barrel aged wine samples overlap with the oak barrel aged wine samples. A preliminary judgment was made that the overlapped samples were commercially available adulterated oak barrel aged wines. Overall, there was a better classification trend between the oak barrel aged and non-oak barrel aged wine samples by using PLS-DA compared to PCA. The Monte Carlo simulation method was used to further verify the applicability of PLS-DA. The simulation was performed approximately 10,000 times and, for each simulation, 80% of the samples in a group were selected for building the PLS-DA model to predict the remaining 20% of the samples. Finally, the average prediction accuracies for the positive and negative ion modes were 86.3 ± 7.0% and 84.6 ± 7.5%, respectively. These results indicate that PLS-DA can be used for the classification of oak barrel aged and non-oak barrel aged wines.
3.3. Identification and Analysis of Candidate Metabolites
The compound identification was performed with AntDAS as well. An advantage of AntDAS is that it can identify the insource fragment ions and give detailed information on the MS1 and MS/MS spectra for compound identification [25]. Taking L-tryptophan as an example, the identification process of the compound based on the AntDAS platform is shown in Figure 4. The MS1 spectrum of the compound constructed with AntDAS is shown in Figure 4a, whose spectrum consists mainly of fragment ions formed by cleavage within the source of the compound at m/z 205.0973. From the MS/MS spectrum in Figure 4a, it is observed that the ions form mainly fragment ions with m/z 118.0657, m/z 146.0603, and m/z 188.0710 after the ion break, which is consistent with the ions in MS1 in Figure 4a. Both primary and secondary matches of this compound are above 0.95. Overall, these results indicate that AntDAS can construct accurate MS1 and MS/MS spectra of compounds from complex data. For data visualization, Figure 4b shows the EIC plots corresponding to each fragment ion with highly consistent shapes of the outflow curves in the plots. Identifying the compound using the MS1 and MS/MS spectra constructed with AntDAS gives the best match for the compound. The final identification result of the compound is presented in Figure 4c. Following the above compound identification process, 51 compounds were identified in the positive ion mode (as shown in Table 1), and 26 compounds were identified in the negative ion mode (as shown in Table 2).
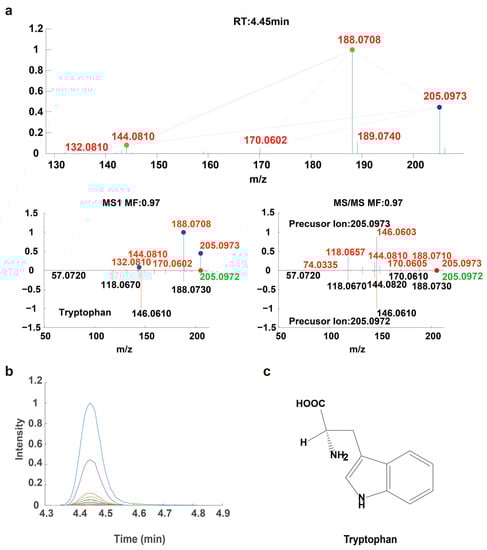
Figure 4.
Example of the compound identification process with AntDAS. (a) The MS1 and MS/MS spectra of the compounds with m/z of 205.0973 were constructed with AntDAS. (b) The EIC plot corresponding to each fragment ion. (c) The final identification result of the compound.

Table 1.
The results of the compounds identified with MS1 and MS/MS constructed with AntDAS in the positive ion mode.
Table 2.
The results of the compounds identified with MS1 and MS/MS constructed with AntDAS in the negative ion mode.
A heat map was drawn for the identified compounds to further explore the variation patterns of the compounds between the two wines. Figure 5 shows the heat map visualization of the metabolites identified in the positive and negative ion modes for 66 wine samples. The heat maps show the compounds in the vertical direction and the wine samples in the horizontal direction. Additionally, the red color represents the compounds with a relative content above the average, and the green color represents the compounds with a relative content below the average. The heat map in the positive ion mode is shown in Figure 5a. The result that can be drawn from the graph is that the heat map analysis does not classify the samples into different categories. In other words, the metabolite profiles identified do not allow a clear distinction between oak barrel aged and non-oak barrel aged wines. This may be due to the limited potential of the compound database during the identification process, which led to differential metabolites not being identified through the compound database.
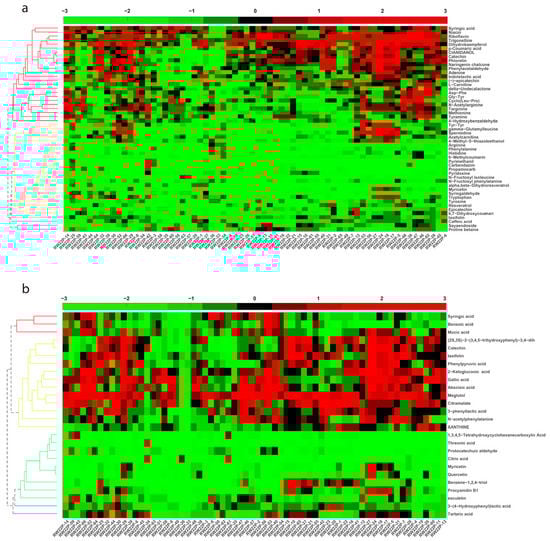
Figure 5.
Heatmap visualization of the identified metabolites in 66 wine samples for the ESI+ mode (a) and ESI− mode (b).
For an in-depth exploration of how these metabolites behave in the two wine samples, the relative amounts of the compounds in each group of wine samples are shown as violin plots in Figure 6 for a comparative analysis. In this study, the main chemical components in the wines were flavonoids, phenolic acids, etc. Therefore, the discussion of the compound content distribution in this section will focus on these compounds. In Figure 6a, four compounds, including two flavonoids (catechin, epicatechin) and two phenolic compounds (caffeic acid, p-coumaric acid), were demonstrated in the positive ion mode. From the information presented in the figure, it is possible to obtain a higher content of flavonoid compounds in oak barrel aged wines even if they did not show a significant difference between the two groups. In previous studies [26], compounds such as catechin and epicatechin decreased in content after aging compared to the initial wines. Such differences may be caused by the characteristics of the oak barrels as well as other parameters such as grape varieties [27]. Alternatively, the graph shows that the levels of coumaric and caffeic acids are low in non-oak barrel aged wines and high in oak barrel aged wines. Studies suggest [28] that this may be due to an increase in coumaric and/or caffeic acids as a result of the contact between the wine and the wood (which may contain p-coumaric and/or caffeic acids) during the aging process in oak barrels. Other studies have explained that the loss of coumarin-based anthocyanins during aging can also increase p-coumaric acid content [29].
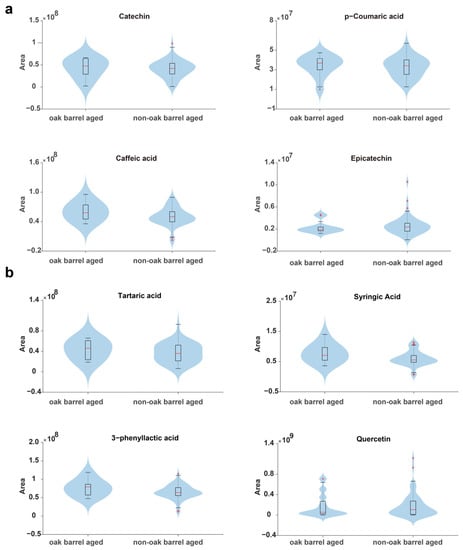
Figure 6.
Violin plots of the relative contents of each compound in the wine samples for the ESI+ mode (a) and ESI− mode (b).
The analysis of the four compounds in the negative ion mode is presented in Figure 6b. As can be observed, the levels of 3-phenylactic acid and tartaric acid were higher in the oak barrel aged wine samples than in the non-oak barrel aged wine samples. It is also interesting to note that the level of quercetin was lower in the oak barrel aged wine samples than in the non-oak barrel aged wine samples. According to the literature research [30], oxidation and condensation reactions involving sapogenins and glycoside derivatives could explain the reduction in myricetin and quercetin. Furthermore, the higher content of syringic acid in the oak barrel aged wines is consistent with the results reported by Cadahía et al. [26]. This is because compounds such as gallic acid and its dimers, ellagic acid and other benzoic acids (syringic and vanillic), may be present in oak, and they can be transferred to the wine during aging.
4. Conclusions
A combination of AntDAS and UHPLC–HRMS was used to identify metabolites in wine samples. A total of 51 compounds were identified in the positive ion mode, including eleven amino acids, nine flavonoids, four phenolic acids, and individual compounds including alkaloids and coumarins, while 26 compounds were identified in the negative ion mode, including two amino acids, eight organic acids, four flavonoids, and other compounds. In addition, the unsupervised pattern recognition method PCA and supervised pattern recognition method PLS-DA were used for the clustering analysis of oak barrel aged and non-oak barrel aged wines, and from the results, it is observed that PLS-DA can achieve good clustering and differentiation performance. The application of UHPLC–HRMS in food metabolomics for identification and other purposes is a promising approach.
Author Contributions
Conceptualization, Y.L. and Y.-J.Y.; methodology, Y.Z.; software, Y.-J.Y.; validation, Y.-J.Y., Y.L. and F.-L.M.; formal analysis, Q.G.; investigation, J.-N.W.; resources, Y.Z.; data curation, Y.J. and Q.G.; writing—original draft preparation, F.-L.M. and Y.L.; writing—review and editing, Y.-J.Y. and Y.Z.; visualization, F.-L.M. and J.-N.W.; supervision, Y.J. and Q.G.; project administration, Y.L. and Y.-J.Y.; funding acquisition, Y.L. and Y.-J.Y. All authors have read and agreed to the published version of the manuscript.
Funding
The authors gratefully acknowledge the financial support of the Foundation of the National Natural Science Foundation of China (Grant Number: 21868028), the Key Research and Development Project of Ningxia (Grant Number: 2020BEG03039, 2022BEG03170), research projects of Ningxia Administration for Market Regulation (Grant Number: 2022SJKY0001, 2022SJKY0002, 2022SJKY0003).
Institutional Review Board Statement
Not applicable.
Informed Consent Statement
Not applicable.
Data Availability Statement
Not applicable.
Conflicts of Interest
The authors declare no conflict of interest.
References
- Castaldo, L.; Narváez, A.; Izzo, L.; Graziani, G.; Gaspari, A.; Minno, G.D.; Ritieni, A. Red wine consumption and cardiovascular health. Molecules 2019, 24, 3626. [Google Scholar] [CrossRef]
- German, J.B.; Walzem, R.L. The health benefits of wine. Annu. Rev. Nutr. 2000, 20, 561–593. [Google Scholar] [CrossRef] [PubMed]
- Li, S.Y.; Duan, C.Q. Astringency, bitterness and color changes in dry red wines before and during oak barrel aging: An updated phenolic perspective review. Crit. Rev. Food Sci. 2019, 59, 1840–1867. [Google Scholar] [CrossRef] [PubMed]
- Teresa Garde-Cerdán; Carmen Ancín-Azpilicueta. Review of quality factors on wine ageing in oak barrels. Trends Food Sci. Tech. 2006, 17, 438–447. [Google Scholar] [CrossRef]
- Casassa, L.F.; Harbertson, J.F. Extraction, evolution, and sensory impact of phenolic compounds during red wine maceration. Annu. Rev. Food. Sci. Technol. 2014, 5, 83–109. [Google Scholar] [CrossRef]
- Xu, Q.; Fang, Y.J.; Jian, C.; Ying, S.; Chang, Q.D.; Yi, B.L. Characterization and evolution of volatile compounds of cabernet sauvignon wines from two different clones during oak barrel aging. Foods 2022, 11, 74. [Google Scholar]
- Coelho, E.; Domingues, L.; Teixeira, J.A.; Oliveira, J.M.; Tavares, T. Understanding wine sorption by oak wood: Modeling of wine uptake and characterization of volatile compounds retention. Food Res. Int. 2019, 116, 249–257. [Google Scholar] [CrossRef] [PubMed]
- Carpena, M.; Pereira, A.G.; Prieto, M.A.; Simal-Gandara, J. Wine aging technology: Fundamental role of wood barrels. Foods 2020, 9, 1160. [Google Scholar] [CrossRef]
- Arapitsas, P.; Ugliano, M.; Perenzoni, D.; Angeli, A.; Pangrazzi, P.; Mattivi, F. Wine metabolomics reveals new sulfonated products in bottled white wines, promoted by small amounts of oxygen. J. Chromatogr. A 2016, 1429, 155–165. [Google Scholar] [CrossRef]
- Gil, M.; Reynes, C.; Cazals, G.; Enjalbal, C.; Sabatier, R.; Saucier, C. Discrimination of rosé wines using shotgun metabolomics with a genetic algorithm and MS ion intensity ratios. Sci. Rep. 2020, 10, 1170. [Google Scholar] [CrossRef]
- Ontañón, I.; Sánchez, D.; Sáez, V.; Mattivi, F.; Ferreira, V.; Arapitsas, P. Liquid chromatography-mass spectrometry-based metabolomics for understanding the compositional changes induced by oxidative or anoxic storage of red wines. J. Agr. Food Chem. 2020, 68, 13367–13379. [Google Scholar] [CrossRef] [PubMed]
- Laureati, M.; Cattaneo, C.; Tateo, F.; Bononi, M. Identification of the volatile compounds and sensory attributes of long-term aging Vin Santo Wine from Malvasia di Candia aromatic grapes. Foods 2020, 9, 1736. [Google Scholar] [CrossRef] [PubMed]
- Wei, Z.; Liu, X.H.; Huang, Y.; Lu, J.; Zhang, Y.L. Volatile aroma compounds in wines from Chinese wild/hybrid species. J. Food Biochem. 2018, 43, 12684. [Google Scholar] [CrossRef] [PubMed]
- Chen, L.; Darriet, P. Strategies for the identification and sensory evaluation of volatile constituents in wine. Compr. Rev. Food Sci. Saf. 2021, 20, 4549–4583. [Google Scholar] [CrossRef] [PubMed]
- Arena, E.; Rizzo, V.; Licciardello, F.; Fallico, B.; Muratore, G. Effects of light exposure, bottle colour and storage temperature on the quality of Malvasia delle Lipari sweet wine. Foods 2021, 10, 1881. [Google Scholar] [CrossRef]
- Yuan, J.F.; Lai, Y.T.; Chen, Z.Y.; Song, H.X.; Zhang, J.; Wang, D.H.; Gong, M.G.; Sun, J.R. Microwave irradiation: Effects on the change of colour characteristics and main phenolic compounds of Cabernet Gernischt dry Red Wine during storage. Foods 2022, 11, 1778. [Google Scholar] [CrossRef]
- Phan, Q.; Tomasino, E. Untargeted lipidomic approach in studying pinot noir wine lipids and predicting wine origin. Food Chem. 2021, 355, 129409. [Google Scholar] [CrossRef]
- Onzo, A.; Acquavia, M.A.; Pascale, R.; Iannece, P.; Gaeta, C.; Lelario, F.; Ciriello, R.; Tesoro, C.; Bianco, G.; Di Capua, A. Untargeted metabolomic analysis by ultra-high-resolution mass spectrometry for the profiling of new Italian wine varieties. Anal. Bioanal. Chem. 2022, 414, 7805–7812. [Google Scholar] [CrossRef]
- Zhang, Q.; Zhang, Y.Y.; Liu, Z.; Zhang, Y.M.; Lu, N.; Hai, G.Q.; Shao, S.Z.; Zheng, Q.X.; Zhang, X.; Fu, H.Y.; et al. DifferentiatingWestlake Longjing tea from the first- and second-grade producing regions using ultra high performance liquid chromatography with quadrupole time-of-flight mass spectrometry-based untargeted metabolomics in combination with chemometrics. J. Sep. Sci. 2020, 43, 2794–2803. [Google Scholar] [CrossRef]
- Zhao, J.-J.; Zhang, Y.; Wang, X.-C.; Wang, X.; Zhang, Q.; Lu, P.; Liu, P.-P.; Yu, Y.-J.; Han, L.; Zhou, H.-N.; et al. A new platform for untargeted UHPLC-HRMS data analysis to address the time-shift problem. Anal. Chim. Acta. 2022, 1193, 339393. [Google Scholar] [CrossRef]
- Lu, Y.; Yao, G.; Wang, X.; Zhang, Y.; Zhao, J.; Yu, Y.-J.; Wang, H. Chemometric discrimination of the geographical origin of licorice in China by untargeted metabolomics. Food Chem. 2022, 380, 132235. [Google Scholar] [CrossRef]
- El-Gindy, A.; Hadad, G.M. Chemometrics in Pharmaceutical Analysis: An Introduction, Review, and Future Perspectives. J. Aoac. Int. 2012, 95, 609–623. [Google Scholar] [CrossRef]
- Huang, Y.P.; Wu, Z.W.; Su, R.H.; Ruan, G.H.; Du, F.Y.; Li, G.K. Current application of chemometrics in traditional Chinese herbal medicine research. J. Chromatogr. B 2016, 1026, 27–35. [Google Scholar] [CrossRef]
- Vaclavik, L.; Lacina, O.; Hajslova, J.; Zweigenbaum, J. The use of high performance liquid chromatography–quadrupole time-of-flight mass spectrometry coupled to advanced data mining and chemometric tools for discrimination and classification of red wines according to their variety. Anal. Chim. Acta. 2011, 685, 45–51. [Google Scholar] [CrossRef] [PubMed]
- Liu, P.P.; Zhou, H.N.; Zheng, Q.X.; Lu, P.; Yu, Y.J.; Cao, P.J. An automaticUPLC-HRMS data analysis platform for plant metabolomics. Plant Biotechnol. J. 2019, 17, 2038–2040. [Google Scholar] [CrossRef] [PubMed]
- Cadahia, E.; Simon BF, D.; Sanz, M.; Poveda, P.; Colio, J. Chemical and chromatic characteristics of Tempranillo, Cabernet Sauvignon and Merlot wines from DO Navarra aged in Spanish and French oak barrels. Food Chem. 2009, 115, 639–649. [Google Scholar] [CrossRef]
- Fernández De Simón, B.; Cadahía, E.; Conde, E.; García-Vallejo, M.C. Evolution of phenolic compounds of Spanish oak wood during natural seasoning. First results. J. Agric. Food Chem. 1999, 47, 1687–1694. [Google Scholar] [CrossRef]
- Figueiredo-González, M.; Cancho-Grande, B.; Simal-Gándara, J.; Teixeira, N.; Mateus, N.; De Freitas, V. The phenolic chemistry and spectrochemistry of red sweet wine-making and oak-aging. Food Chem. 2014, 152, 522–530. [Google Scholar] [CrossRef]
- Monagas, M.; Gomez-Cordoves, C.; Bartolome, B. Evolution of the phenolic content of red wines from L. during ageing in bottle. Food Chem. 2006, 95, 405–412. [Google Scholar] [CrossRef]
- Gutierrez, I.H.; Lorenzo, S.P.; Espinosa, A.V. Phenolic composition and magnitude of copigmentation in young and shortly aged red wines made from the cultivars, Cabernet Sauvignon, Cencibel, and Syrah. Food Chem. 2005, 92, 269–283. [Google Scholar] [CrossRef]
Disclaimer/Publisher’s Note: The statements, opinions and data contained in all publications are solely those of the individual author(s) and contributor(s) and not of MDPI and/or the editor(s). MDPI and/or the editor(s) disclaim responsibility for any injury to people or property resulting from any ideas, methods, instructions or products referred to in the content. |
© 2023 by the authors. Licensee MDPI, Basel, Switzerland. This article is an open access article distributed under the terms and conditions of the Creative Commons Attribution (CC BY) license (https://creativecommons.org/licenses/by/4.0/).