Article

Mass-Mediated Phase Modulation of Thin Molybdenum Nitride Crystals on a Liquid Cu-Mo Alloy

1
Tianjin Key Laboratory of Molecular Optoelectronic Sciences, Department of Chemistry, School of Science, Tianjin University and Collaborative Innovation Center of Chemical Science and Engineering, Tianjin 300072, China
2
Haihe Laboratory of Sustainable Chemical Transformations, Tianjin 300192, China
3
Joint School of National University of Singapore and Tianjin University, International Campus of Tianjin University, Fuzhou 350207, China
4
Department of Chemistry, National University of Singapore, Singapore 117543, Singapore
5
College of Chemistry, Tianjin Normal University, Tianjin 300387, China
*
Authors to whom correspondence should be addressed.
Chemosensors 2023, 11(2), 82; https://doi.org/10.3390/chemosensors11020082
Submission received: 14 December 2022 / Revised: 17 January 2023 / Accepted: 18 January 2023 / Published: 21 January 2023
(This article belongs to the Special Issue Novel Materials for Sensing, Imaging and Energy Conversion/Storage)

Abstract

:
The high-quality and controllable preparation of molybdenum nitrides (MoxNy) will significantly advance the fields of heterogeneous catalysis, energy storage, and superconductivity. However, the complex structure of MoxNy, which contains multiple phases, makes exploring the structure-property relationship challenging. The selective preparation of MoxNy with distinct phases is undoubtedly an effective method for addressing this issue, but it is lacking experimental cases and theoretical reports. Here we demonstrate a feasible chemical vapor deposition (CVD) strategy for selectively producing γ-Mo2N or δ-MoN through modulating the mass quantity of N precursors. A liquid Cu-Mo alloy was used as a Mo precursor and catalyst in this system. The resulting γ-Mo2N was systematically characterized and found to be of high quality. Furthermore, the morphology evolutions of γ-Mo2N and δ-MoN with growth time were summarized in detail, as a result of growth and etching dynamics. This work promotes the phase modulation of MoxNy and provides a framework for future research on the structure-property relationship.

1. Introduction

Two-dimensional (2D) MXene, including ultrathin transition-metal carbides, nitrides, and carbonitrides are considered as a series of important functional materials suitable for various applications, including energy storage and harvesting, superconductivity, water purification and desalination, optoelectronics, vertical transistors, sensors, and biomedicine [1,2,3,4,5,6]. Compared with typical carbides like Ti2C3, transition-metal nitrides are more inclined to form unique geometries, which has attracted considerable attention in recent years [7,8,9].Molybdenum nitrides (defined as MoxNy) have exhibited extensive prospective applications in various fields such as energy storage [10,11,12], superconducting device [7], and heterogeneous catalysis [13,14,15]. Molybdenum nitrides have been demonstrated to possess six major crystal phases: γ-Mo2N, δ-MoN, β-Mo2N, B1-MoN, MoN2, and Mo5N6 [16]. Significant differences in properties and applications are found in the different phases. Abundant crystallographic structure data of MoxNy provides a greater freedom to explore their unique physical properties and potential applications. Among the above-mentioned crystal phases, γ-Mo2N presents a high catalytic activity owing to its N vacancy rich surface [17,18,19]. Both theoretical calculations and experimental results show that γ-Mo2N is applicable to selective hydrogenation of unsaturated bonds [20,21,22], hydrodesulfurization of thiophenes [23,24,25], conversion of harmful gases like NO [26] or CO [27], and so on. For example, Hao et al. achieved a high ethene conversion percentage of 85% with a selectivity of up to 85%, demonstrating for the first time that γ-Mo2N has a good selectivity on the hydrogenation of ethene [20]. In addition, Jaf et al. discussed the hydrodesulfurization mechanisms of thiophene over a γ-Mo2N catalyst based on density functional theory (DFT) calculations [24]. Another DFT study, by Altarawneh et al., for NO adsorption and dissociation upon γ-Mo2N, pointed out the possible mechanisms for the conversion of NO into N2 and concluded that the dissociative adsorption of NO occurs much more readily over γ-Mo2N surfaces [26].
From the above works, we conclude that the fabrication of high-quality and high-surface-area γ-Mo2N crystals is the prerequisite and foundation to further explore its catalytic performance. However, challenges still remain in the selective synthesis of MoxNy with a specific crystal phase, lacking experimental cases and theoretical guidance. Such limitations may also largely hinder the further investigation of MoxNy in numerous potential applications. To circumvent these obstacles, a controllable and feasible approach for obtaining uniform, specific-phase, and high-quality crystals is highly desired. In the past, temperature programmed ammonolysis was one of the most commonly-used methods to prepare MoxNy [28,29,30]. For example, Mckay et al. successfully achieved the synthesis of various MoxNy by the ammonolysis of MoO3 or MoS2 precursors. They explored the influence of different temperature programs on the growth, with a growth time ranging from 1 to 5 h, and found that a three-step program with a long soak time of 5 h was the best conditions for the growth of γ-Mo2N. Furthermore, they also found that γ-Mo2N has the highest ammonia synthesis activity among binary molybdenum nitrides. But this process is usually time-consuming and the obtained samples are probably non-uniform. Inspired by the experimental cases of chemical vapor deposition (CVD) as a reliable and effective route to prepare other MXene materials like Mo2C successfully [5,31,32,33,34], Wang et al. prepared hexagonal molybdenum nitrides (h-MoN) via CVD, achieving the ultrafast growth of h-MoN [35]. In contrast to traditional methods, thin h-MoN flakes can be obtained in 3 min via CVD, and continuous h-MoN films are formed within 10 min in their work. Nevertheless, limited breakthroughs toward feasible CVD methods have been made since then, and the major hurdles of crystal phase modulation still remain.
Herein, we achieved a fast and direct one-step selective fabrication of ultrathin γ-Mo2N and δ-MoN via CVD. We applied a solid-vapor-solid strategy to catalyze the formation of MoxNy crystals. N precursors in this experiment were changed from a solid source state into a vapor form, and then finally into the solid product. Specifically, a liquid Cu-Mo alloy served as the Mo precursor, and catalysis for this reaction, and the carbamide (CO(NH2)2), provided active N atoms for the synthesis of MoxNy crystals. The selective production of a distinct phase could be observed by simply adjusting the mass of the N precursor. More importantly, morphology evolutions of both γ-Mo2N and δ-MoN, which can be attributed to the dynamics of growth and etching, were obtained by adjusting the growth time. This work provides a feasible way for fabricating the desired MXene, and greatly promotes the phase engineering of 2D materials.

2. Materials and Methods

2.1. Selective Preparation of Thin MoxNy Crystals via CVD

The Mo foil (Alfa Aesar, Haverhill, MA, USA 99.95% purity, 50 μm thick) was covered with three layers of Cu foil (Alfa Aesar, 99.8% purity, 25 μm thick). A two zone furnace was used to ensure a stable supply of the precursor, and marked as low-temperature, zone 1, and high-temperature, zone 2. The two zone furnace was composed of connected quartz furnace tubes and a movable heating area. The two zones were completely connected and there was no gate between them. To ensure a stable supply of the N precursor, different temperatures were applied to the two regions. Zone 1 was the precursor decomposition zone. When the solid CO(NH2)2 precursor was heated to its decomposition temperature it decomposed, producing NH3 gas and changing into isocyanate. Zone 2 was the crystal growth region, and the generated NH3 and Mo precursors formed MoxNy crystals under high temperature conditions. The four-foil stack was introduced into the downstream side of a quartz tube (high temperature zone 2) to catalyze the growth of MoxNy crystals. An arc shaped quartz plate for placing carbamide (CO(NH2)2, AR) was put into the upper stream side of the four foils substrate (low temperature zone 1). The substrates were heated to 1100 °C in the high temperature zone 2 under 200 sccm Ar and 20 sccm H2, and then annealed for 20 min. At the same time, the CO(NH2)2 was heated to 200 °C to produce NH3. Changing the mass of CO(NH2)2 can adjust the flow of NH3, and thus adjust the Mo/N ratio, during the growth process. The NH3 was then introduced into the high temperature zone at ambient pressure to form MoxNy crystals. Different crystallographic structures of MoxNy, including δ phase and γ phase, could be obtained by varying the mass of CO(NH2)2. The morphology evolution of MoxNy of both δ phase and γ phase could be achieved by varying the growth time (8–10 min).

2.2. Transfer of Thin MoxNy Crystals

The transfer of MoxNy crystals utilized the chemical etching method and the most-used poly (methyl methacrylate) (PMMA) was chosen as the supporting layer. Firstly, the as-grown MoxNy crystals were spin-coated with PMMA to form a uniform supporting layer. The speed of spin coating was set to 1000 r.p.m. and maintained for 3 min. Then, samples were cured at 160 °C to form a strong interaction between the PMMA layer and the as-grown MoxNy crystals. After that, the underlaying Cu substrate was etched using saturated ammonium persulphate ((NH4)2S2O8) aqueous solution. The samples coated with PMMA were immersed in this solution for more than 5 h to ensure complete etching. The floating PMMA/MoxNy layer, separated from the substrate, was then cleaned with deionized water and stamped onto 300 nm SiO2/Si substrates or transmission electron microscopy (TEM) grids. Finally, thin MoxNy crystals on the desired substrate were obtained by removing the PMMA using heating acetone.

2.3. Quality and Structure Characterization of MoxNy Crystals

Optical images were collected using a Nikon ECLIPSE Ci-POL polarized optical microscope (NIKON INSTRUMENTS (SHANGHAI) CO.,LTD, Shanghai, China). Scanning electron microscopy (SEM), and selected-area electron diffraction (SAED), measurements were carried out using the FEI Verios 460 field emission scanning electron microscope. X-ray photoelectron spectroscopy (XPS) spectra were performed on an ESCALAB-250Xi spectrometer (Thermo Fisher Scientific, Shanghai, China) using monochromatic Al-Kα (hυ = 1486.6 eV) radiation. X-ray diffraction (XRD) results were collected from Rigaku SmartLab 9. Raman spectroscopy was conducted on Renishaw InVia using an excitation wavelength of 532 nm. TEM and high-resolution TEM (HRTEM) measurements were conducted on JEM-2800 (ROYAL PHILIPS, Amsterdam, Netherlands).

3. Results

3.1. Phase Modulation of MoxNy Crystals

The MoxNy crystals with different crystalline phases were successfully prepared on the surface of a liquid Cu substrate via an ambient pressure CVD process. Figure 1a schematically shows the growth process of MoxNy crystals. Briefly, the Cu melted on the supporting Mo foil served as both the reaction platform and catalyst. Dissolved Mo atoms at the surface served as the Mo source for the growth of MoxNy. CO(NH2)2 was chosen as the nitrogen source, and a mixture of argon (Ar) and hydrogen (H2) was the carrier gas. First, the Cu foil was placed on the supporting Mo substrate and introduced into the downstream of the chamber, while the CO(NH2)2 was introduced into the upper stream side during the reaction (Figure S1). In order to ensure the stable supply of the nitrogen source in the growth process, a two zone furnace was used to controllably tune the heating temperature of CO(NH2)2. The two zones were marked as low-temperature, zone 1 (mainly for the sublimation of precursors), and high-temperature, zone 2 (mainly for the growth). During the growth process, the heating temperature of CO(NH2)2 was set to 200 °C to ensure its complete thermal decomposition into NH3. At high-temperature zone 2, the substrate was uniformly heated to 1100 °C under a mixture flow of Ar and H2 and then annealed at 1100 °C for 20 min (more details see the Section 2).
The Cu foil melts into the liquid phase at temperatures > 1086 °C, and spreads out over the whole Mo surface owing to its low viscosity. The high temperature contributes to the formation of a Cu-Mo alloy at the solid-liquid interface between the melting Cu and Mo foil, which further results in the dissolution of Mo atoms at the liquid Cu surface. Then, the dissolved Mo atoms react with the active N atoms, decomposed from NH3, to form MoxNy crystals. Additionally, the mass of CO(NH2)2 was adjusted to investigate the crystalline phase modulation of MoxNy crystals (Figure 1a). The varied Mo/N ratio resulted in the formation of MoxNy with different crystal phases. In the experiment, we explored the growth of MoxNy crystals with a CO(NH2)2 mass of 40–80 mg and a Mo mass of 50 mg. It is difficult to justify the specific amount of materials involved in the reaction, as well as the amount of precursors in the chamber, thus the Mo/N mass ratios provided here correspond to the feed ratio. Triangular δ-MoN crystals are usually formed under a low concentration of NH3, where the Mo/N mass ratio of the precursors is 5/4. The γ-Mo2N crystals with a square shape are generally formed at a high concentration of NH3, in which the Mo/N mass ratio of the precursors is 5/8. When the Mo/N ratio is between 5/4 and 5/8, both δ-MoN and γ-Mo2N crystals were usually obtained at the same time. SEM images of MoxNy crystals grown at Mo/N ratios of 5/5, 5/6, and 5/7, are shown in Figure S2. It can be seen that the proportion of γ-Mo2N crystals in the two crystals tends to increase with the increase of N ratio. Figure 1b shows the classical hexagonal system of δ-MoN, which has an octahedral coordination structure. Figure 1b clearly illustrates the face-centered cubic structure (fcc) of γ-Mo2N crystals, with a repeated ABCABC stacking sequence. In contrast to the familiar and well-known hexagonal δ-MoN crystals that have an octahedral coordination, the cell structure of γ-Mo2N crystals has one half N vacancies. Such a structure is proved to be conducive to the improvement of heterogeneous catalytic performance [7].
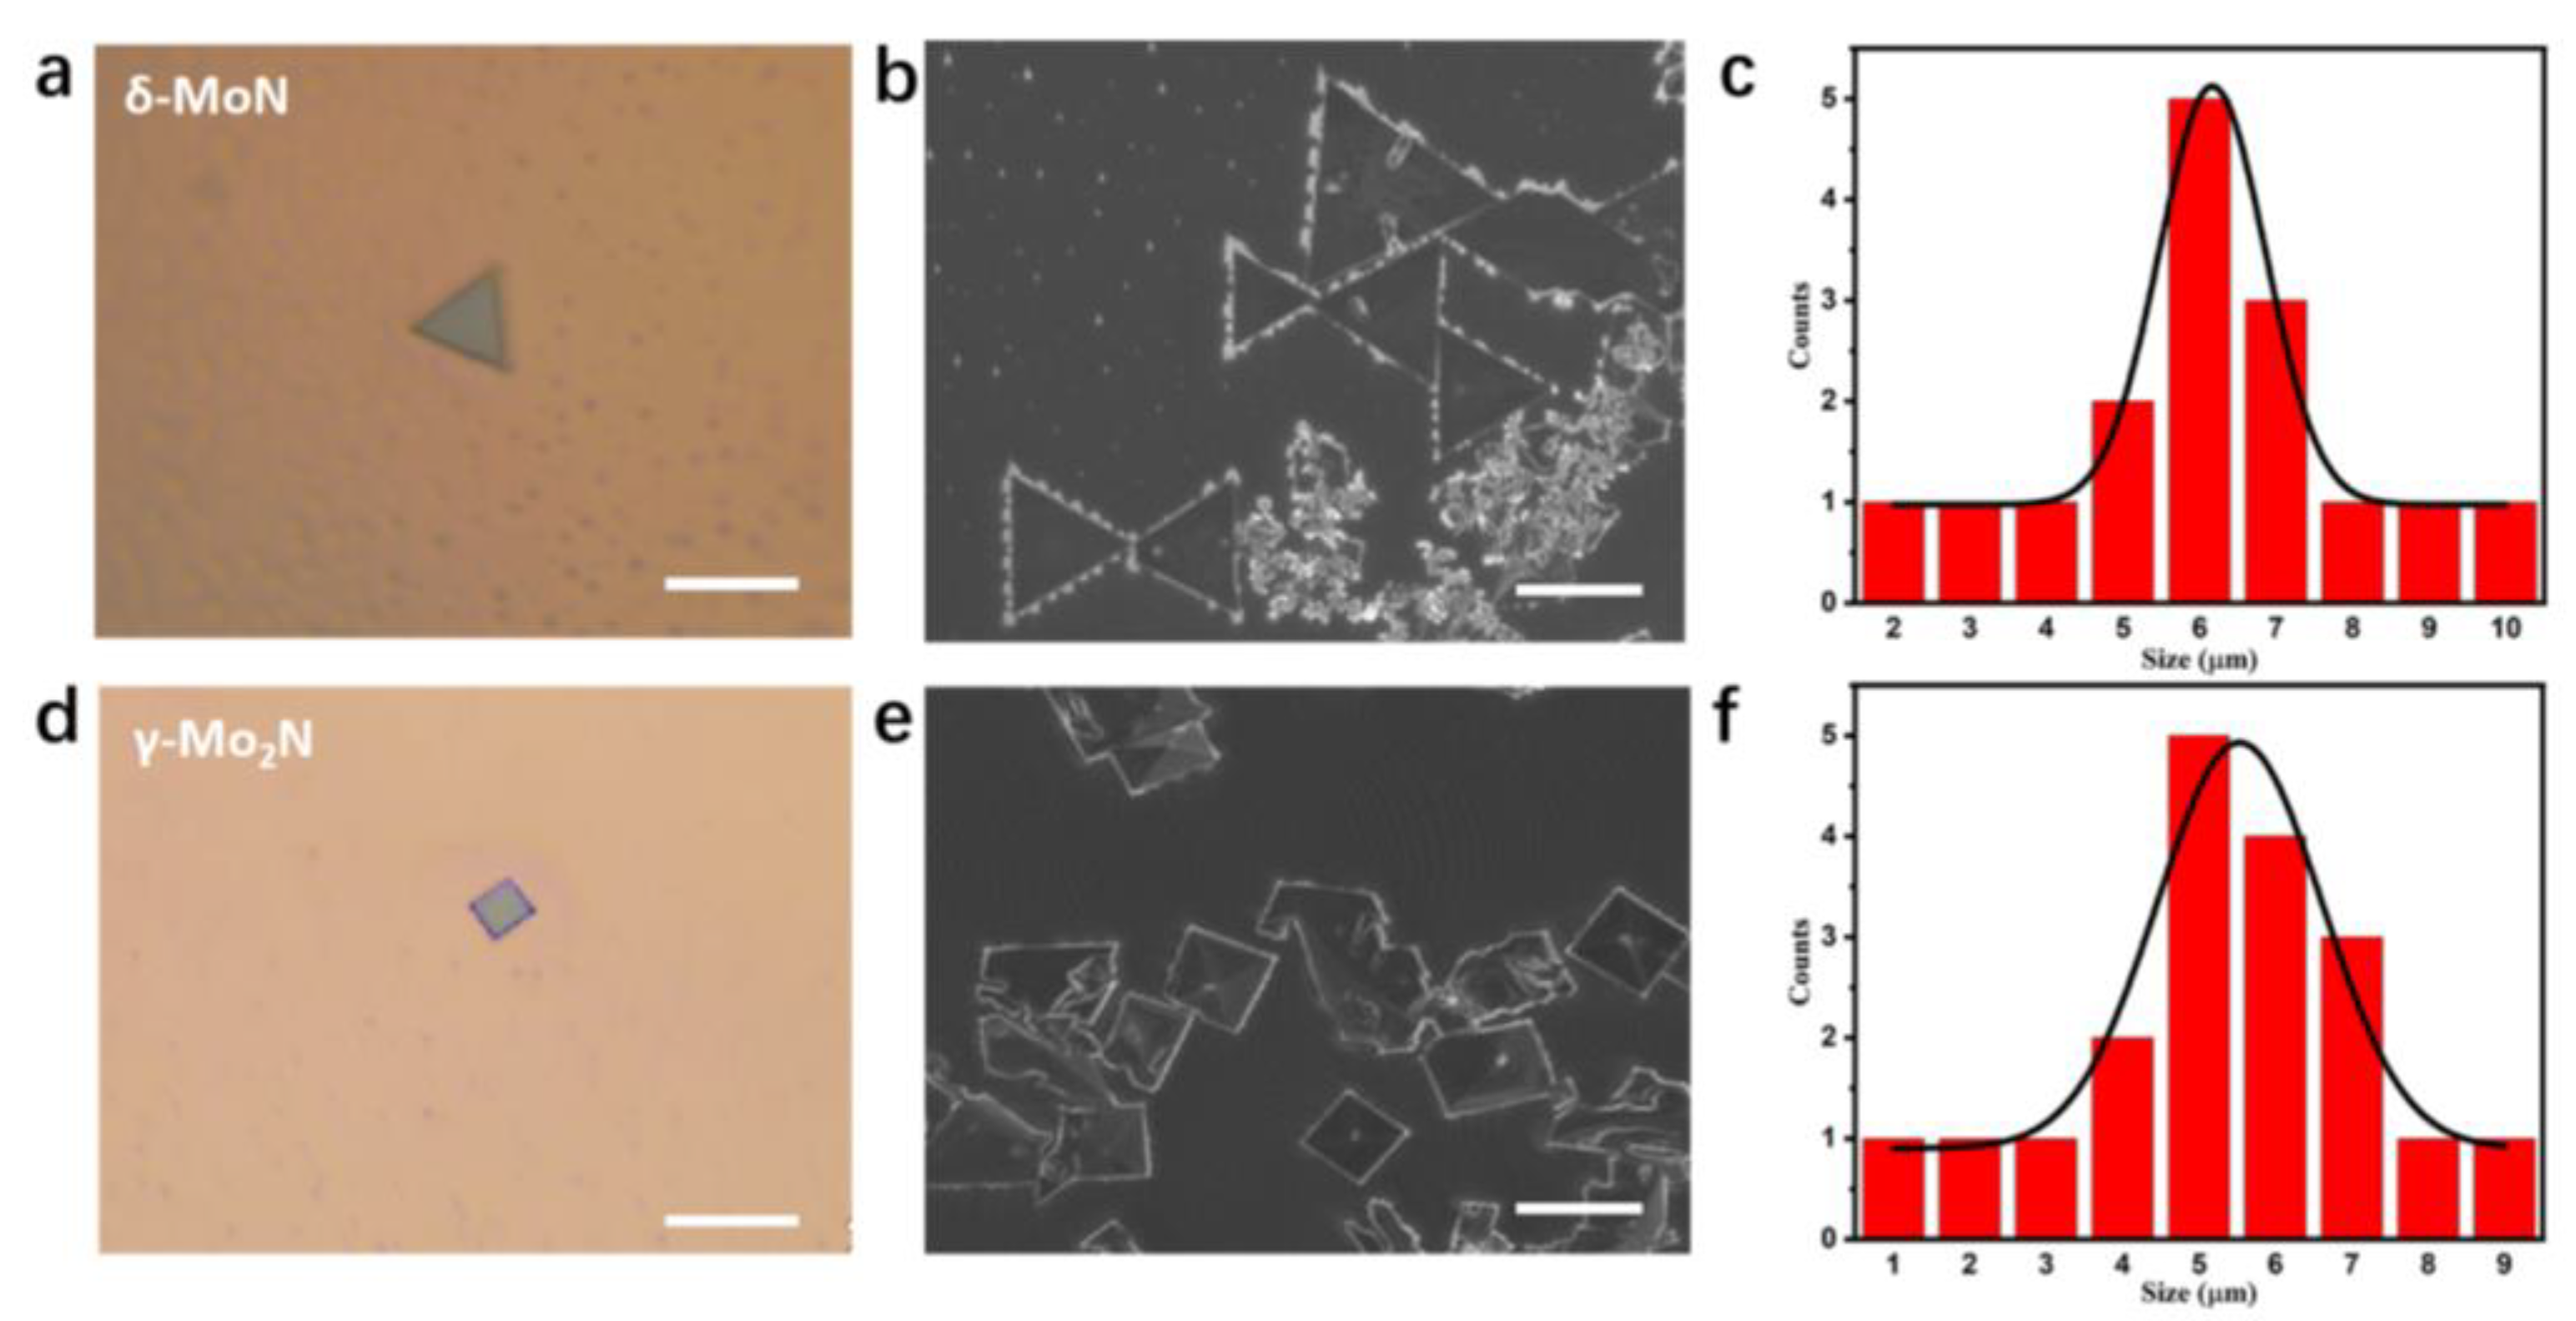
Figure 2a,d illustrates typical optical images of δ-MoN and γ-Mo2N, in which δ-MoN exhibits a triangular morphology and γ-Mo2N shows a square shape. The highly ordered morphology and obviously sharp edges indicate that the prepared crystals are of high quality. SEM images clearly show that the two types of MoxNy crystals are uniformly distributed on the entire substrate (Figure 2b,e). Corresponding large-area SEM images are shown in Figure S3, showing the distribution of δ-MoN and γ-Mo2N crystals. The selective growth of MoxNy with a specific crystal phase was achieved and can be simply judged from the morphology of crystals grown under the two conditions. Subsequently, we made statistics on the sizes and densities of the products based on a large number of samples. More than 10 batches of samples of δ-MoN and γ-Mo2N were inspected, and the statistical results within a range of 40 × 40 μm have been summarized as the statistical histograms shown in the Figure 2c,f. According to the statistical results, the weighted average of the crystal size was about 6.6 μm for δ-MoN, which is in accordance with the Gaussian fitting result shown in Figure 2c. For the γ-Mo2N crystals, the weighted average size was about 5.32 μm, and also corresponds to the Gaussian fitting result in Figure 2f. The maximum sizes of the δ-MoN and γ-Mo2N crystals were 9 μm and 10 μm, respectively. All these results suggest a homogenous size and density of the products, which further demonstrates the high reliability and high reproducibility of these experiments.

3.2. Quality and Structure Characterization of γ-Mo2N Crystals

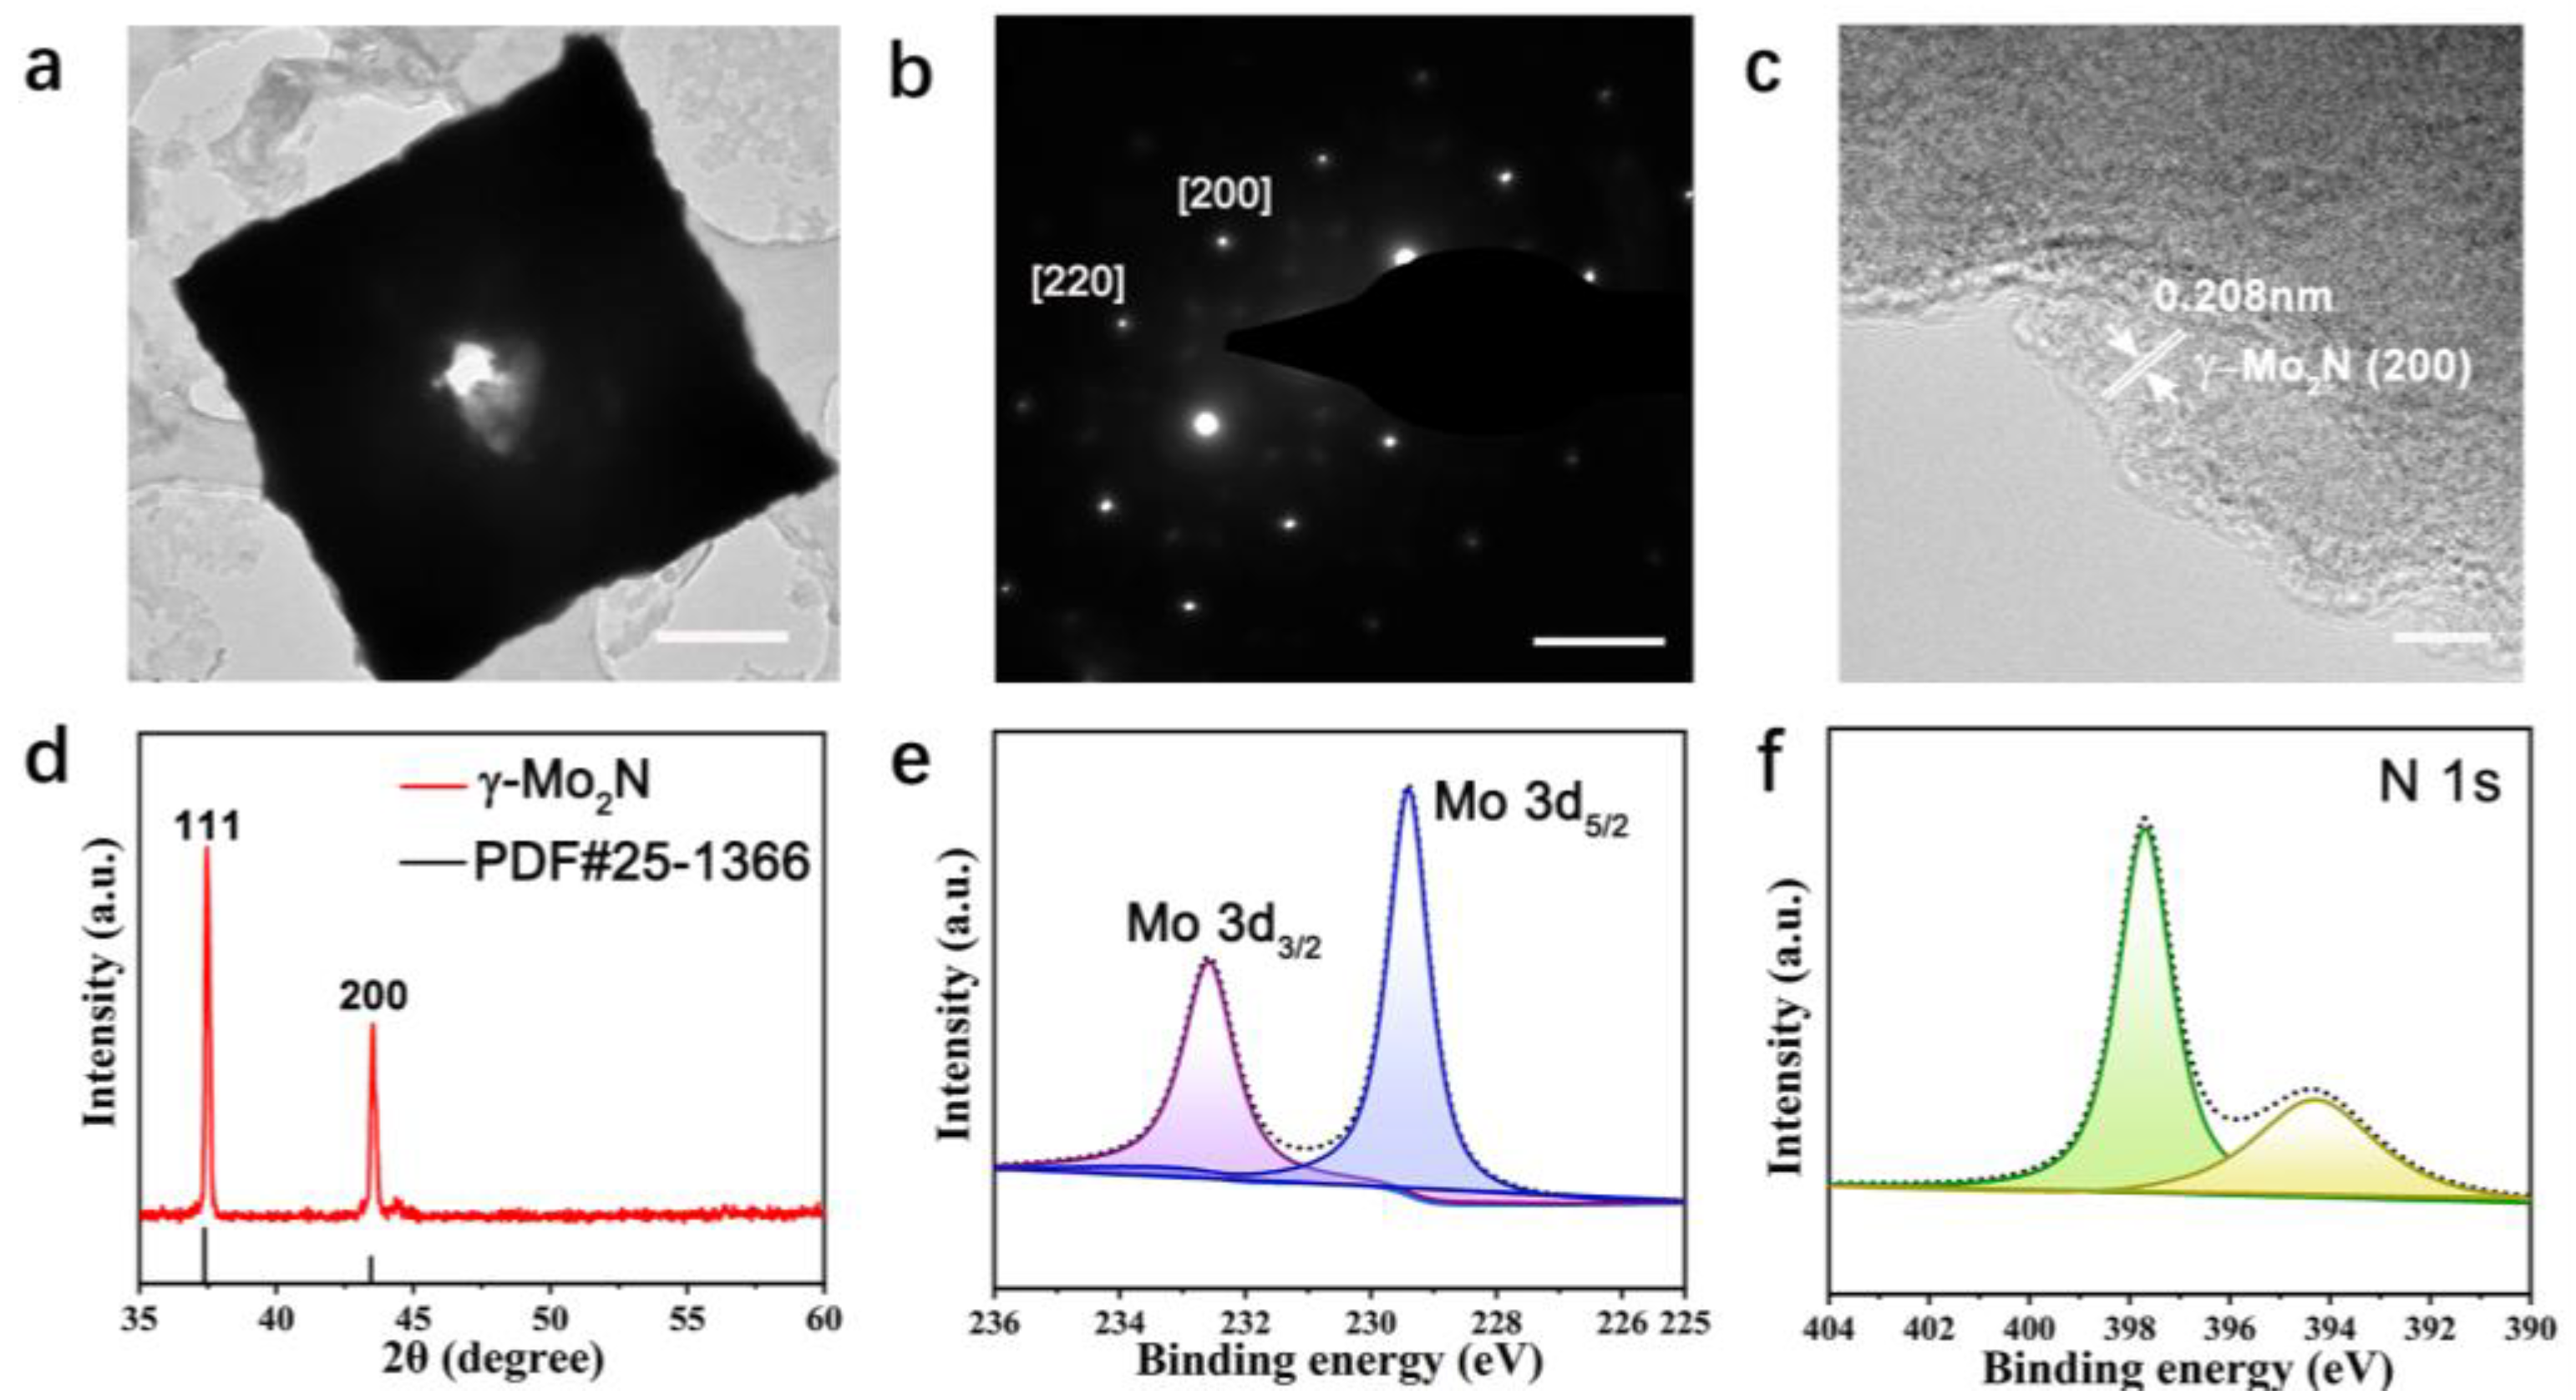
Compared with the familiar δ-MoN, the oriented synthesis of γ-Mo2N is rarely investigated and the exploration on γ-Mo2N may significantly benefit the development of superconductors, heterogeneous catalysis, and energy storage [7,11,13]. Thus, the following text is focused on the characterizations of γ-Mo2N. To gain more insight into the atomic structure of γ-Mo2N crystals, the TEM, HRTEM, and XRD were carried out on the samples. The as-grown γ-Mo2N crystals were transferred onto TEM grids using the PMMA-assisted etching method. The saturated (NH4)2S2O8 aqueous solution was utilized to etch the underlaying Cu-Mo alloy substrate (more details see the Experimental Section). Figure 3a illustrates the square shape of γ-Mo2N crystals, which is consistent with the SEM image. The intrinsic fourfold symmetrical structure of γ-Mo2N crystals is also reflected in the SAED pattern (Figure 3b), corresponding to the features of fcc structure. Only one set of orthogonal and clearly contrasted spots could be identified, indicating its high crystalline nature. The lattice distance of γ-Mo2N crystals, derived from SAED patterns, are 2.08 A along (200) plane and 1.48 A along (220) plane. The HRTEM image shows clear lattice stripes, indicating a highly crystalline γ-Mo2N structure (Figure 3c). The lattice spacing of 0.208 nm, calculated from the average distance of adjacent lattice stripes, is consistent with the spacing of (200) crystal planes of the γ-Mo2N phase, indicating the high quality of as-grown γ-Mo2N. Furthermore, the γ-Mo2N sample was transferred onto the surface of a Si/SiO2 substrate for XRD characterization through wet chemical etching as depicted above. The XRD results shown in Figure 3d further confirm the fcc feature of γ-Mo2N crystals. The XRD characteristic peak indicates the γ-Mo2N crystals pertain to the Pm3m space group (JCPDS File No. 26-1366), which agrees well with the SAED results. No characteristic peaks of other nitride or oxide species are observed in the XRD pattern, indicating that the sample is of high quality, without other impurities. In addition, the crystal structure of δ-MoN was characterized to make a better comparison. The HRTEM image shows clear lattice stripes, with a lattice distance of 0.245 nm, corresponding to the (200) plane of δ-MoN (Figure S4). The Fast Fourier transform pattern, inset in Figure S4, shows the six-fold symmetry of the δ-MoN crystal. The XDR results of δ-MoN indicate that it belongs to the P6m2 space group (JCPDS File No. 26-1367).
In addition to studying the crystal structures of the products, the XPS spectra were utilized to identify the elementary composition of the γ-Mo2N crystals. The test sample for the XPS spectra was prepared in the same wet chemical etching manner to that used for the XRD characterization, only altering the insulating Si/SiO2 substrate into a conductive silicon substrate. The primary spin-orbital components 3d5/2 and 3d3/2 of Mo are located at 229.4 and 232.5 eV, corroborating the formation of Mo-N bonds (Figure 3e). The N 1s components show two dominant peaks at the binding energy of 397.7 and 394.3 eV (Figure 3f). All these peaks correspond to previous reports, suggesting the formation of γ-Mo2N crystals [12]. The XPS full spectrum of γ-Mo2N crystals, shown in Figure S5 in the Supporting Information, confirms the presence of Mo3d peaks and N1s peaks. The peaks Mo4p, O1s and C1s can also be clearly seen, in which the O and C peaks probably originate from the air atmosphere. The phonon modes for the 2D γ-Mo2N single crystals were detected in the Raman spectroscopy (Figure S7). Raman peaks at 774.1, 197.5, 158.9 cm−1 are observed, indicating the formation of γ-Mo2N crystals [36]. The Raman peak at 520.6 cm−1 is consistent with the characteristic peak of the SiO2/Si substrate. The Energy Dispersive Spectroscopy (EDS) mapping results of γ-Mo2N crystals grown on a liquid Cu substrate show a coexistence and a uniform distribution of Mo and N elements among the whole crystal, while the intensity of Mo is obviously higher than N, corresponding to the elemental composition of γ-Mo2N. (Figure S6).

3.3. Morphology Evolution of δ-MoN and γ-Mo2N Crystals

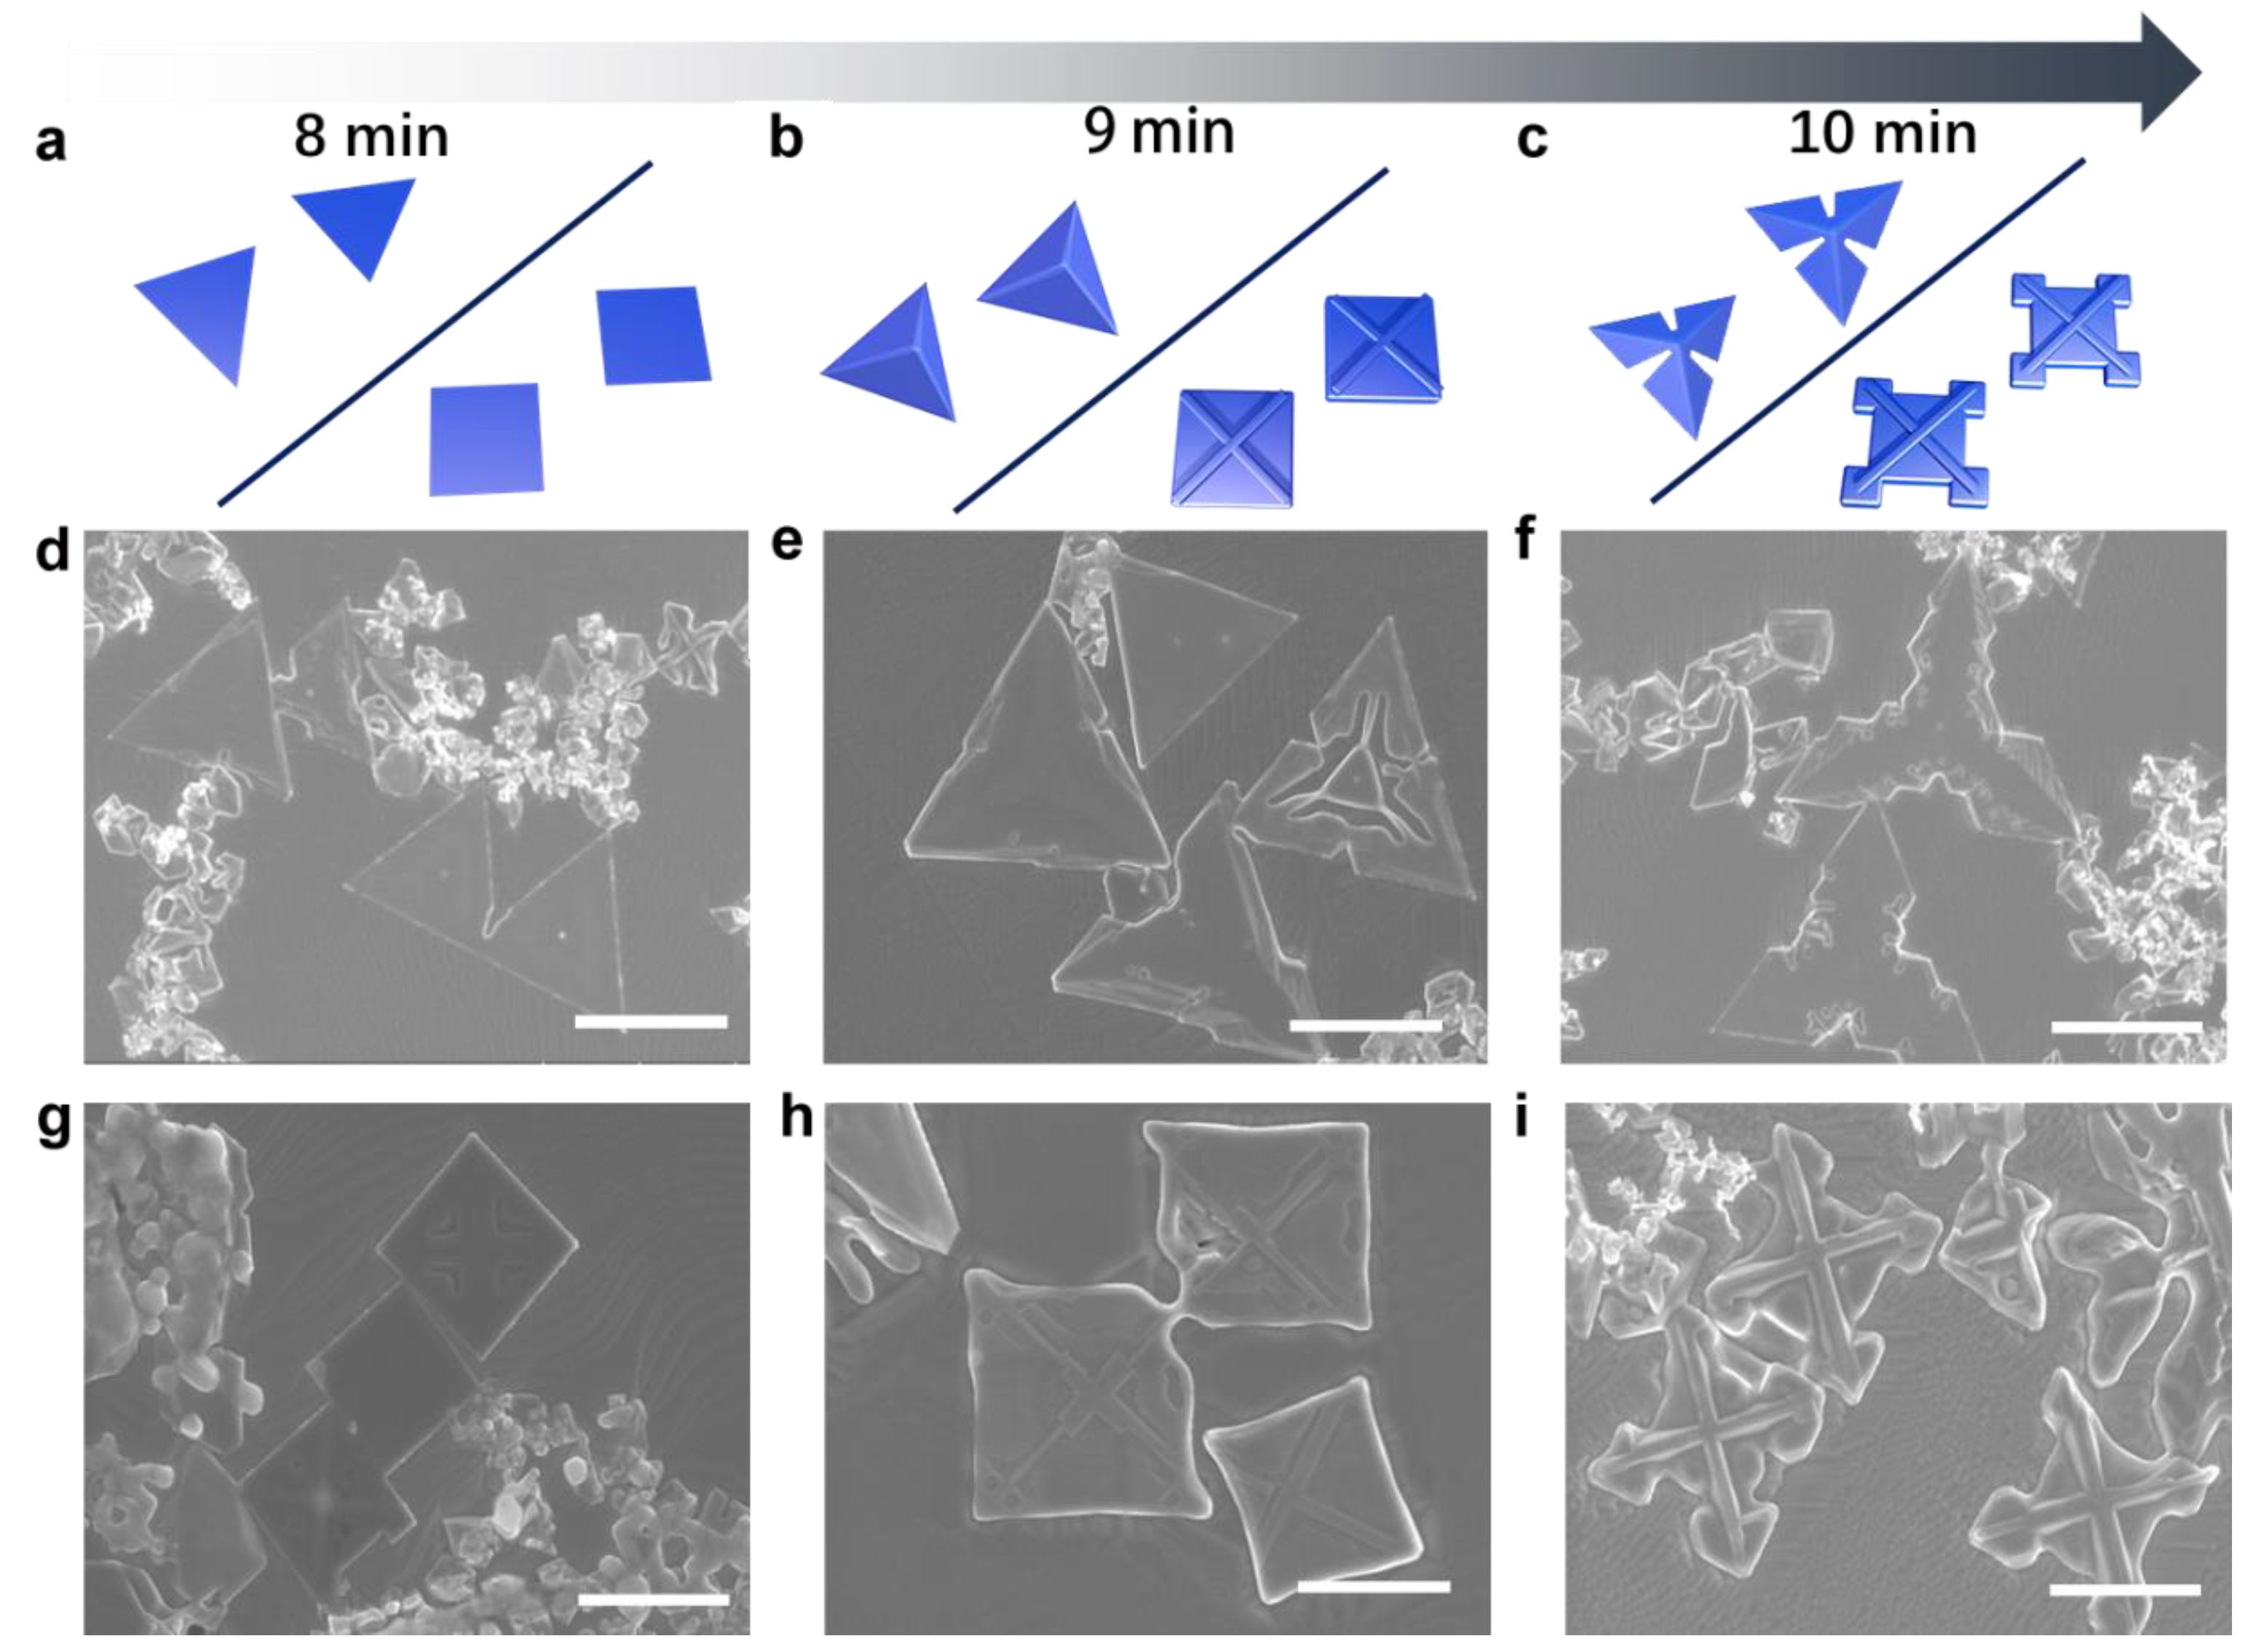
Above, sufficient characterization has demonstrated the high quality of the produced γ-Mo2N crystals. After that, in order to track the formation process of δ-MoN and γ-Mo2N crystals, an investigation on the morphology evolutions of distinct phases is highly necessary. To further explore the morphology evolution, the growth behavior of δ-MoN and γ-Mo2N crystals under a series of different conditions was investigated. It is worth noting that the morphology evolution of MoxNy crystals is highly related with the growth time. Figure 4a–c schematically presents the morphology evolution of δ-MoN and γ-Mo2N crystals. The mass ratios of the precursor (Mo/N) of δ-MoN and γ-Mo2N were 5/4 and 5/8 respectively. Typical SEM images of the morphology evolution of δ-MoN are shown in Figure 4d–f. Corresponding large-area SEM images further illustrate this evolution process, as shown in Figure S8. At a low NH3 flow rate (Mo/N = 5/4), δ-MoN crystals tend to grow into uniform triangular domains at the initial stage, following the typical layer-by-layer growth mode. The different atomic diffusion rate of the precursor between the liquid alloy and the as-grown δ-MoN leads to a different growth rate between the edge and the top of triangular flakes, thus resulting in a triangular pyramid shape [35]. The final windmill like crystals may be formed due to the influence of fractal etching. Previous studies have shown that the rapid diffusion of etchant usually results in fractal etching [37]. The high Ar/H2 ratio used in this work led to a lower coverage of H2 etchant, which was advantageous to the rapid diffusion and fractal etching. Also, the diffusion rate of etchant is higher on a liquid Cu-Mo alloy than on solid MoxNy crystals, thus the etching occurs more easily at the edges of the as-grown crystals. These phenomena are all consistent with previous studies [37]. Moreover, we tried to reduce the etching effect by reducing the hydrogen concentration. It was found that both the δ-MoN and γ-Mo2N crystals grew into pyramid shape at 10 min under an H2 flow rate of 10 sccm. The triangular δ-MoN changed into a trigonal pyramid shape, while the square γ-Mo2N turned into a quadrangular pyramid shape, shown in Figure S9.
Similarly, the morphology evolution of γ-Mo2N crystals from a square shape to more complicated shapes was also observed at a high NH3 flow rate (Mo/N = 5/8). SEM images in Figure 4g–i clearly show the morphology evolution of γ-Mo2N. Corresponding large-area SEM images are shown in Figure S8, showing the distribution of γ-Mo2N during the morphology evolution process. At the initial stage, γ-Mo2N crystals presented a highly regular square shape, which has been discussed above. Subsequently, a cross structure along the diagonal was generated stacking above the square flakes, deviating from the classic layer-by-layer growth mode. Eventually, the cross structure grew into a more three-dimensional shape above the square flakes, and the four edges at the bottom of the square flakes were partially etched. Based on the above observations, we proposed an etching-growth competition model to describe the dynamic formation process of γ-Mo2N. During the initial stage, the overall effect of growth and etching shows the growth square. With the increase of growth time, the amount of precursor gradually decreases, which makes the etching effect gradually become obvious. Moreover, since γ-Mo2N is formed under the conditions of higher N content, it is more vulnerable to the reduction of precursors. The formation of the unique cross structure is possibly due to the lower energy barrier of the diffusion and nucleation of the precursor in the diagonal line. The etched edges are easily understood as being the sites that are usually the fractal etching initiation sites [38,39,40]. This study on morphology evolution may pose great significance on exploring growth mechanism, and provides a meaningful experimental case for morphology engineering.

4. Conclusions

In summary, we have achieved the selective growth of the desired-phases of MoxNy. When the amount of the NH3 source is high, the active Mo and N precursors tend to form square γ-Mo2N crystals, whereas triangular δ-MoN crystals are usually obtained when the amount of the NH3 source is low. The crystal structure and elemental states of γ-Mo2N were thoroughly studied. Furthermore, the morphology evolutions of δ-MoN and γ-Mo2N crystals was further investigated by adjusting the growth time. The intrinsic evolution mechanism of the two types of MoxNy can be explained by the competitive relationship between growth and etching, according to a series of MoxNy crystals with different morphologies being obtained. This work provides an intriguing experimental case for phase engineering of 2D materials and may serve as a foundation for future research on the structure-property relationship.

Supplementary Materials

The following supporting information can be downloaded at: https://www.mdpi.com/article/10.3390/chemosensors11020082/s1, Figure S1. Schematic fabrication process detailing one-step CVD method to obtain MoxNy crystals via a two-zone furnace.; Figure S2. SEM images of MoxNy crystals grown at different Mo/N ratio. All the scale bars are 20 µm.; Figure S3. Large area SEM images of δ-MoN and γ-Mo2N. All the scale bars are 20 µm.; Figure S4. (a) HRTEM images of δ-MoN. (b) XRD pattern of δ-MoN and the corresponding JCPDS file results.; Figure S5. XPS survey spectrum of γ-Mo2N crystals grown at 1100 °C for 8 min, where C, O peaks are from the air atmosphere.; Figure S6. EDS image of γ-Mo2N crystals showing the uniform distribution of Mo and N elements.; Figure S7. Raman spectra for γ-Mo2N crystals. Characteristic peaks at 774.1, 197.5, 158.9 cm−1 are observed, indicating the formation of γ-Mo2N crystals.; Figure S8. Large area SEM images of δ-MoN and γ-Mo2N grown at 8, 9, 10min. All the scale bars are 20 µm.; Figure S9. SEM images of δ-MoN and γ-Mo2N grown under H2 flow rate at 10 sccm. All the scale bars are 5 µm.

Author Contributions

M.L. and Q.Z. contribute equally to this work. Conceptualization, D.G., Q.Z.; methodology, M.L., Y.F.; software, M.L., Y.F.; validation, M.L.; formal analysis, M.L.; investigation, M.L., Y.F.; resources, W.H.; data curation, M.L.; writing—original draft preparation, M.L.; writing—review and editing, Q.Z., L.L., D.G.; visualization, M.L.; supervision, Q.Z., L.L., D.G.; project administration, W.H., D.G.; funding acquisition, W.H., D.G. All authors have read and agreed to the published version of the manuscript.

Funding

This research was funded by the National Key R&D Program of China (2021YFA0717900), the Natural Science Foundation of China (Grant 52002267).

Institutional Review Board Statement

Not applicable.

Informed Consent Statement

Not applicable.

Data Availability Statement

Not applicable.

Acknowledgments

Authors acknowledge the financial support from the National Key R&D Program of China (2021YFA0717900), the Natural Science Foundation of China (Grant 52002267), and the Haihe Laboratory of Sustainable Chemical Transformations.

Conflicts of Interest

The authors declare no conflict of interest.

References

  1. Vahid Mohammadi, A.; Rosen, J.; Gogotsi, Y. The world of two-dimensional carbides and nitrides (MXenes). Science 2021, 372, eabf1581. [Google Scholar] [CrossRef]
  2. Anasori, B.; Lukatskaya, M.R.; Gogotsi, Y. 2D metal carbides and nitrides (MXenes) for energy storage. Nat. Rev. Mater. 2017, 2, 16098. [Google Scholar] [CrossRef]
  3. Kamysbayev, V.; Filatov, A.S.; Hu, H.; Rui, X.; Lagunas, F.; Wang, D.; Klie, R.F.; Talapin, D.V. Covalent surface modifications and superconductivity of two-dimensional metal carbide MXenes. Science 2020, 369, 979–983. [Google Scholar] [CrossRef]
  4. Zhang, C.; McKeon, L.; Kremer, M.P.; Park, S.H.; Ronan, O.; Seral-Ascaso, A.; Barwich, S.; Coileáin, C.Ó.; McEvoy, N.; Nerl, H.C.; et al. Additive-free MXene inks and direct printing of micro-supercapacitors. Nat. Commun. 2019, 10, 1795. [Google Scholar] [CrossRef] [PubMed] [Green Version]
  5. Fan, Y.X.; Li, L.; Zhang, Y.; Zhang, X.T.; Geng, D.C.; Hu, W.P. Recent advances in growth of transition metal carbides and nitrides (MXenes) crystals. Adv. Funct. Mater. 2022, 32, 2111357. [Google Scholar] [CrossRef]
  6. Zhang, Q.; Li, E.L.; Wang, Y.S.; Gao, C.S.; Wang, C.Y.; Li, L.; Geng, D.C.; Chen, H.P.; Chen, W.; Hu, W.P. Ultralow-power Vertical Transistors for Multilevel Decoding Modes. Adv. Mater. 2022, in press. [Google Scholar] [CrossRef]
  7. Jaf, Z.N.; Miran, H.A.; Jiang, Z.T.; Altarawneh, M. Molybdenum nitrides from structures to industrial applications. Rev. Chem. Eng. 2021. [Google Scholar] [CrossRef]
  8. Wang, Y.T.; Wang, Y.H. Recent Progress in MXene Layers Materials for Supercapacitors: High-performance Electrodes. SmartMater. 2022; in press. [Google Scholar] [CrossRef]
  9. Wang, Z.; Li, Z.T.; Zhao, S.J.; Wu, Z.G. High-entropy carbide ceramics: A perspective review. Tungsten 2021, 3, 131–142. [Google Scholar] [CrossRef]
  10. Gao, B.; Li, X.; Ding, K.; Huang, C.; Li, Q.; Chu, P.K.; Huo, K. Recent progress in nanostructured transition metal nitrides for advanced electrochemical energy storage. J. Mater. Chem. A 2019, 7, 14–37. [Google Scholar] [CrossRef]
  11. Choi, D.; Kumta, P.N. Synthesis and characterization of nanostructured niobium and molybdenum nitrides by a two-step transition metal halide approach. J. Am. Ceram. Soc. 2011, 94, 2371–2378. [Google Scholar] [CrossRef]
  12. Liu, J.; Tang, S.S.; Lu, Y.K.; Cai, G.M.; Liang, S.Q.; Wang, W.J.; Chen, X.L. Synthesis of Mo2N nanolayer coated MoO2 hollow nanostructures as high-performance anode materials for lithium-ion batteries. Energy Environ. Sci. 2013, 6, 2691–2697. [Google Scholar] [CrossRef]
  13. McKay, D.; Hargreaves, J.S.J.; Rico, J.L.; Rivera, J.L.; Sun, X.L. The influence of phase and morphology of molybdenum nitrides on ammonia synthesis activity and reduction characteristics. J. Solid State Chem. 2008, 181, 325–333. [Google Scholar] [CrossRef]
  14. Cárdenas-Lizana, F.; Lamey, D.; Kiwi-Minsker, L.; Keane, M.A. Molybdenum nitrides: A study of synthesis variables and catalytic performance in acetylene hydrogenation. J. Mater. Sci. 2018, 53, 6707–6718. [Google Scholar] [CrossRef]
  15. Kreider, M.E.; Stevens, M.B.; Liu, Y.; Patel, A.M.; Statt, M.J.; Gibbons, B.M.; Gallo, A.; Ben-Naim, M.; Mehta, A.; Davis, R.C.; et al. Nitride or oxynitride? Elucidating the composition–activity relationships in molybdenum nitride electrocatalysts for the oxygen reduction reaction. Chem. Mater. 2020, 32, 2946–2960. [Google Scholar] [CrossRef]
  16. Tagliazucca, V.; Schlichte, K.; Schüth, F.; Weidenthaler, C. Molybdenum-based catalysts for the decomposition of ammonia: In situ X-ray diffraction studies, microstructure, and catalytic properties. J. Catal. 2013, 305, 277–289. [Google Scholar] [CrossRef]
  17. Klimashin, F.F.; Koutná, N.; Euchner, H.; Holec, D.; Mayrhofer, P.H. The impact of nitrogen content and vacancies on structure and mechanical properties of Mo–N thin films. J. Appl. Phys. 2016, 120, 185301. [Google Scholar] [CrossRef] [Green Version]
  18. Dongil, A.B. Recent progress on transition metal nitrides nanoparticles as heterogeneous catalysts. Nanomaterials 2019, 9, 1111. [Google Scholar] [CrossRef] [Green Version]
  19. Baek, S.H.; Yun, K.; Kang, D.C.; An, H.; Park, M.B.; Shin, C.H.; Min, H.K. Characteristics of high surface area molybdenum nitride and its activity for the catalytic decomposition of ammonia. Catalysts 2021, 11, 192. [Google Scholar] [CrossRef]
  20. Hao, Z.X.; Wei, Z.B.; Wang, L.J.; Li, X.H.; Li, C.; Min, E.Z.; Xin, Q. Selective hydrogenation of ethyne on γ-Mo2N. Appl. Catal. A-Gen. 2000, 192, 81–84. [Google Scholar] [CrossRef]
  21. Jaf, Z.N.; Altarawneh, M.; Miran, H.A.; Jiang, Z.T.; Dlugogorski, B.Z. Mechanisms governing selective hydrogenation of acetylene over γ-Mo2N surfaces. Catal. Sci. Technol. 2017, 7, 943–960. [Google Scholar] [CrossRef]
  22. Wyvratt, B.M.; Gaudet, J.R.; Pardue, D.B.; Marton, A.; Rudić, S.; Mader, E.A.; Cundari, T.R.; Mayer, J.M.; Thompson, L.T. Reactivity of hydrogen on and in nanostructured molybdenum nitride: Crotonaldehyde hydrogenation. ACS Catal. 2016, 6, 5797–5806. [Google Scholar] [CrossRef]
  23. Jujjuri, S.; Cárdenas-Lizana, F.; Keane, M.A. Synthesis of group VI carbides and nitrides: Application in catalytic hydrodechlorination. J. Mater. Sci. 2014, 49, 5406–5417. [Google Scholar] [CrossRef]
  24. Jaf, Z.N.; Altarawneh, M.; Miran, H.A.; Jiang, Z.T.; Dlugogorski, B.Z. Hydrodesulfurization of thiophene over γ-Mo2N catalyst. Mol. Catal. 2018, 459, 21–30. [Google Scholar] [CrossRef]
  25. Jaf, Z.N.; Altarawneh, M.K.; Miran, H.A.; Almatarneh, M.H.; Jiang, Z.T.; Dlugogorski, B.Z. Catalytic hydrogenation of p-chloronitrobenzene to p-chloroaniline mediated by γ-Mo2N. ACS Omega 2018, 3, 14380–14391. [Google Scholar] [CrossRef] [Green Version]
  26. Altarawneh, M.K.; Jaf, Z.N.; Oskierski, H.; Jiang, Z.T.; Gore, J.; Dlugogorski, B.Z. Conversion of NO into N2 over γ-Mo2N. J. Phys. Chem. C 2016, 120, 22270–22280. [Google Scholar] [CrossRef]
  27. Zaman, S.F.; Pasupulety, N.; Al-Zahrani, A.A.; Daous, M.A.; Al-Shahrani, S.S.; Driss, H.; Petrov, L.A.; Smith, K.J. Carbon monoxide hydrogenation on potassium promoted Mo2N catalysts. Appl. Catal. A-Gen. 2017, 532, 133–145. [Google Scholar] [CrossRef]
  28. Hargreaves, J.S.J. Heterogeneous catalysis with metal nitrides. Coord. Chem. Rev. 2013, 257, 2015–2031. [Google Scholar] [CrossRef]
  29. Ganin, A.Y.; Kienle, L.; Vajenine, G.V. Synthesis and characterisation of hexagonal molybdenum nitrides. J. Solid State Chem. 2006, 179, 2339–2348. [Google Scholar] [CrossRef]
  30. Marchand, R.; Tessier, F.; DiSalvo, F.J. New routes to transition metal nitrides: And characterization of new phases. J. Mater. Chem. A 1999, 9, 297–304. [Google Scholar] [CrossRef]
  31. Geng, D.C.; Zhao, X.X.; Chen, Z.X.; Sun, W.W.; Fu, W.; Chen, J.Y.; Liu, W.; Zhou, W.; Loh, K.P. Direct synthesis of large-area 2D Mo2C on in situ grown graphene. Adv. Mater. 2017, 29, 1700072. [Google Scholar] [CrossRef] [PubMed]
  32. Geng, D.C.; Zhao, X.X.; Li, L.J.; Song, P.; Tian, B.B.; Liu, W.; Chen, J.Y.; Shi, D.; Lin, M.; Zhou, W.; et al. Controlled growth of ultrathin Mo2C superconducting crystals on liquid Cu surface. 2D Mater. 2016, 4, 011012. [Google Scholar] [CrossRef]
  33. Xu, C.; Wang, L.B.; Liu, Z.B.; Chen, L.; Guo, J.K.; Kang, N.; Ma, X.L.; Cheng, H.M.; Ren, W.C. Large-area high-quality 2D ultrathin Mo2C superconducting crystals. Nat. Mater. 2015, 14, 1135–1141. [Google Scholar] [CrossRef] [PubMed]
  34. Hong, Y.L.; Liu, Z.; Wang, L.; Zhou, T.; Ma, W.; Xu, C.; Feng, S.; Chen, L.; Chen, M.L.; Sun, D.M.; et al. Chemical vapor deposition of layered two-dimensional MoSi2N4 materials. Science 2020, 369, 670–674. [Google Scholar] [CrossRef] [PubMed]
  35. Wang, L.F.; Liu, D.; Wu, B.; Wang, J.M.; Zhang, L.Z.; Chen, C.; Su, Y.Y.; Yin, H.Y.; Zhang, J.N.; Gogotsi, Y.; et al. Ultrafast growth of thin hexagonal and pyramidal molybdenum nitride crystals and films. ACS Mater. Lett. 2019, 1, 383–388. [Google Scholar] [CrossRef]
  36. Ma, Y.C.; Lu, S.; Han, G.R.; Liu, Y.; Chen, Z.P. Chemical vapor deposition of two-dimensional molybdenum nitride/graphene van der Waals heterostructure with enhanced electrocatalytic hydrogen evolution performance. Appl. Surf. Sci. 2022, 589, 152934. [Google Scholar] [CrossRef]
  37. Geng, D.C.; Wu, B.; Guo, Y.L.; Luo, B.R.; Xue, Y.Z.; Chen, J.Y.; Yu, G.; Liu, Y.Q. Fractal etching of graphene. J. Am. Chem. Soc. 2013, 135, 6431–6434. [Google Scholar] [CrossRef]
  38. Li, M.H.; Li, L.; Fan, Y.X.; Jiao, F.; Geng, D.C.; Hu, W.P. From top to down—Recent advances in etching of 2D materials. Adv. Mater. Interfaces 2022, 9, 2201334. [Google Scholar] [CrossRef]
  39. Ahmed, A.; Sharma, S.; Adak, B.; Hossain, M.M.; LaChance, A.M.; Mukhopadhyay, S.; Sun, L. Two-dimensional MXenes: New frontier of wearable and flexible electronics. InfoMat 2022, 4, e12295. [Google Scholar] [CrossRef]
  40. Wang, J.; Xu, X.; Qiao, R.; Liang, J.; Liu, C.; Zheng, B.; Liu, L.; Gao, P.; Jiao, Q.; Yu, D.; et al. Visualizing grain boundaries in monolayer MoSe2 using mild H2O vapor etching. Nano Res. 2018, 11, 4082–4089. [Google Scholar] [CrossRef]
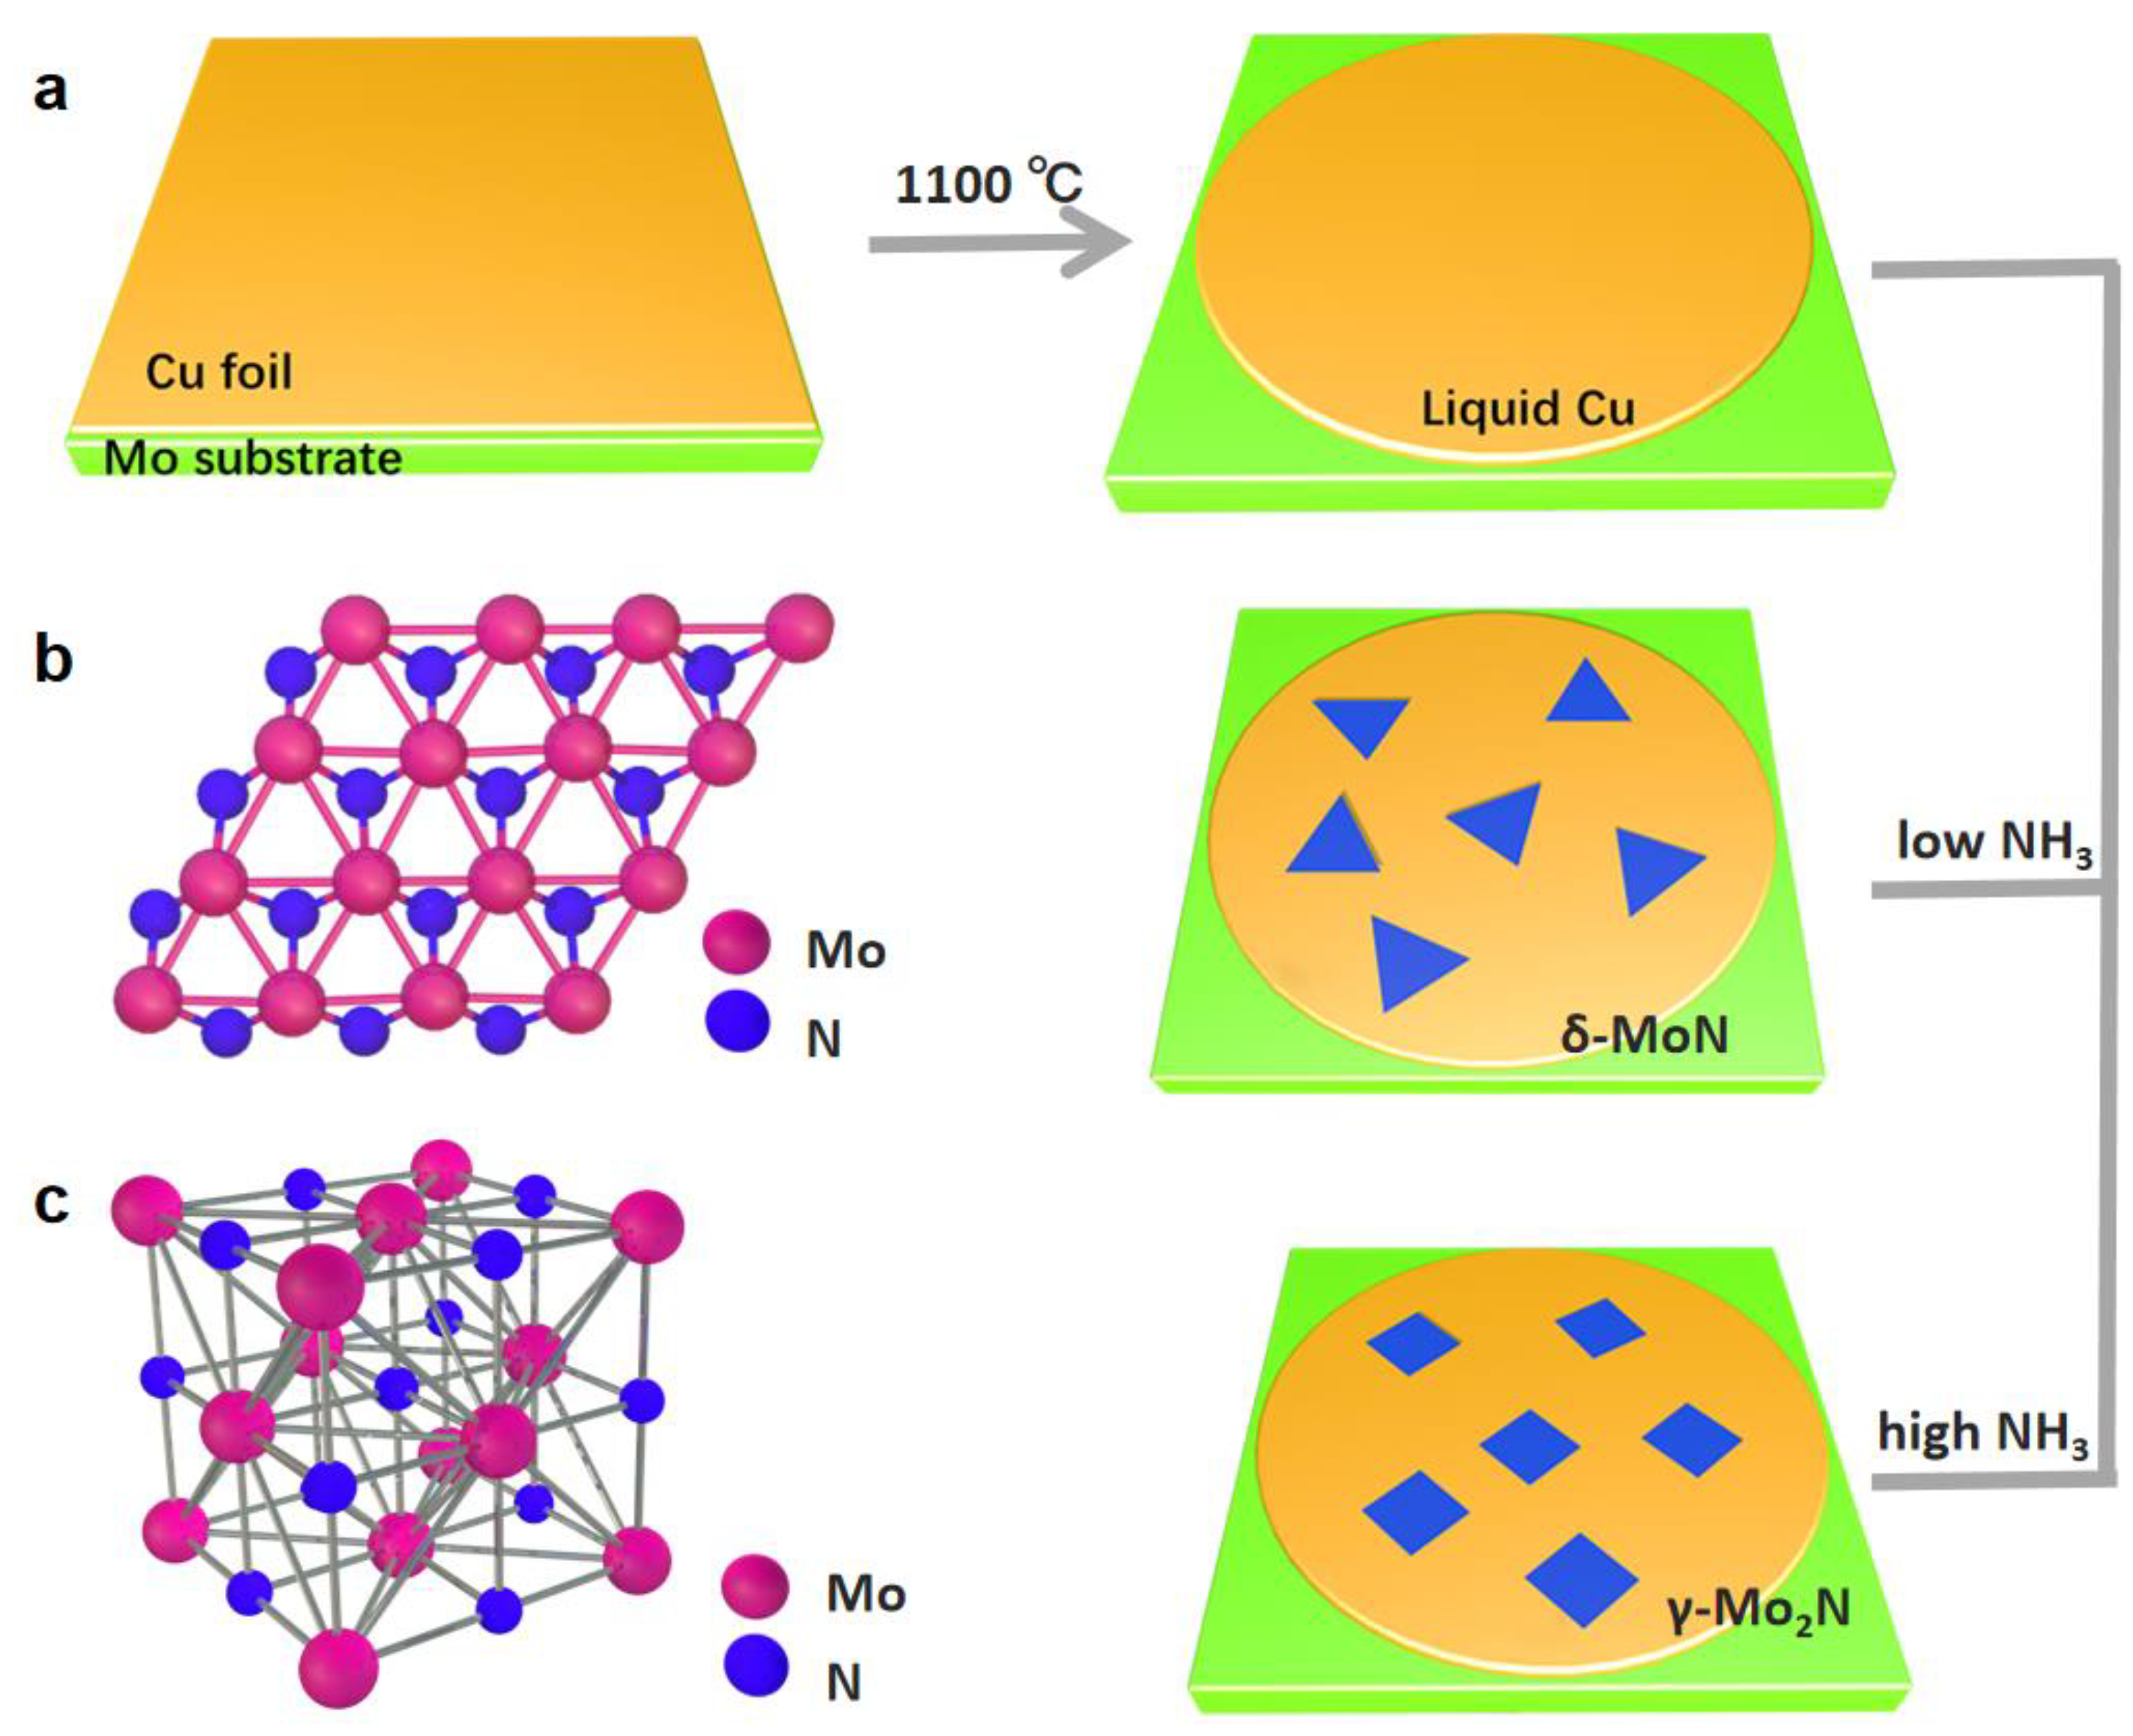
Figure 1. Schematic showing the MoxNy crystals with different phases grown on the liquid Cu substrate. (a) The preparation of liquid Cu substrate and CVD growth of triangle δ-MoN and square γ-Mo2N crystals. At lower NH3 gas flow, δ-MoN grows into triangle crystals. But square γ-Mo2N crystals are grown at higher NH3 gas flow. (b) Crystal diagram of δ-MoN flakes. (c) Crystal diagram of γ-Mo2N flakes.
Chemosensors 11 00082 g001
Figure 2. Different crystalline phases of MoxNy crystals grown on the liquid Cu substrate. (a) Optical image of δ-MoN flake. (b) SEM of δ-MoN flakes. (c) Size statistics of δ-MoN flakes at a region of 40 × 40 μm. (d,e) Optical image and SEM of γ-Mo2N flakes. (f) Size statistics of γ-Mo2N flakes at a region of 40 × 40 μm. The scale bars are 20 μm in (a) and (d). The scale bars are 5 μm in (b) and (e).
Chemosensors 11 00082 g002
Figure 3. Characterizations of as-prepared γ-Mo2N crystals. (a) TEM image of γ-Mo2N crystal. The scale bar is 1 μm. (b) SAED pattern of γ-Mo2N crystal. The scale bar is 5 1/nm. (c) HRTEM showing γ-Mo2N crystal is single-crystalline. The scale bar is 5 nm. (d) XRD pattern of γ-Mo2N and the corresponding JCPDS file results. (e,f) XPS spectra of Mo 3d and N 1s for γ-Mo2N crystals.
Chemosensors 11 00082 g003
Figure 4. The morphology evolutions of δ-MoN and γ-Mo2N domains with increasing growth time. (ac) Schematic diagram of the morphology evolution of two types of MoxNy. (di) Typical SEM images of δ-MoN (df) and γ-Mo2N (gi) flakes at various growth times: 8, 9, 10 min. The scale bars are 5 μm.
Chemosensors 11 00082 g004
Disclaimer/Publisher’s Note: The statements, opinions and data contained in all publications are solely those of the individual author(s) and contributor(s) and not of MDPI and/or the editor(s). MDPI and/or the editor(s) disclaim responsibility for any injury to people or property resulting from any ideas, methods, instructions or products referred to in the content.