Abstract
Electronic noses (e-noses) are devices based on combining different gas sensors’ responses to a given sample for identifying specific odor fingerprints. In recent years, this technology has been considered a promising novel tool in several fields of application, but several issues still hamper its widespread use. This review paper describes how some physical confounding factors, such as temperature, humidity, and gas flow, in terms of flow direction and flow rate, can drastically influence gas sensors’ responses and, consequently, e-nose results. Among the software and hardware approaches adopted to address such issues, different hardware compensation strategies proposed in the literature were critically analyzed. Solutions related to e-nose sensors’ modification, design and readout, sampling system and/or chamber geometry design were investigated. A trade-off between the loss of volatile compounds of interest, the decrease of sensors’ sensitivity, and the lack of fast responses need to be pointed out. The existing body of knowledge suggests that the e-nose design needs to be highly tailored to the target application to exploit the technology potentialities fully and highlights the need for further studies comparing the several solutions proposed as a starting point for the application-driven design of e-nose-based systems.
1. Introduction
Electronic noses (e-noses) are devices that mimic the olfactory system by combining nonspecific gas sensors’ responses to identify a specific odor or a smell-print [1]. This technology is based on interactions between gas sensors and volatile chemical compounds, both organic (VOCs) and inorganic, such as NH3, H2S, or greenhouse gases, generally representing a class of compounds with high vapor pressure at room temperature responsible for odor perception. As these volatile compounds usually result from chemical reactions, their detection can be used to monitor processes in different fields of application [2,3], including the food industry [4,5,6], for monitoring food quality and production; healthcare [7], for monitoring changes in metabolic processes; or environmental studies [8,9], for monitoring industrial emissions and their impact on citizens’ daily life. Comparing the structure of the mammalian olfactory system with a generic e-nose, four components can be identified: (1) the biological nose structure, which corresponds to the sampling block in e-noses to collect the target gas from its source; (2) the olfactory cells, which correspond to an array of specific and/or nonspecific gas sensors; (3) the olfactory bulb, in which acquisition of the signals is performed on the biological side, while in e-noses this role is played by standard analog signal acquisition systems; and (4) the central nervous system which, in biology, is where signals are processed, whereas in e-nose systems, machine learning techniques are implemented to reconstruct odor fingerprints [10]. With respect to standard analytical techniques (such as GC-MS), the e-nose does not pretend to identify specific volatile compounds in the target gas but to identify specific patterns of the whole gaseous mixture [11]. The advantages of the e-nose, especially over chemical analyses, include low cost, ease of use, and the ability to provide a fast response to complex mixtures, making it a powerful technology for volatile chemical compound analysis.
Despite e-nose technology being widely recognized as a potentially groundbreaking technology since its introduction, several challenges still limit the applications of gas sensing and e-noses in research activities; [12] real-life and industrial applications are still very rare, with some exceptions related to environmental odor monitoring, especially in Europe, where the use of e-noses is sometimes prescribed in plant permits [13,14,15,16]. The main issues with real-life application of e-noses are related to the poor stability of sensors’ responses due to the well-known effects of sensor drift, scarce reproducibility, and cross-sensitivity to several physical factors [12], which determine the kinetics and thermodynamics of the surface chemical reaction between the gas and the sensor active layer, and therefore significantly affect the sensor’s response [17]. Over the past several years, software strategies have been widely developed for addressing sensor drift compensation and scarce reproducibility by means of calibration transfer techniques, while for cross-sensitivity to physical factors, two approaches can be considered. First, the proper design of the system hardware, including the sampling system, the sensor chamber, and the sensors, can be optimized to reduce such interferences physically. Second, the effect of the interferences can be compensated for using software strategies, such as compensation algorithms based on empirical models [3,18]. Regarding software strategies [19], there are a wide range of studies specifically discussing the possibility of compensating for the effects of humidity variations by means of empirical models and machine learning algorithms, which entails the need to carry out specific training for the acquisition of sensors’ responses accounting for different humidity levels [20,21,22,23,24]. For example, Yan et al. [25] proposed a compensation model based on a power–law response. They used absolute humidity values to compensate for RH and temperature at the same time. The absolute humidity was fitted exponentially with the response of the sensor in order to compensate for humidity variations. On the other hand, Nenova et al. [24] implemented artificial neural networks (ANNs) to compensate for sensors’ responses to both temperature and RH variations. These correction approaches based on empirical models to be applied after data acquisition can provide an interesting perspective not only for humidity but also for other interfering factors such as temperature and flow. Nonetheless, since interferences can also negatively affect the quality of the signal, for instance by reducing sensors’ sensitivity to the target volatile chemical compounds, the implementation of hardware compensation strategies becomes fundamental when high sensor sensitivity is needed. Indeed, such strategies can generally include actions on the sampling system leading to pre-treatment of gaseous mixtures to mitigate their content of water [26], on the sensors’ chamber design properly tuning the flow rate and direction of the samples to be analyzed [27,28] and on the sensors in terms of sensors’ design or sensors’ readout to disfavor water molecules adsorption on sensors’ surface, promote the adsorption of the compounds of interest and improve the quality of sensors’ signals during the acquisition [29,30,31].
This review paper aims to provide an overview of the current limitations and proposed solutions when designing either an electronic nose system or a new study based on e-nose technology. Since the literature regarding gas sensing is extensive, this review focuses on the most relevant methods reported in the literature to overcome such criticalities for e-nose technology hardware development, including gas sensor selection and design, sample gas conditioning, and sensors’ chamber design and geometry.
In Section 3, an overview of the effects of the most relevant confounding factors is presented. Based on the literature and on the author’s direct experience, the following confounding factors, which are considered particularly critical in e-nose applications, have been selected [26]: target gas humidity (Section 3.1), temperature (Section 3.2), and flow (Section 3.3). Even if there are studies reporting possible effects of target gas pressure on sensors’ response [32,33], we decided to neglect this possible source of errors, as its effects appear to be small for relatively small target gas pressure variations [34,35], and most e-nose applications are usually designed to be operating at approximately ambient pressure. In Section 4, hardware compensation strategies aiming to improve the quality of e-nose sensors’ responses are reported in three different paragraphs: gas sensor choice and design (Section 4.1), sampling strategies to limit the effects of the confounding factors described in Section 3 (Section 4.2), and sensors’ chamber geometries (Section 4.3). Even if the confounding factors mentioned in Section 3 are, in some systems, compensated for by using data processing strategies, we consider these approaches out of the focus of the review and, therefore, they will not be described in this paper. Section 2 is an introductory paragraph to present the most used technology in gas sensors for e-nose applications, and Section 5 reports the analysis of the findings.
We selected 226 publications, including journal papers, book chapters, norms, and patents, ranging from 1982 (the year of the first publication describing the electronic nose) to June 2023. The papers were selected from Scopus, and works published in the last 20 years have been preferred with respect to works published before.
2. Sensor Technologies Used in E-Nose Systems
Various types of gas sensors are typically used in e-nose systems, differing in working principle, sensitivity, selectivity, response time, energy consumption, reversibility, and fabrication cost [36,37]
In this section, we provide a short description of the most common sensor technologies used in e-nose systems grouped by working principle:
- Chemo-resistant
- ο
- Conducting polymers (CPs): The first e-nose prototypes were realized with this kind of sensor. When exposed to target gases at ambient temperature, polymer conductivity is changed, with the transduction mechanisms being still unknown. CPs can be either used as they are, doped to enhance their response, or modified by adding other polymers, resulting in a composite polymer [38,39];
- ο
- Metal oxide semiconductor (MOSs): Changes in resistance are due to redox reactions involving the oxygen of the semiconducting metal oxide. The magnitude and the dynamic of the response are volatile compound-dependent. MOS sensors must be operated at temperatures between 197 °C and 397 °C, the temperature range in which oxygen is ion-sorbed as O−, enhancing the redox reactions [40]. MOS sensors are by far the most commonly used in e-nose systems because of their low cost, high sensitivity to several families of compounds (ppm and sub-ppm levels), and high level of customization. The most diffused metal oxide materials are semiconducting transition metals (e.g., TiO2, Fe2O3, NiO, and Cr2O3) and post-transition metals (e.g., SnO2 and ZnO) because of their facilitated ability to create electron-hole pairs [41]. MOS sensors can comprise n-type or p-type materials, referring to the capacity of the materials to interact with the target gases using free positive or negative charges due to the abundance of electrons in the valence band [40,42]; as a consequence of this different interaction mechanism, the direction of the sensor’s resistance to reducing and oxidizing gases will be different, as indicated in Table 1;
 Table 1. MOS Sensors: Resistance changes for n-type and p-type sensors when exposed to gas [40].
 - ο
- Graphene and carbon nanotubes (CNTs): The interplay between gas molecules and carbon-based materials leads to the exchange of charges between the sensing layer and the gas molecules. This process alters the material’s conductivity, facilitating the identification of diverse gas concentrations. Additionally, they exhibit extended response and recovery times [43].
- Chemically sensitive field-effect transistors (ChemFETs): This sensor utilizes MOSFET technology and operates based on the principle that the MOSFET’s threshold voltage shifts upon interaction with specific gases. This interaction is facilitated via a catalytic metal, which leads to corresponding alterations in the work functions of both the metal and oxide layers. These work function changes are driven by the polarization of the surface and interface of the catalytic metal and oxide layer when exposed to the gas on the catalytically active surface. To allow for the sensor’s physical changes, the metal insulator interface must be accessible to the gas. Consequently, a porous gas-sensitive gate material is employed to facilitate gas diffusion into the material [44].
- Capacitive sensors: Capacitive sensors are composed of dual interdigitated electrode arrangements mirroring the configuration of the plates in a conventional capacitor. These sensors measure alterations in the dielectric coefficient of the polymer situated between the electrodes when the analyte is absorbed. Consequently, chemocapacitors (also known as di-electrometers) hinge on shifts in the dielectric attributes of the sensing material following the introduction of an analyte [45].
- Electrochemical (EC): Reduction or oxidation happens on catalytic electrode surfaces, given that this type of sensor is more selective than MOS and CP [2,46,47];
- Piezo-based chemical sensors:
- ο
- Quartz crystal microbalance (QCM): Quartz is used as an oscillator by applying a voltage difference to its ends. The surface is coated with various materials, and when target compounds are absorbed, the quartz oscillation frequency changes with the mass change [48,49];
- ο
- Surface acoustic wave (SAWs): These consist of coated piezoelectric material. The coating is done with sensing material, typically polymeric. Voltage deformations are induced, and a reaction between the target gas and the sensing material causes changes in deformations’ velocity and attenuation [48,50];
- Optical sensors: These belong to a family of sensors where the changes in optical properties (color, transmission, etc.) of a sensing element are used to detect volatile compounds or their patterns [37,44].
- Photoionization detector (PID): Target gases are ionized by ultraviolet light with high-energy photons. The ions produce a current that is the output of the detector; this type of sensor only provides an indication of the total amount of volatile chemical compounds in a gaseous mixture [51,52].
This list is provided as a reference to the reader for understanding the different sensor types mentioned in the next sections. Indeed, since MOS sensors are the most commonly used in e-nose systems, most of the approaches discussed in this review refer to this type of sensor. Other sensor types are also mentioned in some cases, although the relevant scientific studies are scarce.
3. Physical Factors Affecting E-Nose Sensor Responses
3.1. Humidity
Humidity is one of the main interferents often discussed in literature because it significantly affects sensors’ responses, altering their sensitivity to the target gases [53,54]. The moisture content of the air analyzed by e-noses is generally expressed in terms of relative humidity or, less frequently, absolute humidity. Relative humidity (RH) is the ratio between the vapor pressure of air and its saturation vapor pressure, usually expressed in terms of a percentage value indicating the amount of moisture stored in air under those conditions (i.e., temperature and pressure) with respect to the maximum capacity of air to contain water under the same conditions. On the other hand, absolute humidity represents the amount of water present in a volume of dry air, generally expressed in g/m3.
Several studies have dealt with e-nose applications in many different fields, such as healthcare and diagnostics, environmental odor monitoring, or industrial process control, discussing the effect of the moisture levels recorded by the humidity sensor installed in the e-nose chamber on the sensors’ responses.
As a general rule, the presence of humidity results in a shift of the whole baseline of the e-nose sensors, reducing the amplitude of sensors’ responses and, consequently, decreasing the sensors’ sensitivity.
The effect of humidity on MOS sensors is particularly studied since those sensor types are the most used in e-nose technology. Yan et al. reported ethanol analyses at different absolute humidity values (namely, 0.05, 0.25, and 0.35 g/m3) employing MOS sensors including commercial ones, such as TGS-2602 and MP135, and home-made ones based on WO3 and SnO2, resulting in a decrease of the sensors’ responses with the increase of water vapor content regardless of concentration [25]. A decline of gas sensors’ responses was also observed by High et al. when looking at the ratio between the resistance in air and the resistance of pure gases analyzed under laboratory conditions by means of In2O3 sensors [55] and by Yoon et al. with respect to the corresponding air-dry analysis [56]. By plotting sensors’ responses, temperature, and relative humidity onto a 3D surface plot, Abdullah et al. observed the lowest sensor responses when temperature and humidity were the highest, anticipating the effect of temperature on sensors that will be discussed in the next paragraph [57]. Similar trends can be observed in other types of sensors, such as SAW, optical, electrochemical, and QCM sensors, always showing a competitive mechanism of interaction between volatile chemical compounds and water molecules intervening in the working mechanism on which the outputs of sensors are based [53,58,59,60,61,62,63,64,65,66,67].
Clearly, the application of e-noses for environmental odor monitoring in the field is particularly critical in this regard because of the well-known variability of humidity in ambient air. Indeed, the variation of humidity levels could interfere with the working mechanisms of low-cost sensors usually employed in air quality measurements, such as MOS, electrochemical, and nondispersive infrared sensors [68,69]. As an example, Romain et al. observed a decrease in sensors’ responses with the increase of the relative humidity level during field experiments [70,71]. The influence of such parameters, such as seasonal meteorological effects typical of long-term applications, clearly emerged in an in-field e-nose application developed by De Vito et al. for the estimation of benzene by means of a device equipped with seven MOS sensors installed in an urban area [72]. With the purpose of developing a sensor array dedicated to environmental odor monitoring, the behavior of several types of MOS sensors according to different humidity rates was observed by Helli et al., underlining a decrease in sensitivity of some sensors (some of them showed responses independent from target gases’ water content), towards two environmental pollutants, i.e., H2S, NO2, analyzed at different humidity levels with dry atmosphere as reference air [73]. Sohn et al. demonstrated the humidity cross-sensitivity of conducting polymer sensors observing a shift in the plot of sensors’ response PCA on data regarding the monitoring of odor abatement performance of a biofilter [74].
It should be further highlighted that, besides the humidity content of the sample gas to be analyzed, the humidity level of the reference air should be considered. Suppose the reference air and the sample have different humidity contents. In that case, it will result in a variation in the sensor’s resistance when the input gas is changed from the reference air to the sample. This variation is not correlated with a different concentration of volatile chemical compounds. Thus, a proper setting of comparable water content between the reference air and the target gases is required. The two contributions to the sensor’s response would need to be separated [67,73,75].
3.2. Temperature
When speaking about the effect of temperature on e-nose sensors’ responses, two different types of temperatures should be considered: the sensor’s operating temperature and the gas sample’s temperature.
The sensor’s operating temperature, i.e., the temperature at which the active, sensitive layer is heated, is a crucial parameter, especially for MOS or graphene-based sensors, as the surface reactions highly depend on the sensing element temperature [40,76]. CP sensors work at ambient temperature, but it has been demonstrated that an increase in working temperature can increase sensitivity and decrease sensor poisoning up to approximately 70 °C, when the polymers start degrading [40,76].
The effect of the sensor’s temperature is widely studied in the scientific literature [77,78,79,80,81]; it affects sensor surface reactions, which can lead to different responses. In the literature, three different approaches for this effect are presented. On one hand, the temperature modulation approach results in operating sensors at different temperatures in the same array. This can lead to an increase of information that can be used for better classification [77,78]. Secondly, the operating temperature of the sensors can be optimized to increase mutual information [79], and finally, it has been proved that stabilization of the operating temperature with closed-loop control systems can increase sensors’ performance [80]. Even if the proposed approaches can now enhance the quality of the signal, some limitations to these solutions still need to be closely investigated, starting from the measurement of the actual operating temperature on the sensor surface in the most-used gas sensors or the effect of temperature variations on the sensor’s surface reaction. For this reason, this work will focus only on the effects of the gas temperature on the sensors’ responses [40,76].
Indeed, some studies have evaluated the impact of the gas temperature on MOS sensor responses: Romain et al. [70] observed that when e-noses based on MOS sensors are used in the field for environmental odor monitoring, a decrease in the ambient air temperature results in an increase in the sensor resistance, which in turn can alter the MOS sensor responses. A similar behavior was observed by Kashwan et al. [22], who applied an e-nose for the analysis of tea flavor, and Abidin et al. [81], who also reported a decrease in the sensors’ response to different levels of toluene in the range between 25 °C and 40 °C. Huerta et al. [81] came to the same conclusion in their work when they monitored the air quality in a toilet, as did Peterson et al. [82] in the measurement of nitrogen dioxide and ozone in urban environments. One work by Knobloch et al. [83] presents the dependence of target gas temperature on conductive polymer response. The authors conclude that the change in the response could be related to the fact that changes in temperature lead to a greater or lower concentration of volatiles in the headspace, which will generate different sensor responses, but further studies need to be carried out to evaluate the exact effects, as this temperature effect can mask sensors’ responses that can affect classification.
3.3. Flow
One of the main factors affecting gas sensors’ response is the sampled gas flow, as proven by several studies focusing their attention on the impact of this factor.
When speaking about the variations of gas flow over e-nose sensors, it should be considered that, in some applications, sampling and analysis are performed at different times. In contrast, in others, sampling and analysis occur at the same time. Considering the first kind of applications, the storage of the target gas via different techniques (e.g., Tedlar® bags [84], NalophanTM bags [85], adsorption materials [86], etc.) is required, and a later analysis is performed. In these cases, the central aspect that should be taken into account is the chamber geometry and the stability of the gas flow rate during the analysis phase. On the other hand, where there is no storage of the samples, the sensors’ response can be influenced by the flow regime of the target gas. Considering, for example, the biomedical field, e-noses are widely applied to exhaled breath analysis [87,88], which is intermittently generated and characterized by specific flow waveforms [89] that, if not adequately controlled, can result in artifacts in the sensors’ responses. Furthermore, in environmental monitoring applications where e-noses are typically installed outdoors in the open air, wind can cause alterations to the flow regime inside the sensor chamber. Gas flow variations can also occur in home or car air quality monitoring applications and home appliances, where internal fans typically affect the gas flow conditions.
However, to be more specific, the effect of gas flow should be considered by distinguishing three different flow-related aspects.
3.3.1. Flow Rate
The standard approach for e-noses requires that the target gas flows continuously in the sensor chamber, and the flow rate is the first flow-related aspect affecting sensor responses discussed in this work.
In a study by Madhavi et al. [28], the authors demonstrated the relationship between flow rate and sensors’ response. This study first presents a mathematical simulation of an MOS sensor’s (TGS2620, Figaro Engineering, Osaka, Japan) responses to changing flow rate and position of the sensor in the chamber. Then, measurements were performed in a setup identical to the simulated one. Five different flow rates (0.3, 0.6, 1.2, 1.8, and 2.4 L/min) and three different test gases (methanol, ethanol, and propanol) were considered. The authors conclude that response time decreases with flow increase while the amplitude of sensors’ response increases with increasing flow, thus demonstrating that increasing the gas flow rate improves the sensors’ responses in both terms of response rate and intensity. The authors also simulated the temperature on the sensor plate, which obviously decreases with the flow. As mentioned in the previous paragraph, up to now, it has not been possible to directly measure the working temperature in this kind of sensor, as they work in an open-loop control configuration, so the considerations of this effect are based only on the simulations, and no direct measurement is reported.
Despite no direct measurements of the relationship between gas flow rate and MOS sensor operating temperature being reported in the literature, this aspect is crucial because the sensor sensitivity is highly dependent on the operating temperature [40]. Similar considerations are presented by Sedlak et al. [90] regarding polymeric homemade sensors. This work tests the sensor with a concentration of 3ppm of NO2 with flow equal to 0.1, 0.5, 0.8, and 1 L/min. Sensitivity, response time, recovery time, limit of detection (LOD), and repeatability are considered important parameters to be evaluated. Experimental results showed an improvement of all the parameters with increasing flow, except repeatability.
Conversely, some works [91,92] propose another approach, called stop-flow operation, where the chamber is filled up with the target gas, and then the inlet and outlet ports of the chamber are closed, and the flow is stopped. In all the works considered, the authors show that the sensors’ response highly depends on the flow rate, which can be regarded as equal to zero in stop-and-wait mode. When flow is stopped, the sensors’ response changes due to the change in the flow rate, generating a transient reading before reaching a new plateau. Since the transient is related mainly to the flow rate change, this part of the signal does not give any information on the sample volatile chemical compound’s content and therefore has to be discarded from the analysis. This leads to a loss of data that can be extracted from the sensors’ response curve since in other works, it has been proven that the transient phase is also an important source of information [12,93]. Despite the abovementioned limitations of the stop-flow operation mode, this mode can be combined with the normal operation mode to increase measurement information [91]. Indeed, considering the different sensor responses when varying the flow rates during the analysis of one target gas, the quantity of information provided by each sensor is increased, thereby introducing the concept of “flow modulation” to the sensors’ response. This operation mode may, in principle, improve e-nose classification performance, but further studies are required to analyze the effects in more detail.
3.3.2. Flow Direction
The direction of the target gas flow concerning the sensors’ active surface layer also affects sensor response. Since the beginning of the century, this aspect has been widely investigated via simulations and experiments. Lezzi et al. [94] proposed a simulation model considering different orientations and sensor distances with respect to the chamber inlet. The authors concluded that having the sensor near the chamber input and perpendicular to the flow can reduce the time needed to have a constant concentration on the sensors’ surface, reducing rising time and increasing the sensors’ response. Shyla et al. [95] confirmed this result, simulating how orientation affects gas speed on the sensor’s surface. They concluded that the lower the gas speed on the sensor’s surface, obtained with the perpendicular configuration between the flow and the sensors, the larger the time window in which a single molecule in the sampled gas can react with the active layer, resulting in higher and more complete response rate. Moreover, in a work by Sedlack et al. [90], which was already cited in the previous paragraph, besides the flow rate, the authors studied the effect of the orientation of the gas sensor on its response. In this experiment, the flow was set equal to 1 L/min and the concentration equal to 3 ppm of NO2. Four different orientations were considered (0°, 45°, 90°, and 270°), with 0° identified as parallel to the flow direction. Sensitivity, response time, recovery time, limit of detection (LOD) repeatability, and signal-to-noise ratio were evaluated. All the parameters, excluding repeatability, improved by increasing the angle from 0° to 90°. Also, when the angle was set equal to 270°, repeatability had an opposite trend compared to the other parameters, i.e., improving when all the others worsened. Another work by Ryu et al. [96] came to the same conclusion by testing an MOS sensor, changing the gas impact angle and the distance between the gas inlet and the sensor active layer. Three different angles were tested (0°, 45° and 90°), considering 0° the condition when the flow direction was parallel to the active layer. NO2 was considered the target gas, and its concentration was 5 ppm. Sensitivity was considered the target parameter for evaluating best performance. Results show that the best configuration to enhance sensitivity was at 90°. Finally, there is another work by Scott et al. [97] on quartz crystal microbalance gas sensors (QCM), presenting results that seem to contrast those previously mentioned [97]. In this study, the performances of an array of three gas sensors are compared. Three different experimental setups were considered: (a) sensors parallel to the flow direction, (b) sensors perpendicular to the flow direction, and (c) sensors parallel to the flow direction, placing a baffle between the gas inlet and the sensors. Response time (i.e., the time to reach a stationary response) was considered the target parameter, given that configuration (c) showed a faster response than configuration (b), which in turn showed better results than configuration (a). These results can be interpreted in different ways. First, QCM sensors rely on a transduction mechanism based on mechanical oscillations of the active part, which can be more sensitive to flow impact as it can directly modify the QCM vibration. Furthermore, in this work, a new element is introduced with respect to all the works mentioned until now, which is the consideration of how the flow regime condition in the chamber affects the sensors’ response. This is indeed the third flow-related aspect affecting sensors’ behavior investigated in the next paragraph.
3.3.3. Chamber Fluid Dynamic
In 2004, Scott et al. [97] introduced the observation that e-nose chamber fluid dynamics affect sensors’ responses. In this study, the presence of a baffle increases the performance of the sensors in terms of response time, resulting in a faster response compared to the perpendicular configuration, which on the other hand was proven to perform best in other works [90,94,95,96].
All the authors [27,94,98,99,100,101,102,103,104,105,106,107] focusing on the sensors’ chamber design agree that, inside the chamber, stable and uniform conditions should be reached as soon as possible. To ensure stable and uniform conditions, laminar flow is required in the chamber, with no stagnant or recirculating zones, which may result in a different exposure of the sensors to the target gas. Moreover, to ensure a reproducible test, all the sensors should come into contact with the gas simultaneously. Finally, it is important to remember that in ideal conditions, the concentration in the e-nose chamber can be described as [108]:
where C(t) is the function of the concentration, Cin is the input concentration, fin is the input flow rate, and V is the volume. According to Equation (1), the time to reach the steady state increases with the chamber volume and decreases with the flow rate. A possible approach to ensure a fast response would be to reduce the chamber volume to a minimum, which typically depends on the number and size of sensors used.
4. Hardware Compensation Strategies
This section presents the hardware strategies that can be implemented in e-nose systems to compensate for the physical factors affecting sensors’ responses, as described in the previous section.
Such solutions include modifications and specific designs related to the following components: (a) the sensors, in terms of either fabrication methods or readout; (b) the design of the sampling system; and (c) the chamber geometry.
As shown in Table 2, depending on the hardware component under consideration, the effect of different physical factors can be compensated for: acting directly on the sensors may reduce the effects of both humidity and flow, whereas a suitable design of the sampling system may also help compensate for temperature variations. On the other hand, the optimization solely of the chamber geometry and sampling gas flow can provide a solution for gas flow variations only, without counteracting the effects of sample humidity and temperature.
Table 2.
E-nose hardware components and relevant physical factors whose effects on the sensors’ responses can be reduced via their optimization.
4.1. Gas Sensors
A key aspect for tuning the performance of gas sensors, especially in terms of sensitivity and selectivity, is represented by the physical and chemical microstructures of the active materials deposited on gas sensors’ surfaces, whose interactions with the gaseous mixtures result in sensors’ responses [109]. This strictly depends on the material deposition methods (e.g., thermal evaporation, electron beam evaporation, sputtering, ion cluster deposition, chemical vapor deposition, inkjet printing, etc.), which, for example, in the case of MOS sensors influence the porosity and the size of the grains of the active materials [110,111] and consequently their properties. A general rule relies on the need to increase surface-to-volume ratio as much as possible to improve the amount of exchange surface-promoting molecule interactions [111]. Thus, recent discoveries in recent years have boosted the study and development of novel low-dimensional structured materials for gas sensing applications, such as 2D material-based sensors [30,112]. Considering the promising results obtained, different strategies based on the development and design of the sensors themselves have been investigated to reduce the influence of external factors on their responses. In the literature, modifications to the system’s hardware, in terms of sensors design, formulation, and signal acquisition have been described, especially for addressing the unwanted effects related to humidity and flow variations.
4.1.1. Sensors’ Modifications to Reduce Humidity Dependence
Extensive research has been carried out to improve the performance of gas sensors in environments characterized by high variability of the humidity level [113]. Indeed, chemo-resistive sensors, which are the most commonly used in e-nose systems because of their low price and partial specificity towards volatile molecules, have as a main drawback a strong dependence to the humidity of the analyzed gas [114]. The huge number of studies dealing with the interference of humidity with chemo-resistive sensors’ responses, including sensors based on polymers, metal oxides, and two-dimensional layered nanomaterials as sensitive materials, has been recently summarized by Wang and Zhou [30]. For this reason, in this paragraph, we decided to limit our discussion on this specific topic to a general overview of the results reported in the above-mentioned review paper, together with some considerations. According to the authors [30], anti-humidity strategies based on sensor characterization can be categorized into:
- surface engineering;
- physical isolation;
- working parameter modulation;
- novel material development.
The performance of the sensors modified according to these anti-humidity strategies has been tested in laboratory conditions via exposure to pure gases (namely H2, acetone, benzene, NOx, CO, CO2, trimethylamine, ethanol, NH3, H2S, toluene, formaldehyde, and acetylene), generally at low concentrations with some exceptions [115,116,117,118], at different humidity levels ranging from dry conditions to 98% RH. The scope of such studies often increases the sensitivity of sensors, reducing interferences in order to make them able to detect very low concentration levels of some specific compounds, sometimes few ppm or ppb levels, in very high-humidity matrixes, such as human breath [114,119,120,121,122]. Consequently, a key point of investigation is the improvement of the independence of sensors’ responses from humidity without compromising their sensitivity to target gases.
Surface Engineering
Surface engineering for gas sensor modification includes the doping of the sensitive materials with noble metals (e.g., Au, Ag, Pd, Pt, Ru, or Rh) or other elements, such as lanthanide elements (e.g., Pr, Ce, or Tb), transition metals (eg.g., Ni or Co), aluminum or antimony; the addition to the formulation of hydrophobic or hydrophilic materials; and post-treatments for ready-to-use chemo-resistant sensors. Noble metals have advantages because water molecules preferentially adsorb on their surface, thanks to their strong affinity for water, protecting the chemisorbed oxygen of the sensitive materials and catalyzing gas-sensing reactions [115,123,124,125]. In the same way, other elements work as adsorbers of hydroxyl groups from water, facilitating the formation of ionized oxygen species [122,126]. Even if the doping of sensitive materials with other elements reported interesting results, the functionalization with noble metals should be preferred because the humidity tolerance is generally achieved with an increase of sensitivity of sensors with respect to the unmodified gas sensors [124,127,128,129].
A different strategy to limit the influence of water molecules on sensors’ responses without affecting sensors’ sensitivity is to coat the sensors with a hydrophobic layer, which acts on the water contact angle, decreasing the hydrophilicity of the sensors surface. The wettability properties of sensitive materials can be modified by adding organic components (e.g., polydimethylsiloxane (PDMS), polyaniline (PANI), 3-aminopropyltriethoxysilane (APTES), polyvinyldenefluoride (PDVF), black phosphorous (BP), octadecyltrichlorosilane (OTS), polysterene (PS)) or/and inorganic hydrophobic materials (e.g., graphite, carbon, multiwalled carbon nanotube (MWCNT), SnS2, ZrO2, Y2O3, CeO2) to the sensitive materials [130]. In the same way, hydrophilic materials (e.g., NiO, CuO, anhydrous calcium silicate (CS), SiO2) can be used as sensors coating, serving as water accumulators protecting the active sites of sensors from water molecules interference. In this case, the quantity of hydrophilic material must be properly tuned to avoid the opposite effect of enhancing the humidity dependence of sensors [131]. Apart from chemo-resistant sensors, the implementation of hydrophobic or hydrophilic coating on the sensors’ surface is an approach that is widely employed for preventing humidity interference on other macro-categories of sensors implemented in e-nose arrays, such as piezoelectric and optical sensors [132]. The layer-by-layer (LbL) alternate adsorption of oppositely charged polyions (i.e., polycations such as polyallylamine hydrochloride (PAH) or polydiallyldimethylammonium chloride (PDDA) and anionic compounds, such as tetrakis-4-sulfophenyl porphine (TSPP) or tetrakis-4-carboxyphenyl porphyrin (TCPP)) is widely employed to prevent humidity interference in piezoelectric sensors [133]. Therefore, hydrophobic substrates consisting of organic or inorganic materials, such as reverse-phase silica thin-layer chromatography plates, polyethylene terephthalate (PET) film, cellulose acetate membrane, silica gel plate, polypropylene membranes, PVDF membrane, acetate sheet, or TiO2 nanoporous film, can be incorporated into colorimetric sensors’ surfaces to immobilize sensing probes, mitigating the physical and chemical changes occurring in water molecule interaction in the detection system [59]. In the same way, coatings of hydrophobic materials, such as reduced graphene oxide (rGO) [134], MWCNT [135], or methyl trichlorosilane solution [136], or hydrophilic materials, such as sol-gel CuO film [137], as well as post-treatment, such as proton beam irradiation, plasma fluorination, or chemical etching, are highlighted as treatments that improve resistance to humidity without negatively affecting the sensitivity of sensors, unlike fluorocarbon plasma [138].
An interesting possibility for increasing the humidity tolerance of sensors is the high-humidity aging of sensors since, as reported in some studies, sensors have a sort of “memory” effect on water molecules [139,140]. Indeed, Itoh et al. [141] studied the effect of high-humidity aging on Pd, Pt, and Au-SnO2 sensors compared with room air-aged and dry air-aged sensors, investigating at the same time the superimposed effect of two different anti-humidity strategies, namely noble metal doping and humidity-aging. Sensors were placed in a quartz tube in which either humid air, with a relative humidity of up to 90%, or dry synthetic air flowed at a rate of 250 mL/min. In the case of room air-aging, sensors were positioned in the quartz tube with both ends opened to ambient air. The quartz tubes were heated to 400 °C for two weeks and then cooled to ambient temperature and installed in the gas sensing measurement system. The three batches of sensors were tested with a synthetic mixture of VOCs at three different humidity levels (namely 25%, 50%, and 75%), demonstrating the independence of the humidity-aged Pt, Pd, and Au/SnO2 sensors from humidity variations occurring in working conditions. However, even though dry air-aged sensors showed higher responses than high humidity-aged sensors and room air-aged sensors at low humidity levels, the high humidity-aged sensors showed a response that was almost constant under all the humidity conditions. Moreover, the authors evaluated the effect of the humidity-aging treatment on Pt, Pd, Au/SnO2, and Pt/SnO2 sensors, resulting in a poorer performance by Pt/SnO2 than the sensors loaded with Pd and Au. While in this case the presence of Pd had clearly a central role in protecting sensors from water molecule adsorption, other researchers tried to understand the effect of humid aging on the oxygen adsorption in SnO2 gas sensors. Suematsu et al. [142] evaluated the oxygen adsorption properties and hydrogen sensing properties of SnO2 sensors after aging them in humid air at 580 °C. The authors found that hydroxyl poisoning was suppressed via humid aging because this treatment produces an increase in the amount of oxygen adsorbed, thereby increasing the electrical resistance in air. Consequently, sensor responses to hydrogen, even in humid conditions, were improved. Nevertheless, further studies are needed to study the stability of such aging-treated sensors over time.
Physical Isolation
Physical isolation using waterproof and selective membranes coating the sensors’ surface is another strategy that can be applied to overcome the problem of humidity interference in the sensors’ responses. Such membranes, such as polylactic acid (PLA) membranes, polydimethylsiloxane (PDMS) membranes, PTFE membranes, or alumina (Al2O3) nanomembranes, block water molecules thanks to either their hydrophilicity or their hydrophobicity due to water contact angle modification and, simultaneously, allow for the diffusion of the target gas molecules [143]. Other barriers, such as molecular sieves MCM-48 or SBA-15, act as desiccants, creating bonds between silica and hydroxyl molecules, thereby ensuring the diffusion of the gas molecules through their pores. In this case, a decrease in sensor sensitivity is often observed because of a decrease in diffusion efficiency through the membranes or sieves of the target gas molecules regarding the sensitive material. Therefore, a proper characterization of semipermeable material thickness is fundamental.
Tuning of Working Conditions
Also, the tuning of the working conditions of chemo-resistant sensors may have an effect on their sensitivity to humidity. For instance, an increase in the sensors’ operating temperature could facilitate the desorption of water and thus prevent the interference of water with sensors’ responses. One of the drawbacks of this strategy is that the sensitivity of the sensors, which is strongly influenced by the operating temperature, could be negatively affected. Indeed, Gupta et al. tested the implementation of microheaters in chemical-sensitive field effect transistors (ChemFETs) to increase the operating temperature of sensors [144]. They obtained a negligible decline in sensors’ responses to relative humidity changes, but a decrease in detection of the target gas (i.e., H2) was observed. A possible alternative could be to implement a UV-light illumination system that provides more thermal energy without affecting the sensitivity to the target gases [144], thereby improving water molecules’ desorption from the sensitive materials.
Besides strategies related to the sensors’ formulation and design to hamper humidity interference, another innovative approach could be based on signal acquisition. Potyrailo et al. [29] proposed an alternative readout method for MOS sensors (Figure 1). The authors performed dielectric excitation measurements on commercially available Figaro Sensors (TGS2611 and TGS2608). They carried out tests at RH between 0% and 80% and found that (1) the sensor baseline resulted less affected by humidity variations, (2) the sensor sensitivity increased with the increase in RH, and (3) the linearity of the response improved in the presence of water. Tests were also performed for gas temperatures ranging from −25 to 50 °C, and results showed that the sensors’ response is not affected by it when measured at specific excitation frequencies.
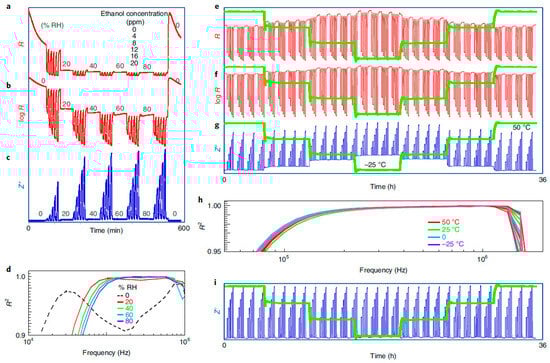
Figure 1.
In the work of Potyrailo [29], the impact of ambient humidity ranging from 0 to 80% RH on ethanol vapor exposure is examined in terms of resistance response, both on a linear scale (a) and logarithmic scale (b), as well as the dielectric response (Z″ at 0.17 MHz), which demonstrates a significant reduction in the influence of humidity (c). The frequency-dependent behavior of the R2 values, obtained via linear fitting at different RH levels, is also investigated (d). Furthermore, the effects of ambient temperature ranging from −25 to 50 °C on methane gas exposure are analyzed in relation to the resistance response, on both linear (e) and logarithmic (f) scales. The dielectric response (Z″ at 0.56 MHz) is also examined (g), along with the frequency dependence of the R2 values for varying ambient temperatures (h). Additionally, the temperature-insensitive dielectric response (Z′ at 2.7 MHz) is explored (i). Experimental details for the observations are provided as follows: For (a–d), the sensing element used is CCS801, with ethanol concentrations set at 0, 4, 8, 12, 16, and 20 ppm, while water vapor levels are set at 0, 20, 40, 60, and 80% RH. For (e–i), the sensing element utilized is TGS2611, with methane concentrations set at 0, 50, 100, 150, 200, and 250 ppm. The ambient temperatures employed are 50, 25, 0, and −25 °C, as indicated by the green lines in (e–g,i). Reprinted with permission from Ref. [29]. Copyright year 2020, copyright owner’s name Springer Nature.
Novel Materials Development
While some researchers have been focusing their efforts in improving the properties of sensitive materials employed in the production of chemo-resistant sensors, others have been developing novel materials accounting for novel structures, such as Ag2Te nanowires, nanoplates with Bi2Se3 film, 3D porous In2O3 microcubes, 3D reduced graphene oxide (rGO), ZnO needles, and PbTiO3 nanoplates, to produce novel sensors able to work under high moisture conditions [66,145]. Indeed, a promising possibility in gas sensing is represented by sensors based on 2D materials, such as graphene, transition metal dichalcogenides (TMDs), black phosphorous (BP), hexagonal boron nitride (h-BN), and MXenes [146]. Such 2D material-based sensors are generally characterized by very high sensitivity and low detection limits due to the increase of the contact surface area with the gaseous molecules [96,147], even at room temperature. In some cases, by tuning some physical parameters, a high conductivity level or high selectivity can be achieved [148,149]. Moreover, 2D material-based sensors could offer greater reproducibility in terms of sensor characteristics due to better control over the physical structure. This could help to control the humidity’s influence on sensors’ responses as reported, for example, by Donarelli et al., who demonstrated that the NO2 sensing signal of GO flake-based sensors is independent of RH changes [150].
Regarding MOS sensors specifically, although the most diffused n-type metal oxides have demonstrated their higher sensitivity to volatile molecules, p-type metal oxide-based sensors (e.g., CuO, NiO, and Co3O4) showed more stable response under humid conditions, having a limited shift in their baseline resistance at different RH levels. For example, Miao et al. produced a sensor for H2S detection independent from humidity, implementing an ultra-thin CuO nanosheet as the sensitive material, which proved to also be ultra-selective in the presence of other typical interfering compounds, such as toluene, ethanol, and acetone [151]. This pointed out the possibility of developing humidity-independent chemo-resistant gas sensors based on p-type metal oxides focused on improving their sensitivity and selectivity.
A further interesting perspective for obtaining humidity-independent gas sensors is the development of composite material-based sensors that can provide different morphological characteristics contributing to the different behavior of composite sensors’ responses concerning single metal oxide-based sensors [152,153]. Faia and Furtado investigated the responses of composite sensors based on a TiO2:ZnO pair, proving that the decrease of ZnO content in the sensor composition leads to a transition state from n- to p-type in the high humidity range, thus improving the stability of sensors’ responses when analyzing gases with a high moisture level [154].
4.1.2. Sensors’ Modifications for Reducing the Effects of the Gas Flow
Strategies based on modifying the sensors were also proposed to address the issues related to the effects of flow variations inside the e-nose chamber. Indeed, an option to reduce the impact of the flow by modifying the sensors’ structure is presented by Dong et al. [155]. In this case, the authors presented the modification of a standard thermal conductivity gas sensor by placing an obstacle on the sensor case to protect the sensitive part. They added obstacles of different sizes (from 0.2 mm to 0.5 mm) and shapes (e.g., cylinder, quadrangular prism), and then they evaluated the effect of the introduction of such obstacles by means of simulations and experiments with carbon dioxide and nitrogen. Based on their experimental results, the authors concluded that adding properly sized obstacles can increase the gas sensor’s accuracy by reducing the flow’s impact on it.
This result leads to some interesting additional considerations of the possibility of designing a suitable housing for the sensors. However, further studies are needed to evaluate the impact related to the presence of a housing on the responses and develop such studies also for other kinds of sensors that are more commonly used in e-nose applications (such as MOS, QCM, polymer sensors, etc.).
4.2. Sampling
4.2.1. Sampling Strategies to Control Sample Gas Flow Variations
The e-nose sampling system is a crucial component to be considered for addressing the issues related to the effects of flow variations on the sensors’ responses. As mentioned, the main solution to avoid flow variations on the sensors is to perform so-called ‘indirect sampling’. Indeed, in most studies regarding e-noses, sampling is conducted in an indirect way, which means that the analysis is performed offline after collecting the target gas in bags, sorbent tubes, or other equivalent storage systems [12]. In such cases, flow can be regulated by using pumps or mass flow controllers, which guarantee a constant flow rate during analysis with the e-nose [156,157,158].
However, in some cases, e-nose analysis is performed without using a sample storage system and thus applying so-called ‘direct sampling’, which minimizes the loss of volatile target compounds that may occur during storage [159]. This is typically the case for all types of applications where a continuous analysis is required (for example, environmental monitoring, process control, biomedical applications, etc.). Direct sampling can become particularly challenging when applied to breath analysis because of the intrinsic high flowrate variability associated with breathing (from 0 to 2 L/s). Despite these difficulties, two commercially available e-noses (The eNose Company, Zutphen, the Netherlands, and Breathomix, Leiden, the Netherlands) are specifically designed to sample exhaled breath directly [160,161]. In these devices, the subject exhales directly on the sensors, and software compensations based on data from sensors’ response compensation and normalization are carried out to reduce its impact. On the other hand, Tiele et al. [162] present a method for exhaled breath sampling where the subject breathes into a sampling tube and automatically, with a pump, the target gas is directed into the e-nose chamber with a controlled flow. This indeed represents a sort of ‘intermediate’ condition between direct and indirect sampling.
4.2.2. Sampling Strategies to Control Humidity Variations
The design and development of specific sampling systems has also been discussed in several papers with the purpose of limiting the interference of humidity variations on sensor responses.
To maintain a stable humidity level across measurements, some authors have kept the same RH level between the sample gas and the reference air used to clean the sensors between each measurement and set the instrument baseline [163,164,165,166,167,168,169,170,171,172,173]. To regulate the humidity of reference air to the same level as the target gas, one possibility is to mix a dry air stream with a humid air stream to obtain the desired RH level [174,175,176].
In other studies, the control is carried on only one line, either on the reference air or sample gas [177,178,179,180,181,182,183,184,185,186,187]. To control the humidity of the reference air, it is possible to use either: (a) synthetic air [163]; or (b) ambient air opportunely treated using filters, such as charcoal filters [180], active carbon filters [177,185,188], silica gel filters [164,177,179,185], specific cartridges filled with other solid desiccant materials (e.g., anhydrous sodium carbonate [184], phosphoric anhydride [189], or calcium chloride grains [190]), electrical dehumidifiers [168] or solutions with Ca(NO3)2 [191]. Reference air pre-treatment eliminates volatile molecule interference in the sensor’s baseline and reduces relative humidity, discarding the water molecules that interfere in the interaction mechanism with the active layer of e-nose sensors. To this end, Wilson et al. [177] developed an experimental protocol for the rapid identification and discrimination of phytopathogenic microbes, analyzing the volatile compounds released by these microorganisms from woody samples of a variety of plant hosts. The Aromascan A32S, commercialized by Osmetech, is equipped with 32 conductive polymer sensors whose sensitivity has been previously tested with organic compounds potentially relevant to microbial identification and was employed for the analysis. The sensor chamber was maintained at 30 °C, the reference air was preconditioned by passing ambient air through several filters, such as carbon, silica gel, inline, and Hepa filters, to not only decrease moisture content but also to remove potential background odors. The same reference air was used to create a static headspace for the woody samples stored in the sampling chamber at 25 °C. Indeed, reference air was set in general at 4% RH and regulated within 2% below sample air at 25 °C. The authors underlined the importance of maintaining low relative humidity in the reference air because this ensured that any additional water content was related to the samples.
The pre-treatment of target samples is still an open issue because, besides being strictly related to the type of application, treating the sample to regulate humidity generally entails the risk of altering its composition, which in turn may negatively affect subsequent pattern recognition [192]. In general, the samples provided to e-noses can be (1) synthetic samples [193,194], obtained by mixing known quantities of pure compounds stored in bottled gases; (2) gaseous real samples directly collected and analyzed [16,23,195] or (3) solid- or liquid-based samples analyzed by creating and further collecting a static or dynamic headspace enriching synthetic air or nitrogen with controlled temperature and relative humidity [164,166,177,196]. One of the easiest and most intuitive methods to control the RH level of analyzed samples relies on the permeability of the materials where the gas is collected and stored before the analysis. For example, NalophanTM, which is the most common material used for the storage of samples to be analyzed via dynamic olfactometry (according to EN 13725:2022 [197]), is highly prone to diffusion of small hydrophilic molecules (e.g., water, ammonia, or hydrogen sulfide) [85,198]. Bax et al. [199] used its permeability to humidity to reduce the moisture content of exhaled breath samples analyzed for detecting respiratory failures in patients affected by SARS-CoV-2. In this study, the samples were collected and stored for 2 to 24 h in ambient air under the same working conditions of the e-nose, which enabled the achievement of good stability and reproducibility of sensors’ responses. Based on the same principle, Capelli et al. developed a protocol for e-nose analysis of urine headspaces for prostate cancer diagnosis [196]. To limit the interferences of compounds out of interest on sensors’ responses, the authors prepared urine headspace samples in controlled conditions (i.e., T = 60 °C and RH = 10%) using a climatic chamber taking advantage of the NalophanTM’s capability to diffuse water molecules.
Another possibility to control the sample humidity is to use sample preparation techniques for pre-treating the samples before e-nose analysis by filtering [164,167,184,190,200], adsorption on traps [166,178,200], or by elution in chromatographic columns [189]. Considering filter-based sampling systems, Mahdavi et al. [190] studied a suitable way to control the humidity level of the system by deeply investigating several types of filters filled with activated carbons, CaCl2 grains, or silica gel. Temperature-modulated gas sensors’ (i.e., TGS-2602, TGS-822, FIS SB-30, FIS SP-53B) responses were evaluated regarding acetone, ethanol, 1-propanol, and 1-butanol. For the purposes of the study, the authors concluded that activated carbons and silica gel were not fit-for-purpose because, besides water, they also adsorbed part of the target gas, thus making that gas detection impossible. Following the same approach, Shafiqul et al. [164] implemented a silica gel-based filter in the air reference line and in the gas generation line to characterize the odor fingerprint of Eurycoma longifolia extracts. Eight QCM sensors analyzed the dynamic headspace of the samples at the same relative humidity level as the reference air. The authors reported a decrease in the e-nose system’s variance and an increase in the sensors’ sensitivity to some volatiles present at very low concentrations in the headspace. In another study, Aishima [200] proposed a sensor array consisting of six MOS sensors to discriminate between liquor aromas (namely cognac and four different brands of whisky). A pre-concentration system was implemented by means of Tenax and a silica gel filter aiming to remove excess ethanol while simultaneously decreasing water content. Tenax is an absorbent material widely used for concentrating hydrophobic trace volatile compounds in headspaces because of its heat stability and reversible desorption via heating. Thus, it is generally used to eliminate the interference of hydrophilic molecules, such as ethanol. Due to the promising results obtained via clustering and stepwise LDA discrimination of the different liquor samples, the author suggested the implementation of sensors insensitive to ethanol (as for water in other cases) to make the system more user-friendly and portable.
Moreover, some studies have proposed a comparison between different sampling procedures and sample preparation techniques to understand and investigate the effective advantages of samples pre-treatments. Campagnoli et al. proposed two different approaches to prepare durum wheat samples for e-nose analysis to recognize grains contaminated with deoxynivalenol [178]. They used a PEN2 e-nose (Airesense Analytics) equipped with MOS sensors, with or without samples, during the pre-treatment step. For sample pre-treatment, a Tenax trap was used. Different protocols for the experiments were developed: one without any pre-treatment and the other four with adsorption on the Tenax trap at four different desorption temperatures (namely 180 °C, 200 °C, 220 °C, and 240 °C). Even though higher intensities of sensor signals have been recorded when increasing desorption temperature, the best PCA discrimination and CART classification performance between controls and contaminated samples was achieved via the sampling protocol without the pre-concentration phase. The simplicity of such an e-nose system suggested to the authors that this preliminary approach should be implemented to carry out analyses directly in the field. Comparison between different sampling preparation methods was also provided by Lozano et al. for developing a gas sensor-based device in order to discriminate between five different Spanish wines. Three sampling methods were proposed based on a: (a) static headspace (HS); (b) purge and trap (P&T) unit with a Tenax trap and (c) solid-phase micro-extraction (SPME), typically used in GC-MS analyses. The sensor array consisted of 16 home-made SnO2 sensors, some of them doped with chromium and indium. The radial plot of the average responses of the sensors to the five wines showed that HS was the sampling method providing the highest responses. This may be attributed to the removal of water and ethanol via the P&T and SPME methods. However, different contributions of the sensors were observed for each sampling technique. This was reflected in better clustering in the PCA score plot and higher success rate in ANN classification for the SPME and P&T methods, showing a considerable improvement in e-nose signal detection system performance. Following the same approach, Hong et al. [184] implemented a paper filter filled with 5 g of anhydrous sodium carbonate to identify a suitable protocol for recognition and quantitative analysis of four different cherry tomato juices (one unadulterated and three adulterated groups). Measurements were performed both with an e-nose (PEN 2 by Airesense Analytics, Schwerin, Germany) and an e-tongue (α-Astree Alpha Mos, Toulouse, France). Since the original sample matrix was rich in water, samples were analyzed directly during or after pre-treatment, using anhydrous sodium carbonate as a desiccant. The comparison of the e-nose signals obtained with the two approaches highlighted a slight decrease in signal intensity when the target gas was pre-treated. This change trend was explained by the authors by a reduced amount of headspace reaching the e-nose chamber for the analysis. As final result, PCA showed a better discrimination ability as a system, including ANOVA-selected variables from both pre-treated and non-pre-treated e-nose and e-tongue dataset in the data processing [184].
A similar approach was developed by Yang et al. [166]. In their work, the focus was the identification of coumarin-enriched Japanese green teas by analyzing their headspace with e-noses. The device used in the study was a custom-made e-nose (namely the FF-2A Fragrance and Flavour Analyzer) consisting of an array of 10 different MOS sensors. Two different measuring modes were implemented, pumping the headspace tea aroma directly into the e-nose chamber (1) or through a trap tube (2), whose material was not specified, to increase the VOC concentrations and remove humidity in the sample. The resulting sensor signals proved that the two measuring modes affected sensors’ responses. Indeed, the signal amplitude of some sensors seemed to be higher for the measurements carried out using the trap tube mode compared to the direct measurements, suggesting that humidity in the sample needs to be controlled because it can affect sensors in different ways. Features were extracted from sensors considering both measuring modes and achieving good clustering of different tea samples in the PCA space. The results reported in these studies highlighted that, on the one hand, sample preparation procedure surely affects sensors’ responses, limiting the interfering compounds’ action but, on the other hand, its effects are still not always clear. In this sense, a precise evaluation of sensor curves is required, sensor by sensor, and specific data processing procedures must be developed. It is also interesting to see that different types of information on the system variability may be provided from sensors’ signals acquired with and without sample pre-treatment.
Other suggestions on how to deal with unwanted cross-sensitivities by acting on the sampling system may come from research works in which the authors do not focus on the limitation of water’s effect on sensors’ responses but deal with other interfering compounds, such as ethanol in alcoholic beverages. For example, Pinheiro et al. tried to develop an instrument to monitor the fermentation stages of wine [167]. In this study, the relative humidity level of the air reference and gaseous samples was kept constant (namely at 50% RH) to limit its interference in CP sensors’ responses, which are highly affected by water and ethanol. Aiming to bypass ethanol interference, a hydrophobic pervaporation membrane, selective for organic molecules, especially for esters, was implemented. The aroma compounds were concentrated in the permeate and subsequently analyzed, demonstrating a great improvement of the e-nose capability of identifying fermentation stages based on wine odor fingerprint and not on ethanol content. Even though this approach was designed for ethanol, it suggests that similar membranes with different properties may be adopted with the purpose of protecting e-nose sensors from the water effect, too. Moreover, other techniques such as the GC column back-flush were introduced for the e-nose analysis of beverages with the purpose of removing ethanol and water [189].
As a last consideration of this aspect, it is worth mentioning that in field applications, controlling the RH level of the gas entering the e-nose chamber is quite challenging [70,201]. Specific e-noses for environmental applications [202] have been developed and designed with a specific system able to adjust the sample humidity level to a fixed value independently from the external ambient conditions. Although highly complex, these instruments have been widely employed for environmental monitoring of plant emissions [14,195,203,204], especially at receptors, thanks to their ability to reach a very high sensitivity, as well as in food or microbiological studies [205,206,207,208,209,210]. The need for simpler, faster, and cheaper monitoring tools is pushing towards the diffusion of e-noses without any type of humidity control, also in field applications. However, in order to avoid a significant worsening of e-nose performance, the water content in the reference air and in the sample gas needs to be continuously monitored [190]. For this reason, in some cases, specific calibration procedures which must be repeated periodically [211], thus resulting in high costs and time consumption, have been developed [64,76,77]. As a matter of fact, the most recent literature concerning the use of e-noses for environmental monitoring applications report the numerous advantages of developing specific algorithmic compensation methods to counteract the effects related to the variations in relative air humidity, temperature and sensors drift over time [22,23,24,25,212].
4.3. Sensors’ Chamber Geometries
Chamber geometry is a crucial aspect for enhancing sensors’ response in terms of response time and reliability. With respect to what was discussed in Section 3.3, the requirements for an e-nose sensor chamber to guarantee fast and reliable responses are: (a) small volume, (b) no recirculation or stagnant zones, and (c) laminar flow. Furthermore, most works point out that having the active layer of the sensor perpendicular to the flow direction can enhance its response.
This paragraph presents and discusses a critical review of the possible chamber geometries proposed in the scientific literature to improve e-nose sensors’ responses. Falcitelli et al. [101] presented a work in which a commercial e-nose chamber and a modified version of the same were compared in a fluid dynamic simulation to demonstrate that some modification of the original geometry can enhance flow conditions (Figure 2). The original chamber is a parallelepiped with rounded corners and dimensions 33 × 54 × 8 mm. Sensors are arranged in four rows and four columns. In the modified geometry, the total volume is reduced by reducing the lateral spaces, and two diffusers have been added at the inlet and outlet to break up the jet, increasing uniformity and avoiding recirculation zones. Simulations were performed to evaluate the concentration distribution of a target gas within the chamber. Results show that the target concentration is reached in a shorter time and more homogeneously across the sensors in the modified geometry.
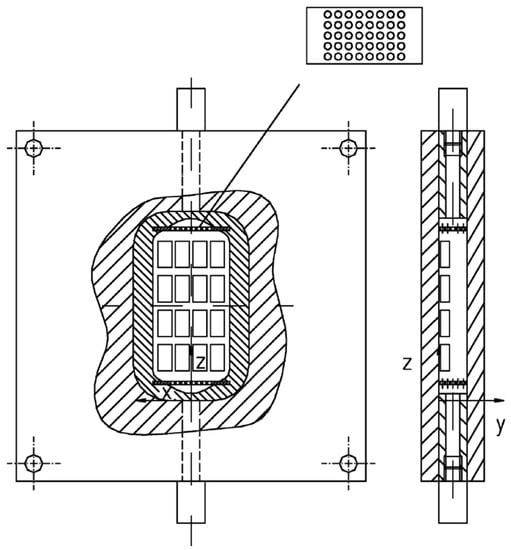
Figure 2.
Chamber presented by Falcitelli [101]. Lateral space is reduced, and a diffuser is placed at the input and output. Reprinted with permission from Ref. [101]. Copyright year 2002, copyright owner’s name Elsevier.
With the same purpose of optimizing the chamber geometry, Di Francesco et al. [100] proposed a radially symmetric chamber (Figure 3). This geometry can reduce stagnant or recirculating zones and ensure the same flow conditions over all the sensors. A PTFE flow splitter is used to deliver equal amounts of sample to all the sensors. Sensors are mounted on the lateral surface of the chamber, and for each sensor, two channels connect it to the splitter. Simulations were run, and the performance of the chamber was evaluated as follows: homogeneity of conditions in the chamber, the time needed for the concentration signal at the chamber outlet to reach 90% of the amplitude of the signal at the inlet (rise time), and the differences in the concentration profile at each sensor position (local rise times and signal amplitudes). Rise time was calculated as to equal 0.8 s, shorter than sensors’ response, inducing a negligible effect. Finally, according to their calculations, the authors state that deviations from the described geometry induced by work tolerances must be kept below a fixed limit to obtain the same concentration profiles at each sensor position.
Figure 3.
Schematic drawing of the measurement chamber proposed by Di Francesco [100]: (I) diametrical and (II) transversal cross-sections. Sample path is marked by arrows, while the tracts are indicated by circled letters: (a) input connection, (b) inlet collector, (c1) and (c3) radial channels, (c2) sensor cylindrical chambers, (d) outlet collector, (e) output connection. Reprinted with permission from Ref. [100]. Copyright year 2005, copyright owner’s name Elsevier.
Gonzalez Jimenez et al. [213] proposed a chamber geometry with reduced inner volume for robot applications (Figure 4). The chamber is equipped with seven MOS sensors and the flow is directed to the sensors’ active layer by a central diffuser activated in sequence to minimize the measuring time in robotic applications. Steady state was reached after 60 s.
Figure 4.
Different views of the chamber proposed by Gonzalez Jimenez et al. [213]: (a) upper view, (b) bottom view of the pneumatic circuit and the main block containing four chambers which can accommodate up to 8 MOS sensors each. Reprinted with permission from Ref. [213]. Copyright year 2015, copyright owner’s name IOP Publishing.
Performances are compared with respect to a standard e-nose, and results show that rising time decreases using the proposed chamber with reduced inner volume. Viccione et al. [27,102] published two studies to develop a chamber geometry following the radially symmetric chamber principles proposed by Di Francesco [100]. In the two studies, the authors present the evaluation of different radial diffusers to ensure the same flow conditions for all the sensors. The chamber is a cylinder with 16 sensors arranged on two layers. Four different diffuser geometries were compared by evaluating concentration at each sensor, average contact time at the sensor, and time to reach the steady state, and results showed that one of the considered geometries performed better than the others. Differently from Di Francesco, no considerations were made to evaluate possible errors related to the effective geometry of the diffuser when it is realized. This aspect is crucial because small deviations from the original design may cause high and non-controlled variability in the results which, in turn, may induce errors in the e-nose operation. Furthermore, no rationale is proposed regarding the choice of the different geometries studied, as they are just a few of all possible combinations.
Wang et al. [214] presented a possible chamber geometry to minimize size and internal volume (Figure 5). The proposed geometry has a circumference with an internal section of 16 × 20 mm and a net volume of 140 mm3. A total of 16 sensors are placed on the circumference, where the airflow can be clockwise or anticlockwise at a rate set equal to 0.5 L/min. From a first analysis, assuming perfect mixing and no edge effects on the surfaces, surfaces are exposed to the same conditions. However, a time shift between the sensors’ responses should be considered according to their spatial distribution. Moreover, since the sensors are placed on the same line, local flow conditions may be affected by the presence of the previous sensors, thus locally producing a non-controlled flow rate and concentration variations due to the reactions of the target gas with the previously encountered sensors.
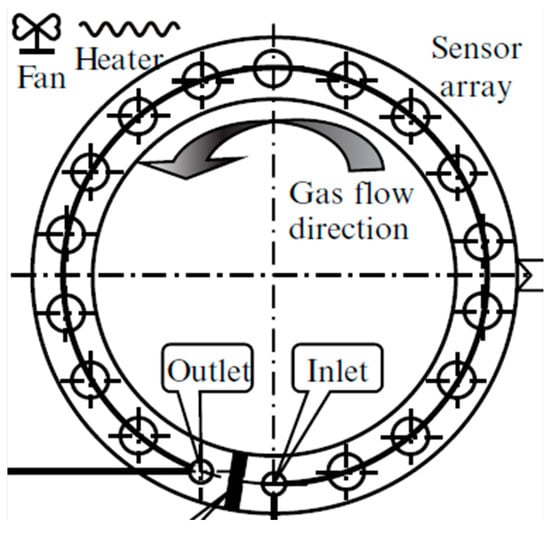
Figure 5.
Schematic diagram of the sensor chamber proposed by Wang et al. [214]. Adapted with permission from Ref. [213]. Copyright year 2015, copyright owner’s name IOP Publishing.
Chowdhury et al. [104] studied how to reduce the internal volume of a chamber, including an array of 64 conducting polymer sensors. Three geometries were considered: (1) a square shape with both inlet and outlet on the bottom of the chamber; (2) a square shape with the same dimensions as the previous one but with an additional zig-zag path from the input to the output to force the flow to pass through all sensors, and (3) the same shape as the previous ones, but with baffles to enhance vortexes near the sensors to mimic the human nose [215]. CFD simulations showed that the second design performed better than the other two because it guaranteed the same conditions to all the sensors. In contrast, the first chamber had many stagnant zones, and the last one presented a high hydraulic resistance, reducing the air speed to zero. With the same aim of reducing volumes, Bakar et al. [103] simulated the flow conditions inside two different chambers: one with a smaller volume, where sensors are placed in series, and a bigger one with sensors placed in parallel on the same plane. The authors carried out the simulations considering the same flow in both chambers and stated that the second one had better performance, resulting in a lower speed on the sensors’ surface and, consequently, a longer contact time between the target gases and the sensors’ active layer. However, in this study, they did not discuss how the two chambers’ different volumes may affect the sensors’ response. Indeed, keeping the same flow rate with different volumes will result in different flow conditions inside the chamber, which leads to different times required to reach the target concentration in the different regions and, therefore, in different sensors’ responses. Finally, despite stating the importance of avoiding recirculation or stagnation within the chamber in the introduction of their paper, the authors do not really consider this aspect, since the selected chamber geometry has stagnant and recirculation zones on its top. The importance of avoiding recirculating zones was also confirmed by Samiyan et al. [216], who compared three chambers’ geometries by simulating the flow distribution inside the chamber and performing tests on the rising time of MOS sensors when exposed to alcohol. The three geometries considered were selected as the most common in the literature: a rectangular chamber with an inlet and outlet on opposite sides, respectively; a cylindrical chamber with an inlet and outlet on the opposite sides, respectively, of the cylinder shell; and a hemispheric chamber with an inlet and outlet on two sides, respectively, of the hemispherical cap. In all cases, the sensors are placed on the bases of the chambers (Figure 6). The results show that the more widespread rectangular and cylindrical chambers, which are widely used in commercial e-noses, are affected by recirculation and stagnant zones. In contrast, such unwanted phenomena are less evident in the hemispheric chamber. This result is also confirmed via the observations related to the rising time, which is shorter in the hemispheric chamber.
Figure 6.
Sensor chamber geometries studied by Samiyan et al. [216]. (a) rectangular geometry, (b) hemispherical, (c) cylindrical. Reprinted/adapted with permission from Ref. [216].
In their studies, Annanouch et al. [105,217] compared the performances of a single sensor in two different chambers. The first chamber, known as “cross-shape”, has a volume of 0.3 L with an inlet flow equal to 1.5 L/min. The sensor is positioned in the center of the cross, perpendicular to the flow direction. The second chamber, called “boat-shape”, has a total volume of 2.35 × 10⁻³ L with an inlet flow rate between 0.01 L/min and 0.05 L/min. In this case, the sensor is placed on the bottom of the chamber, and the flow is parallel to the sensor’s active layer. Based on their simulations, the authors state that in the cross-shaped chamber, recirculation and stagnation zones are due to the direct impact of the gas flow on the sensor.
On the other hand, the presence of both recirculation and stagnant zones is reduced in the boat-shaped chamber. Finally, tests were carried out with three different ethanol concentrations (1, 5, or 10 ppm), showing that the sensor in the boat-shaped chamber has a shorter rising time and higher response. The authors concluded that the boat-shaped chamber performs better than the cross-shaped one because of the reduced internal volume and the reduction of stagnant and recirculating zones.
Again, to reduce the internal gas volume, Cheng et al. [107] proposed a novel geometry for a chamber containing eight gas sensors—three MEMS patch-type sensors—and one humidity sensor. The geometry consists of a cylindrical airflow space to accommodate the sensors, connected by a small channel. This geometry aims to direct the flow towards the sensors’ active layer and to reduce the internal volume, with a consequent reduction of the possible dilutions due to recirculating regions. Fluid dynamic simulations show that in this novel chamber, the analyte concentration is the same on all the sensors, and sensor response in real experiments with polyvinyl chloride (PVC) confirmed the simulated results.
Dohare et al. [110], who compared seven variations of a planar squared chamber containing an array of 64 sensors, used baffles to optimize the flow inside the chamber. The chamber is a parallelepiped of 52 × 52 × 10 mm. In three of the seven geometries considered, only the position of inlet and outlet were changed, being placed on the same axis, diagonally, and having two inlets and one outlet. The other four chambers had two inlets, one outlet, and four baffles to direct the gas and guarantee the same flow conditions on each sensor. Regarding the first three geometries, simulation results showed that the higher the flow rate, the lesser the stagnant zones, with the chamber having two inlets and one outlet achieving the best results. The configurations with baffles resulted in even better results in terms of achieving a more homogeneous and maximum mass fraction distribution over the sensors.
In Lopez et al. [106], the performance of two chamber geometries are compared. In this case, GFET sensors were used. The two chambers studied are “conventional” (cylindrical with a volume of 400 mL) and “cap” (U-shaped, volume equal to 1 mL). The input flow is set equal to 0.2 L/min for both the proposed geometries. Simulations show that the target gas concentration was reached in 5 min in the “cap” chamber, whereas in the conventional one up to 90 min were required due to the higher internal volume and the experimental observations of the GFET sensors’ responses to humidity confirm the simulated results. The authors state that this difference is due to the much smaller volume of the second chamber, which minimizes stagnant zones. Furthermore, the authors hypothesize that if the volumes were equal, a faster response could probably be achieved in the traditional chamber, since the gas flow direction is less perturbated.
In a study by Robbiani et al. [218], a cylindric chamber for high flow rates (1 L/s) was proposed (Figure 7). The chamber is divided into three sections. The first section is the input section, with rounded walls allowing for a homogeneous gas distribution within the chamber. The second section is designed to host eight MOS sensors with the active layer perpendicular to the flow direction. The sensors are distributed radially on two levels, four for each level. Each sensor is installed on a support protruding from the lateral wall to avoid regions in which the gas flow is affected by the interaction with the chamber walls (“wall effect”). The supports are 9.36 mm long, and their section has a drop shape to minimize perturbation on the flow conditions. The two sensors’ levels are rotated 30° with respect to each other, with a minimum distance between the two active layers equal to 12.5 mm. The last section of the chamber is the output section. The three sections are divided by two grids to linearize the flow. Each grid is composed of 1223 hexagons. The total internal volume of the chamber is equal to 259.25 mL. The results of the CFD simulations show that flow speed and direction are uniform over all the sensors. The simulated results were further confirmed experimentally via direct gas speed measurements at the different sensors’ positions.
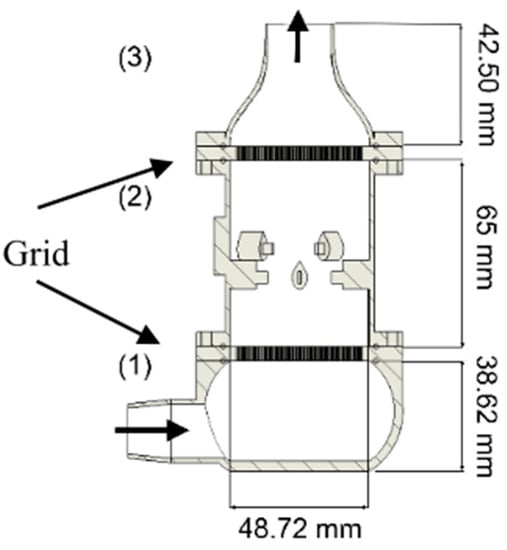
Figure 7.
Radial chamber proposed by Robbiani et al. [218] (1) input section, (2) MOS chamber, (3) output section. Reprinted with permission from Ref. [218]. Copyright year 2022, copyright owner’s name IEEE.
Moreover, there are two studies [219,220] proposing a different approach compared to all those presented above. They take inspiration from the shape of the nasal turbinate to investigate two different geometries, aiming to reproduce the biological characteristics of the human nose, where the flow is turbulent and stagnant zones are present. Therefore, the two geometries studied allow for a turbulent flow regime as well as stagnant zones to increase the contact time between the sensors and the target gases (Figure 8).
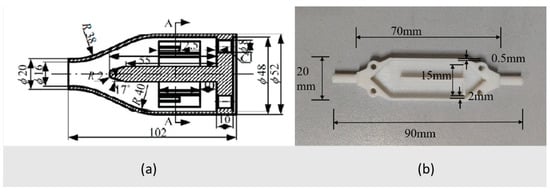
Figure 8.
Representation of the bionic chambers by (a) Chang et al. [219] and (b) Wang et al. [220]. Adapted with permission from Ref. [219]. Copyright year 2018, copyright owner’s name Springer Nature. Adapted with permission from Ref. [220]. Copyright year 2021, copyright owner’s name Elsevier.
5. Discussion
E-noses represent a very interesting and promising technology in different fields of application, even though—up to now—their spread has been limited by several technological challenges. Among these, the sensors’ cross-sensitivity to physical factors, such as sampled gas temperature, humidity, and flow conditions (which affect the kinetics and thermodynamics of the surface chemical reaction between the gas and the sensor active layer), is particularly challenging since it causes unwanted variations in the sensors’ responses not correlated to the composition of the gas under investigation.
To compensate for such unwanted cross-sensitivities, it is fundamental to deeply investigate the operating conditions and the associated specific effects of interferences related to the desired application.
Regarding humidity, several studies discuss how it affects sensors’ responses by modifying both the sensors’ baseline and the response amplitude [25,55,56,57]. The effect of humidity on sensors’ responses differs depending on the sensors’ technology. However, in most cases, there is a competitive interaction of the water molecules and the target gases with the sensor’s active layer [69,70].
Like humidity, changes in the target gas’s temperature modify both sensors’ baseline and response, consequently affecting e-nose outputs. In this case, the modifications are not related to a competitive interaction mechanism but to the impact of temperature on both the kinetics and thermodynamics of the surface reactions occurring between the target gas and the sensing material, which determine the sensor’s response [17,70,83].
Moreover, another physical factor that can greatly impact e-nose sensors’ response is sampled gas flow, both as flow rate and flow direction over the sensors’ surface [28,90]. In this paper, we reviewed several studies presenting CFD simulations and experimental tests to investigate flow’s effect on e-nose sensor responses. The primary outcomes may be summarized as follows:
- Higher flow rates tend to make the e-nose response faster, and changes in flow rate during operation affect sensors’ response [28,90];
- If the flow direction is perpendicular to the sensor’s active layer, the response is mostly faster and larger [90,94,95];
- To obtain a better and more reproducible response, the gas flow in the chamber should be laminar and as homogeneous as possible, meaning that all the sensors should be simultaneously exposed to the same gas flow [27,94,98,99,100,101,102,103,104,105,106,107];
- A small chamber volume and a geometry preventing stagnant or recirculating zones contribute to rapidly reaching a steady state concentration in the chamber, which, in turn, helps reach a stable sensor response [108].
Although the above-listed considerations apply to most sensor technologies, further studies should investigate some other crucial aspects that are still not fully understood.
First, regarding MOS sensors, while the competitive adsorption mechanism of water molecules on surface sensors has been widely investigated, thus enabling a better understanding the influence of humidity on sensors’ responses [221], studies regarding the effect of flow on sensors’ temperature, which is a well-known crucial factor affecting sensors’ properties, are lacking in the scientific literature. Moreover, for those sensor technologies that rely on mechanical transduction, such as QCM and SAW, the effect of flow rate is generally more complex, since on the one hand, it can enhance surface reactions, thus increasing the response, but, on the other hand, it may interfere with the mechanical behavior of the sensor, thereby impacting the final sensors’ response.
All the abovementioned considerations highlight that, in applications where humidity, temperature and/or flow variations may interfere with sensor response, proper strategies should be taken into account to counteract such effects. This can be done by designing suitable control strategies related to sample acquisition based on hardware modifications to minimize possible signal alteration, by implementing algorithmic compensation strategies in the data processing stage, or both.
In this review, we decided to focus on the hardware strategies. Indeed, the approach of developing specific algorithms to compensate for the effects of the considered physical factors may have a limited impact whenever the effects of the interfering factors are so pronounced as to fully mask the response to the target gases.
As discussed in this paper, the possible hardware compensation strategies can be applied to three main different components of an e-nose system, i.e., the sensors, the sampling system, and the sensor chamber.
Several works propose the development of specific sensors that are not affected by humidity variations, for example, for monitoring air pollutants [70,72,73] or trends of some biomarkers associated with specific diseases and present in very small concentrations (i.e., ppt level) in biological fluids, such as human breath [62,120,122]. The scientific literature [30] shows that sensors’ physical and chemical characteristics can be improved to reduce humidity’s undesired effects. However, since most of such treatments are handcrafted and still far from industrialization, specific studies are needed to verify the reproducibility of these sensors and the stability of their responses over time in long-term applications. Finally, it should be highlighted that most of the works discussing sensor modifications are carried out in laboratory conditions and mostly validated using pure compounds. While this can be a valuable first approach to study the feasibility of a solution, the performance of such sensors should be further tested with complex mixtures and then verified in real applications, where the presence of unpredicted environmental conditions or interferences may reduce the preliminary effectiveness assessed in the lab. Another solution recently described in one paper to reduce the undesired effects of humidity and temperature relies on the possibility of reading MOS sensors’ impedance via dielectric excitation, which apparently should make the reading less affected by such variations [29]. Future works need to develop techniques or new kinds of sensors to reduce their impact, acting both on new technologies and on new materials, and to define protocols to test their performance towards conditions expected in real applications (i.e., humidity variability, reliability of the results over time).
Another interesting perspective for limiting the impact of humidity, temperature, and flow interferences on sensors’ responses is to properly design the sampling system. However, such a strategy is difficult because it is strictly application-specific and thus hardly generalizable [26,192]. Indeed, several aspects of the application need to be taken into account when developing a ‘fit-for-purpose’ sampling system, such as the scope of the study and the intended output, the environment where the analyses will be carried out (i.e., indoor, outdoor, or laboratory), the physical state of the samples analyzed (i.e., gaseous, liquids, solids), and the expected concentration range of the volatile compounds characterizing the matrixes to be analyzed.
For these reasons, different sampling strategies can be investigated depending on the application type.
First, one general possibility is to consider sample storage in a suitable system before analysis, which in turn allows several actions to reduce the impact of interfering physical factors, especially those related to fluctuations in the target gas source. Once the target gas is stored, controlling the flow rate in the chamber is just a matter of selecting the right components (e.g., mass flow controllers, pumps), to ensure an optimal flow rate over time. Moreover, if polymeric bags are used for storage [196,222], they can be left in a controlled environment and exploit the bag’s material permeability to regulate the sample temperature and humidity to a desired level. One of the main challenges of this material-based control is related to the potential interactions of such materials with the target gases, which may lead to a loss of volatile compounds that could be of interest to the study’s goal [85,198]. In this scenario, materials such as polyvinyl fluoride (PVF, Tedlar®) and polyethylene terephthalate (PET, Nalophan NATM) are pointed out as appropriate containers for e-nose analyses because they are inert (i.e., they do not react with the target gas) and odorless [222]. However, a proper choice is always a trade-off between costs and experimental requirements. For example, Tedlar® is a very high-performing material, generally able to store target gases for long periods of time and preventing the loss of volatile compounds but also of humidity. Besides that, it is very expensive (ca. 30–50 euros per bag) and thus needs to be re-used, which makes it hardly compatible with strict requirements for cross-contamination, as in the case of biomedical applications where storage bags come into contact with biological fluids or their headspaces [223]. Therefore, to regulate the sample’s humidity level by relying on the bag’s permeability to water, Nalophan NATM could represent a better option to reach an equilibrium condition between internal and external humidity, thus guaranteeing a similar humidity level between the reference air and the sample. Another advantage is that NalophanTM is very cheap (the cost of each bag is <5 euros), making it suitable for a single use and thus preventing the risk of cross-contamination between samples. As a main drawback, as these bags are permeable to water and other compounds, especially those similar to water, i.e., hydrophilic molecules with low molecular weight such as NH3, H2S and CH2O, these can permeate the bag membrane, thus reducing the sample concentration and consequently the sensors’ response when exposed to the sample. Several studies are addressing the diffusion and adsorption of volatile compounds in NalophanTM bags, showing that significant losses may occur after just a few hours of storage, depending on different parameters such as the surface-to-volume ratio of the bags, the thickness of the polymeric layer, or concentration gradient between inside and outside the bag [85,198,222,224,225,226]. It should be further highlighted that the loss of volatile compounds through the sampling material is not necessarily negative. As an example, since ammonia sometimes interferes with MOS sensor responses, exploiting the bag’s permeability to ammonia may be beneficial for some applications where the initial ammonia concentration is particularly high, such as urine headspace analysis. Therefore, as a general consideration, it is important that those volatile compounds related to the condition under investigation and thus are essential for sample discrimination/classification are retained during storage, whereas the loss of interfering compounds (e.g., H2O and NH3) may represent an advantage for the analysis. From these considerations, it becomes clear that preliminary knowledge of the sample matrixes to be analyzed is very important when choosing the most suitable materials for proper sample storage. This also applies to all the sampling equipment that comes into contact with the target gas. In this context, it has been recently proven that stainless steel reduces the recovery of reduced sulfur compounds and, in particular, H2S, which makes it unsuitable for applications where the detection of such compounds is of interest, unless it undergoes a specific passivation process, meaning that it is covered with a layer of material that prevents H2S reduction, such as PTFE [222]. In conclusion, as a general rule, preliminary tests on materials are recommended in order to check their properties and prove that volatile compounds losses related to unwanted interactions or permeability do not affect the achievement of the goal of the application.
Another approach to control humidity is based on the introduction in the sampling system of desiccants used as filters or traps used as pre-concentrators, exploiting the hydrophilicity or hydrophobicity of the materials of such systems [177,178,184,189]. Even if properly tuned strategies usually have a positive effect on sensors’ responses, a general statement about the improvements related to introducing such sample pre-treatments on the e-nose performance is difficult to make. As a matter of fact, the vast diversities between studies using different types of filters or traps in terms of gas mixtures analyzed, final goal, signal pre-treatment and data processing procedure, which all have a significant effect on the e-nose outputs, make the comparison between those different studies quite challenging.
As already discussed for the materials used for sample storage, also in the case of pre-treatments involving desiccants or other adsorbent materials, there is always the concrete risk of cross-interferences with the target compounds, since the existence of perfectly selective adsorption systems when dealing with gas mixtures including hundreds of different compounds is still far from being a reality. Moreover, such systems usually significantly increase the instrument complexity and final cost.
Another drawback related to the use of desiccants is that they tend to produce totally dried air (RH ≈ 0). Based on the authors’ experience, the exposure of MOS sensors to dry air with a humidity level close to 0 makes the sensors hyper-sensitive to very small interferences, which in turn can lead to a critical increase of the signal-to-noise ratio.
Consequently, as a general rule, to regulate the water content on both reference air and sample line it is necessary to first carry out a proper feasibility study, to design a suitable system able to limit the interference of humidity on the e-nose sensors and enhance the response to the target gases without losing valuable information for the application. As an example, for some applications it could be useful to consider a combination with techniques inspired by analytical chemistry, such as the use of a chromatographic column before the e-nose to separate and exclude specific confounding factors such as water or ethanol [167]. The choice of the optimal strategy is application-specific, and it is highly depending on the gaseous matrix analyzed as well as the target of the designed application; for instance, when discriminating different alcoholic drinks, removing ethanol can be useful, whereas when monitoring the wine fermentation process, ethanol may be an important indicator of the progress of the fermentation reactions and its removal would negatively interfere with the results.
In conclusion, even if, as previously mentioned, pre-treating samples before analysis presents some drawbacks and needs to be properly tuned, implementing desiccants or other adsorbent materials in the sampling system could represent an interesting possibility for applications where real-time analysis in uncontrolled environmental conditions is required, but their feasibility in real-case applications is still under investigation. Future works must investigate the impact of humidity management strategies and how innovations on materials can lead to better performances up to online analysis.
Finally, several chamber geometries have been studied to optimize the impact of gas flow on the sensors. Different geometries have been proposed, but just a few of them effectively account for previously discussed theoretical aspects, such as the importance of a reduced volume, optimal sensors’ position, etc., as shown in Table 3. Since the studied geometries and the design parameters significantly diverge among the proposed prototypes, it is difficult to make detailed comparisons considering sensors’ performances and e-nose discrimination capabilities. Chambers with cylindrical geometries [27,100,103,217] and flow direction parallel to the axis seem to represent an interesting approach, as they have proven to present fewer recirculating zones, and their circular symmetry helps to expose the sensors to the same conditions.
Table 3.
Considered physical factors in chambers’ design.
However, in the case of the chamber geometries, it is important to highlight that the choice of the chamber should be customized to the specific application, based both on theorical considerations and on the knowledge of the specific problem to be addressed. For example, suppose there is no need of analyzing a small volume or no need of having a particularly fast response. In that case, the constraint regarding the small dimension of the chamber can be relaxed in favor of flow direction and flow stability across the measurement. Future works need to focus on reducing chamber volume and managing online analysis, ensuring the proper flow conditions and a time for analysis compatible with real-time applications [51,212] and stability of the sensors array during the analysis.
6. Conclusions
The studies considered in this review underline the fact that e-nose-based devices must be highly tailored to the target application to exploit the technological capabilities fully. An application-specific design should consider and exploit synergies between the e-nose hardware design and the data processing procedures. Nowadays, most of the research activity in artificial olfaction focuses mostly on data processing strategies. At the same time, device hardware is often less considered, and several applications rely on commercially available general-purpose, non-application-specific hardware systems. Despite studies showing that proper algorithms for data processing can be very effective, this review underlines the necessity of promoting efforts in designing custom-made hardware systems for data collection, focusing on designing the sensors’ choice, the sampling procedures, and the choice of sensors’ chamber design considering the specific characteristics and requirements of the application. This tailoring of the e-nose hardware can markedly increase the raw data quality, limiting cross-sensitivity of the confounding factors and leading to better performances.
The first step to creating an application-specific design is an in-depth analysis and understanding of the target gas’s properties, the end-user application, and the environment for which the e-nose system is designed to deal with interferences potentially affecting sensors’ output. As the applications that artificial olfaction is capable of addressing are highly complex, researchers willing to face the challenges of this technology need to address the design with a high grade of multidisciplinary for covering all the abovementioned needs.
As a second step, a comprehensive validation protocol that includes specific tests to evaluate the impacts of the overall cross-sensitivity of the system to the confounding factors evaluated in this review should be always defined and used to provide experimentally quantitative benchmarks. To this aim, consensus documents from international scientific societies providing guidelines on how to define such validation protocols would be helpful for supporting the spreading of this technology.
In conclusion, several studies proposed different strategies for designing an e-nose system able to minimize the cross-sensitivity of the device to the most important confounding factors. Even if there is still relevant margin for improvements, the systematic use of the existing knowledge already provides useful insights that should be fully exploited by developers of e-nose systems by implementing application-specific design approaches and rigorous validation protocols.
Author Contributions
Conceptualization, S.R., B.J.L., L.C. and R.L.D.; methodology, S.R., B.J.L. and L.C.; writing—original draft preparation, S.R. and B.J.L.; writing—review and editing, L.C. and R.L.D.; supervision, L.C. and R.L.D. All authors have read and agreed to the published version of the manuscript.
Funding
This work was partially funded by the National Plan for NRRP Complementary Investments (PNC, established with the decree-law 6 May 2021, n. 59, converted by law n. 101 of 2021) in the call for the funding of research initiatives for technologies and innovative trajectories in the health and care sectors (Directorial Decree n. 931 of 06-06-2022)—project n. PNC0000003—AdvaNced Technologies for Human-centrEd Medicine (project acronym: ANTHEM). This work reflects only the authors’ views and opinions, neither the Ministry for University and Research nor the European Commission can be considered responsible for them.
Informed Consent Statement
Not applicable.
Acknowledgments
The authors want to thank Aurora Pierantozzi for her contribution to literature review of chamber geometries.
Conflicts of Interest
The authors declare no conflict of interest.
List of Abbreviations
| Abbreviation | Reducing gas |
| CP | Conducting Polymers |
| MOS | Metal Oxide Semiconductor |
| CNT | Graphene and carbon-nanotubes (CNT) |
| ChemFET | Chemically-sensitive Field-Effect Transistor |
| EC | Electrochemical |
| QCM | Quartz crystal microbalance |
| SAW | Surface Acoustic Wave |
| PID | Photoionization detector |
| RH | Relative Humidty |
| PCA | Principal Component Analysis |
| LOD | Limit of Detection |
References
- Persaud, K.; Dodd, G. Analysis of discrimination mechanisms in the mammalian olfactory system using a model nose. Nature 1982, 299, 352–355. [Google Scholar] [CrossRef] [PubMed]
- Wilson, A.D.; Baietto, M. Applications and advances in electronic-nose technologies. Sensors 2009, 9, 5099–5148. [Google Scholar] [CrossRef] [PubMed]
- Karakaya, D.; Ulucan, O.; Turkan, M. Electronic Nose and Its Applications: A Survey. Int. J. Autom. Comput. 2020, 17, 179–209. [Google Scholar] [CrossRef]
- Mohd Ali, M.; Hashim, N.; Abd Aziz, S.; Lasekan, O. Principles and recent advances in electronic nose for quality inspection of agricultural and food products. Trends Food Sci. Technol. 2020, 99, 1–10. [Google Scholar] [CrossRef]
- Kiani, S.; Minaei, S.; Ghasemi-Varnamkhasti, M. Application of electronic nose systems for assessing quality of medicinal and aromatic plant products: A review. J. Dermatol. Sci. 2016, 3, 1–9. [Google Scholar] [CrossRef]
- Peris, M.; Escuder-Gilabert, L. A 21st century technique for food control: Electronic noses. Anal. Chim. Acta 2009, 638, 1–15. [Google Scholar] [CrossRef]
- Wilson, A.D.; Baietto, M. Advances in electronic-nose technologies developed for biomedical applications. Sensors 2011, 11, 1105–1176. [Google Scholar] [CrossRef]
- Capelli, L.; Sironi, S.; Del Rosso, R. Electronic Noses for Environmental Monitoring Applications. Sensors 2014, 14, 19979–20007. [Google Scholar] [CrossRef]
- Cipriano, D.; Capelli, L. Evolution of electronic noses from research objects to engineered environmental odour monitoring systems: A review of standardization approaches. Biosensors 2019, 9, 75. [Google Scholar] [CrossRef]
- Gardner, J.W.; Bartlett, P.N. A brief history of electronic noses. Sens. Actuators B. Chem. 1994, 18, 210–211. [Google Scholar] [CrossRef]
- Liu, X.; Cheng, S.; Liu, H.; Hu, S.; Zhang, D.; Ning, H. A survey on gas sensing technology. Sensors 2012, 12, 9635–9665. [Google Scholar] [CrossRef] [PubMed]
- Covington, J.A.; Marco, S.; Persaud, K.C.; Schiffman, S.S.; Nagle, H.T. Artificial Olfaction in the 21stCentury. IEEE Sens. J. 2021, 21, 12969–12990. [Google Scholar] [CrossRef]
- Cangialosi, F.; Intini, G.; Colucci, D. On Line Monitoring of Odour Nuisance at a Sanitary Landfill for Non-Hazardous Waste. Chem. Eng. Trans. 2018, 68, 127–132. [Google Scholar] [CrossRef]
- Bax, C.; Sironi, S.; Capelli, L. Definition and Application of a Protocol for Electronic Nose Field Performance Testing: Example of Odor Monitoring from a Tire Storage Area. Atmosphere 2020, 11, 426. [Google Scholar] [CrossRef]
- Ente Nazionale Italiano di Unificazione. UNI11761: Emissioni e Qualità dell’Aria—Determinazione degli Odori Tramite IOMS (Instrumental Odour Monitoring Systems); UNI: New Delhi, India, 2019. [Google Scholar]
- Bax, C.; Lotesoriere, B.J.; Capelli, L. Real-Time Monitoring of Odour Concentration at a Landfill Fenceline: Performance Verification in the Field. Ital. Assoc. Chem. Eng. 2021, 85, 19–24. [Google Scholar] [CrossRef]
- Rajagopalan, A.K.; Petit, C. Material Screening for Gas Sensing Using an Electronic Nose: Gas Sorption Thermodynamic and Kinetic Considerations. ACS Sens. 2021, 6, 3808–3821. [Google Scholar] [CrossRef] [PubMed]
- Rudnitskaya, A. Calibration update and drift correction for electronic noses and tongues. Front. Chem. 2018, 6, 433. [Google Scholar] [CrossRef]
- Yang, S.; Lei, G.; Xu, H.; Lan, Z.; Wang, Z.; Gu, H. A Review of the High-Performance Gas Sensors Using Machine Learning. In Machine Learning for Advanced Functional Materials; Springer Nature: Singapore, 2023; pp. 163–198. [Google Scholar]
- Zhang, L.; Tian, F.; Dang, L.; Li, G.; Peng, X.; Yin, X.; Liu, S. A novel background interferences elimination method in electronic nose using pattern recognition. Sens. Actuators A Phys. 2013, 201, 254–263. [Google Scholar] [CrossRef]
- Zhang, J.; Xue, Y.; Sun, Q.; Zhang, T.; Chen, Y.; Yu, W.; Xiong, Y.; Wei, X.; Yu, G.; Wan, H.; et al. A miniaturized electronic nose with artificial neural network for anti-interference detection of mixed indoor hazardous gases. Sens. Actuators B Chem. 2021, 326, 128822. [Google Scholar] [CrossRef]
- Kashwan, K.R.; Bhuyan, M. Robust electronic-nose system with temperature and humidity drift compensation for tea and spice flavour discrimination. In Proceedings of the 2005 Asian Conference on Sensors and the International Conference on New Techniques in Pharmaceutical and Biomedical Research, Kuala Lumpur, Malaysia, 5–7 September 2005; pp. 154–158. [Google Scholar] [CrossRef]
- Sohn, J.H.; Atzeni, M.; Zeller, L.; Pioggia, G. Characterisation of humidity dependence of a metal oxide semiconductor sensor array using partial least squares. Sens. Actuators B Chem. 2008, 131, 230–235. [Google Scholar] [CrossRef]
- Nenova, Z.; Dimchev, G. Compensation of the impact of disturbing factors on gas sensor characteristics. Acta Polytech. Hung. 2013, 10, 97–111. [Google Scholar] [CrossRef]
- Yan, M.; Wu, Y.; Hua, Z.; Lu, N.; Sun, W.; Zhang, J.; Fan, S. Humidity compensation based on power-law response for MOS sensors to VOCs. Sens. Actuators B Chem. 2021, 334, 129601. [Google Scholar] [CrossRef]
- Fuśnik, Ł.; Szafraniak, B.; Paleczek, A.; Grochala, D.; Rydosz, A. A Review of Gas Measurement Set-Ups. Sensors 2022, 22, 2557. [Google Scholar] [CrossRef] [PubMed]
- Viccione, G.; Spiniello, D.; Zarra, T.; Naddeo, V. Fluid dynamic simulation of odour measurement chamber. Chem. Eng. Trans. 2014, 40, 109–114. [Google Scholar] [CrossRef]
- Mahdavi, H.; Rahbarpour, S.; Goldoust, R.; Hosseini-Golgoo, S.M.; Jamaati, H. Investigating Simultaneous Effects of Flow Rate and Chamber Structure on the Performance of Metal Oxide Gas Sensors. IEEE Sens. J. 2021, 21, 21612–21621. [Google Scholar] [CrossRef]
- Potyrailo, R.A.; Go, S.; Sexton, D.; Li, X.; Alkadi, N.; Kolmakov, A.; Amm, B.; St-Pierre, R.; Scherer, B.; Nayeri, M.; et al. Extraordinary performance of semiconducting metal oxide gas sensors using dielectric excitation. Nat. Electron. 2020, 3, 280–289. [Google Scholar] [CrossRef]
- Wang, Y.; Zhou, Y. Recent Progress on Anti-Humidity Strategies of Chemiresistive Gas Sensors. Materials 2022, 15, 8728. [Google Scholar] [CrossRef]
- Yuan, Z.; Zhao, Q.; Duan, Z.; Xie, C.; Duan, X.; Li, S.; Ye, Z.; Jiang, Y.; Tai, H. Ag2Te nanowires for humidity-resistant trace-level NO2 detection at room temperature. Sens. Actuators B Chem. 2022, 363, 131790. [Google Scholar] [CrossRef]
- Kumar, J.; Singh, H.; Raj, V.B.; Nimal, A.T.; Gupta, V.; Singh, V.K. Trace Detection of Nerve Agent Simulant in the Fuel Vapour Environment using Metal Oxide Surface Acoustic Wave E Nose. Def. Sci. J. 2020, 70, 520–528. [Google Scholar] [CrossRef]
- Karimzadeh, R.; Assar, M. Effect of laser irradiation on CO gas detecting response of reduced graphene oxide sensor. RSC Adv. 2016, 6, 52817–52825. [Google Scholar] [CrossRef]
- Ammar, A.H.; Abo-Ghazala, M.S.; Farag, A.A.M.; Abdel-Moniem, N.M.; Farag, E.-S.M. Effect of gas type, pressure and temperature on the electrical characteristics of Al-doped SnO2 thin films deposited by RGTO method for gas sensor application. Vacuum 2013, 94, 30–40. [Google Scholar] [CrossRef]
- Abdurakhmanov, I.E.; Begmatov, R.K.; Abdurakhmanov, E.; Kholboev, O.N.; Kholmirzaev, F.F. Metrological parameters of semiconductor sensors of hydrogen sulfide SCS-H 2 S with membrane coatings based on tungsten and copper oxides. IOP Conf. Ser. Mater. Sci. Eng. 2020, 862, 062084. [Google Scholar] [CrossRef]
- James, D.; Scott, S.M.; Ali, Z.; O’Hare, W.T. Chemical sensors for electronic nose systems. Microchim. Acta 2005, 149, 1–17. [Google Scholar] [CrossRef]
- Illahi, A.A.C.; Dadios, E.P.; Bandala, A.A.; Vicerra, R.R.P. Electronic Nose Technology and Application: A Review. In Proceedings of the 2021 IEEE 13th International Conference on Humanoid, Nanotechnology, Information Technology, Communication and Control, Environment, and Management (HNICEM), Manila, Philippines, 28–30 November 2021. [Google Scholar] [CrossRef]
- Pirsa, S. Chemiresistive Gas Sensors Based on Conducting Polymers. In Handbook of Research on Nanoelectronic Sensor Modeling and Applications; IGI Global: Hershey, PA, USA, 2017; pp. 150–180. [Google Scholar]
- Bai, H.; Shi, G. Gas Sensors Based on Conducting Polymers. Sensors 2007, 7, 267–307. [Google Scholar] [CrossRef]
- Dey, A. Semiconductor metal oxide gas sensors: A review. Mater. Sci. Eng. B Solid-State Mater. Adv. Technol. 2018, 229, 206–217. [Google Scholar] [CrossRef]
- Henrich, V.E.; Cox, P.A. The Surface Science of Metal Oxides; Cambridge University Press: Cambridge, UK, 1994. [Google Scholar]
- Korotcenkov, G. Semiconductor Gas Sensors; Jaaniso, R., Tan, O.K., Eds.; Elsevier: Amsterdam, The Netherlands, 2020; ISBN 9780081025598. [Google Scholar]
- John, A.T.; Murugappan, K.; Nisbet, D.R.; Tricoli, A. An Outlook of Recent Advances in Chemiresistive Sensor-Based Electronic Nose Systems for Food Quality and Environmental Monitoring. Sensors 2021, 21, 2271. [Google Scholar] [CrossRef]
- Arshak, K.; Moore, E.; Lyons, G.M.M.; Harris, J.; Clifford, S. A review of gas sensors employed in electronic nose applications. Sens. Rev. 2004, 24, 181–198. [Google Scholar] [CrossRef]
- Patel, H.K. Sensor Used in E-Nose. In The Electronic Nose: Artificial Olfaction Technolog; Springer: New Delhi, India, 2014; pp. 143–180. [Google Scholar]
- Guth, U.; Vonau, W.; Zosel, J. Recent developments in electrochemical sensor application and technology—A review. Meas. Sci. Technol. 2009, 20, 042002. [Google Scholar] [CrossRef]
- Bakker, E. Electrochemical Sensors. Anal. Chem. 2004, 76, 3285–3298. [Google Scholar] [CrossRef]
- Nazemi, H.; Joseph, A.; Park, J.; Emadi, A. Advanced Micro- and Nano-Gas Sensor Technology: A Review. Sensors 2019, 19, 1285. [Google Scholar] [CrossRef]
- Vashist, S.K.; Vashist, P. Recent Advances in Quartz Crystal Microbalance-Based Sensors. J. Sens. 2011, 2011, 571405. [Google Scholar] [CrossRef]
- Devkota, J.; Ohodnicki, P.; Greve, D. SAW Sensors for Chemical Vapors and Gases. Sensors 2017, 17, 801. [Google Scholar] [CrossRef] [PubMed]
- Burgués, J.; Marco, S. Environmental chemical sensing using small drones: A review. Sci. Total Environ. 2020, 748, 141172. [Google Scholar] [CrossRef] [PubMed]
- Oh, Y.; Kwon, O.-S.; Min, S.-S.; Shin, Y.-B.; Oh, M.-K.; Kim, M. Olfactory Detection of Toluene by Detection Rats for Potential Screening of Lung Cancer. Sensors 2021, 21, 2967. [Google Scholar] [CrossRef]
- Chai, H.; Zheng, Z.; Liu, K.; Xu, J.; Wu, K.; Luo, Y.; Liao, H.; Debliquy, M.; Zhang, C. Stability of Metal Oxide Semiconductor Gas Sensors: A Review. IEEE Sens. J. 2022, 22, 5470–5481. [Google Scholar] [CrossRef]
- Korotcenkov, G.; Cho, B.K. Instability of metal oxide-based conductometric gas sensors and approaches to stability improvement (short survey). Sens. Actuators B Chem. 2011, 156, 527–538. [Google Scholar] [CrossRef]
- Oh, J.; Kim, S.H.; Lee, M.J.; Hwang, H.; Ku, W.; Lim, J.; Hwang, I.S.; Lee, J.H.; Hwang, J.H. Machine learning-based discrimination of indoor pollutants using an oxide gas sensor array: High endurance against ambient humidity and temperature. Sens. Actuators B Chem. 2022, 364, 131894. [Google Scholar] [CrossRef]
- Yoon, J.W.; Kim, J.S.; Kim, T.H.; Hong, Y.J.; Kang, Y.C.; Lee, J.H. A new strategy for humidity independent oxide chemiresistors: Dynamic self-refreshing of In2O3 sensing surface assisted by layer-by-layer coated CeO2 nanoclusters. Small 2016, 12, 4229–4240. [Google Scholar] [CrossRef]
- Abdullah, A.N.; Kamarudin, K.; Kamarudin, L.M.; Adom, A.H.; Mamduh, S.M.; Juffry, Z.H.M.; Bennetts, V.H. Correction Model for Metal Oxide Sensor Drift Caused by Ambient Temperature and Humidity. Sensors 2022, 22, 1–22. [Google Scholar] [CrossRef]
- Slimani, S.; Bultel, E.; Cubizolle, T.; Herrier, C.; Rousselle, T.; Livache, T. Opto-electronic nose coupled to a silicon micro pre-concentrator device for selective sensing of flavored waters. Chemosensors 2020, 8, 60. [Google Scholar] [CrossRef]
- Yu, J.; Wang, D.; Tipparaju, V.V.; Tsow, F.; Xian, X. Mitigation of Humidity Interference in Colorimetric Sensing of Gases. ACS Sens. 2021, 6, 303–320. [Google Scholar] [CrossRef]
- Pan, Y.; Zhang, L.; Cao, B.; Xue, X.; Liu, W.; Zhang, C.; Wang, W. Effects of temperature and humidity on the performance of a PECH polymer coated SAW sensor. RSC Adv. 2020, 10, 18099–18106. [Google Scholar] [CrossRef]
- Shen, Y.T.; Shen, C.Y.; Wu, L.; Huang, C.L. SAW sensors of organophosphorous compound with no humidity interference. Jpn. J. Appl. Phys. 2003, 42, 1358–1362. [Google Scholar] [CrossRef]
- Moon, H.G.; Jung, Y.; Han, S.D.; Shim, Y.S.; Jung, W.S.; Lee, T.; Lee, S.; Park, J.H.; Baek, S.H.; Kim, J.S.; et al. All villi-like metal oxide nanostructures-based chemiresistive electronic nose for an exhaled breath analyzer. Sens. Actuators B Chem. 2018, 257, 295–302. [Google Scholar] [CrossRef]
- Matsuura, Y.; Takahata, K.; Ihokura, K. Mechanism of gas sensitivity change with time of SnO2 gas sensors. Sens. Actuators 1988, 14, 223–232. [Google Scholar] [CrossRef]
- Wang, C.; Yin, L.; Zhang, L.; Xiang, D.; Gao, R. Metal oxide gas sensors: Sensitivity and influencing factors. Sensors 2010, 10, 2088–2106. [Google Scholar] [CrossRef]
- Xu, W.; Cai, Y.; Gao, S.; Hou, S.; Yang, Y.; Duan, Y.; Fu, Q.; Chen, F.; Wu, J. New understanding of miniaturized VOCs monitoring device: PID-type sensors performance evaluations in ambient air. Sens. Actuators B Chem. 2021, 330, 129285. [Google Scholar] [CrossRef]
- Ma, Z.; Yuan, T.; Fan, Y.; Wang, L.; Duan, Z.; Du, W.; Zhang, D.; Xu, J. A benzene vapor sensor based on a metal-organic framework-modified quartz crystal microbalance. Sens. Actuators B Chem. 2020, 311, 127365. [Google Scholar] [CrossRef]
- Mumyakmaz, B.; Özmen, A.; Ebeoǧlu, M.A.; Taşaltin, C.; Gürol, İ.I.; Ebeoğlu, M.A.; Taşaltın, C.; Gürol, İ.I. A study on the development of a compensation method for humidity effect in QCM sensor responses. Sens. Actuators B Chem. 2010, 147, 277–282. [Google Scholar] [CrossRef]
- Gordon Casey, J.; Hannigan, M.P. Testing the performance of field calibration techniques for low-cost gas sensors in new deployment locations: Across a county line and across Colorado. Atmos. Meas. Technol. 2018, 11, 6351–6378. [Google Scholar] [CrossRef]
- Maag, B.; Saukh, O.; Hasenfratz, D.; Thiele, L. Pre-Deployment Testing, Augmentation and Calibration of Cross-Sensitive Sensors; Junction Publishing: London, UK, 2016; pp. 169–180. [Google Scholar]
- Romain, A.-C.; Nicolas, J.; Andre, P. In situ measurement of olfactive pollution with inorganic semiconductors: Limitations due to humidity and temperature influence. Semin. Food Anal. 1997, 2, 283–296. [Google Scholar]
- NIMSUK, N.; NAKAMOTO, T. Study on the odor classification in dynamical concentration robust against humidity and temperature changes. Sens. Actuators B Chem. 2008, 134, 252–257. [Google Scholar] [CrossRef]
- De Vito, S.; Massera, E.; Piga, M.; Martinotto, L.; Di Francia, G. On field calibration of an electronic nose for benzene estimation in an urban pollution monitoring scenario. Sens. Actuators B Chem. 2008, 129, 750–757. [Google Scholar] [CrossRef]
- Helli, O.; Siadat, M.; Lumbreras, M. Qualitative and quantitative identification of H2S/NO2 gaseous components in different reference atmospheres using a metal oxide sensor array. Sens. Actuators B Chem. 2004, 103, 403–408. [Google Scholar] [CrossRef]
- Sohn, J.H.; Dunlop, M.; Hudson, N.; Il Kim, T.; Yoo, Y.H. Non-specific conducting polymer-based array capable of monitoring odour emissions from a biofiltration system in a piggery building. Sens. Actuators B Chem. 2009, 135, 455–464. [Google Scholar] [CrossRef]
- Szczurek, A.; MacIejewska, M. Relationship between odour intensity assessed by human assessor and TGS sensor array response. Sens. Actuators B Chem. 2005, 106, 13–19. [Google Scholar] [CrossRef]
- Yuan, Z.; Benck, J.D.; Eatmon, Y.; Blankschtein, D.; Strano, M.S. Stable, Temperature-Dependent Gas Mixture Permeation and Separation through Suspended Nanoporous Single-Layer Graphene Membranes. Nano Lett. 2018, 18, 5057–5069. [Google Scholar] [CrossRef]
- Di Giuseppe, D.; Catini, A.; Comini, E.; Zappa, D.; Di Natale, C.; Martinelli, E. Optimizing MOX sensor array performances with a reconfigurable self-adaptive temperature modulation interface. Sens. Actuators B Chem. 2021, 333, 129509. [Google Scholar] [CrossRef]
- Fort, A.; Machetti, N.; Rocchi, S.; Belén Serrano Santos, M.; Tondi, L.; Ulivieri, N.; Vignoli, V.; Sberveglieri, G. Tin oxide gas sensing: Comparison among different measurement techniques for gas mixture classification. IEEE Trans. Instrum. Meas. 2003, 52, 921–926. [Google Scholar] [CrossRef]
- Fonollosa, J.; Fernández, L.; Huerta, R.; Gutiérrez-Gálvez, A.; Marco, S. Temperature optimization of metal oxide sensor arrays using Mutual Information. Sens. Actuators B Chem. 2013, 187, 331–339. [Google Scholar] [CrossRef]
- Mielle, P. A cold case: TGS 8xx gas sensors electronics. In Proceedings of the 2022 IEEE International Symposium on Olfaction and Electronic Nose (ISOEN), Aveiro, Portugal, 29 May–1 June 2022; pp. 8–10. [Google Scholar]
- Abidin, M.Z.; Asmat, A.; Hamidon, M.N. Temperature drift identification in semiconductor gas sensors. In Proceedings of the 2014 IEEE Conference on Systems, Process and Control (ICSPC 2014), Kuala Lumpur, Malaysia, 12–14 December 2014; pp. 63–67. [Google Scholar] [CrossRef]
- Peterson, P.J.D.; Aujla, A.; Grant, K.H.; Brundle, A.G.; Thompson, M.R.; Vande Hey, J.; Leigh, R.J. Practical use of metal oxide semiconductor gas sensors for measuring nitrogen dioxide and ozone in urban environments. Sensors 2017, 17, 1–25. [Google Scholar] [CrossRef] [PubMed]
- Knobloch, H.; Turner, C.; Spooner, A.; Chambers, M. Methodological variation in headspace analysis of liquid samples using electronic nose. Sens. Actuators B Chem. 2009, 139, 353–360. [Google Scholar] [CrossRef]
- Shafiek, H.; Fiorentino, F.; Merino, J.L.; López, C.; Oliver, A.; Segura, J.; De Paul, I.; Sibila, O.; Agustí, A.; Cosío, B.G. Using the electronic nose to identify airway infection during COPD exacerbations. PLoS ONE 2015, 10, e0135199. [Google Scholar] [CrossRef] [PubMed]
- Sironi, S.; Eusebio, L.; Capelli, L.; Boiardi, E.; Del Rosso, R. Ammonia diffusion through nalophan double bags: Effect of concentration gradient reduction. Sci. World J. 2014, 2014, 214190. [Google Scholar] [CrossRef] [PubMed]
- Nakhleh, M.K.; Amal, H.; Jeries, R.; Broza, Y.Y.; Aboud, M.; Gharra, A.; Ivgi, H.; Khatib, S.; Badarneh, S.; Har-Shai, L.; et al. Diagnosis and Classification of 17 Diseases from 1404 Subjects via Pattern Analysis of Exhaled Molecules. ACS Nano 2017, 11, 112–125. [Google Scholar] [CrossRef]
- Montuschi, P.; Mores, N.; Trové, A.; Mondino, C.; Barnes, P.J. The electronic nose in respiratory medicine. Respiration 2012, 85, 72–84. [Google Scholar] [CrossRef]
- Marzorati, D.; Mainardi, L.; Sedda, G.; Gasparri, R.; Spaggiari, L.; Cerveri, P. A review of exhaled breath: A key role in lung cancer diagnosis. J. Breath Res. 2019, 13, 034001. [Google Scholar] [CrossRef]
- Aittokallio, T.; Saaresranta, T.; Polo-Kantola, P.; Nevalainen, O.; Polo, O. Analysis of inspiratory flow shapes in patients with partial upper-airway obstruction during sleep. Chest 2001, 119, 37–44. [Google Scholar] [CrossRef]
- Sedlák, P.; Kuberský, P. The effect of the orientation towards analyte flow on electrochemical sensor performance and current fluctuations. Sensors 2020, 20, 1038. [Google Scholar] [CrossRef]
- Maciejewska, M.; Szczurek, A.; Bodzoj, L.; Flisowska-Wiercik, B. Sensor array and stop-flow mode applied to discrimination and quantification of gas mixtures. Sens. Actuators B Chem. 2010, 150, 93–98. [Google Scholar] [CrossRef]
- Kalinowski, P.; Woźniak, Ł.; Jasiński, G.; Jasiński, P. Extraction and evaluation of gas-flow-dependent features from dynamic measurements of gas sensors array. In Proceedings of the 14th International Conference on Optical and Electronic Sensors, Gdansk, Poland, 19–22 June 2016; Volume 10161, p. 101610M. [Google Scholar] [CrossRef]
- Marco, S.; Gutierrez-Galvez, A. Signal and data processing for machine olfaction and chemical sensing: A review. IEEE Sens. J. 2012, 12, 3189–3214. [Google Scholar] [CrossRef]
- Lezzi, A.M.; Beretta, G.P.; Comini, E.; Faglia, G.; Galli, G.; Sberveglieri, G. Influence of gaseous species transport on the response of solid state gas sensors within enclosures. Sens. Actuators B Chem. 2001, 78, 144–150. [Google Scholar] [CrossRef]
- Shyla, M.V.; Naidu, K.B.; Vasanth Kumar, G. Optimization of sensor position on different surfaces using CFD analysis for reducing accidents caused by emission of toxic gas in industries. In Proceedings of the 2013 Fifth International Conference on Advanced Computing (ICoAC), Chennai, India, 18–20 December 2013; pp. 196–204. [Google Scholar] [CrossRef]
- Ryu, J.; Shim, S.; Song, J.; Park, J.; Kim, H.S.; Lee, S.K.; Shin, J.C.; Mun, J.; Kang, S.W. Effect of Measurement System Configuration and Operating Conditions on 2D Material-Based Gas Sensor Sensitivity. Nanomaterials 2023, 13, 17–20. [Google Scholar] [CrossRef]
- Scott, S.M.; James, D.; Ali, Z.; Hare, W.T.O. Optimising of The Sensing Chamber of An Array of Fluid dynamic simulation. J. Therm. Anal. Calorim. 2004, 76, 693–708. [Google Scholar] [CrossRef]
- Dohare, P.; Bagchi, S.; Bhondekar, A.P. Performance optimisation of a sensing chamber using fluid dynamics simulation for electronic nose applications. Turk. J. Electr. Eng. Comput. Sci. 2020, 28, 3068–3078. [Google Scholar] [CrossRef]
- Hazarika, S.; Choudhury, R.; Montazer, B.; Medhi, S.; Goswami, M.P.; Sarma, U. Detection of Citrus Tristeza Virus in Mandarin Orange Using a Custom-Developed Electronic Nose System. IEEE Trans. Instrum. Meas. 2020, 69, 9010–9018. [Google Scholar] [CrossRef]
- Di Francesco, F.; Falcitelli, M.; Marano, L.; Pioggia, G. A radially symmetric measurement chamber for electronic noses. Sens. Actuators B Chem. 2005, 105, 295–303. [Google Scholar] [CrossRef]
- Falcitelli, M.; Benassi, A.; Di Francesco, F.; Domenici, C.; Marano, L.; Pioggia, G. Fluid dynamic simulation of a measurement chamber for electronic noses. Sens. Actuators B Chem. 2002, 85, 166–174. [Google Scholar] [CrossRef]
- Viccione, G.; Zarra, T.; Giuliani, S.; Naddeo, V.; Belgiorno, V. Performance study of e-nose measurement chamber for environmental odour monitoring. Chem. Eng. Trans. 2012, 30, 109–114. [Google Scholar] [CrossRef]
- Bakar, M.A.A.; Abdullah, A.H.; Sa’Ad, F.S.A.; Shukor, S.A.A.; Mustafa, M.H.; Kamis, M.S.; Razak, A.A.A.; Saad, S.A. Electronic nose sensing chamber design for confined space atmospheric monitoring. AIP Conf. Proc. 2016, 1775, 030059. [Google Scholar] [CrossRef]
- Chowdhury, S.R. Simple Sensor Chamber Design For Hand-Held Electronic Nose. Researchgate Net 2014, volume, 2–5. [Google Scholar]
- Annanouch, F.-E.; Bouchet, G.; Perrier, P.; Morati, N.; Reynard-Carette, C.; Aguir, K.; Bendahan, M. How the Chamber Design Can Affect Gas Sensor Responses. Proceedings 2018, 2, 820. [Google Scholar] [CrossRef]
- Lopez, L.; Copa, V.; Hayasaka, T.; Faustino-Lopez, M.A.; Wu, Y.; Liu, H.; Liu, Y.; Estacio, E.; Somintac, A.; Lin, L.; et al. Influence of chamber design on the gas sensing performance of graphene field-effect-transistor. SN Appl. Sci. 2020, 2, 1–11. [Google Scholar] [CrossRef]
- Cheng, L.; Liu, Y.B.; Meng, Q.H. A Novel E-Nose Chamber Design for VOCs Detection in Automobiles. Chin. Control. Conf. CCC 2020, 2020, 6055–6060. [Google Scholar] [CrossRef]
- Levenspiel, O. Chemical Reaction Engineering, 3rd ed.; John Wiley & Sons: Hoboken, NJ, USA, 1999. [Google Scholar]
- Hunter, G.W.; Akbar, S.; Bhansali, S.; Daniele, M.; Erb, P.D.; Johnson, K.; Liu, C.-C.; Miller, D.; Oralkan, O.; Hesketh, P.J.; et al. Editors’ Choice—Critical Review—A Critical Review of Solid State Gas Sensors. J. Electrochem. Soc. 2020, 167, 037570. [Google Scholar] [CrossRef]
- Göpel, W.; Schierbaum, K.D. SnO2 sensors: Current status and future prospects. Sens. Actuators B Chem. 1995, 26, 1–12. [Google Scholar] [CrossRef]
- Xue, L.; Yamazaki, H.; Ren, R.; Wanunu, M.; Ivanov, A.P.; Edel, J.B. Solid-state nanopore sensors. Nat. Rev. Mater. 2020, 5, 931–951. [Google Scholar] [CrossRef]
- Liu, X.; Ma, T.; Pinna, N.; Zhang, J. Two-Dimensional Nanostructured Materials for Gas Sensing. Adv. Funct. Mater. 2017, 27, 1702168. [Google Scholar] [CrossRef]
- Hu, W.; Wan, L.; Jian, Y.; Ren, C.; Jin, K.; Su, X.; Bai, X.; Haick, H.; Yao, M.; Wu, W. Electronic Noses: From Advanced Materials to Sensors Aided with Data Processing. Adv. Mater. Technol. 2019, 4, 1–38. [Google Scholar] [CrossRef]
- Das, S.; Mojumder, S.; Saha, D.; Pal, M. Influence of major parameters on the sensing mechanism of semiconductor metal oxide based chemiresistive gas sensors: A review focused on personalized healthcare. Sens. Actuators B Chem. 2022, 352, 131066. [Google Scholar] [CrossRef]
- Ma, N.; Suematsu, K.; Yuasa, M.; Kida, T.; Shimanoe, K. Effect of Water Vapor on Pd-Loaded SnO2 Nanoparticles Gas Sensor. ACS Appl. Mater. Interfaces 2015, 7, 5863–5869. [Google Scholar] [CrossRef] [PubMed]
- Suematsu, K.; Sasaki, M.; Ma, N.; Yuasa, M.; Shimanoe, K. Antimony-Doped Tin Dioxide Gas Sensors Exhibiting High Stability in the Sensitivity to Humidity Changes. ACS Sens. 2016, 1, 913–920. [Google Scholar] [CrossRef]
- Gao, Z.; Song, G.; Zhang, X.; Li, Q.; Yang, S.; Wang, T.; Li, Y.; Zhang, L.; Guo, L.; Fu, Y. A facile PDMS coating approach to room-temperature gas sensors with high humidity resistance and long-term stability. Sens. Actuators B Chem. 2020, 325, 128810. [Google Scholar] [CrossRef]
- Li, S.; Li, Z.; Zhang, M.; Wu, Z.; Kong, D.; Qian, H.; Su, B. Etching process enhanced H2O2 sensing performance of SnO2/Zn2 SnO4 with reliable anti-humidity ability. Anal. Methods 2022, 14, 3335–3344. [Google Scholar] [CrossRef]
- Il Choi, K.; Kim, H.J.; Kang, Y.C.; Lee, J.H. Ultraselective and ultrasensitive detection of H2S in highly humid atmosphere using CuO-loaded SnO2 hollow spheres for real-time diagnosis of halitosis. Sens. Actuators B Chem. 2014, 194, 371–376. [Google Scholar] [CrossRef]
- Güntner, A.T.; Koren, V.; Chikkadi, K.; Righettoni, M.; Pratsinis, S.E. E-Nose Sensing of Low-ppb Formaldehyde in Gas Mixtures at High Relative Humidity for Breath Screening of Lung Cancer? ACS Sens. 2016, 1, 528–535. [Google Scholar] [CrossRef]
- Yang, D.; Gopal, R.A.; Lkhagvaa, T.; Choi, D. Metal-oxide gas sensors for exhaled-breath analysis: A review. Meas. Sci. Technol. 2021, 32, 102004. [Google Scholar] [CrossRef]
- Kwak, C.; Kim, T.; Jeong, S.; Yoon, J.; Kim, J.; Lee, J. Humidity-Independent Oxide Semiconductor Chemiresistors Using Terbium-Doped SnO 2 Yolk−Shell Spheres for Real-Time Breath Analysis. ACS Appl. Mater. Interfaces 2018, 10, 2–10. [Google Scholar] [CrossRef]
- Luo, Y.; Zhang, C.; Zheng, B.; Geng, X.; Debliquy, M. Hydrogen sensors based on noble metal doped metal-oxide semiconductor: A review. Int. J. Hydrogens Energy 2017, 42, 20386–20397. [Google Scholar] [CrossRef]
- Qin, Y.; Zang, J.; Bai, C.; Wang, X. Dual functionalization of aligned silicon nanowires by APTES and nano-Ag to achieve high response to rarefied acetone at high ambient humidity. J. Mater. Sci. Mater. Electron. 2021, 32, 908–922. [Google Scholar] [CrossRef]
- Yao, M.S.; Cao, L.A.; Hou, G.L.; Cai, M.L.; Xiu, J.W.; Fang, C.H.; Yuan, F.L.; Chen, Y.F. Gold-tin co-sensitized ZnO layered porous nanocrystals: Enhanced responses and anti-humidity. RSC Adv. 2017, 7, 20273–20280. [Google Scholar] [CrossRef]
- Khatoon, Z.; Fouad, H.; Alothman, O.Y.; Hashem, M.; Ansari, Z.A.; Ansari, S.A. Doped SnO2 nanomaterials for e-nose based electrochemical sensing of biomarkers of lung cancer. ACS Omega 2020, 5, 27645–27654. [Google Scholar] [CrossRef] [PubMed]
- Byoun, Y.; Choi, S.-W.; Tae Byun, Y. Realisation of highly sensitive and selective NO2 detection at room temperature utilizing defect-induced single-walled carbon nanotubes combined with Pt functionalisation. Appl. Surf. Sci. 2022, 590, 153068. [Google Scholar] [CrossRef]
- Kim, J.-S.; Na, C.W.; Kwak, C.-H.; Li, H.-Y.; Yoon, J.W.; Kim, J.-H.; Jeong, S.-Y.; Lee, J.-H. Humidity-Independent Gas Sensors Using Pr-Doped In 2O3 Macroporous Spheres: Role of Cyclic Pr3+/Pr4+ Redox Reactions in Suppression of Water-Poisoning Effect. ACS Appl. Mater. Interfaces 2019, 11, 25322–25329. [Google Scholar] [CrossRef]
- Kim, J.-S.; Kim, K.B.; Li, H.-Y.; Na, C.W.; Lim, K.; Moon, Y.K.; Yoon, J.W.; Lee, J.-H. Pure and Pr-doped Ce4W9O33 with superior hydroxyl scavenging ability: Humidity-independent oxide chemiresistors. J. Mater. Chem. A 2021, 9, 16359–16369. [Google Scholar] [CrossRef]
- Reddy, S.M.; Payne, P.A. Effect of unmodified and derivatised poly(vinyl chloride) overlayers on the response of an electronic nose based on conducting polymers. Sens. Actuators B Chem. 1999, 58, 536–543. [Google Scholar] [CrossRef]
- Sayegh, S.; Lee, J.H.; Yang, D.H.; Weber, M.; Iatsunskyi, I.; Coy, E.; Razzouk, A.; Kim, S.S.; Bechelany, M. Humidity-resistant gas sensors based on SnO2 nanowires coated with a porous alumina nanomembrane by molecular layer deposition. Sens. Actuators B Chem. 2021, 344, 130302. [Google Scholar] [CrossRef]
- Zohora, S.; Khan, A.; Hundewale, N. Chemical Sensors Employed in Electronic Noses: A Review. Proc. Second. Int. Conf. Adv. Comput. Inf. Technol. 2012, 178, 3. [Google Scholar]
- Selyanchyn, R.; Wakamatsu, S.; Hayashi, K.; Lee, S.-W.W. A Nano-Thin Film-Based Prototype QCM Sensor Array for Monitoring Human Breath and Respiratory Patterns. Sensors 2015, 15, 18834–18850. [Google Scholar] [CrossRef]
- Pang, J.; Le, X.; Pang, K.; Dong, H.; Zhang, Q.; Xu, Z.; Gao, C.; Fu, Y.; Xie, J. Highly precision carbon dioxide acoustic wave sensor with minimized humidity interference. Sens. Actuators B Chem. 2021, 338, 129824. [Google Scholar] [CrossRef]
- Li, H.; Zhang, W.; Ding, Q.; Jin, X.; Ke, Q.; Li, Z.; Wang, D.; Huang, C. Facile Strategy for Fabrication of Flexible, Breathable, and Washable Piezoelectric Sensors via Welding of Nanofibers with Multiwalled Carbon Nanotubes (MWCNTs). ACS Appl. Mater. Interfaces 2019, 11, 38023–38030. [Google Scholar] [CrossRef] [PubMed]
- Wei, Y.; Shi, X.; Yao, Z.; Zhi, J.; Hu, L.; Yan, R.; Shi, C.; Yu, H.-D.; Huang, W. Fully paper-integrated hydrophobic and air permeable piezoresistive sensors for high-humidity and underwater wearable motion monitoring. NPJ Flex. Electron. 2023, 7, 13. [Google Scholar] [CrossRef]
- Li, D.; Zu, X.; Ao, D.; Tang, Q.; Fu, Y.; Guo, Y.; Bilawal, K.; Faheem, M.B.; Li, L.; Li, S.; et al. High humidity enhanced surface acoustic wave (SAW) H2S sensors based on sol–gel CuO films. Sens. Actuators B Chem. 2019, 294, 55–61. [Google Scholar] [CrossRef]
- Du, B.; Qi, T.; Li, J.; He, Y.; Yang, X. Improving anti-humidity property of In2O3 based NO2 sensor by fluorocarbon plasma treatment. Sens. Actuators B Chem. 2021, 344, 130268. [Google Scholar] [CrossRef]
- Ionescu, R. Ageing and p-type conduction in SnO2 gas sensors. Sens. Actuators B Chem. 1999, 58, 375–379. [Google Scholar] [CrossRef]
- Ionescu, R.; Vancu, A.; Tomescu, A. Time-dependent humidity calibration for drift corrections in electronic noses equipped with SnO2 gas sensors. Sens. Actuators B Chem. 2000, 69, 283–286. [Google Scholar] [CrossRef]
- Itoh, T.; Matsubara, I.; Kadosaki, M.; Sakai, Y.; Shin, W.; Izu, N.; Nishibori, M.; Industrial, T. Effects of High-Humidity Aging on Platinum, Palladium, and Gold Loaded Tin Oxide—Volatile Organic Compound Sensors. Sensors 2010, 10, 6513–6521. [Google Scholar] [CrossRef]
- Suematsu, K.; Man, N.; Watanabe, K.; Yuasa, M.; Kida, T.; Shimanoe, K. Effect of Humid Aging on the Oxygen Adsorption in SnO2 Gas Sensors. Sensors 2018, 18, 254. [Google Scholar] [CrossRef]
- Wu, R.; Tian, L.; Li, H.; Liu, H.; Luo, J.; Tian, X.; Hua, Z.; Wu, Y.; Fan, S. A selective methane gas sensor based on metal oxide semiconductor equipped with an on-chip microfilter. Sens. Actuators B Chem. 2022, 359, 131557. [Google Scholar] [CrossRef]
- Gupta, N.; Fahad, H.M.; Amani, M.; Song, X.; Scott, M.; Javey, A. Elimination of response to relative humidity changes in chemical-sensitive field-effect transistors. ACS Sens. 2019, 4, 1857–1863. [Google Scholar] [CrossRef]
- Vallejos, S.; Gràcia, I.; Pizúrová, N.; Figueras, E.; Čechal, J.; Hubálek, J.; Cané, C. Gas sensitive ZnO structures with reduced humidity-interference. Sens. Actuators B Chem. 2019, 301, 127054. [Google Scholar] [CrossRef]
- Miró, P.; Audiffred, M.; Heine, T. An atlas of two-dimensional materials. Chem. Soc. Rev. 2014, 43, 6537–6554. [Google Scholar] [CrossRef] [PubMed]
- Novoselov, K.S.; Geim, A.K.; Morozov, S.V.; Jiang, D.; Zhang, Y.; Dubonos, S.V.; Grigorieva, I.V.; Firsov, A.A. Electric Field Effect in Atomically Thin Carbon Films. Science 2004, 306, 666–669. [Google Scholar] [CrossRef] [PubMed]
- Meng, Z.; Stolz, R.M.; Mendecki, L.; Mirica, K.A. Electrically-Transduced Chemical Sensors Based on Two-Dimensional Nanomaterials. Chem. Rev. 2019, 119, 478–598. [Google Scholar] [CrossRef]
- Wang, Y.; Shao, Y.; Matson, D.W.; Li, J.; Lin, Y. Nitrogen-Doped Graphene and Its Application in Electrochemical Biosensing. ACS Nano 2010, 4, 1790–1798. [Google Scholar] [CrossRef]
- Donarelli, M.; Prezioso, S.; Perrozzi, F.; Giancaterini, L.; Cantalini, C.; Treossi, E.; Palermo, V.; Santucci, S.; Ottaviano, L. Graphene oxide for gas detection under standard humidity conditions. 2D Mater. 2015, 2, 035018. [Google Scholar] [CrossRef]
- Miao, J.; Chen, C.; Lin, J.Y.S. Humidity independent hydrogen sulfide sensing response achieved with monolayer film of CuO nanosheets. Sens. Actuators B Chem. 2020, 309, 127785. [Google Scholar] [CrossRef]
- Yang, S.; Lei, G.; Xu, H.; Lan, Z.; Wang, Z.; Gu, H. Metal oxide based heterojunctions for gas sensors: A review. Nanomaterials 2021, 11, 1026. [Google Scholar] [CrossRef]
- Yan, W.; Liu, W.; Zhao, Z.; Wang, J.; Nam, G.B.; Cui, S.; Shen, X.; Jang, H.W. Humidity-independent electronic nose of α-Fe2O3/ZnFe2O4 heterojunctions for trace detection of N-butanol exhalation in lung cancer screening. Sens. Actuators B Chem. 2023, 384, 133577. [Google Scholar] [CrossRef]
- Faia, P.M.; Furtado, C.S. Chemical Effect of composition on electrical response to humidity of TiO2:ZnO sensors investigated by impedance spectroscopy. Sens. Actuators B. Chem. 2013, 181, 720–729. [Google Scholar] [CrossRef]
- Dong, L.; Xu, Z.; Xuan, W.; Yan, H.; Liu, C.; Zhao, W.S.; Wang, G.; Teh, K.S. A Characterization of the Performance of Gas Sensor Based on Heater in Different Gas Flow Rate Environments. IEEE Trans. Ind. Inform. 2020, 16, 6281–6290. [Google Scholar] [CrossRef]
- Fonollosa, J.; Fernández, L.; Gutiérrez-Gálvez, A.; Huerta, R.; Marco, S. Calibration transfer and drift counteraction in chemical sensor arrays using Direct Standardization. Sens. Actuators B Chem. 2016, 236, 1044–1053. [Google Scholar] [CrossRef]
- Jaeschke, C.; Glöckler, J.; Padilla, M.; Mitrovics, J.; Mizaikoff, B. An eNose-based method performing drift correction for online VOC detection under dry and humid conditions. Anal. Methods 2020, 12, 4724–4733. [Google Scholar] [CrossRef] [PubMed]
- Laref, R.; Ahmadou, D.; Losson, E.; Siadat, M. Orthogonal Signal Correction to Improve Stability Regression Model in Gas Sensor Systems. J. Sens. 2017, 2017, 9851406. [Google Scholar] [CrossRef]
- Dragonieri, S.; Pennazza, G.; Carratu, P.; Resta, O. Electronic Nose Technology in Respiratory Diseases. Lung 2017, 195, 157–165. [Google Scholar] [CrossRef] [PubMed]
- De Vries, R.; Brinkman, P.; Van Der Schee, M.P.; Fens, N.; Dijkers, E.; Bootsma, S.K.; De Jongh, F.H.C.; Sterk, P.J. Integration of electronic nose technology with spirometry: Validation of a new approach for exhaled breath analysis. J. Breath Res. 2015, 9, 046001. [Google Scholar] [CrossRef]
- Bos, A. Mobile Device and Method for Analysing Breath Samples. US Patent US20150105683A1, 16 April 2015. [Google Scholar]
- Tiele, A.; Wicaksono, A.; Ayyala, S.K.; Covington, J.A. Development of a compact, iot-enabled electronic nose for breath analysis. Electronics 2020, 9, 84. [Google Scholar] [CrossRef]
- Cerrato Oliveros, M.C.; Pérez Pavón, J.L.; García Pinto, C.; Fernández Laespada, M.E.; Moreno Cordero, B.; Forina, M.; García Pinto, C.; Fernández Laespada, M.E.; Moreno Cordero, B.; Forina, M. Electronic nose based on metal oxide semiconductor sensors as a fast alternative for the detection of adulteration of virgin olive oils. Anal. Chim. Acta 2002, 459, 219–228. [Google Scholar] [CrossRef]
- Islam, A.K.M.S.; Ismail, Z.; Saad, B.; Othman, A.R.; Ahmad, M.N.; Shakaff, A.Y. Correlation studies between electronic nose response and headspace volatiles of Eurycoma longifolia extracts. Sens. Actuators B Chem. 2006, 120, 245–251. [Google Scholar] [CrossRef]
- Aleixandre, M.; Lozano, J.; Guti, J.; Sayago, I.; Fern, M.J.; Horrillo, M.C. Portable e-nose to classify different kinds of wine. Sens. Actuators B Chem. 2008, 131, 71–76. [Google Scholar] [CrossRef]
- Yang, Z.; Dong, F.; Shimizu, K.; Kinoshita, T.; Kanamori, M. Identification of coumarin-enriched Japanese green teas and their particular flavor using electronic nose. J. Food Eng. 2009, 92, 312–316. [Google Scholar] [CrossRef]
- Pinheiro, C.; Rodrigues, C.M.; Schäfer, T.; Crespo, J.G. Monitoring the aroma production during wine-must fermentation with an electronic nose. Biotechnol. Bioeng. 2002, 77, 632–640. [Google Scholar] [CrossRef] [PubMed]
- Oshita, S.; Shima, K.; Haruta, T.; Seo, Y.; Kawagoe, Y. Discrimination of odors emanating from ‘La France’ pear by semi-conducting polymer sensors. Comput. Electron. Agric. 2000, 26, 209–216. [Google Scholar] [CrossRef]
- Ulmer, H.; Mitrovics, J.; Noetzel, G.; Weimar, U.; Go, W. Odours and flavours identified with hybrid modular sensor systems. Sens. Actuators B Chem. 1997, 43, 24–33. [Google Scholar] [CrossRef]
- Bourgeois, W.; Burgess, J.E.; Stuetz, R.M. On-line monitoring of wastewater quality: A review. J. Chem. Technol. Biotechnol. 2001, 348, 337–348. [Google Scholar] [CrossRef]
- Lippolis, V.; Cervellieri, S.; Damascelli, A.; Pascale, M.; Gioia, D.; Girolamo, A. De Rapid prediction of deoxynivalenol contamination in wheat bran by MOS-based electronic nose and characterization of the relevant pattern of volatile compounds. J. Sci. Food Agric. 2018, 98, 4955–4962. [Google Scholar] [CrossRef]
- Lippolis, V.; Pascale, M.; Cervellieri, S.; Damascelli, A.; Visconti, A. Screening of deoxynivalenol contamination in durum wheat by MOS-based electronic nose and identi fi cation of the relevant pattern of volatile compounds. Food Control 2014, 37, 263–271. [Google Scholar] [CrossRef]
- Gonzalez Martin, Y.; Cerrato Oliveros, M.C.; Perez Pavon, J.L.; Garcia Pinto, C.; Moreno Cordero, B. Electronic nose based on metal oxide semiconductor sensors and pattern recognition techniques: Characterisation of vegetable oils Carmelo Garc. Anal. Chim. Acta 2001, 449, 69–80. [Google Scholar] [CrossRef]
- Sberveglieri, G.; Groppelli, S.; Nelli, P.; Camanzi, A. Bismuth-doped tin oxide thin-film gas sensors. Sens. Actuators B Chem. 1991, 3, 183–189. [Google Scholar] [CrossRef]
- Endres, H.E.; Jander, H.D.; Göttler, W. A test system for gas sensors. Sens. Actuators B Chem. 1995, 23, 163–172. [Google Scholar] [CrossRef]
- Arendes, D.; Amann, J.; Brieger, O.; Bur, C.; Schütze, A. Qualification of a Gas Mixing Apparatus for Complex Trace Gas Mixtures. Dresdner Sens.-Symp. 2022, 2022, 183–188. [Google Scholar] [CrossRef]
- Wilson, A.D.; Lester, D.G.; Oberle, C.S. Development of Conductive Polymer Analysis for the Rapid Detection and Identification of Phytopathogenic Microbes. Phytopathology 2004, 94, 419–431. [Google Scholar] [CrossRef] [PubMed]
- Campagnoli, A.; Cheli, F.; Polidori, C.; Zaninelli, M.; Zecca, O. Use of the Electronic Nose as a Screening Tool for the Recognition of Durum Wheat Naturally Contaminated by Deoxynivalenol: A Preliminary Approach. Sensors 2011, 11, 4899–4916. [Google Scholar] [CrossRef] [PubMed]
- Du, W.-X.; Lin, C.-M.; Huang, T.; Marshall, M.; Wei, C.-I. Potential Application of the Electronic Nose for Quality Assessment of Salmon Fillets. Food Microbiol. Saf. Potential 2001, 67, 307–313. [Google Scholar]
- Gobbi, E.; Falasconi, M.; Torelli, E.; Sberveglieri, G. Electronic nose predicts high and low fumonisin contamination in maize cultures. FRIN 2011, 44, 992–999. [Google Scholar] [CrossRef]
- Wen, T.; Zheng, L.; Dong, S.; Gong, Z.; Sang, M.; Long, X. Rapid detection and classi fi cation of citrus fruits infestation by Bactrocera dorsalis (Hendel) based on electronic nose. Postharvest Biol. Technol. 2019, 147, 156–165. [Google Scholar] [CrossRef]
- Herndandez Gomez, A.; Hu, G.; Wang, J.; Garicia Pereira, A. Evaluation of tomato maturity by electronic nose. Comput. Electron. Agric. 2006, 54, 44–52. [Google Scholar] [CrossRef]
- Chen, L.; Wong, D.; Fang, C.; Chiu, C.; Chou, T.; Wu, C. Development of an Electronic-Nose System for Fruit Maturity and Quality Monitoring. In Proceedings of the 2018 IEEE International Conference on Applied System Invention (ICASI), Chiba, Japan, 13–17 April 2018; pp. 1129–1130. [Google Scholar]
- Hong, X.; Wang, J.; Qiu, S. Authenticating cherry tomato juices—Discussion of different data standardization and fusion approaches based on electronic nose and tongue. FRIN 2014, 60, 173–179. [Google Scholar] [CrossRef]
- Chen, Q.; Zhao, J.; Chen, Z.; Lin, H.; Zhao, D. Discrimination of green tea quality using the electronic nose technique and the human panel test, comparison of linear and nonlinear classification tools. Sens. Actuators B Chem. 2011, 159, 294–300. [Google Scholar] [CrossRef]
- Cui, S.; Wu, J.; Wang, J.; Wang, X. Discrimination of American ginseng and Asian ginseng using electronic nose and gas chromatography e mass spectrometry coupled with chemometrics. J. Ginseng Res. 2017, 41, 85–95. [Google Scholar] [CrossRef]
- Lozano, J.; Santos, J.P.; Guti, J.; Horrillo, M.C. Comparative study of sampling systems combined with gas sensors for wine discrimination. Sens. Actuators B Chem. 2007, 126, 616–623. [Google Scholar] [CrossRef]
- Camardo Leggieri, M.; Mazzoni, M.; Fodil, S.; Moschini, M.; Bertuzzi, T.; Prandini, A.; Battilani, P. An electronic nose supported by an artificial neural network for the rapid detection of aflatoxin B1 and fumonisins in maize. Food Control 2021, 123, 107722. [Google Scholar] [CrossRef]
- Ragazzo-Sanchez, J.A.; Chalier, P.; Chevalier, D.; Calderon-Santoyo, M.; Ghommidh, C. Identification of different alcoholic beverages by electronic nose coupled to GC. Sens. Actuators B Chem. 2008, 134, 43–48. [Google Scholar] [CrossRef]
- Mahdavi, H.; Rahbarpour, S.; Hosseini-Golgoo, S.M.; Jamaati, H. Reducing the destructive effect of ambient humidity variations on gas detection capability of a temperature modulated gas sensor by calcium chloride. Sens. Actuators B Chem. 2021, 331, 129091. [Google Scholar] [CrossRef]
- González Martín, Y.; Luis Pérez Pavón, J.; Moreno Cordero, B.; García Pinto, C. Classification of vegetable oils by linear discriminant analysis of Electronic Nose data. Anal. Chim. Acta 1999, 384, 83–94. [Google Scholar] [CrossRef]
- Burlachenko, J.; Kruglenko, I.; Snopok, B.; Persaud, K. Sample handling for electronic nose technology: State of the art and future trends. TrAC—Trends Anal. Chem. 2016, 82, 222–236. [Google Scholar] [CrossRef]
- Robin, Y.; Amann, J.; Goodarzi, P.; Schutze, A.; Bur, C. Transfer Learning to Significantly Reduce the Calibration Time of MOS Gas Sensors. In Proceedings of the 2022 IEEE International Symposium on Olfaction and Electronic Nose (ISOEN), Aveiro, Portugal, 29 May–1 June 2022; pp. 1–4. [Google Scholar]
- Laref, R.; Losson, E.; Sava, A.; Siadat, M. Support Vector Machine Regression for Calibration Transfer between Electronic Noses Dedicated to Air Pollution Monitoring. Sensors 2018, 18, 3716. [Google Scholar] [CrossRef]
- Lotesoriere, B.J.; Bax, C.; Capelli, L. Odour impact assessment by Instrumental Odour Monitoring Systems: A case study focusing on the differentiation of different odour sources and performance testing. In Proceedings of the 2022 IEEE International Symposium on Olfaction and Electronic Nose (ISOEN), Aveiro, Portugal, 29 May–1 June 2022; pp. 1–4. [Google Scholar] [CrossRef]
- Capelli, L.; Bax, C.; Grizzi, F.; Taverna, G. Optimization of training and measurement protocol for eNose analysis of urine headspace aimed at prostate cancer diagnosis. Sci. Rep. 2021, 11, 20898. [Google Scholar] [CrossRef]
- EN13725: 2022; Stationary Source Emissions—Determination of Odour Concentration by Dynamic Olfactometry and Odour Emission Rate. European Standard: Brussels, Belgium, 2022.
- Eusebio, L.; Capelli, L.; Sironi, S. H2S Loss through NalophanTM Bags: Contributions of Adsorption and Diffusion. Sci. World J. 2017, 2017, 9690704. [Google Scholar] [CrossRef]
- Bax, C.; Robbiani, S.; Zannin, E.; Capelli, L.; Ratti, C.; Bonetti, S.; Novelli, L.; Raimondi, F.; Di Marco, F.; Dellacà, R.L. An Experimental Apparatus for E-Nose Breath Analysis in Respiratory Failure Patients. Diagnostics 2022, 12, 776. [Google Scholar] [CrossRef]
- Aishima, T. Discrimination liquor aromas bY pattern recognition analysis of responses from a gas sensor array. Anal. Chim. Acta 1991, 243, 293–300. [Google Scholar] [CrossRef]
- Romain, A.; Godefroid, D.; Nicolas, J. Monitoring the exhaust air of a compost pile with an e-nose and comparison with GC—MS data. Sens. Actuators B Chem. 2005, 106, 317–324. [Google Scholar] [CrossRef]
- Capelli, L.; Sironi, S.; Dentoni, L.; Del Rosso, R.; Centola, P.; Demattè, F.; Della Torre, M.; Riccò, I. An innovative system for the continuous monitoring of environmental odours: Results of laboratory and field tests. Chem. Eng. Trans. 2010, 23, 309–314. [Google Scholar] [CrossRef]
- Eusebio, L.; Sironi, S.; Capelli, L.; Il Grande, M.; Della Torre, M. Continuous evaluation of odour concentration at a plant emission by electronic nose. Chem. Eng. Trans. 2014, 40, 133–138. [Google Scholar] [CrossRef]
- Dentoni, L.; Capelli, L.; Sironi, S.; Del Rosso, R.; Zanetti, S.; Torre, M. Della Development of an electronic nose for environmental odour monitoring. Sensors 2012, 12, 14363–14381. [Google Scholar] [CrossRef] [PubMed]
- Cagnasso, S.; Falasconi, M.; Previdi, M.P.; Franceschini, B.; Cavalieri, C.; Sberveglieri, V.; Rovere, P. Rapid screening of alicyclobacillus acidoterrestris spoilage of fruit juices by electronic nose: A confirmation study. J. Sens. 2010, 2010, 143173. [Google Scholar] [CrossRef]
- Cevoli, C.; Cerretani, L.; Gori, A.; Caboni, M.F.; Gallina Toschi, T.; Fabbri, A. Classification of Pecorino cheeses using electronic nose combined with artificial neural network and comparison with GC-MS analysis of volatile compounds. Food Chem. 2011, 129, 1315–1319. [Google Scholar] [CrossRef]
- Pacioni, G.; Cerretani, L.; Procida, G.; Cichelli, A. Composition of commercial truffle flavored oils with GC-MS analysis and discrimination with an electronic nose. Food Chem. 2014, 146, 30–35. [Google Scholar] [CrossRef]
- Cellini, A.; Biondi, E.; Blasioli, S.; Rocchi, L.; Farneti, B.; Braschi, I.; Savioli, S.; Rodriguez-Estrada, M.T.; Biasioli, F.; Spinelli, F. Early detection of bacterial diseases in apple plants by analysis of volatile organic compounds profiles and use of electronic nose. Ann. Appl. Biol. 2016, 168, 409–420. [Google Scholar] [CrossRef]
- Lerma-García, M.J.; Simó-Alfonso, E.F.; Bendini, A.; Cerretani, L. Metal oxide semiconductor sensors for monitoring of oxidative status evolution and sensory analysis of virgin olive oils with different phenolic content. Food Chem. 2009, 117, 608–614. [Google Scholar] [CrossRef]
- Sberveglieri, G.; Zambotti, G.; Falasconi, M.; Gobbi, E.; Sberveglieri, V. MOX-NW electronic nose for detection of food microbial contamination. Proc. IEEE Sens. 2014, 2014, 1376–1379. [Google Scholar] [CrossRef]
- Mildner-Szkudlarz, S.; Jeleń, H.H.; Zawirska-Wojtasiak, R. The use of electronic and human nose for monitoring rapeseed oil autoxidation. Eur. J. Lipid Sci. Technol. 2008, 110, 61–72. [Google Scholar] [CrossRef]
- Liang, Z.; Tian, F.; Yang, S.X.; Zhang, C.; Sun, H.; Liu, T. Study on interference suppression algorithms for electronic noses: A review. Sensors 2018, 18, 1179. [Google Scholar] [CrossRef] [PubMed]
- Gonzalez-Jimenez, J.; Monroy, J.G.; Blanco, J.L. The multi-chamber electronic nose-an improved olfaction sensor for mobile robotics. Sensors 2011, 11, 6145–6164. [Google Scholar] [CrossRef] [PubMed]
- Wang, J.; Gao, D.; Wang, Z. Quality-grade evaluation of petroleum waxes using an electronic nose with a TGS gas sensor array. Meas. Sci. Technol. 2015, 26, 085005. [Google Scholar] [CrossRef]
- Menini, A. The Neurobiology of Olfaction; Thieme/AAO-HNSF: Dallas, TX, USA, 2015; ISBN 9781626239777. [Google Scholar]
- Samiyan, N.S.; Mohd Addi, M. Characterization of sensing chamber design for E-nose applications. J. Telecommun. Electron. Comput. Eng. 2017, 9, 123–127. [Google Scholar]
- Annanouch, F.E.; Bouchet, G.; Perrier, P.; Morati, N.; Reynard-Carette, C.; Aguir, K.; Martini-Laithier, V.; Bendahan, M. Hydrodynamic evaluation of gas testing chamber: Simulation, experiment. Sens. Actuators B Chem. 2019, 290, 598–606. [Google Scholar] [CrossRef]
- Robbiani, S.; Bax, C.; Albertazzi, J.; Pappolla, M.; Busini, V.; Apelli, L.; Dellaca, R. A bench test system for developing E-nose diagnostic tools with exhaled breath sampling. In Proceedings of the 2022 IEEE International Symposium on Olfaction and Electronic Nose (ISOEN), Aveiro, Portugal, 29 May–1 June 2022; pp. 1–4. [Google Scholar] [CrossRef]
- Chang, Z.; Sun, Y.; Zhang, Y.; Gao, Y.; Weng, X.; Chen, D.; David, L.; Xie, J. Bionic Optimization Design of Electronic Nose Chamber for Oil and Gas Detection. J. Bion. Eng. 2018, 15, 533–544. [Google Scholar] [CrossRef]
- Wang, J.Y.; Meng, Q.H.; Jin, X.W.; Sun, Z.H. Design of handheld electronic nose bionic chambers for Chinese liquors recognition. Meas. J. Int. Meas. Confed. 2021, 172, 108856. [Google Scholar] [CrossRef]
- Degler, D.; Junker, B.; Allmendinger, F.; Weimar, U.; Barsan, N. Investigations on the temperature-dependent interaction of water vapor with tin dioxide and its implications on gas sensing. ACS Sens. 2020, 5, 3207–3216. [Google Scholar] [CrossRef]
- Beghi, S.; Guillot, J.-M. Use of poly(ethylene terephtalate) film bag to sample and remove humidity from atmosphere containing volatile organic compounds. J. Chromatogr. A 2008, 1183, 1–5. [Google Scholar] [CrossRef]
- Martin, J.D.M.; Romain, A.C. Building a Sensor Benchmark for E-Nose Based Lung Cancer Detection: Methodological Considerations. Chemosensors 2022, 10, 444. [Google Scholar] [CrossRef]
- Kasper, P.L.; Oxbøl, A.; Hansen, M.J.; Feilberg, A. Mechanisms of Loss of Agricultural Odorous Compounds in Sample Bags of Nalophan, Tedlar, and PTFE. J. Environ. Qual. 2018, 47, 246–253. [Google Scholar] [CrossRef] [PubMed]
- Guillot, J.-M.; Beghi, S. Permeability to water vapour and hydrogen sulphide of some sampling bags recommended by EN 13725. Chem. Eng. Trans. 2008, 15, 79–86. [Google Scholar]
- Toledo, M.; Guillot, J.M.; Siles, J.A.; Martín, M.A. Permeability and adsorption effects for volatile sulphur compounds in Nalophan sampling bags: Stability influenced by storage time. Biosyst. Eng. 2019, 188, 217–228. [Google Scholar] [CrossRef]
Disclaimer/Publisher’s Note: The statements, opinions and data contained in all publications are solely those of the individual author(s) and contributor(s) and not of MDPI and/or the editor(s). MDPI and/or the editor(s) disclaim responsibility for any injury to people or property resulting from any ideas, methods, instructions or products referred to in the content. |
© 2023 by the authors. Licensee MDPI, Basel, Switzerland. This article is an open access article distributed under the terms and conditions of the Creative Commons Attribution (CC BY) license (https://creativecommons.org/licenses/by/4.0/).