Abstract
Instrument automation, technological advancements and improved computational power made separation science an extremely data-rich approach, requiring the use of statistical and data analysis tools that are able to optimize processes and combine multiple outputs. The use of chemometrics is growing, greatly improving the ability to extract meaningful information. Separation–multidetection generates multidimensional data, whose elaboration should not be left to the discretion of the operator. However, some applications or techniques still suffer from the lack of method optimization through DoE and downstream multivariate analysis, limiting their potential. This review aims at summarizing how chemometrics can assist analytical chemists in terms of data elaboration and method design, focusing on what can be achieved by applying chemometric approaches to separation science. Recent applications of chemometrics in separation analyses, in particular in gas, liquid and size-exclusion chromatography, together with field flow fractionation, will be detailed to visualize the state of the art of separation chemometrics, encompassing volatile, soluble and solid (colloidal) analytes. The samples considered will range from food chemistry and environmental chemistry to bio/pharmaceutical science.
1. Introduction
The great improvement in computer science in the last thirty years made the use of personal computers indispensable in all aspects of life. One of the effects of increasing computational power in analytical chemistry is the growing use of chemometrics for data elaboration. Furthermore, instrument automation allows the production of a huge amount of data in a relatively short time, sharpening the need for extracting useful information.
Separation techniques are the backbone of analytical chemistry because they allow the study of all the components of the sample under analysis, or the selection of the most interesting one(s) for further study. Coupling a separation technique with spectrophotometric or mass spectrometry (MS) detectors allows for the quantification and identification of each component, following a targeted approach. Technologies such as liquid- and gas-chromatography (LC and GC) coupled with MS brought the development of “omics” sciences, the aim of which is to characterize and quantify all the components of the matrix, in order to fully investigate it and understand the chemical processes to which it was subject [1,2]. A different approach for the use of separation data is the untargeted one, in which the chromatogram is used as a fingerprint of the sample, without further characterizing the components of the matrix, with the aim of comparing it with other samples or sample pools. This approach is useful for grouping purposes, such as clustering or classification, and is usually employed when a non-specific detector is coupled to the chromatographic instrument, such as a spectroscopic or a flame ionization (FID) detector [3].
Among separation techniques, gas- and liquid-chromatography are the most known, robust (and published) ones, dealing, respectively, with volatile (GC) and soluble (LC) compounds. However, another class of separation techniques is also crucial in the analytical field, taking into account samples with a nano- or micro-disperse content. These techniques are able to size-separate sample components prior to detection, and include mainly size exclusion chromatography (SEC) and Field Flow Fractionation (FFF). In particular, FFF is gaining increasing traction [4] for the analysis of nano-particles in solution thanks to the requirements imposed by the Food and Drug Administration (FDA) demanding the use of native and representative characterization [5]. In fact, the main advantage of FFF over chromatographic techniques is that it does not require a stationary phase, since separation is obtained in an empty channel by the application of an external field, such as the earth gravitational field [6,7] or a perpendicular solvent flow [8]. With the addition of SEC and FFF, all physical forms of analytes are included, whether gaseous, liquid or solid.
Independently of the sample type, all analytical methods, in both targeted and untargeted approaches, require chemometrics to some degree, i.e., for data handling. In all cases, in fact, a multivariate signal is obtained for each sample from the analytical method, these being a chromatogram, a fractogram (for FFF) or a set of chromatographic peak areas, intensity, spectra or analytes concentrations. It is, therefore, important to apply statistical analysis to extract the useful information from the data. The umbrella term “useful” includes a wide range of possibilities. There are several tasks that a researcher could pursue when planning analytical research, and these could also change during the work. Chemometrics can be applied in many steps of the study to reach different aims.
The most renowned chemometric technique is certainly principal components analysis (PCA) [9,10]. It is the most widely used chemometric tool, due to its simplicity of application and interpretation. Currently, most commercial software and a few software for instrument control implement PCA tools for rapid data analysis. The goal is mainly to compare samples, including with online repositories, during data acquisition, to verify grouping and detect outliers. Data behavior can in fact be visualized by PCA’s most important output plots: scores (for samples) and loadings (for variables) plot.
It is important to stress, however, that chemometrics goes far beyond PCA, and the application of other tools depends on the aim of the research. A chemometric method, the design of experiment (DoE) [11,12,13], can be used before sample analyses to optimize the analytical parameters. To achieve a good separation of complex matrices, there could be many analytical parameters that should be optimized (extraction, mobile phase, column type, detector, elution gradient, etc.), clashing with the need for economical and fast method optimization, which cannot take every single parameter variation into consideration. For this reason, DoE was developed to analyze data from a few selected experiments to find the best combination of parameters to bring forward.
Several chemometric analyses have been developed to address classification, i.e., to classify samples to one class between those analyzed, and regression, i.e., to quantify one or more species present in the sample(s). The most used are cluster analysis (CA) [14] for data exploration more quantitative than PCA, linear discriminant analysis (LDA) [15] for classification and partial least squares (PLS) [16] for regression. PLS discriminant analysis (PLS-DA) [17], moreover, is a well-known PLS method developed for classification purposes. Another important field of application of chemometrics is data pretreatment. This field includes a wide range of methods (and many are still under development) that goes from chromatograms alignment [18] to noise reduction [19] and more. The goal of the present work is not to define which chemometric is “the best” one, since there is no general answer. Indeed, this task is strongly problem-dependent and a method that is not satisfactory in one case may be the optimal one in another. Therefore, there is no a priori unambiguous method for defining which processing is optimal for obtaining the best results, except in a few particular cases. In several works, several methods are applied to the same dataset and the model that provides lower errors and better predictions is considered the best one to describe the problem under investigation.
This review aims to explore the ways that chemometrics, in its various declinations, can assist analytical chemists in terms of data elaboration and method design, focusing on what can be achieved by applying chemometric approaches to separation science. Recent applications of chemometrics in separation analyses, in particular in GC, LC (and, mostly, high pressure liquid chromatography, HPLC), SEC and FFF will be detailed to visualize the state of the art of separation chemometrics, encompassing volatile, soluble and solid (colloidal) analytes. The samples considered will range from food chemistry and environmental chemistry to bio/pharmaceutical science.
As GC and HPLC are more often coupled to statistical evaluation, the focus will rather be on “hot topics” or novel methods. Instead, since the application of chemometrics to colloidal analysis is still at an early stage, the last part will envision new applications and perspectives.
2. Overview of the Main Chemometric Techniques and Their Advances
In this work, the application of many chemometrics elaborations to different analytical problems will be presented. In this section, the most common chemometric techniques (PCA, CA, LDA, PLS and DoE) will be briefly presented and described. When necessary, these and their advancements will be described in a more detailed way in the following sections. These methods are the most used chemometric tools and serve as a base from which the most modern evolutions have evolved.
2.1. Principal Component Analysis (PCA)
PCA [9,20] is the most important and famous multivariate chemometric method [21]. It is used for the initial exploration of datasets, and it is usually coupled with other techniques which will be detailed later. Through a linear combination of the original variables, PCA converts them into new variables, called principal components (PCs) (or latent variables), orthogonal to each other. During this process, the original information is “distributed” to the PCs in a decreasing way: the first PC keeps most of the information (explained variance, EV), the second keeps most of the residual EV, and so on. PCA is therefore used to reduce the number of variables for describing the problem and the redundancy between the independent dimensions. It can provide information about the relationship between the samples and variables, to find groups of them (cluster of samples or variables carrying similar information), and to detect outliers. These goals are achieved by a deep visual inspection of its powerful and highly explanatory graphs: loadings plot, to evaluate variables’ role, and scores plot, to evaluate samples. From PCA, several exploratory methods have been developed based on the same concepts but more evolved and performant, such as 3D PCA and multiblock PCA.
2.2. Clusters Analysis (CA)
CA is another exploratory technique, based on the mathematical concept of similarity between data, which in turn is linked to the concept of distance. The basic idea is that two generic objects are more similar the smaller their mutual distance. There are various definitions of mathematical distance that are used in CA: Euclidean, Manhattan, Pearson and many others [22]. The algorithm used for CA is largely described by Nguyen et al. [23]. It has to be noted that, in some works, CA is used as a classification method, or the clusters obtained are considered classes. However, CA results are strongly influenced by the chosen type of distance and the presence of outliers in the dataset, thus the authors discourage the use of CA for classification and suggest the limiting of its use to exploratory purposes.
2.3. Design of Experiments (DoE)
DoE [11,24] is an important multivariate regression method, applicable to numerous research fields. Its aim is to define the relationships existing between a set of experimental variables (e.g., components of a mixture, temperature, humidity) and the final properties of the product(s) (output variables) in a specific system. The experimental variables (factors) are chosen as the most influential for the product (therefore, some knowledge about the problem is needed a priori) and, for each of them, some experimental values (levels generally, but not limited to, two or three). The maxima and minima levels of the factors define the experimental domain. Then, the experiments defined by the combinations of factors’ levels are carried out and the products’ properties (responses) are evaluated. DoE regression uses the response(s) as dependent variable(s) and the factors as independent ones.
The application of DoE generally has two goals: the first one is the prediction, within the experimental space studied, of the behavior of the responses; the second is the optimization, through the use of different techniques (response surface methodology, desirability function) of the optimal process conditions to obtain the best possible product properties.
The limit of this method is the impossibility of working in an extrapolative mode, i.e., only the results obtained inside the experimental domain are reliable.
2.4. Linear Discriminant Analysis (LDA)
LDA [15] is the most famous and used classification method. Similar to PCA, it performs a projection of the original data onto a new, lower-dimension space. The most important characteristic of this space is that it maximizes the variance between classes and minimizes the variance within the classes. This allows the maximization of class separability in the model, and a new object projected onto the model can be assigned to one of the known classes. The algorithm, together with some limits, of LDA is described in detail in the paper of Gaber et al. [15].
2.5. Partial Least Square (PLS)
PLS [16] is one of the most powerful and widely used multivariate regression methods. It allows the computation of regression models even with highly correlated variables (as for chromatograms or spectra) or when the number of samples is lower than the number of variables, in which case the traditional regression modelling, as ordinary least squares (OLS), cannot be used. The PLS algorithm maximizes the correlation between dependent and independent variables by calculating factors (in a similar way in which PCA calculates the PCs) from their matrix products.
The PLS method can be applied every time it is necessary to perform a regression model (even if its results are poor because the number of variables is low, i.e., in the cases in which OLS can be applied). Moreover, it has been used as the starting point for more advanced and complex chemometric methods. For example, PLS-DA (PLS discriminant analysis) [17], which exploits the PLS regression for classification purposes (useful to perform classifications using chromatograms or spectra) or SO-PLS (sequential and orthogonalized PLS) [25], which is capable of processing composite datasets by merging data from different analytical methods.
3. Gas Chromatography (GC) and Chemometrics
GC is an analytical technique very prone to being combined with chemometrics, because a gas-chromatogram is always composed of several peaks that are not always totally resolved. It is often likely that two or more volatile molecules have the same retention time, e.g., aldehydes with a similar number of carbons. Therefore, particularly when GC is not hyphenated with a MS detector, the fingerprint approach is a valuable approach to use GC data. A bibliographic study on Scopus carried out in October 2022 with the two keywords “chemometrics” and “GC” limited to the last two years (2021 and 2022) produced more than 500 results, demonstrating how much attention is dedicated to this kind of research.
Most of the papers concern food analysis. Foods, indeed, have a strong volatile component composing their aroma that is very characteristic, sometimes more so than taste. The volatile fraction is so characteristic that it can be used to compare and differentiate groups of samples of foodstuffs based on their different origins. This can be achieved with a GC hyphenated with an FID detector, thus in a fully untargeted way, which was exploited for different matrices. GC-FID was used to discriminate the geographical origins of extra-virgin olive oil [3] by PCA and PLS-DA, to understand the botanical origin of twelve classes of honey samples by LDA [26], the geographical origin of Prosecco wines, again by LDA [27], to compute a PLS model for the quantification of adulterations in saffron [28] and, recently, to evaluate the differences in tomato sauce due to brands and producers by PCA [29].
An interesting work using GC-MS and chemometrics to analyze coffee is the one carried out by Abdelwareth et al. [30]. In that case, the ability of PCA and PLS to discriminate different samples and identify the most discriminative molecules was combined with MS, which determined the specific molecules selected. In that way, it was possible to discriminate coffee samples based on seeds origin, roasting degree and brewing method and to evaluate the molecules that mostly provided such discrimination (e.g., it was found that pyrazines, furans and aromatic hydrocarbons were more abundant in Coffea robusta than Coffea arabica). Coffee is a good example of a food matrix with a characteristic aroma, making it very interesting for GC analysis. Indeed, several other works dealt with this matrix. Zakidou et al. [31], for example, evaluated the geographical origin and roasting level of coffee samples by CA and PCA, using MS and solid phase micro-extraction (SPME) for variables identification. Gancarz et al. [32], instead, used a GC-electronic nose (e-nose) system to evaluate the content of pyridines due to roasting procedures on coffee beans by PCA. Finally, Bressanello et al. [33] fused data coming from GC-MS and LC-UV to perform an untargeted comparison of the analytical data and the sensory evaluation from a panel test by PCA and PLS, concluding that the volatile profile is the most informative to delineate the coffee flavor.
Honey is another matrix well studied by GC. It has been demonstrated in several works [26,34,35] that the volatile fraction of honey is strongly related to its floral origin. This raises substantial interest, most of all from a commercial point of view, because honey produced from a single plant (or at least having a higher percentage of pollen of a single plant) has generally a higher commercial value than “multifloral” honeys that are more common but present a poorer taste. The work of Zhu et al. [35] compared five types of Chinese unifloral honeys, analyzing them by GC-MS and sensory analysis and elaborating the data with PCA and orthogonal PLS-DA (OPLS-DA) (Figure 1).
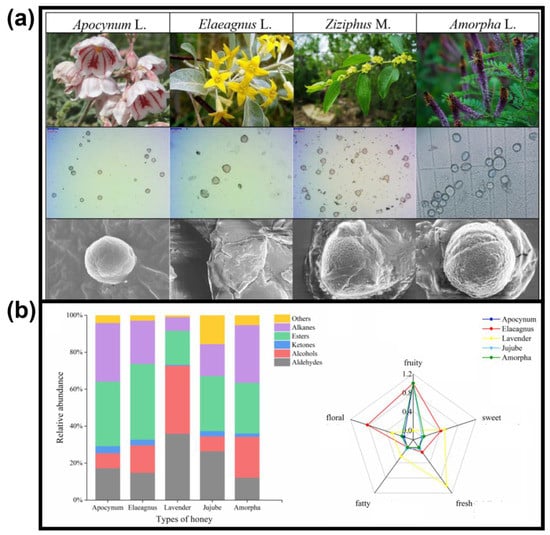
Figure 1.
(a) Four types of unifloral honeys studied by Zhu et al. {Zhu, 2022 #169}: flowers (upper portion), pollen grains by optical microscopy (central portion) and pollen spores by scanning electron microscopy (lower portion). No pollen was detected in lavender honey due to asexual reproduction of lavender crop. (b) Volatile composition (left portion) and aroma profile (right portion) of the five types of unifloral honeys. The aroma characteristics were obtained by the odor contribution rate of volatiles. Adapted with permission from Zhu et al. [35].
From the chemometric elaboration of the 92 molecules found, 51 of them contributed to the discrimination of the five classes. Similar studies, but ones which only took into account one honey class (Quercus ilex honeydew and pine honeys) and focused on geographical origin, with samples coming from several regions of Greece and Turkey, respectively, were carried out by Karabagias et al. [36] and Duru et al. [37] by PCA and stepwise LDA (SLDA), or by PCA and CA. Karabagias [38], instead, coupled GC-MS and chemometric analyses (PCA, LDA and univariate analysis of variance, ANOVA) to study the ageing of honeydew honey during one year of in-house storing. Two works by Karabagias [39] and Passarella et al. [40] demonstrated by GC-MS, PCA and ANOVA that honey (collected from Greece, Italy and Serbia) can be contaminated by environmental volatile organic carbon (VOC) species, leading to concerns for consumers’ health.
Coffee and honey are optimal examples of food matrices well studied in the literature in the last few years, however the combination of GC and chemometrics finds applications for many other foods. For example, the evaluation of geographical and cultivar origins of extra-virgin olive oil (the most valuable class of olive oil) received great attention [3,41,42], with the added aim of finding possible adulterations [43,44]. De Flaviis et al. [45] performed an in-depth study on wheat (based on PCA and PLS-DA) to evaluate the factors influencing the VOC’s profile (genetic, soil, weathering and altitude of farming). Cervellieri et al. [46] used a GC-MS-eNose to discriminate Italian wheat pasta from pasta produced with mixtures of wheat from different origins. Oliveira et al. [47] used PCA and PLS-DA on GC-MS data to differentiate mint samples based on the different agricultural methods (conventional, organic and permaculture) and to evaluate the most discriminative molecules. Due to their intense aroma, spices are very interesting matrices for GC analysis, and their commercial value makes them prone to adulteration. Therefore, authentication of spices is a topic of great interest, and several works are devoted to this. In a recent paper of Ford et al. [48], a database for spices authentication by GC analysis was created, analyzing standards of VOCs generally present in several spices. Chemometrics was used mainly to optimize the database’s peak identification, in order to be able to widen its use when GC parameters were modified. Analyses on specific spices, with the aim of studying their geographical origin or possible adulterations, were mainly focused on saffron [28,49,50], cinnamon [51,52] and ginger [53,54].
Besides food chemistry, environmental chemistry also takes great advantage from the coupling of GC and chemometrics. Perin et al. [55], for example, studied the anthropogenic contamination of Lake Guaíba, Brazil, analyzing samples with GC-MS, LC-MS and Inductively Coupled Plasma Mass Spectrometry (ICP-MS). Puorasil et al. [56] developed a chemometric method based on multivariate curve resolution (MCR) to improve the quality of GC-MS data (overcoming the problems of poor peak alignment and coelution of species) to study both qualitatively and quantitatively the indoor pollution. Mazur et al. [57] used GC-MS to identify pollutants in snow samples coming from several areas of Moscow city, and CA and Spearman correlation analysis [58] to evaluate the spatial distribution of pollutants. Omokpariola et al. [59] used GC-FID to quantify the presence of hydrocarbons coming from petroleum processing in several samples of rainwater in Nigeria. The contamination found in that region is a serious problem, due to dermal and skin exposure, because rainwater is also a source of drinking water. The work of Peñalver et al. is also interesting [60], elaborating data from GC-MS by PLS and orthogonal-PLS (OPLS), to quantify VOCs in plastic samples, with the aim of using their concentrations for the quantification of recycled polyethylene terephthalate in plastic samples (Figure 2).
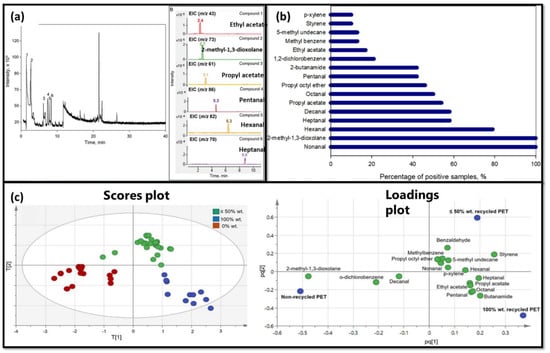
Figure 2.
Application of PCA to recycled PET samples. (a) Example of full-scan GC-MS chromatogram of a PET sample, with six ion chromatograms of specific compounds, recognized based on characteristic m/z ions; (b) percentage of PET samples in which the reported compounds were detected; (c) PCA of the PET samples: scores plot (in the left) where samples are colored based on the percentage of recycled PET (0%, ≤50%, and 100%) and loadings plot, with centroids of scores highlighted. Adapted from Peñalver et al. [60].
Such VOCs may indeed either be produced by the recycling process or be residues of the previous use of plastic material.
Another interesting field of the application of GC analysis, where chemometric can offer improvements in terms of data analysis, is the clinical and forensic one, although results are still at a research stage. Forensic analyses (but also clinical ones) are strictly regulated and, therefore, carried out with different validated analytical methods. However, some research based on GC were proposed, at least to be used as simpler screening methods before performing official chemical analyses. Hermelin et al. [61] used pyrolysis-GC-MS (and infrared spectroscopy) and PCA for a preliminary study to evaluate possible markers of vaginal residues on condoms, in order to detect victims of sexual assaults. Podolskiy et al. [62] analyzed the steroid profile of urine samples by GC-MS and analyzed data by LDA and a neural-network based discriminant analysis to evaluate the degradation of samples for anti-doping analyses. VOC analysis of urine samples was also used to evaluate the efficacy of antitumoral treatment of breast cancer by Grocki et al. [63]. Yang et al. [64], instead, analyzed urinary samples to evaluate candidate metabolites for the diagnosis of inherit metabolomic diseases. Aliaño-González et al. [65] applied PCA and LDA to GC data of firefighters’ coats to discriminate those exposed to fire from the non-exposed ones, in order to identify toxic substances to which firefighters can be exposed. Two interesting works of Bogdal et al. [66,67] focused on tracing gasoline residues in fire debris, with the aim of identifying arsons. These works tested the use of several machine learning methods to discriminate debris with the presence or absence of ignitable liquid trace.
Machine learning is a “new” frontier of chemometrics in which models are computed in an iterative way, with the computation that “learns” from data: once a model has been computed, the calculation starts again using the previous results as starting points, instead of the original data, and this procedure is carried out iteratively until a satisfactory result, or a convergence, is reached. Bogdal et al. tested random forest, gradient boosting, support vector machine, naïve bayes, logistic regression [66] and convolutional neural networks on GC-MS spectra converted to images [67]. Satisfactory results were obtained for most of these methods, except for logistic regression and naïve bayes, for which, probably, there were not enough samples. Machine learning techniques are applied to overcome the limitations of all the basic chemometric tools presented in Chapter 2 of not being able to work with 3D datasets, as those coming from GC-MS analyses. However, these methods must also be used with caution, because the results, as shown in Bogdal’s works, can be not fully satisfactory, in particular if the unknown samples belong to a “shadow zone” and are not fully explored by the standard samples used to train the model.
The previously reported works are only some of the examples of chemometrics advancements applied to GC analysis, but several other papers applied advanced chemometric tools to optimize the results obtainable by gas-chromatograms. Parallel factor analysis (PARAFAC) [68] and its evolutions (as PARAFAC2) have been receiving great attention in the last few years, and not only for GC analyses, although the first studies using such techniques date back to the 1970s [69]. Giebelhaus et al. [70] applied PARAFAC2 algorithm to GC data to find the most important chromatographic peaks that can be distinguished from noise, while Ochoa et al. [71] introduced a further algorithm, the class comparison enabled mass spectrum purification (CCE-MSP), to better resolve peaks from a two-dimensional GC (GC×GC)-MS analysis.
Data fusion [72] is another topic of interest in chemometrics that has also been applied to GC data. Data fusion, in general, means the fusion of several datasets (also called blocks), that may come from different kinds of analysis, to calculate a single chemometric model. Generally, data fusion is made at low-level, appending one block after another to create a single dataset, or at middle-level, starting from the model obtained from the first block and “fusing” the second block to extend the model results. A further step proposes high-level data fusion [73], fusing the results of the models from single datasets, but it is generally less used. Data fusion was used, for example, in the aforementioned work of Bressanello et al. [33] about coffee aroma, but also by Strani et al. [74] who used low-level data fusion to use two gas-chromatogram coming from two GC columns with different polarities to study the characteristics of Italian basil. Furthermore, in the work by Perin et al. [55] on the contamination of Lake Guaíba, a low-level data fusion was used to combine the data from GC-MS, LC-M and ICP-MS. A mid-level data fusion was applied by Rivera-Pérez et al. [75] to fuse data from GC-MS, HPLC-MS and proton nuclear magnetic resonance for the geographical discrimination of black pepper samples.
It is worth noting that only a few works [50,76,77,78,79] used the design of experiments (DoE) for the optimization of analysis parameters and sample extraction procedures. Although not innovative from a chemometric point of view [80], the use of DoE for the optimization of the analytical procedure before sample analysis is greatly encouraged by the authors. It allows the saving of resources and time in the optimization step, requiring a lower number of experiments to find the optimal analysis conditions.
In the last few decades, Ion Mobility Mass Spectroscopy (IMS) is gaining great attention as detector for GC analysis [65,81], as an alternative to traditional MS or as a pre-filter before it. Indeed, IMS performs a further separation of analyte after GC column by ionizing the molecules and subjecting them to an electric field, carrying them toward a Faraday plate (or the MS chamber) while a drift gas flows in the opposite direction. In this way, the speed of molecules depends on their charge, but also on their dimensions, due to the presence of the drift gas. Works using IMS as a GC detector have increased over the last few years, also due to the cost reduction of the instruments [81]. It is also worth noting that often GC-IMS systems do not require the chemical pre-treatment of samples before the analysis, when working in head-space mode, making it a great advantage in terms of costs, but also of sample representability [29,82]. The second level of separation, however, produces two-dimension chromatograms, that require chemometrics for a proper elaboration [29]. Chen et al. [83] used GC-IMS with PCA and CA to evaluate the change in rice VOCs during storage. A following work [84] instead applied PLS to GC-IMS data to study the aging of Baijiu, a Chinese liquor. Yang et al. [85] used GC-IMS, GC-MS and GC-e-nose to follow the change in the volatile fraction of green tea during the manufacturing process, paying particular attention to the products of Maillard reaction (Figure 3); analyses were elaborated by PLS and OPLS.
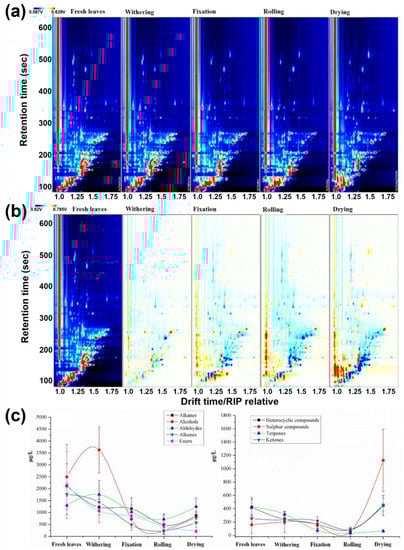
Figure 3.
Volatile fraction of Chinese leaf tea analyzed during the manufacturing process by GC-IMS (a,b) and GC × GC-MS (c); (a) GC-IMS 2D chromatograms, the vertical axis corresponds to gas-chromatographic retention time, the horizontal axis to the IMS drift times and the color scale (increasing intensities from blue to red) the content of the volatile component; (b) comparison of the manufacturing stages using fresh leaves as standard (first plot): the blue points represent decreasing substances, the red one increasing substances; (c) changes in the major components of volatile fraction in the manufacturing process evaluated by GC × GC-MS. Adapted with permission from Yang et al. [85].
Mi et al. [86], instead, studied the volatile composition of chili peppers, in particular the flavonoid-related species, discriminating two genotypes of them by PCA and PLS-DA. Christmann et al. developed a chemometric method based on PCA and PLS-DA to unfold high-dimension GC-IMS data and find the most relevant variables (i.e., chromatographic peaks in the 2D IMS-plot) [87] and tested a Python free package to elaborate GC-IMS data in an user-friendly way [88].
4. High-Performance Liquid Chromatography (HPLC) and Chemometrics
HPLC is one of the most used chromatographic techniques. By separating species in a liquid matrix, it is suitable for all fields, from food analysis to biological-pharmaceutical chemistry. Just like GC, a huge amount of data is produced by downstream separation, frequently requiring chemometric elaboration to provide the expected information. With HPLC data, both univariate and multivariate chemometric processing can be used.
Univariate analysis is mostly used when a single chromatographic peak corresponding to the analyte of interest is considered, for example, for quantification purposes through the interpolation with a regression line build with calibrating standards [89]. This review, however, is focused on the multivariate use of HPLC data. Similar to GC, both targeted and untargeted approaches can be used. Choi et al. [90], for example, evaluated the total phenolic content and determined eleven of them by PCA, to study the effect of storage time and heat treatment on dried citrus peels (used in Chinese traditional medicine). Li et al. [91], instead, used an untargeted analytical method for the metabolomic study of urine samples to find possible biomarkers of pediatric asthma using three chemometric elaborations (PCA, PLS-DA and OPLS-DA). With this method, the authors were able to find a total of 26 potential biomarkers, 17 of which were found to be associated with respiratory diseases.
The application of DoE for HPLC is generally very useful when planning a new analysis on a mostly unknown matrix, since it allows the optimization of several separation variables (mobile phase, gradient, column type, etc.) with a lower number of experiments. Applications of DoE to HPLC for pharmaceutical science can be found in the review of Stojanović et al. [92,93]. Two interesting works applying DoE to optimize HPLC performances are those of Herrero et al. [94] and Durante et al. [95]. The first work [94] shows the optimization of a procedure for the determination of very similar biogenic amines (histamine, putrescine, cadaverine, tyramine, tryptamine, 2-phenylethylamine, spermine and spermidine) in swordfish by HPLC-Fluorescence (FLD), after extraction with acid and the subsequent derivatization with dansyl chloride. A D-optimal experimental design was applied, varying ten chemical or experimental variables with different levels. A complete factorial design would have required 3456 experiments, whereas the D-optimal design required only 23 of them. Durante et al. [95] instead optimized an HPLC method for the simultaneous determination of multiple bioactive cannabinoids, another group of several molecules with similar chromatographic properties (Figure 4a). To optimize the chromatographic separation, six main factors were chosen, and the DoE results (Figure 4b) brought an optimal separation of all the species (Figure 4c).
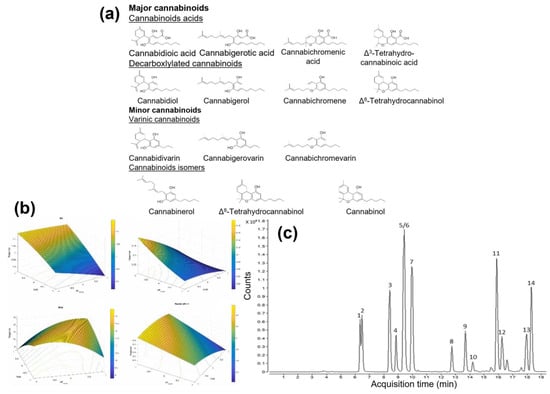
Figure 4.
Main results of the paper from Durante et al. [95]. (a) Chemical structure of the fourteen cannabinoids analyzed in the work; (b) the four principal response surfaces used for the optimization of the HPLC chromatographic method; (c) optimized chromatogram of the fourteen cannabinoids molecules. Figure provided with the author’s consent.
DoE found several applications in drug stability studies. For example, Prajapati et al. [96] applied DoE to optimize the chromatographic separation of Bosutinib, a thyroid kinase inhibitor drug, finalizing a new analytical method for controlling its quality and stability. Gopireddy et al. [97] applied DoE to optimize HPLC parameters (column temperature, flow rate and percentage of methanol in the mobile phase) for the separation of thirty diastereomeric analogs and six process related impurities. The developed method was validated for linearity, range, precision, accuracy, specificity, selectivity and intermediate precision. DoE was also used for food samples, as reported by Sahu et al. [98]. Andruszkiewicz et al. [80], for example, performed a DoE to optimize the roasting procedure of cocoa, using the chromatographic results as model response.
Chemometrics in HPLC analysis is also very useful for pre-treating chromatograms, especially when data is then further elaborated through non-targeted chemometric analyses. Indeed, from replicates of the same LC analysis, slight peaks shift can be observed. This effect is mostly attributed to column ageing but can also be caused by temperature differences or minute pressure changes. Such deviations, when detected, should be corrected prior to the performance of chemometric analysis. Chromatogram’s alignment consists of constructing a function able to warp the content of runs to match a reference sample. Broadly considered, there are two approaches to chromatogram alignment [18] mainly employed for datasets aimed at fingerprinting analysis [99]. The first identifies common features in the chromatograms to be aligned, forces alignment of these features and then interpolates an alignment function between these fiducial features. The difficulty of this approach lies in defining and detecting consistent features in real data [100]. The second approach seeks to align every point of the chromatogram without any added importance given to chromatographic features, by finding a warping function that minimizes the discrepancy between two chromatograms across the entire range of retention times. A recently developed aligning approach is the purely geometric framework able to separate the phase and the amplitude variability based on an extension of the Fisher–Rao metric. It has been described and applied to the problem of chromatogram alignment by Tucker et al. [101]. Typical proteomic samples, after digestion, contain several thousands of peptides, with variable concentrations in a scale of several orders of magnitude. To create a possible direct comparison of the data of different proteomic samples, the data must be aligned and, if possible, alignment process should be automated. Several so-called time-warping algorithms are available for this task. In particular, dynamic time warping (DTW) [102,103,104], and correlation optimized warping (COW) [105,106] have been deeply described (Figure 5).
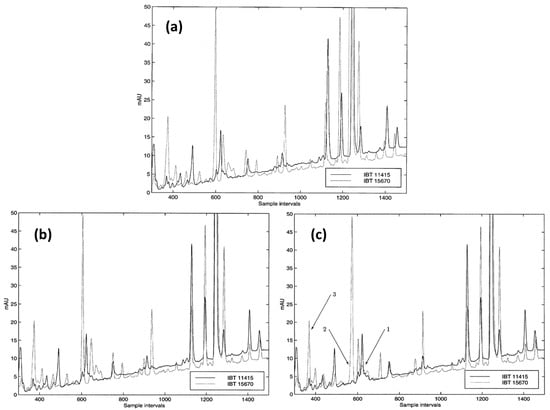
Figure 5.
An example of chromatograms alignment with the correlation optimized warping (COW) algorithm. (a) Superimposed original chromatograms of two Penicillum cyclopium samples (IBT11415 and IBT15670); (b,c) the same chromatograms after COW alignment with two different sets of input parameters. Peak 1 is the most shifted one, peak 2 is the most stretched and peak 3 the most shrunk by the chemometric procedure. Adapted with permission from Vest Nielsen et al. [105].
Another interesting method for HPLC data pre-treatment is peak deconvolution, when two or more species co-elute during analysis. De Luca et al. [107], for example, applied multivariate curve resolution-alternating least squares (MCR-ALS), to resolve coeluted peaks and quantify caffeine and chlorogenic acid content in green coffee beans. With this chemometric elaboration, the authors were able to find and resolve the peaks relative to five components although co-eluting, that were then used for classification purposes with PLS-DA, and quantified the concentrations of the analytes of interest.
After optimizing HPLC parameters, performing the analyses and the proper (if necessary) data pre-treatment, liquid chromatograms are ready to be used for downstream chemometrics analyses. Generally speaking, the application of chemometrics to HPLC data allows the finding of discriminations between groups of samples, and to find the most important variables for such discrimination. Therefore, PCA and classification methods are the most common techniques. The main fields of application of such methods are food, pharmaceutical and clinical analyses.
An example of an application to food analysis is the work of García-Seval et al. [108], who used PCA and PLS-DA on an untargeted HPLC-UV analysis of polyphenols in honey samples to discriminate six different botanical classes. This work is interesting because the full chromatogram was used as a fingerprint for the chemometric analysis, without integrating peak areas or quantifying any chemical species. Moreover, no particular chemical extraction was carried out on honey samples, except for a solubilization in water and methanol and a centrifugation and filtration step. It is clear that a full-untargeted approach, as in this case, has the disadvantage of not recognizing the molecules to which the classification is due; however, the chemical analyses are much faster and cheaper. Indeed, they do not require standards to recognize the analyzed molecules, and the analytical optimization step is very limited, if not absent, because the important goal is to have chromatograms with sharp peaks, even if some molecules can co-elute. Similarly, Núñez et al. [109] used an HPLC fingerprint of coffee samples to discriminate different varieties, production countries and roasting degrees by PCA and LDA. Carabetta et al. [110] used a pulsed amperometric detector (PAD) following an HPLC analysis to characterize the sugar content of honeys and discriminate them by botanical and geographical origin by PCA and LDA. Su et al. [111] used PCA and Hierarchical CA (HCA) to discriminate the geographical origins of Chinese green tea based on amino acid, polyphenol and caffeine content that were quantified by HPLC-UV, demonstrating that amino acids are very important for such discrimination. Campmajó et al. [112] worked on a hen–egg matrix, applying PLS-DA to HPLC-UV profiles to classify eggs in four groups, according to their production method: organic, free-range, barn or caged. Biancolillo et al. [113] fused HPLC data with data from other techniques (among the others, also GC) by multi-block analysis (sequential and orthogonalized PLS, SO-PLS) in order to correlate chemical data of chocolate samples to their sensory poles. Similarly, Ghanavati et al. [114] fused HPLC data to infrared spectra to discriminate the botanical origin of honey samples. These last cited papers show the importance of analyzing samples with several different techniques to obtain a larger amount of information for chemometric analysis. As already stated in the previous chapter, multi-block analysis [72,115] is a new frontier in the chemometric analysis of data, with an extremely promising outlook.
Several examples of HPLC analyses coupled with chemometric for clinical applications are present in the literature. Indeed, metabolomic studies on biological fluids (e.g.,: urine, saliva, blood and serum) can be useful to detect the presence of a disease and to discriminate healthy and sick patients, as in the already cited work of Li et al. [91]. Moreover, they can be non-invasive for the patients if carried out on urine or saliva, which should be greatly encouraged, and the use of chemometric tools becomes crucial to evaluate the contemporary effect of several metabolites. In this sense, Zhao et al. [116] used PCA and OPLS-DA in a preliminary search for metabolite biomarkers to explore the abnormal urinary metabolic pathways associated with myocardial dysfunction. Similarly, Yao et al. [117] used PCA and PLS-DA on HPLC-MS data to investigate the effect of an hepatoprotective treatment in liver-injured rats, finding differences in metabolic pathways of plasma and urine. An interesting work dealing with metabolomics in biological fluids is that of Speltini et al. [118], who developed, by the application of DoE, an extraction method based on a particular sorbent, called HA-C@silica, for the further HPLC analysis of steroid hormones in human plasma. The extraction method proved to be very efficient and simple, and the low affinity of the material for proteins made it a promising application for hormones analysis. Finally, Yang et al. [119] applied artificial neural network (ANN), an improved classification method, to the HPLC data of urinary and serum samples, with the aim of using nucleosides concentrations for the clinical diagnosis of cancer. With this chemometric elaboration, the authors achieved 92.9% of correct predictions between healthy and cancer patients.
Several studies showed the application of ANN to HPLC data or its comparison with other classification methods, demonstrating the interest in this approach, despite being more computationally costly compared with LDA and PLS-DA. However, in most cases ANN allows the improvement of sample classification. Hakimzadeh et al. [120], for example, applied ANN to chromatographic fingerprints of Salvia reuterana coming from five Iranian regions, to confirm the classification results obtained with PCA and CA. Wang et al. [121] applied LDA, ANN and another classification method, least squares-support vector machine (LS-SVM), to discriminate the different species and geographical origins of Radix Paeoniae samples by multi-wavelength HPLC-DAD (diode array detector) analysis. Welsh et al. [122], instead, used HPLC trace impurities profiles of pharmaceutical samples to classify the drug L-trytpophan according to manufacturers. Six manufacturers were considered, and data were elaborated with three different classification methods: ANN, CA and soft independent modeling of class analogy (SIMCA). ANN allowed the best classification model to be obtained, with 93% of correctly classified samples.
Other pharmaceutical applications of HPLC-chemometrics are aimed, for example, at understanding the relationship between drugs and their pharmacological activity. This is the case of the work by Stasiak et al. [123], in which PCA was applied to determine relationships between structural parameters and HPLC retention data obtained for eleven cardiovascular drugs. A perspective of such study is also to evaluate further drug candidates against known ones according to similarities in their pharmacological properties with a simple PCA model. Saber et al. [124] applied PCA and PLS-DA to the HPLC-MS metabolomic profiles of five Pinus species needle samples to evaluate their in vitro anticholinesterase, antiaging and anti-diabetic potential, due to their high content of flavonoids, phenolics, lignans, diterpenes and fatty acids. De Luca et al. [125] applied MCR-ALS to HPLC data to evaluate the photostability of hydrochlorothiazide and amiloride after irradiating their solutions with visible light at different pH values, and analyzing such solutions during the degradation process. An interesting application of PCA to HPLC (and 1H NMR) data of pharmaceutical samples is that of Raimondo et al. [126], who performed a geographical discrimination of sources of ibuprofen (from European and Asian countries) based on chemical characteristic and impurity patterns. While it is very common to be used in the geographical discrimination of food samples, as demonstrated many times in this review, this is the only work, to the authors’ knowledge, that deals with the geographical discrimination of a pharmaceutical ingredients. Finally, the pharmaceutical field is increasing the use of DoE to develop HPLC methods able to separate several pharmaceutical ingredients in the same drug samples [127,128,129].
Quantitative analysis in the HPLC field generally aims at quantifying one or more specific analytes in a complex matrix after the separation step. However, multivariate regression has also been applied to HPLC data to achieve different tasks. For example, Carranco et al. [130] applied a PLS model to entire chromatographic profiles of olive oils to quantify adulterations in Arbequina extra-virgin olive oil (EVOO) with Picual EVOO, refined and sunflower olive oils (Arbequina and Picual are two Spanish monovarietal EVOOs). As stated by the authors [130], this kind of study can be carried out by also quantifying specific markers. However, such markers could be not present in some matrices, or they can be difficult to separate by HPLC, or they could require a tedious chemical pre-treatment. The method proposed by Carranco et al. was very easy (only an extraction with water and methanol and a centrifugation step were carried out) and proved to be very precise, with quantification errors in the order of 2%. Similarly, Nuñez et al. [131] applied PLS to HPLC with a fluorescence detector (FLD) to quantify several home-made adulterations of coffee samples with coffees from different geographical origins (Figure 6).
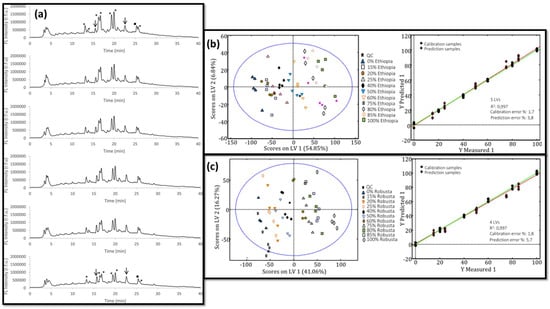
Figure 6.
PLS applied to HPLC full chromatograms for the quantification of coffee adulterations. (a) Chromatograms of Vietnamese Robusta coffee adulterated with pure Cambodian coffee at (from top to bottom) 0% (pure Vietnamese), 20%, 40%, 60%, 80% and 100% (pure Cambodian), highlighted peaks are those that decrease (asterisk), remain constant (circle) or increase (arrow) with adulteration; (b,c) PLS models for Colombian coffee adulterated with Ethiopian coffee (b) and Vietnamese Arabica adulterated with Vietnamese Robusta (c), scores plot (left portion) and response plot of predicted vs measured percentage of adulteration for both training (●) and test (♦) sets. Adapted from Nuñez et al. [131].
The works of Dinç-Zor et al. [132] and Garrido Frenich et al. [133] dealt with the application of PLS and ANN for the direct quantification of several pharmaceutical ingredients in a complex matrix, even when the chromatographic peaks are not totally resolved. PARAFAC analysis was applied by Guizellini et al. [134], although not for a strictly quantitative analysis. They applied PARAFAC to HPLC-DAD data to discriminate three coffee cultivars by combining HPLC and spectrophotometric (from DAD) information. The PARAFAC model allowed for the analysis of the three-dimensional data block, composed of the chromatograms with DAD spectra on the third axis, and to discriminate coffee cultivars based on the different quantities of some specific markers. Sun et al. [135] applied n-way PLS to HPLC with a fluorescence detector (FLD) data to use the 3D data block for evaluating adulterations in paprika samples. Arce et al. [136], finally, applied a PLS model to optimize the gradient of a ternary mixture of water, methanol and acetonitrile for HPLC analysis. They used a mixture of four aromatic amines of food interest as test samples.
5. Colloidal Analysis and Chemometrics
Colloids are multiphase systems in which one or more discontinuous dispersed phases are uniformly distributed in a continuous phase; at least one size of the units of the dispersed phases varies between 1–1000 nm [137]. The main characteristics of colloidal systems can be attributed to the existence of an interface between the dispersed phase and the dispersing medium, where a significant proportion of molecules is present at the interphase rather than at the bulk stage. Being deeply involved in an extremely wide range of topics (materials, food, biomedical science) colloids play an important role in our life, and a good knowledge of colloid chemistry is essential to further advance society [137]. Size exclusion chromatography (SEC) and Field Flow Fractionation (FFF) represent the main separation techniques involved in the analysis of colloidal systems and their instrumental setups are technologically close to GC and HPLC. Since colloidal matrices are often extremely complex, the results provided by the platforms can be extremely complex and rich with information. To extract all valuable information, efficient data-analysis strategies are evidently needed [138] and insights into the main chemometric methodologies for data pretreatment and analysis for flow-based separation platforms have recently been summarized [139]. This section will discuss some of the latest trends in multivariate chemometric applications involving the use of SEC and FFF technologies. A particular focus concerns the works in which SEC/FFF are not just used as preparative/separative techniques but as the main analytical tools on which chemometrics is applied.
5.1. SEC
Size exclusion chromatography separates molecules/colloidal populations according to their physical size in solution (hydrodynamic radius) in a range between 1 and 100 nm exploiting a column characterized by a porous stationary phase [140]. Bigger nanoanalytes are eluted first because they are excluded from the pores. Smaller molecules, which are able to access pores within the resin particles, permeate a larger accessible volume within the column and are eluted later. Moreover, SEC relies on the absence of any affinity interaction between the analyte and the stationary phase packed in the column thus separation can be achieved in isocratic conditions.
Food chemistry represents one of the most important topics in the colloidal world. CANonical DECOMPosition (CANDECOMP) FARAFAC and PCA combined with SEC analysis have been used to investigate the presence of fluorescent colorants and color precursors in sugar and beet sugar thick juice [141] and to classify oils based on their frying stability [142]. These studies, however, mainly use the SEC results as complementary information requiring additional measurements. Beretta et al. instead reported an interesting study exploiting PCA to discriminate different honey samples based only on the SEC-fractograms used as fingerprints (Figure 7) [143]. This approach performs extremely well and provides powerful information while overall reducing the amount of time and work required.
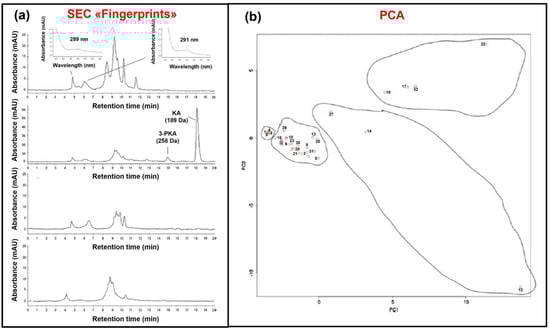
Figure 7.
Example of SEC-UV-chemometric of different honey samples. (a). The fractograms obtained from the platform are used as fingerprints for the sample and constitute the base of the PCA dataset. (b). Resulting PCA highlighting a grouping of the samples based on different geographic and botanical origins. Adapted with permission from Beretta et al. [143].
The use of SEC chromatograms (fractograms) as fingerprints for multivariate analysis has been exploited successfully for the analysis of polysaccharides. Within this framework Gao et al. exploited a multi-PCA approach using datasets obtained with different techniques (SEC-dRI, FT-IR, PCD-HPLC) to the analysis of the polysaccharidic content of different plants samples [144,145]. The results allowed for the differentiation of samples from the same plant species according to their geographical origin and variety. Another regional discrimination study based on polysaccharides analysis exploiting PCA and HCA has recently been reported by Zhu et al. [146]. Multivariate analysis of SEC results also helped to monitor the structural changes that take place in dissolved and degraded lignin during laboratory-scale kraft pulping [147]. The authors used SEC and 31P NMR as analytical techniques and the chemometric elaboration was performed not only through PCA on the different data sets but also through 2D cross-correlation (2DCC).
One of SEC’s most common applications consists of the separation/purification of other proteins and other samples of biological interest such as extracellular vesicles [148,149]. Literature studies exploiting multivariate chemometric approaches to SEC separation of proteins mainly focus on monitoring protein aggregation in different conditions, such as those detailed by Ricker et al. [150], on the effect of process passages (such as membrane filtration) [151] and on the discrimination of coeluting species [152]. Extracellular vehicles (EVs) are nano-sized, lipid bilayer-enclosed particles involved in intercellular communication. Although ultracentrifugation (UC) represents the golden standard in EVs isolation, recent studies support the use of SEC to provide a faster and cheaper separation of EVs capable to preserve their biophysical properties [148,153]. After isolation vesicles undergo characterization by different techniques such as Transmission Electron Microscopy (TEM), Tunable Resistive Pulse Sensing (TRIPS), Nanoparticle Tracking Analysis (NTA), Sodium Dodecyl Sulphate—Polyacrylamide Gel Electrophoresis (SDS-PAGE), Western Blot and IMS, often with the aim of finding composition marker of clinical interest. To extract the maximum amount of information multivariate chemometric analysis in often performed on the corresponding results. An example of this “three stage platform” (SEC-separation, characterization and chemometrics) can be widely found in the literature on numerous matrices such as fungal plants pathogens [154], blood and plasma [155,156]. In these kinds of studies, as already seen, PCA, Volcano plot and Differential Cluster analysis represent the most common chemometric tools.
Finally, Palviainen et al. studied differences in vesicles from blood samples of healthy volunteers collected into ACD-A, citrate, serum and EDTA tubes [157]. Additionally, to a characterization with the techniques described above, they added a SEC-FLD platform to quantify the amount of platelet-derived (CD61+) in the various samples. Statistical analysis on the results was conducted using Tukey’s multiple comparison test. Overall, the results of the study highlighted differences in protein composition of plasma EVs differed based on the anticoagulants used, and between plasma and serum. The study also represents a case in which SEC was the core technique and was not used simply as a purification/separation tool.
5.2. FFF
Field Flow Fractionation (FFF) is an emerging class of methodologies used to gently separate a wide array of nano-analytes (from small peptides to whole cells) based on their differential interaction with an external field [158].
The FFF instrumentation is essentially comprised of pumps for generating the eluent flow, sample injector and the separation device (channel) connected to the detectors. The separation channel is capillary, often has a rectangular section and does not contain a stationary phase making the FFF a single-phase technique [159]. The separation is achieved by the combined action of the laminar flow (possessing a parabolic profile) of eluent running coaxially to the channel and of an external field, applied perpendicularly. Sample components (the analytes) differing in size and/or other physical properties are driven by the applied field into different velocity regions within the parabolic flow profile of the mobile phase across the channel (Figure 8). Parabolic flow is characterized by maximum velocities in the center of the channel decreasing till it reaches zero at the walls [160]. Based on the size of the analyte’s different elution, patterns namely “Normal”, “Steric” and “Hyperlayer”, can be identified [161].
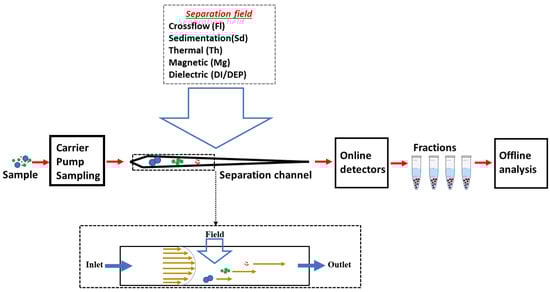
Figure 8.
Schematization of a typical FFF platform. The gray dashed box reports the different type of external fields that can be applied; the black dashed box schematizes the differential elution of the analytes in the channel while working under normal elution mode.
Separated analytes are typically characterized by a series of detectors online-coupled with the platform, but they can also be collected as fractions at the end of the FFF system to undergo further offline processing [162]. As well as with SEC, the exploitation of these offline-coupled FFF platforms or other orthogonal approaches is quite common while analyzing extremely complex samples such as whole serum [163] or cell culture mediums [164].
FFF technologies are characterized by an higher operational range than SEC, about 15 orders of magnitude mass-wise corresponding to a few nanometers to about 100 µm, and possess a series of characteristics unmatched by other separation techniques such as: (1) Extreme versatility both in terms of mobile phase and sample injectable volume, allowing it to work in conditions close to the native ones; (2) absence of stationary phase preventing undesired interactions between the samples components of the separative system. These features allowed FFF techniques to be exploited in a wide range of applications from the separation and characterization (mass, size and spectroscopic properties) of drug carriers [165,166], antimicrobial agents [167,168], biological samples of varying complexity [169,170,171] and other products of pharmaceutical interest [5,160].
Different FFF-sub techniques can be distinguished based on the nature of the external field which also defines the analytes’ properties at the base of their differential distribution within the channel and consequential differential elution and separation [159]. Flow-Field Flow Fractionation (FlFFF) exploits as an external field a second flow called crossflow, applied perpendicularly to the main flow. The crossflow drags the analytes towards the accumulation wall according to their diffusivity (correlated to their hydrodynamic radius). Today, FlFFF represents by far the most successful and exploited FFF variant due to the ability to provide uncorrelated mass/size information [172] and to its wide operational range. Three main subcategories of FlFFF are available: Symmetric FlFFF (mostly dismissed), Asymmetric FlFFF (AF4) [158] and its miniaturized version, Hollow Fiber FlFFF (HF5) [173].
The three main FFF application areas in which chemometrics plays an important role concern food chemistry, the speciation of serum components and dissolved organic matter (DOM) analysis. However, some studies on other matrices such as gelatins [174], dead oil [175], cells [176] and bacteria [177] are reported in the literature. The main chemometric tool exploited through FFF analysis is PCA, though Parallel Factor Analysis (PARAFAC) has also seen a wide application in DOM’s studies.
By interacting with each other, macromolecules such as proteins, polysaccharides and condensed tannins constitute the colloidal component of wine which impact its physico-chemical properties including stability, taste and mouthfeel [178,179]. An AF4 multidetection platform, combined with other offline analyses on the separated fraction, has proven suitable for the characterization of red wine colloids [180]. Since wine colloids are extremely heterogenous and their composition/content can vary greatly from wine to wine, depending on the grape characteristics and vinification practices, the use of chemometrics represent a powerful tool to further comprehend their role in wines’ properties. Pascotto et al. applied a PCA analysis on the results obtained through an AF4-multidetection platform highlighting the role of polysaccharidic material to counteract red wine astringency [181]. Variables for PCA were chosen from detectors’ fractograms (MALS, UV, dRI) and from UV spectra of different wine fractions using the CovSel procedure [182]. Recently, the effects of clarifiers on white wine colloids have been investigated by combining FFF multidetection and PCA by Osorio-Macìas et al. [183]. In this study AF4 was used to obtain a series of colloidal parameters (concentrations, molar mass, density, absorptivity) for clarified and unclarified wines which were combined in the PCA with analytical parameters (turbidity, instability, metal ion content, color, protein content, specific refractive index increment and total phenols) obtained from other measurements. PCA results highlighted different clarification results according to three different groups of clarifiers: minerals, synthetic polymers and vegetable proteins. Krebs et al. instead studied parameters that influence the perception of the intensity of palate fullness in commercial fresh lager beers though a correlation analysis and PLS [184]. Within this context an AF4-dRI-MALS platform was used to obtain most of the parameters used in the study.
These works, though extremely interesting, require a lot of work to obtain additional parameters to the ones provided by FFF. Within this framework the development of chemometric strategies exploiting only FFF-derived data can overall improve the efficiency of the study. Based on this concept Zappi et al. reported an AF4-multidetection-PCA study on the colloidal content of tomato sauces analyzing only information provided by the AF4 platform such as selected portions of the UV fractograms of the samples or the trough colloidal ratio [29]. Interestingly, the results obtained with this minimalistic approach yielded better results than the one provided by an already established GC platform (working on tomato’s volatile components) in terms of quality, while providing complementary information (Figure 9).
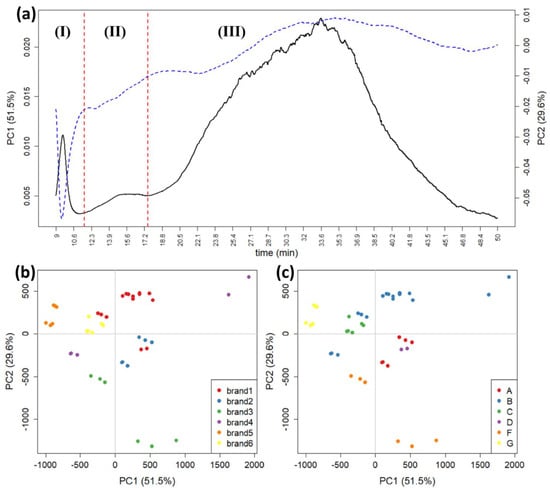
Figure 9.
(a). PCA loadings of AF4-fractograms data on PC1 (black continuous line, range on the left) and PC2 (blue dotted line, range on the right) vs. analysis time. The red dotted lines indicate the separation between three peaks, (I), (II) and (III), corresponding, respectively, to free proteins, small aggregates of proteins and large colloidal aggregates. (b,c). PCA score plots on AF4 data obtained for tomato sauce colloidal fraction, respectively, divided by: commercial brands (i.e., the retailer name on the label) and manufacturers. Adapted from [29].
The results in Figure 9 highlight that most of the samples from brands 1 and 2 and from manufacturers A, B and D can be characterized by large colloidal aggregates which are discriminated by PC1. PC2 instead indicated that small proteins are more concentrated in samples at negative values of PC2 than in the ones of brand 3 and manufacturer F.
Finally, a study based on gravitational FFF offline coupled with a metal oxide semiconductor sensor-based electronic olfactory system (GrFFF-MOS) was set up by Roda et al. showing a simple straightforward approach for pathogen bacteria identification from their food matrix [185]. In this work PCA and LDA performed on the results highlighted the ability of the platform to distinguish between viable and non-viable cells of the same strain.
The gentle analysis in native conditions of extremely complex biological samples (such as whole serum and cellular culture media) is one of the main features provided by FFF. However, the classical spectroscopical and size/shape characterization of the separated analytes provided by the online detectors is often not enough to distinguish a series of analytes subclasses. For this kind of studies FFF is thus mainly used as a separation platform and the collected fractions are then subjected to further analysis, such as SDS-page and uHPLC-MS/MS, to obtain the composition of the separated analytes. Chemometrics techniques such as PCA greatly help in the rationalization of these results.
Lipoproteins are complexes of lipids and proteins responsible for transporting lipids through the blood stream, and their monitoring can assess cardiovascular health [186]. Lee et al. [163] performed a comprehensive lipidic analysis on plasma lipoproteins in patients with acute coronary syndrome (ACS) and stable coronary artery disease (CAD). Lipoproteins were size-sorted into high density lipoproteins (HDL) and low-density lipoproteins (LDL) using asymmetrical flow field-flow fractionation, then lipids of each lipoprotein were analyzed using nanoflow ultrahigh performance liquid chromatography–electrospray ionization-tandem mass spectrometry (nLC-ESI-MS/MS) (Figure 10). A total of 365 lipids were structurally identified and quantified by selected reaction monitoring method. A PCA performed on the concentration levels on characteristic lipids between samples (found trough Volcano plots) highlighted a series of differences between both HLD and LDL vesicles of CAD and ACS samples.
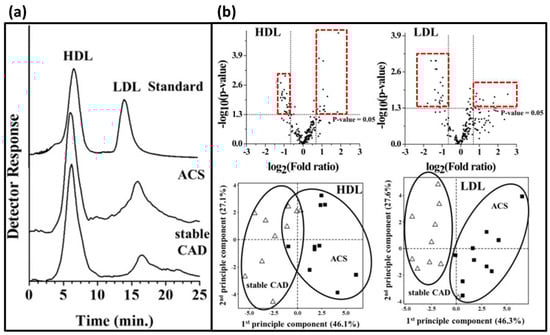
Figure 10.
Example of (a) an FFF-online coupled nLC-ESI-MS/MS platform applied to a comprehensive lipidic analysis on plasma lipoproteins in patients with acute coronary syndrome (ACS) and stable coronary artery disease (CAD). (b) The dotted boxes in the Volcano plots highlight lipids characterized by large magnitude fold changes as well as high statistical significance which were then used to perform PCA. PCA results highlight the ability of those lipids to act as markers to distinguish LDLs and HDLs of CAD and ACS patients. Adapted with permission from [163].
A similar study on serum lipoproteins of patients affected by Alzheimer’s disease (AD) and Mild Cognitive Impairment (MCI) was performed by Kim et al. [187]. The results showed that the total level of most lipid classes increased more than two-fold in the LDL/VLDL fraction of AD patients, while the levels of diacylglycerol (DG) and phosphatidyl glycerol (PG) decreased in the HDL fraction. Statistical analysis (Volcano plots, PCA and correlation plots) identified a series of lipids whose increasing abundance is correlated to an increase in brain damage level.
The interest in serum/plasma components goes beyond lipoproteins [188,189,190]. AF4 and Real Time Polymerase Chain Reaction (RT-PCR), the latter performed offline on collected fractions, were used to identify mRNA strands able to distinguish (by the means of a PCA analysis) plasma of breast cancer patients and healthy controls [191]. PCA also played a key role in evaluating the effectiveness of a novel automated on-line isolation and fractionation Immunoaffinity capture-AsFlFFF (IAC-AsFlFFF) system (offline coupled to LC-MS/MS and field emission scanning electron microscopy) constructed for the isolation and fractionation of EVs, exosomes, exomeres and apolipoprotein B-100 (apoB-100) containing lipoproteins from human plasma.
Overall, the most outstanding result in this field was reported by Zhang et al. [192]. Through an AF4-Quasi-Elastic Light Scattering (QUELS)-UV platform, the authors identified two exosome subpopulations (large exosome vesicles, Exo-L, 90–120 nm; small exosome vesicles, Exo-S, 60–80 nm) and discovered a third abundant population of non-membranous nanoparticles termed ‘exomers’ (~35 nm). Though the additional use of offline techniques (NTA, TEM Mobius Zetasizer, AFM, Odyssey Imaging system, Blotting and MS techniques) on the separated fractions they also demonstrated that Exo-L, Exo-S and exomers had unique N-glycosylation, protein, lipid, DNA and RNA profiles and biophysical properties. Both PCA and consensus clustering analysis were performed on proteomic expression data sets. PCA demonstrated a closer correlation of protein expression for Exo-S and Exo-L compared to exomers from the same cell type. Moreover, both PCA and consensus clustering analysis showed that exomeres from different cell types exhibited a higher degree of similarity to each other than to Exo-S and Exo-L from the same cell.
In the field of environmental chemistry, the analysis of dissolved organic matter was performed through FFF-chemometrics. DOM consists in a complex, heterogeneous and polymorphous mixture present in all natural waters derived from leaching processes involving leaves [193,194]. DOM plays important roles in many salient ecosystem processes, including carbon and nutrient cycling [195], the regulation of microbial action, protection from ultraviolet radiation [196] and control of the transport, speciation and bioavailability of heavy metals and other pollutants [197]. Moreover, it is involved in the formation of carcinogenic disinfection byproducts generated during drinking water treatments (such as chlorination) [198]. Different signals (UV, FLD) [199,200] and separation techniques (AF4, SEC and resin absorption) have been investigated to improve the characterization [201]. Currently, fluorescence represents the main characterizing signal while AF4 is gaining increasing interest as the separation technique of choice. This is due to AF4 overcoming many of the limitation of the other techniques such as the production of artifacts due to pH perturbations, the need for sample pre-concentration and the interactions of DOM with the stationary phase. Due to the complexity and heterogeneity of the matrix, the identification of its fluorescent components by peak picking methods is extremely challenging [202] and mainly abandoned. Today, fractogram deconvolution, PARAFAC and PCA represent the statistical tools of preference to analyze results.
Cuss and Guéguen reported some of the first works within this field by exploiting an AF4–DAD–FLD platform [203,204,205,206]. In those studies, the application of PARAFAC to the AF4 measurements allowed the definition of up to seven components (Figure 11). Their attribution to certain species/classes was performed based on previous works [207]. By observing the correlation between the PARAFAC-components and the molar masses associated to the species obtained through peak deconvolution, the authors gathered information concerning the relationship size and fluorescence of DOM components. Alternatively, similar information has been obtained by performing PCA, using as starting variables the relative abundance of the PARAFAC-components in the sample analyzed. The results moreover highlighted the stability of the leaf leachates over a 96h window and the huge effect of the type of leaf on leachates’ composition.
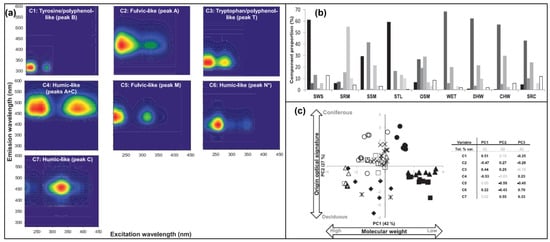
Figure 11.
Output example of a PARAFAC-PCA analysis showing: (a) 3D excitation/emission peaks and matrices of the six components calculated by the PARAFAC model; (b) the different components obtained; (b) DOM composition of different plant sources expressed as PARAFAC components; (c) PCA using the PARAFAC-components composition of the sample (b) as starting set. Adapted with permission from Cuss et al. [206].
Pifer and Fairey instead exploited PARAFAC combined with the evaluation of other parameters provided by an AF4-DAD platform to study DOM removal by enhanced coagulation and disinfection byproducts formation during chlorination [201].
The latest effort within this field concerns the investigation of the relationship between bacterial Hg uptake (generating the neurotoxin methylmercury) and algal DOM [208]. In this study an AF4-DAD setup was exploited to split the sample into three fractions that were subjected to total organic carbon quantification. A PCA performed on the AF4 results highlighted differences and similarities in the composition between the fractions of different algal DOMs. These results combined with those obtained through high-resolution mass spectrometry and biosensors confirmed that DOM from diverse primary producers differentially affect microbial Hg uptake. The study also highlighted the impact of humans on Hg bacterial uptake.
6. Conclusions
Chemometrics plays a key role in the extraction of meaningful information from complex datasets, whether for method development or data elaboration purposes. Separation science and the increasing number of detectors associated with it require the use of computational tools able to optimize processes and combine multiple outputs more and more, such as UV absorption, fluorescence and mass spectrometry data. Though the use of chemometrics is growing, it is doing so asymmetrically, and some applications or techniques still suffer from the lack of method optimization through DoE and downstream multivariate analysis. This is particularly relevant for relatively newer technologies, for example FFF. Separation–multidetection generates multidimensional data, whose elaboration should not be left to the discretion of the operator. This review presented the latest applications of chemometrics for the analysis of volatile, soluble and colloidal samples, produced by GC, HPLC, SEC and FFF analysis, focusing on novel applications, especially for the latter. It is recommendable that in the future chemometrics will be automatically associated with separation analysis, as an additional detection tool, and that its use will be more consistently regulated and endorsed in the fields of food, the environment and pharmaceutical chemistry.
Author Contributions
Conceptualization: V.M., A.Z. (Alessandro Zappi); Literature search and data analysis: S.G., N.K., and A.Z. (Alessandro Zappi); Writing—original draft preparation: V.M., S.G., A.Z. (Alessandro Zappi) and N.K.; Writing—review and editing: V.M., S.G., A.Z. (Alessandro Zappi), N.K., B.R. and A.Z. (Andrea Zattoni), D.M. and P.R. All authors have read and agreed to the published version of the manuscript.
Funding
This research received no external funding.
Institutional Review Board Statement
Not applicable.
Informed Consent Statement
Not applicable.
Data Availability Statement
Not applicable.
Conflicts of Interest
The authors declare no conflict of interest.
References
- Goodacre, R.; Vaidyanathan, S.; Dunn, W.B.; Harrigan, G.G.; Kell, D.B. Metabolomics by numbers: Acquiring and understanding global metabolite data. Trends Biotechnol. 2004, 22, 245–252. [Google Scholar] [CrossRef]
- Wenk, M.R. The emerging field of lipidomics. Nat. Rev. Drug Discov. 2005, 4, 594–610. [Google Scholar] [CrossRef] [PubMed]
- Melucci, D.; Bendini, A.; Tesini, F.; Barbieri, S.; Zappi, A.; Vichi, S.; Conte, L.; Gallina Toschi, T. Rapid direct analysis to discriminate geographic origin of extra virgin olive oils by flash gas chromatography electronic nose and chemometrics. Food Chem. 2016, 204, 263–273. [Google Scholar] [CrossRef] [PubMed]
- Marassi, V.; Roda, B.; Casolari, S.; Ortelli, S.; Blosi, M.; Zattoni, A.; Costa, A.L.; Reschiglian, P. Hollow-fiber flow field-flow fractionation and multi-angle light scattering as a new analytical solution for quality control in pharmaceutical nanotechnology. Microchem. J. 2018, 136, 149–156. [Google Scholar] [CrossRef]
- Marassi, V.; Macis, M.; Giordani, S.; Ferrazzano, L.; Tolomelli, A.; Roda, B.; Zattoni, A.; Ricci, A.; Reschiglian, P.; Cabri, W. Application of Af4-Multidetection to Liraglutide in Its Formulation: Preserving and Representing Native Aggregation. Molecules 2022, 27, 5485. [Google Scholar] [CrossRef] [PubMed]
- Reschiglian, P.; Melucci, D.; Zattoni, A.; Torsi, G. A new, low-cost separation technique for the characterization of particulate matter of environmental relevance: The Gravitational Field-Flow Fractionation (GrFFF). Ann. Chim. 1997, 87, 677–686. [Google Scholar]
- Zia, S.; Roda, B.; Maggio, A.; Marrazzo, P.; Pizzuti, V.; Alviano, F.; Bonsi, L.; Marassi, V.; Zattoni, A.; Reschiglian, P. Celector®: An Innovative Technology for Quality Control of Living Cells. Appl. Sci. 2022, 12, 9967. [Google Scholar] [CrossRef]
- Zattoni, A.; Rambaldi, D.C.; Reschiglian, P.; Melucci, M.; Krol, S.; Garcia, A.M.C.; Sanz-Medel, A.; Roessner, D.; Johann, C. Asymmetrical flow field-flow fractionation with multi-angle light scattering detection for the analysis of structured nanoparticles. J. Chromatogr. A 2009, 1216, 9106–9112. [Google Scholar] [CrossRef] [PubMed]
- Bro, R.; Smilde, A.K. Principal component analysis. Analytical Methods 2014, 6, 2812–2831. [Google Scholar] [CrossRef]
- Christophe, B.Y.C. PCA: The Basic Building Block of Chemometrics. In Analytical chemistry; Ira, S.K., Ed.; IntechOpen: Rijeka, Croatia, 2012; Chapter 1. [Google Scholar]
- Leardi, R. Experimental design in chemistry: A tutorial. Anal. Chim. Acta 2009, 652, 161–172. [Google Scholar] [CrossRef]
- Cela, R.; Claeys-Bruno, M.; Phan-Tan-Luu, R. Screening Strategies; Elsevier: Amsterdam, The Netherlands, 2010; Volume 1, pp. 251–300. [Google Scholar]
- Hibbert, D.B. Experimental design in chromatography: A tutorial review. J. Chromatogr. B 2012, 910, 2–13. [Google Scholar] [CrossRef] [PubMed]
- Jain, A.K.; Murty, M.N.; Flynn, P.J. Data clustering: A review. ACM Comput. Surv. 1999, 31, 264–323. [Google Scholar] [CrossRef]
- Tharwat, A.; Gaber, T.; Ibrahim, A.; Hassanien, A.E. Linear discriminant analysis: A detailed tutorial. AI Commun. 2017, 30, 169–190. [Google Scholar] [CrossRef]
- Wold, S.; Sjöström, M.; Eriksson, L. PLS-regression: A basic tool of chemometrics. Chemom. Intell. Lab. Syst. 2001, 58, 109–130. [Google Scholar] [CrossRef]
- Ballabio, D.; Consonni, V. Classification tools in chemistry. Part 1: Linear models. PLS-DA. Anal. Methods 2013, 5, 3790–3798. [Google Scholar] [CrossRef]
- Smith, R.; Ventura, D.; Prince, J.T. LC-MS alignment in theory and practice: A comprehensive algorithmic review. Brief. Bioinform. 2015, 16, 104–117. [Google Scholar] [CrossRef]
- Matthiesen, R. Methods, algorithms and tools in computational proteomics: A practical point of view. Proteomics 2007, 7, 2815–2832. [Google Scholar] [CrossRef]
- Jolliffe, I.T. Principal Component Analysis, 2nd ed.; Wiley Online Library: Hoboken, NJ, USA, 2002. [Google Scholar]
- Kumar, K. Principal component analysis: Most favourite tool in chemometrics. Resonance 2017, 22, 747–759. [Google Scholar] [CrossRef]
- Todeschini, R.; Ballabio, D.; Consonni, V.; Grisoni, F. A new concept of higher-order similarity and the role of distance/similarity measures in local classification methods. Chemom. Intell. Lab. Syst. 2016, 157, 50–57. [Google Scholar] [CrossRef]
- Nguyen, T.T.D.; Nguyen, L.T.T.; Nguyen, A.; Yun, U.; Vo, B. A method for efficient clustering of spatial data in network space. J. Intell. Fuzzy Syst. 2021, 40, 11653–11670. [Google Scholar] [CrossRef]
- Fisher, R.A. The design of experiments. Br. Med. J. 1936, 1, 554. [Google Scholar] [CrossRef]
- Biancolillo, A.; Næs, T. The Sequential and Orthogonalized PLS Regression for Multiblock Regression: Theory, Examples, and Extensions. Data Handl. Sci. Technol. 2019, 31, 157–177. [Google Scholar] [CrossRef]
- Zappi, A.; Melucci, D.; Scaramagli, S.; Zelano, A.; Marcazzan, G.L. Botanical traceability of unifloral honeys by chemometrics based on head-space gas chromatography. Eur. Food Res. Technol. 2018, 244, 2149–2157. [Google Scholar] [CrossRef]
- Forleo, T.; Zappi, A.; Gottardi, F.; Melucci, D. Rapid discrimination of Italian Prosecco wines by head-space gas-chromatography basing on the volatile profile as a chemometric fingerprint. Eur. Food Res. Technol. 2020, 246, 1805–1816. [Google Scholar] [CrossRef]
- Morozzi, P.; Zappi, A.; Gottardi, F.; Locatelli, M.; Melucci, D. A quick and efficient non-targeted screening test for saffron authentication: Application of chemometrics to gas-chromatographic data. Molecules 2019, 24, 2602. [Google Scholar] [CrossRef] [PubMed]
- Zappi, A.; Marassi, V.; Kassouf, N.; Giordani, S.; Pasqualucci, G.; Garbini, D.; Roda, B.; Zattoni, A.; Reschiglian, P.; Melucci, D. A Green Analytical Method Combined with Chemometrics for Traceability of Tomato Sauce Based on Colloidal and Volatile Fingerprinting. Molecules 2022, 27, 5507. [Google Scholar] [CrossRef] [PubMed]
- Abdelwareth, A.; Zayed, A.; Farag, M.A. Chemometrics-based aroma profiling for revealing origin, roasting indices, and brewing method in coffee seeds and its commercial blends in the Middle East. Food Chem. 2021, 349, 129162. [Google Scholar] [CrossRef]
- Zakidou, P.; Plati, F.; Matsakidou, A.; Varka, E.M.; Blekas, G.; Paraskevopoulou, A. Single Origin Coffee Aroma: From Optimized Flavor Protocols and Coffee Customization to Instrumental Volatile Characterization and Chemometrics. Molecules 2021, 26, 4609. [Google Scholar] [CrossRef]
- Gancarz, M.; Dobrzański, B.; Malaga-Toboła, U.; Tabor, S.; Combrzyński, M.; Ćwikła, D.; Strobel, W.R.; Oniszczuk, A.; Karami, H.; Darvishi, Y.; et al. Impact of Coffee Bean Roasting on the Content of Pyridines Determined by Analysis of Volatile Organic Compounds. Molecules 2022, 27, 1559. [Google Scholar] [CrossRef]
- Bressanello, D.; Marengo, A.; Cordero, C.; Strocchi, G.; Rubiolo, P.; Pellegrino, G.; Ruosi, M.R.; Bicchi, C.; Liberto, E. Chromatographic Fingerprinting Strategy to Delineate Chemical Patterns Correlated to Coffee Odor and Taste Attributes. J. Agric. Food Chem. 2021, 69, 4550–4560. [Google Scholar] [CrossRef]
- Sotiropoulou, N.S.; Xagoraris, M.; Revelou, P.K.; Kaparakou, E.; Kanakis, C.; Pappas, C.; Tarantilis, P. The Use of SPME-GC-MS IR and Raman Techniques for Botanical and Geographical Authentication and Detection of Adulteration of Honey. Foods 2021, 10, 1671. [Google Scholar] [CrossRef] [PubMed]
- Zhu, M.; Sun, J.; Zhao, H.; Wu, F.; Xue, X.; Wu, L.; Cao, W. Volatile compounds of five types of unifloral honey in Northwest China: Correlation with aroma and floral origin based on HS-SPME/GC–MS combined with chemometrics. Food Chem. 2022, 384, 132461. [Google Scholar] [CrossRef] [PubMed]
- Karabagias, I.K.; Karabagias, V.K.; Nayik, G.A.; Gatzias, I.; Badeka, A.V. A targeted chemometric evaluation of the volatile compounds of Quercus ilex honey in relation to its provenance. LWT 2022, 154, 112588. [Google Scholar] [CrossRef]
- Duru, M.E.; Taş, M.; Çayan, F.; Küçükaydın, S.; Tel-Çayan, G. Characterization of volatile compounds of Turkish pine honeys from different regions and classification with chemometric studies. Eur. Food Res. Technol. 2021, 247, 2533–2544. [Google Scholar] [CrossRef]
- Karabagias, I.K. Headspace volatile compounds fluctuations in honeydew honey during storage at in-house conditions. Eur. Food Res. Technol. 2022, 248, 715–726. [Google Scholar] [CrossRef]
- Karabagias, I.K. HS-SPME/GC-MS metabolomic analysis for the identification of exogenous volatile metabolites of monofloral honey and quality control suggestions. Eur. Food Res. Technol. 2022, 248, 1815–1821. [Google Scholar] [CrossRef]
- Passarella, S.; Guerriero, E.; Quici, L.; Ianiri, G.; Cerasa, M.; Notardonato, I.; Protano, C.; Vitali, M.; Russo, M.V.; De Cristofaro, A.; et al. Dataset of PAHs determined in home-made honey samples collected in Central Italy by means of DLLME-GC-MS and cluster analysis for studying the source apportionment. Data Brief 2022, 42, 108136. [Google Scholar] [CrossRef]
- Cecchi, L.; Migliorini, M.; Giambanelli, E.; Cane, A.; Zanoni, B.; Canuti, V.; Mulinacci, N.; Melani, F. Is the volatile compounds profile a suitable tool for authentication of virgin olive oils (Olea europaea L.) according to cultivars? A study by using HS-SPME-GC-MS and chemometrics. Food Control 2022, 139, 109092. [Google Scholar] [CrossRef]
- Lioupi, A.; Sampsonidis, I.; Virgiliou, C.; Papoti, V.T.; Zinoviadou, K.G.; Spyros, A.; Theodoridis, G. Optimisation of the HS-SPME/GC-MS Approach by Design of Experiments Combined with Chemometrics for the Classification of Cretan Virgin Olive Oils. Metabolites 2022, 12, 114. [Google Scholar] [CrossRef]
- Drira, M.; Guclu, G.; Portolés, T.; Jabeur, H.; Kelebek, H.; Selli, S.; Bouaziz, M. Safe and Fast Fingerprint Aroma Detection in Adulterated Extra Virgin Olive Oil Using Gas Chromatography–Olfactometry-Mass Spectrometry Combined with Chemometrics. Food Anal. Methods 2021, 14, 2121–2135. [Google Scholar] [CrossRef]
- Shi, T.; Wu, G.; Jin, Q.; Wang, X. Detection of camellia oil adulteration using chemometrics based on fatty acids GC fingerprints and phytosterols GC-MS fingerprints. Food Chem. 2021, 352, 129422. [Google Scholar] [CrossRef] [PubMed]
- De Flaviis, R.; Mutarutwa, D.; Sacchetti, G.; Mastrocola, D. Could environmental effect overcome genetic? A chemometric study on wheat volatiles fingerprint. Food Chem. 2022, 372, 131236. [Google Scholar] [CrossRef] [PubMed]
- Cervellieri, S.; Lippolis, V.; Mancini, E.; Pascale, M.; Logrieco, A.F.; De Girolamo, A. Mass spectrometry-based electronic nose to authenticate 100% Italian durum wheat pasta and characterization of volatile compounds. Food Chem. 2022, 383, 132548. [Google Scholar] [CrossRef] [PubMed]
- Oliveira, L.F.C.; Tega, D.U.; Duarte, G.H.B.; Barbosa, L.D.; Ribeiro, H.C.; Castello, A.C.D.; Sawaya, A.C.H.F.; Sussulini, A. Foodomics for agroecology: Differentiation of volatile profile in mint (Mentha × gracilis Sole) from permaculture, organic and conventional agricultural systems using HS-SPME/GC–MS. Food Res. Int. 2022, 155, 111107. [Google Scholar] [CrossRef] [PubMed]
- Ford, P.W.; Berger, T.A.; Jackoway, G. Spice authentication by fully automated chemical analysis with integrated chemometrics. J. Chromatogr. A 2022, 1667, 462889. [Google Scholar] [CrossRef] [PubMed]
- Ghiasi, S.A.; Parastar, H. Chemometrics-assisted isotope ratio fingerprinting based on gas chromatography/combustion/isotope ratio mass spectrometry for saffron authentication. J. Chromatogr. A 2021, 1657, 462587. [Google Scholar] [CrossRef]
- Di Donato, F.; D’Archivio, A.A.; Maggi, M.A.; Rossi, L. Detection of Plant-Derived Adulterants in Saffron (Crocus sativus L.) by HS-SPME/GC-MS Profiling of Volatiles and Chemometrics. Food Anal. Methods 2021, 14, 784–796. [Google Scholar] [CrossRef]
- Farag, M.A.; Khaled, S.E.; El Gingeehy, Z.; Shamma, S.N.; Zayed, A. Comparative Metabolite Profiling and Fingerprinting of Medicinal Cinnamon Bark and Its Commercial Preparations via a Multiplex Approach of GC-MS, UV, and NMR Techniques. Metabolites 2022, 12, 614. [Google Scholar] [CrossRef]
- Farag, M.A.; Kabbash, E.M.; Mediani, A.; Döll, S.; Esatbeyoglu, T.; Afifi, S.M. Comparative Metabolite Fingerprinting of Four Different Cinnamon Species Analyzed via UPLC-MS and GC-MS and Chemometric Tools. Molecules 2022, 27, 2935. [Google Scholar] [CrossRef]
- Salem, M.A.; Zayed, A.; Alseekh, S.; Fernie, A.R.; Giavalisco, P. The integration of MS-based metabolomics and multivariate data analysis allows for improved quality assessment of Zingiber officinale Roscoe. Phytochemistry 2021, 190, 112843. [Google Scholar] [CrossRef]
- Yu, D.X.; Guo, S.; Wang, J.M.; Yan, H.; Zhang, Z.Y.; Yang, J.; Duan, J.A. Comparison of Different Drying Methods on the Volatile Components of Ginger ( Zingiber officinale Roscoe) by HS-GC-MS Coupled with Fast GC E-Nose. Foods 2022, 11, 1611. [Google Scholar] [CrossRef] [PubMed]
- Perin, M.; Dallegrave, A.; Suchecki Barnet, L.; Zanchetti Meneghini, L.; de Araújo Gomes, A.; Pizzolato, T.M. Pharmaceuticals, pesticides and metals/metalloids in Lake Guaíba in Southern Brazil: Spatial and temporal evaluation and a chemometrics approach. Sci. Total Environ. 2021, 793, 148561. [Google Scholar] [CrossRef] [PubMed]
- Pourasil, R.S.M.; Cristale, J.; Lacorte, S.; Tauler, R. Non-targeted Gas Chromatography Orbitrap Mass Spectrometry qualitative and quantitative analysis of semi-volatile organic compounds in indoor dust using the Regions of Interest Multivariate Curve Resolution chemometrics procedure. J. Chromatogr. A 2022, 1668, 462907. [Google Scholar] [CrossRef]
- Mazur, D.M.; Detenchuk, E.A.; Sosnova, A.A.; Artaev, V.B.; Lebedev, A.T. GC-HRMS with Complementary Ionization Techniques for Target and Non-target Screening for Chemical Exposure: Expanding the Insights of the Air Pollution Markers in Moscow Snow. Sci. Total Environ. 2021, 761, 144506. [Google Scholar] [CrossRef] [PubMed]
- Press, I.; Press, I. The Proof and Measurement of Association between Two Things. Am. J. Psychol. 2013, 15, 72–101. [Google Scholar]
- Omokpariola, D.O.; Nduka, J.K.; Kelle, H.I.; Mgbemena, N.M.A.; Iduseri, E.O. Chemometrics, health risk assessment and probable sources of soluble total petroleum hydrocarbons in atmospheric rainwater, Rivers State, Nigeria. Sci. Rep. 2022, 12, 11829. [Google Scholar] [CrossRef]
- Peñalver, R.; Marín, C.; Arroyo-Manzanares, N.; Campillo, N.; Viñas, P. Authentication of recycled plastic content in water bottles using volatile fingerprint and chemometrics. Chemosphere 2022, 297, 134156. [Google Scholar] [CrossRef]
- Hermelin, A.; Fabien, L.; Fischer, J.; Saric, N.; Massonnet, G.; Burnier, C. Analysis of condom evidence in forensic science: Background survey of the human vaginal matrix using DRIFTS and pyrolysis-GC/MS. Forensic Sci. Int. 2021, 321, 110724. [Google Scholar] [CrossRef]
- Podolskiy, I.I.; Mochalova, E.S.; Temerdashev, A.Z.; Gashimova, E.M. Application of Statistical Data Analysis Methods to Test the Degradation of Urine Samples for Doping Control Purposes. J. Anal. Chem. 2021, 76, 761–771. [Google Scholar] [CrossRef]
- Grocki, P.; Woollam, M.; Wang, L.; Liu, S.; Kalra, M.; Siegel, A.P.; Li, B.Y.; Yokota, H.; Agarwal, M. Chemometric Analysis of Urinary Volatile Organic Compounds to Monitor the Efficacy of Pitavastatin Treatments on Mammary Tumor Progression over Time. Molecules 2022, 27, 4277. [Google Scholar] [CrossRef]
- Yang, Q.; Shi, B.H.; Tian, G.L.; Niu, Q.Q.; Tang, J.; Linghu, D.D.; He, H.Q.; Wu, B.Q.; Yang, J.T.; Xu, L.; et al. GC–MS urinary metabolomics analysis of inherited metabolic diseases and stable metabolic biomarker screening by a comprehensive chemometric method. Microchem. J. 2021, 168, 106350. [Google Scholar] [CrossRef]
- Aliaño-González, M.J.; Montalvo, G.; García-Ruiz, C.; Ferreiro-González, M.; Palma, M. Assessment of Volatile Compound Transference through Firefighter Turnout Gear. Int. J. Environ. Res. Public Health 2022, 19, 3663. [Google Scholar] [CrossRef] [PubMed]
- Bogdal, C.; Schellenberg, R.; Höpli, O.; Bovens, M.; Lory, M. Recognition of gasoline in fire debris using machine learning: Part I, application of random forest, gradient boosting, support vector machine, and naïve bayes. Forensic Sci. Int. 2022, 331, 111146. [Google Scholar] [CrossRef]
- Bogdal, C.; Schellenberg, R.; Lory, M.; Bovens, M.; Höpli, O. Recognition of gasoline in fire debris using machine learning: Part II, application of a neural network. Forensic Sci. Int. 2022, 332, 111177. [Google Scholar] [CrossRef] [PubMed]
- Bro, R. PARAFAC. Tutorial and applications. Chemom. Intell. Lab. Syst. 1997, 38, 149–171. [Google Scholar] [CrossRef]
- Kruskal, J.B. More factors than subjects, tests and treatments: An indeterminacy theorem for canonical decomposition and individual differences scaling. Psychometrika 1976, 41, 281–293. [Google Scholar] [CrossRef]
- Giebelhaus, R.T.; Sorochan Armstrong, M.D.; de la Mata, A.P.; Harynuk, J.J. Untargeted region of interest selection for gas chromatography—Mass spectrometry data using a pseudo F-ratio moving window. J. Chromatogr. A 2022, 1682, 463499. [Google Scholar] [CrossRef]
- Ochoa, G.S.; Sudol, P.E.; Trinklein, T.J.; Synovec, R.E. Class comparison enabled mass spectrum purification for comprehensive two-dimensional gas chromatography with time-of-flight mass spectrometry. Talanta 2022, 236, 122844. [Google Scholar] [CrossRef]
- Biancolillo, A.; Boqué, R.; Cocchi, M.; Marini, F. Data Fusion Strategies in Food Analysis. Data Handl. Sci. Technol. 2019, 31, 271–310. [Google Scholar] [CrossRef]
- Doeswijk, T.G.; Smilde, A.K.; Hageman, J.A.; Westerhuis, J.A.; van Eeuwijk, F.A. On the increase of predictive performance with high-level data fusion. Anal. Chim. Acta 2011, 705, 41–47. [Google Scholar] [CrossRef]
- Strani, L.; D’alessandro, A.; Ballestrieri, D.; Durante, C.; Cocchi, M. Fast GC E-Nose and Chemometrics for the Rapid Assessment of Basil Aroma. Chemosensors 2022, 10, 105. [Google Scholar] [CrossRef]
- Rivera-Pérez, A.; Romero-González, R.; Garrido Frenich, A. Application of an innovative metabolomics approach to discriminate geographical origin and processing of black pepper by untargeted UHPLC-Q-Orbitrap-HRMS analysis and mid-level data fusion. Food Res. Int. 2021, 150, 110722. [Google Scholar] [CrossRef] [PubMed]
- Di Donato, F.; Biancolillo, A.; Mazzulli, D.; Rossi, L.; D’Archivio, A.A. HS-SPME/GC–MS volatile fraction determination and chemometrics for the discrimination of typical Italian Pecorino cheeses. Microchem. J. 2021, 165, 106133. [Google Scholar] [CrossRef]
- de Jesus Filho, M.; Klein, B.; Wagner, R.; Godoy, H.T. Key aroma compounds of Canastra cheese: HS-SPME optimization assisted by olfactometry and chemometrics. Food Res. Int. 2021, 150, 110788. [Google Scholar] [CrossRef] [PubMed]
- Biancolillo, A.; Aloia, R.; Rossi, L.; D’Archivio, A.A. Organosulfur volatile profiles in Italian red garlic (Allium Sativum L.) varieties investigated by HS-SPME/GC-MS and chemometrics. Food Control 2022, 131, 108477. [Google Scholar] [CrossRef]
- Herrera, J.G.; Ramos, M.P.; de Lima Albuquerque, B.N.; de Oliveira Farias de Aguiar, J.C.R.; Agra Neto, A.C.; Guedes Paiva, P.M.; do Amaral Ferraz Navarro, D.M.; Pinto, L. Multivariate evaluation of process parameters to obtain essential oil of Piper corcovadensis using supercritical fluid extraction. Microchem. J. 2022, 181, 107747. [Google Scholar] [CrossRef]
- Andruszkiewicz, P.J.; Corno, M.; Kuhnert, N. HPLC-MS-based design of experiments approach on cocoa roasting. Food Chem. 2021, 360, 129694. [Google Scholar] [CrossRef]
- Cumeras, R.; Figueras, E.; Davis, C.E.; Baumbach, J.I.; Gràcia, I. Review on Ion Mobility Spectrometry. Part 1: Current instrumentation. Analyst 2015, 140, 1376–1390. [Google Scholar] [CrossRef] [PubMed]
- Zhou, X.; Li, X.; Zhao, B.; Chen, X.; Zhang, Q. Discriminant analysis of vegetable oils by thermogravimetric-gas chromatography/mass spectrometry combined with data fusion and chemometrics without sample pretreatment. LWT 2022, 161, 113403. [Google Scholar] [CrossRef]
- Chen, T.; Liu, C.; Meng, L.; Lu, D.; Chen, B.; Cheng, Q. Early warning of rice mildew based on gas chromatography-ion mobility spectrometry technology and chemometrics. J. Food Meas. Charact. 2021, 15, 1939–1948. [Google Scholar] [CrossRef]
- Chen, S.; Lu, J.; Qian, M.; He, H.; Li, A.; Zhang, J.; Shen, X.; Gao, J.; Xu, Y. Untargeted headspace-gas chromatography-ion mobility spectrometry in combination with chemometrics for detecting the age of chinese liquor (Baijiu). Foods 2021, 10, 2888. [Google Scholar] [CrossRef] [PubMed]
- Yang, Y.; Qian, M.C.; Deng, Y.; Yuan, H.; Jiang, Y. Insight into aroma dynamic changes during the whole manufacturing process of chestnut-like aroma green tea by combining GC-E-Nose, GC-IMS, and GC × GC-TOFMS. Food Chem. 2022, 387, 132813. [Google Scholar] [CrossRef] [PubMed]
- Mi, S.; Zhang, X.; Wang, Y.; Zheng, M.; Zhao, J.; Gong, H.; Wang, X. Effect of different genotypes on the fruit volatile profiles, flavonoid composition and antioxidant activities of chilli peppers. Food Chem. 2022, 374, 131751. [Google Scholar] [CrossRef] [PubMed]
- Christmann, J.; Rohn, S.; Weller, P. Finding features—Variable extraction strategies for dimensionality reduction and marker compounds identification in GC-IMS data. Food Res. Int. 2022, 161, 111779. [Google Scholar] [CrossRef] [PubMed]
- Christmann, J.; Rohn, S.; Weller, P. gc-ims-tools—A new Python package for chemometric analysis of GC–IMS data. Food Chem. 2022, 394, 133476. [Google Scholar] [CrossRef]
- Roda, B.; Zhang, N.; Gambari, L.; Grigolo, B.; Eller-Vainicher, C.; Gennari, L.; Zappi, A.; Giordani, S.; Marassi, V.; Zattoni, A.; et al. Optimization of a Monobromobimane (MBB) Derivatization and RP-HPLC-FLD Detection Method for Sulfur Species Measurement in Human Serum after Sulfur Inhalation Treatment. Antioxidants 2022, 11, 939. [Google Scholar] [CrossRef]
- Choi, M.Y.; Chai, C.; Park, J.H.; Lim, J.; Lee, J.; Kwon, S.W. Effects of storage period and heat treatment on phenolic compound composition in dried Citrus peels (Chenpi) and discrimination of Chenpi with different storage periods through targeted metabolomic study using HPLC-DAD analysis. J. Pharm. Biomed. Anal. 2011, 54, 638–645. [Google Scholar] [CrossRef]
- Li, J.; Li, X.; Liu, X.; Wang, X.; Li, J.; Lin, K.; Sun, S.; Yue, H.; Dai, Y. Untargeted metabolomic study of acute exacerbation of pediatric asthma via HPLC-Q-Orbitrap-MS. J. Pharm. Biomed. Anal. 2022, 215, 114737. [Google Scholar] [CrossRef]
- Stojanović, J.; Krmar, J.; Protić, A.; Svrkota, B.; Djajić, N.; Otašević, B. DoE Experimental design in HPLC separation of pharmaceuticals; a review. Arch. Pharm. 2021, 71, 279–301. [Google Scholar] [CrossRef]
- Abbas, O.; Zadravec, M.; Baeten, V.; Mikuš, T.; Lešić, T.; Vulić, A.; Prpić, J.; Jemeršić, L.; Pleadin, J. Analytical methods used for the authentication of food of animal origin. Food Chem. 2018, 246, 6–17. [Google Scholar] [CrossRef]
- Herrero, A.; Sanllorente, S.; Reguera, C.; Ortiz, M.C.; Sarabia, L.A. A new multiresponse optimization approach in combination with a D-Optimal experimental design for the determination of biogenic amines in fish by HPLC-FLD. Anal. Chim. Acta 2016, 945, 31–38. [Google Scholar] [CrossRef] [PubMed]
- Durante, C.; Anceschi, L.; Brighenti, V.; Caroli, C.; Afezolli, C.; Marchetti, A.; Cocchi, M.; Salamone, S.; Pollastro, F.; Pellati, F. Application of experimental design in HPLC method optimisation for the simultaneous determination of multiple bioactive cannabinoids. J. Pharm. Biomed. Anal. 2022, 221, 115037. [Google Scholar] [CrossRef] [PubMed]
- Prajapati, P.B.; Bagul, N.; Kalyankar, G. Implementation of DoE and Risk-Based Enhanced Analytical Quality by Design Approach to Stability-Indicating RP-HPLC Method for Stability Study of Bosutinib. J. AOAC Int. 2021, 104, 1742–1753. [Google Scholar] [CrossRef]
- Gopireddy, R.R.; Maruthapillai, A.; Devikala, S.; Tamilselvi, M.; Arockia Selvi, J.; Mahapatra, S. DoE Approach: A validated Stability Indicating RP-HPLC Method Development for the Separation of Diasteromeric Analogs and Process Impurities of Carfilzomib. Mater. Today Proc. 2019, 14, 514–531. [Google Scholar] [CrossRef]
- Sahu, P.K.; Ramisetti, N.R.; Cecchi, T.; Swain, S.; Patro, C.S.; Panda, J. An overview of experimental designs in HPLC method development and validation. J. Pharm. Biomed. Anal. 2018, 147, 590–611. [Google Scholar] [CrossRef]
- van Nederkassel, A.M.; Xu, C.J.; Lancelin, P.; Sarraf, M.; MacKenzie, D.A.; Walton, N.J.; Bensaid, F.; Lees, M.; Martin, G.J.; Desmurs, J.R.; et al. Chemometric treatment of vanillin fingerprint chromatograms: Effect of different signal alignments on principal component analysis plots. J. Chromatogr. A 2006, 1120, 291–298. [Google Scholar] [CrossRef]
- Wallace, W.E.; Srivastava, A.; Telu, K.H.; Simón-Manso, Y. Pairwise alignment of chromatograms using an extended Fisher–Rao metric. Anal. Chim. Acta 2014, 841, 10–16. [Google Scholar] [CrossRef]
- Tucker, J.D.; Wu, W.; Srivastava, A. Generative Models for Functional Data using Phase and Amplitude Separation. Comput. Stat. Data Anal. 2012, 61, 50–66. [Google Scholar] [CrossRef]
- Clifford, D.; Stone, G.; Montoliu, I.; Rezzi, S.; Martin, F.P.; Guy, P.; Bruce, S.; Kochhar, S. Alignment using variable penalty dynamic time warping. Anal. Chem. 2009, 81, 1000–1007. [Google Scholar] [CrossRef]
- Bloemberg, T.G.; Gerretzen, J.; Wouters, H.J.P.; Gloerich, J.; van Dael, M.; Wessels, H.J.C.T.; van den Heuvel, L.P.; Eilers, P.H.C.; Buydens, L.M.C.; Wehrens, R. Improved parametric time warping for proteomics. Chemom. Intell. Lab. Syst. 2010, 104, 65–74. [Google Scholar] [CrossRef]
- Korifi, R.; Le Dréau, Y.; Dupuy, N. Comparative study of the alignment method on experimental and simulated chromatographic data. J. Sep. Sci. 2014, 37, 3276–3291. [Google Scholar] [CrossRef]
- Nielsen, N.P.V.; Carstensen, J.M.; Smedsgaard, J. Aligning of single and multiple wavelength chromatographic profiles for chemometric data analysis using correlation optimised warping. J. Chromatogr. A 1998, 805, 17–35. [Google Scholar] [CrossRef]
- Tomasi, G.; Van Den Berg, F.; Andersson, C. Correlation optimized warping and dynamic time warping as preprocessing methods for chromatographic data. J. Chemom. 2004, 18, 231–241. [Google Scholar] [CrossRef]
- De Luca, S.; Ciotoli, E.; Biancolillo, A.; Bucci, R.; Magrì, A.D.; Marini, F. Simultaneous quantification of caffeine and chlorogenic acid in coffee green beans and varietal classification of the samples by HPLC-DAD coupled with chemometrics. Environ. Sci. Pollut. Res. Int. 2018, 25, 28748–28759. [Google Scholar] [CrossRef]
- García-Seval, V.; Martínez-Alfaro, C.; Saurina, J.; Núñez, O.; Sentellas, S. Characterization, Classification and Authentication of Spanish Blossom and Honeydew Honeys by Non-Targeted HPLC-UV and Off-Line SPE HPLC-UV Polyphenolic Fingerprinting Strategies. Foods 2022, 11, 2345. [Google Scholar] [CrossRef] [PubMed]
- Núñez, N.; Collado, X.; Martínez, C.; Saurina, J.; Núñez, O. Authentication of the Origin, Variety and Roasting Degree of Coffee Samples by Non-Targeted HPLC-UV Fingerprinting and Chemometrics. Application to the Detection and Quantitation of Adulterated Coffee Samples. Foods 2020, 9, 378. [Google Scholar] [CrossRef] [PubMed]
- Carabetta, S.; Di Sanzo, R.; Campone, L.; Fuda, S.; Rastrelli, L.; Russo, M. High-Performance Anion Exchange Chromatography with Pulsed Amperometric Detection (HPAEC–PAD) and Chemometrics for Geographical and Floral Authentication of Honeys from Southern Italy (Calabria region). Foods 2020, 9, 1625. [Google Scholar] [CrossRef]
- Su, H.; Wu, W.; Wan, X.; Ning, J. Discriminating geographical origins of green tea based on amino acid, polyphenol, and caffeine content through high-performance liquid chromatography: Taking Lu’an guapian tea as an example. Food Sci. Nutr. 2019, 7, 2167–2175. [Google Scholar] [CrossRef] [PubMed]
- Campmajó, G.; Cayero, L.; Saurina, J.; Núñez, O. Classification of Hen Eggs by HPLC-UV Fingerprinting and Chemometric Methods. Foods 2019, 8, 310. [Google Scholar] [CrossRef] [PubMed]
- Biancolillo, A.; Preys, S.; Gaci, B.; Le-Quere, J.L.; Laboure, H.; Deuscher, Z.; Cheynier, V.; Sommerer, N.; Fayeulle, N.; Costet, P.; et al. Multi-block classification of chocolate and cocoa samples into sensory poles. Food Chem. 2021, 340, 127904. [Google Scholar] [CrossRef]
- Ghanavati Nasab, S.; Javaheran Yazd, M.; Marini, F.; Nescatelli, R.; Biancolillo, A. Classification of honey applying high performance liquid chromatography, near-infrared spectroscopy and chemometrics. Chemom. Intell. Lab. Syst. 2020, 202, 104037. [Google Scholar] [CrossRef]
- Mishra, P.; Roger, J.M.; Jouan-Rimbaud-Bouveresse, D.; Biancolillo, A.; Marini, F.; Nordon, A.; Rutledge, D.N. Recent trends in multi-block data analysis in chemometrics for multi-source data integration. TrAC Trends Anal. Chem. 2021, 137, 116206. [Google Scholar] [CrossRef]
- Zhao, L.K.; Zhao, Y.B.; Yu, P.C.; Zhang, P.X. Metabolomics approach based on utra-performance liquid chromatography coupled to mass spectrometry with chemometrics methods for high-throughput analysis of metabolite biomarkers to explore the abnormal metabolic pathways associated with myocardial dysfun. Biomed. Chromatogr. BMC 2020, 34, e4847. [Google Scholar] [CrossRef] [PubMed]
- Yao, W.; Gu, H.; Zhu, J.; Barding, G.; Cheng, H.; Bao, B.; Zhang, L.; Ding, A.; Li, W. Integrated plasma and urine metabolomics coupled with HPLC/QTOF-MS and chemometric analysis on potential biomarkers in liver injury and hepatoprotective effects of Er-Zhi-Wan. Anal. Bioanal. Chem. 2014, 406, 7367–7378. [Google Scholar] [CrossRef] [PubMed]
- Buttery, R.G.; Ling, L.C. Volatile Components of Tomato Fruit and Plant Parts. Bioact. Volatile Compd. Plants 1993, 3, 23–34. [Google Scholar] [CrossRef]
- Yang, J.; Xu, G.; Kong, H.; Zheng, Y.; Pang, T.; Yang, Q. Artificial neural network classification based on high-performance liquid chromatography of urinary and serum nucleosides for the clinical diagnosis of cancer. J. Chromatogr. B Anal. Technol. Biomed. Life Sci. 2002, 780, 27–33. [Google Scholar] [CrossRef] [PubMed]
- Hakimzadeh, N.; Parastar, H.; Fattahi, M. Combination of multivariate curve resolution and multivariate classification techniques for comprehensive high-performance liquid chromatography-diode array absorbance detection fingerprints analysis of Salvia reuterana extracts. J. Chromatogr. A 2014, 1326, 63–72. [Google Scholar] [CrossRef] [PubMed]
- Wang, Y.; Li, B.; Ni, Y.; Kokot, S. Multi-wavelength high-performance liquid chromatography: An improved method for analysis of complex substances such as Radix Paeoniae herbs. Chemom. Intell. Lab. Syst. 2014, 130, 159–165. [Google Scholar] [CrossRef]
- Welsh, W.J.; Lin, W.; Tersigni, S.H.; Collantes, E.; Duta, R.; Carey, M.S.; Zielinski, W.L.; Brower, J.; Spencer, J.A.; Layloff, T.P. Pharmaceutical fingerprinting: Evaluation of neural networks and chemometric techniques for distinguishing among same-product manufacturers. Anal. Chem. 1996, 68, 3473–3482. [Google Scholar] [CrossRef]
- Stasiak, J.; Koba, M.; Bober, L.; Baczek, T. Principal Component Analysis of HPLC Retention Data and Molecular Modeling Structural Parameters of Cardiovascular System Drugs in View of Their Pharmacological Activity. Int. J. Mol. Sci. 2010, 11, 2681. [Google Scholar] [CrossRef]
- Saber, F.R.; Mohsen, E.; El-Hawary, S.; Eltanany, B.M.; Elimam, H.; Sobeh, M.; Elmotayam, A.K. Chemometric-enhanced metabolic profiling of five Pinus species using HPLC-MS/MS spectrometry: Correlation to in vitro anti-aging, anti-Alzheimer and antidiabetic activities. J. Chromatogr. B 2021, 1177, 122759. [Google Scholar] [CrossRef] [PubMed]
- De Luca, M.; Ioele, G.; Grande, F.; Platikanov, S.; Tauler, R.; Ragno, G. Photostability study of multicomponent drug formulations via MCR-ALS: The case of the hydrochlorothiazide-amiloride mixture. J. Pharm. Biomed. Anal. 2020, 186, 113332. [Google Scholar] [CrossRef] [PubMed]
- Raimondo, M.; Borioni, A.; Bartolomei, M.; Mosca, A.; Gostoli, G. Classification of the ibuprofen active pharmaceutical ingredients by chemical patterns combining HPLC, 1H-NMR spectroscopy and chemometrics: Traceability of legal medicines. Ann. Ist. Super. Sanita 2020, 56, 403–408. [Google Scholar] [CrossRef] [PubMed]
- Patel, M.N.; Kothari, C.S. Multivariate UV-Chemometric and HPLC-QbD Method for Simultaneous Estimation of Vardenafil and Dapoxetine in Active Pharmaceutical Ingredients and its Marketed Formulation. Curr. Anal. Chem. 2018, 16, 263–276. [Google Scholar] [CrossRef]
- Palei, N.N.; Vijayaraj, S.; Lathasri, K.; Archana, D.; Rajavel, P. Chemometric Approach to Develop and Validate RP-HPLC Method for Estimation of Erlotinib Hydrochloride in Nano Structured Lipid Carriers. Curr. Pharm. Anal. 2018, 16, 210–219. [Google Scholar] [CrossRef]
- Gad, M.A.; Amer, S.M.; Zaazaa, H.E.; Hassan, S.A. Strategies for stabilizing formulation and QbD assisted development of robust stability indicating method of azilsartan medoxomil/chlorthalidone. J. Pharm. Biomed. Anal. 2020, 178, 112910. [Google Scholar] [CrossRef]
- Carranco, N.; Farrés-Cebrián, M.; Saurina, J.; Núñez, O. Authentication and Quantitation of Fraud in Extra Virgin Olive Oils Based on HPLC-UV Fingerprinting and Multivariate Calibration. Foods 2018, 7, 44. [Google Scholar] [CrossRef]
- Núñez, N.; Saurina, J.; Núñez, O. Non-targeted HPLC-FLD fingerprinting for the detection and quantitation of adulterated coffee samples by chemometrics. Food Control 2021, 124, 107912. [Google Scholar] [CrossRef]
- Dinç-Zor, Ş.; Dönmez, Ö.A.; Bozdoğan, A.E. Application of Chemometrics-assisted HPLC-DAD Strategies for Simultaneous Determination of Paracetamol, Pseudoephedrine HCl, Dextromethorphan HBr, Doxylamine Succinate and Saccharin in Syrup Formulation. Curr. Pharm. Anal. 2020, 17, 1043–1050. [Google Scholar] [CrossRef]
- Frenich, A.G.; Galera, M.M.; García, M.D.G.; Vidal, J.L.M.; Catasús, M.; Marti, L.; Mederos, M.V. Resolution of HPLC-DAD highly overlapping analytical signals for quantitation of pesticide mixtures in groundwater and soil using multicomponent analysis and neural networks. J. Liq. Chromatogr. Relat. Technol. 2007, 24, 651–668. [Google Scholar] [CrossRef]
- Guizellini, F.C.; Marcheafave, G.G.; Rakocevic, M.; Bruns, R.E.; Scarminio, I.S.; Soares, P.K. PARAFAC HPLC-DAD metabolomic fingerprint investigation of reference and crossed coffees. Food Res. Int. 2018, 113, 9–17. [Google Scholar] [CrossRef] [PubMed]
- Sun, X.; Zhang, M.; Wang, P.; Chen, J.; Yang, S.; Luo, P.; Gao, X. Detection and Quantitation of Adulterated Paprika Samples Using Second-Order HPLC-FLD Fingerprints and Chemometrics. Foods 2022, 11, 2376. [Google Scholar] [CrossRef] [PubMed]
- Arce, M.M.; Castro, D.; Sarabia, L.A.; Ortiz, M.C.; Sanllorente, S. Procedure to explore a ternary mixture diagram to find the appropriate gradient profile in liquid chromatography with fluorescence detector. Application to determine four primary aromatic amines in napkins. J. Chromatogr. A 2022, 1676, 463252. [Google Scholar] [CrossRef] [PubMed]
- Ogemdi, I.K. Properties and Uses of Colloids: A Review. Colloid Surf. Sci. 2019, 4, 24–28. [Google Scholar] [CrossRef]
- Qin, S.J. Process data analytics in the era of big data. AIChE J. 2014, 60, 3092–3100. [Google Scholar] [CrossRef]
- Bos, T.S.; Knol, W.C.; Molenaar, S.R.A.; Niezen, L.E.; Schoenmakers, P.J.; Somsen, G.W.; Pirok, B.W.J. Recent applications of chemometrics in one- and two-dimensional chromatography. J. Sep. Sci. 2020, 43, 1678–1727. [Google Scholar] [CrossRef]
- Mahler, H.C.; Friess, W.; Grauschopf, U.; Kiese, S. Protein aggregation: Pathways, induction factors and analysis. J. Pharm. Sci. 2009, 98, 2909–2934. [Google Scholar] [CrossRef]
- Baunsgaard, D.; Andersson, C.A.; Arndal, A. Multi-way chemometrics for mathematical separation of fluorescent colorants and colour precursors from spectrofluorimetry of beet sugar and beet sugar thick juice as validated by HPLC analysis—Staff of the Department of Food Science. Food Chem. 2000, 70, 113–121. [Google Scholar] [CrossRef]
- Upadhyay, R.; Sehwag, S.; Niwas Mishra, H. Chemometric approach to develop frying stable sunflower oil blends stabilized with oleoresin rosemary and ascorbyl palmitate. Food Chem. 2017, 218, 496–504. [Google Scholar] [CrossRef]
- Beretta, G.; Fermo, P.; Maffei Facino, R. Simple and rapid simultaneous profiling of minor components of honey by size exclusion chromatography (SEC) coupled to ultraviolet diode array detection (UV-DAD), combined with chemometric methods. J. Pharm. Biomed. Anal. 2012, 58, 193–199. [Google Scholar] [CrossRef]
- Liu, W.; Xu, J.; Zhu, R.; Zhu, Y.; Zhao, Y.; Chen, P.; Pan, C.; Yao, W.; Gao, X. Fingerprinting profile of polysaccharides from Lycium barbarum using multiplex approaches and chemometrics. Int. J. Biol. Macromol. 2015, 78, 230–237. [Google Scholar] [CrossRef] [PubMed]
- Li, H.; Gong, X.; Wang, Z.; Pan, C.; Zhao, Y.; Gao, X.; Liu, W. Multiple fingerprint profiles and chemometrics analysis of polysaccharides from Sarcandra glabra. Int. J. Biol. Macromol. 2019, 123, 957–967. [Google Scholar] [CrossRef] [PubMed]
- Zhu, B.j.; Yan, Z.y.; Hong, L.; Li, S.P.; Zhao, J. Quality evaluation of Salvia miltiorrhiza from different geographical origins in China based on qualitative and quantitative saccharide mapping and chemometrics. J. Pharm. Biomed. Anal. 2020, 191, 113583. [Google Scholar] [CrossRef] [PubMed]
- Malkavaara, P.; Alén, R.; Kolehmainen, E. Chemometrics: An Important Tool for the Modern Chemist, an Example from Wood-Processing Chemistry. J. Chem. Inf. Comput. Sci. 2000, 40, 438–441. [Google Scholar] [CrossRef] [PubMed]
- Mol, E.A.; Goumans, M.J.; Doevendans, P.A.; Sluijter, J.P.G.; Vader, P. Higher functionality of extracellular vesicles isolated using size-exclusion chromatography compared to ultracentrifugation. Nanomed. Nanotechnol. Biol. Med. 2017, 13, 2061–2065. [Google Scholar] [CrossRef]
- Burgess, R.R. A brief practical review of size exclusion chromatography: Rules of thumb, limitations, and troubleshooting. Protein Expr. Purif. 2018, 150, 81–85. [Google Scholar] [CrossRef]
- Ricker, R.D.; Sandoval, L.A.; Justice, J.D.; Geiser, F.O. Multivariate visualization in the size-exclusion chromatography and pattern recognition of biological samples. J. Chromatogr. A 1995, 691, 67–79. [Google Scholar] [CrossRef]
- Elshereef, R.; Budman, H.; Moresoli, C.; Legge, R.L. Monitoring the fractionation of a whey protein isolate during dead-end membrane filtration using fluorescence and chemometric methods. Biotechnol. Prog. 2010, 26, 168–178. [Google Scholar] [CrossRef]
- Akhgar, C.K.; Ebner, J.; Alcaraz, M.R.; Kopp, J.; Goicoechea, H.; Spadiut, O.; Schwaighofer, A.; Lendl, B. Application of Quantum Cascade Laser-Infrared Spectroscopy and Chemometrics for In-Line Discrimination of Coeluting Proteins from Preparative Size Exclusion Chromatography. Anal. Chem. 2022, 94, 11192–11200. [Google Scholar] [CrossRef]
- Böing, A.N.; van der Pol, E.; Grootemaat, A.E.; Coumans, F.A.W.; Sturk, A.; Nieuwland, R. Single-step isolation of extracellular vesicles by size-exclusion chromatography. J. Extracell. Vesicles 2014, 3, 23430. [Google Scholar] [CrossRef]
- Garcia-Ceron, D.; Dawson, C.S.; Faou, P.; Bleackley, M.R.; Anderson, M.A. Size-exclusion chromatography allows the isolation of EVs from the filamentous fungal plant pathogen Fusarium oxysporum f. sp. vasinfectum (Fov). Proteomics 2021, 21, 2000240. [Google Scholar] [CrossRef] [PubMed]
- Vogel, R.; Coumans, F.A.W.; Maltesen, R.G.; Böing, A.N.; Bonnington, K.E.; Broekman, M.L.; Broom, M.F.; Buzás, E.I.; Christiansen, G.; Hajji, N.; et al. A standardized method to determine the concentration of extracellular vesicles using tunable resistive pulse sensing. J. Extracell. Vesicles 2016, 5, 31242. [Google Scholar] [CrossRef] [PubMed]
- Vergauwen, G.; Tulkens, J.; Pinheiro, C.; Avila Cobos, F.; Dedeyne, S.; De Scheerder, M.A.; Vandekerckhove, L.; Impens, F.; Miinalainen, I.; Braems, G.; et al. Robust sequential biophysical fractionation of blood plasma to study variations in the biomolecular landscape of systemically circulating extracellular vesicles across clinical conditions. J. Extracell. vesicles 2021, 10, e12122. [Google Scholar] [CrossRef]
- Palviainen, M.; Saraswat, M.; Varga, Z.; Kitka, D.; Neuvonen, M.; Puhka, M.; Joenväärä, S.; Renkonen, R.; Nieuwland, R.; Takatalo, M.; et al. Extracellular vesicles from human plasma and serum are carriers of extravesicular cargo—Implications for biomarker discovery. PLoS ONE 2020, 15, e0236439. [Google Scholar] [CrossRef] [PubMed]
- Zattoni, A.; Roda, B.; Borghi, F.; Marassi, V.; Reschiglian, P. Flow field-flow fractionation for the analysis of nanoparticles used in drug delivery. J. Pharm. Biomed. Anal. 2014, 87, 53–61. [Google Scholar] [CrossRef] [PubMed]
- Contado, C. Field flow fractionation techniques to explore the “nano-world”. Analytical and bioanalytical chemistry 2017, 409, 2501–2518. [Google Scholar] [CrossRef]
- Zhang, X.; Li, Y.; Shen, S.; Lee, S.; Dou, H. Field-flow fractionation: A gentle separation and characterization technique in biomedicine. TrAC Trends Anal. Chem. 2018, 108, 231–238. [Google Scholar] [CrossRef]
- Coelho, C.; Parot, J.; Gonsior, M.; Nikolantonaki, M.; Schmitt-Kopplin, P.; Parlanti, E.; Gougeon, R.D. Asymmetrical flow field-flow fractionation of white wine chromophoric colloidal matter. Anal. Bioanal. Chem. 2017, 409, 2757–2766. [Google Scholar] [CrossRef]
- Yang, J.S.; Lee, J.C.; Byeon, S.K.; Rha, K.H.; Moon, M.H. Size Dependent Lipidomic Analysis of Urinary Exosomes from Patients with Prostate Cancer by Flow Field-Flow Fractionation and Nanoflow Liquid Chromatography-Tandem Mass Spectrometry. Anal. Chem. 2017, 89, 2488–2496. [Google Scholar] [CrossRef]
- Leeman, M.; Choi, J.; Hansson, S.; Storm, M.U.; Nilsson, L. Proteins and antibodies in serum, plasma, and whole blood-size characterization using asymmetrical flow field-flow fractionation (AF4). Anal. Bioanal. Chem. 2018, 410, 4867–4873. [Google Scholar] [CrossRef]
- Marassi, V.; Maggio, S.; Battistelli, M.; Stocchi, V.; Zattoni, A.; Reschiglian, P.; Guescini, M.; Roda, B. An ultracentrifugation—hollow-fiber flow field-flow fractionation orthogonal approach for the purification and mapping of extracellular vesicle subtypes. J. Chromatogr. A 2021, 1638, 461861. [Google Scholar] [CrossRef]
- Roda, B.; Marassi, V.; Zattoni, A.; Borghi, F.; Anand, R.; Agostoni, V.; Gref, R.; Reschiglian, P.; Monti, S. Flow field-flow fractionation and multi-angle light scattering as a powerful tool for the characterization and stability evaluation of drug-loaded metal-organic framework nanoparticles. Anal. Bioanal. Chem. 2018, 410, 5245–5253. [Google Scholar] [CrossRef] [PubMed]
- Caputo, F.; Mehn, D.; Clogston, J.D.; Rösslein, M.; Prina-Mello, A.; Borgos, S.E.; Gioria, S.; Calzolai, L. Asymmetric-flow field-flow fractionation for measuring particle size, drug loading and (in)stability of nanopharmaceuticals. The joint view of European Union Nanomedicine Characterization Laboratory and National Cancer Institute—Nanotechnology Characterization Laboratory. J. Chromatogr. A 2021, 1635, 461767. [Google Scholar] [CrossRef] [PubMed]
- Iavicoli, P.; Urbán, P.; Bella, A.; Ryadnov, M.G.; Rossi, F.; Calzolai, L. Application of Asymmetric Flow Field-Flow Fractionation hyphenations for liposome-antimicrobial peptide interaction. J. Chromatogr. A 2015, 1422, 260–269. [Google Scholar] [CrossRef] [PubMed]
- Marassi, V.; Casolari, S.; Panzavolta, S.; Bonvicini, F.; Gentilomi, G.A.; Giordani, S.; Zattoni, A.; Reschiglian, P.; Roda, B. Synthesis Monitoring, Characterization and Cleanup of Ag-Polydopamine Nanoparticles Used as Antibacterial Agents with Field-Flow Fractionation. Antibiotics 2022, 11, 358. [Google Scholar] [CrossRef]
- Qureshi, R.N.; Kok, W.T. Application of flow field-flow fractionation for the characterization of macromolecules of biological interest: A review. Anal. Bioanal. Chem. 2011, 399, 1401. [Google Scholar] [CrossRef]
- Marassi, V.; Giordani, S.; Reschiglian, P.; Roda, B.; Zattoni, A. Tracking Heme-Protein Interactions in Healthy and Pathological Human Serum in Native Conditions by Miniaturized FFF-Multidetection. Appl. Sci. 2022, 12, 6762. [Google Scholar] [CrossRef]
- Marassi, V.; Mattarozzi, M.; Toma, L.; Giordani, S.; Ronda, L.; Roda, B.; Zattoni, A.; Reschiglian, P.; Careri, M. FFF-based high-throughput sequence shortlisting to support the development of aptamer-based analytical strategies. Anal. Bioanal. Chem. 2022, 414, 5519–5527. [Google Scholar] [CrossRef]
- Lou, J.; Myers, M.N.; Giddings, J.C. Separation of Polysaccharides by Thermal Field-Flow Fractionation. J. Liq. Chromatogr. Relat. Technol. 1994, 17, 3239–3260. [Google Scholar] [CrossRef]
- Marassi, V.; De Marchis, F.; Roda, B.; Bellucci, M.; Capecchi, A.; Reschiglian, P.; Pompa, A.; Zattoni, A. Perspectives on protein biopolymers: Miniaturized flow field-flow fractionation-assisted characterization of a single-cysteine mutated phaseolin expressed in transplastomic tobacco plants. J. Chromatogr. A 2021, 1637, 461806. [Google Scholar] [CrossRef]
- Duthen, S.; Rochat, C.; Kleiber, D.; Violleau, F.; Daydé, J.; Raynaud, C.; Levasseur-Garcia, C. Physicochemical characterization and study of molar mass of industrial gelatins by AsFlFFF-UV/MALS and chemometric approach. PLoS ONE 2018, 13, e0203595. [Google Scholar] [CrossRef] [PubMed]
- Novikov, E.A.; Sergeev, Y.A.; Sanzharov, V.V.; Safieva, R.Z.; Vinokurov, V.A. Application of Multidimensional Analysis Methods to Dead Oil Characterization on the Basis of Data on Thermal Field-Flow Fractionation of Native Asphaltene Nanoparticles. Pet. Chem. 2019, 59, 34–47. [Google Scholar] [CrossRef]
- Gascoyne, P.R.C.; Shim, S.; Noshari, J.; Becker, F.F.; Stemke-Hale, K. Correlations between the dielectric properties and exterior morphology of cells revealed by dielectrophoretic field-flow fractionation. Electrophoresis 2013, 34, 1042–1050. [Google Scholar] [CrossRef]
- Roda, A.; Mirasoli, M.; Roda, B.; Bonvicini, F.; Colliva, C.; Reschiglian, P. Recent developments in rapid multiplexed bioanalytical methods for foodborne pathogenic bacteria detection. Microchim. Acta 2012, 178, 7–28. [Google Scholar] [CrossRef]
- Vernhet, A. Red Wine Clarification and Stabilization; Academic Press: Cambridge, MA, USA, 2019; pp. 237–251. [Google Scholar] [CrossRef]
- Martínez-Lapuente, L.; Guadalupe, Z.; Ayestarán, B.; Martínez-Lapuente, L.; Guadalupe, Z.; Ayestarán, B. Properties of Wine Polysaccharides; IntechOpen: London, UK, 2019. [Google Scholar] [CrossRef]
- Marassi, V.; Marangon, M.; Zattoni, A.; Vincenzi, S.; Versari, A.; Reschiglian, P.; Roda, B.; Curioni, A. Characterization of red wine native colloids by asymmetrical flow field-flow fractionation with online multidetection. Food Hydrocoll/ 2021, 110, 106204. [Google Scholar] [CrossRef]
- Pascotto, K.; Leriche, C.; Caillé, S.; Violleau, F.; Boulet, J.C.; Geffroy, O.; Levasseur-Garcia, C.; Cheynier, V. Study of the relationship between red wine colloidal fraction and astringency by asymmetrical flow field-flow fractionation coupled with multi-detection. Food Chem. 2021, 361, 130104. [Google Scholar] [CrossRef]
- Roger, J.M.; Palagos, B.; Bertrand, D.; Fernandez-Ahumada, E. CovSel: Variable selection for highly multivariate and multi-response calibration: Application to IR spectroscopy. Chemom. Intell. Lab. Syst. 2011, 106, 216–223. [Google Scholar] [CrossRef]
- Osorio-Macías, D.E.; Bolinsson, H.; Linares-Pastén, J.A.; Ferrer-Gallego, R.; Choi, J.; Peñarrieta, J.M.; Bergenståhl, B. Characterization on the impact of different clarifiers on the white wine colloids using Asymmetrical Flow Field-Flow Fractionation. Food Chem. 2022, 381, 132123. [Google Scholar] [CrossRef]
- Krebs, G.; Gastl, M.; Becker, T. Chemometric modeling of palate fullness in lager beers. Food Chem. 2021, 342, 128253. [Google Scholar] [CrossRef]
- Roda, B.; Mirasoli, M.; Zattoni, A.; Casale, M.; Oliveri, P.; Bigi, A.; Reschiglian, P.; Simoni, P.; Roda, A. A new analytical platform based on field-flow fractionation and olfactory sensor to improve the detection of viable and non-viable bacteria in food. Anal. Bioanal. Chem. 2016, 408, 7367–7377. [Google Scholar] [CrossRef]
- Austin, M.A.; Rodriguez, B.L.; McKnight, B.; McNeely, M.J.; Edwards, K.L.; Curb, J.D.; Sharp, D.S. Low-density lipoprotein particle size, triglycerides, and high-density lipoprotein cholesterol as risk factors for coronary heart disease in older Japanese-American men. Am. J. Cardiol. 2000, 86, 412–416. [Google Scholar] [CrossRef] [PubMed]
- Kim, S.H.; Yang, J.S.; Lee, J.C.; Lee, J.Y.; Lee, J.Y.; Kim, E.; Moon, M.H. Lipidomic alterations in lipoproteins of patients with mild cognitive impairment and Alzheimer’s disease by asymmetrical flow field-flow fractionation and nanoflow ultrahigh performance liquid chromatography-tandem mass spectrometry. J. Chromatogr. A 2018, 1568, 91–100. [Google Scholar] [CrossRef] [PubMed]
- Marassi, V.; Beretti, F.; Roda, B.; Alessandrini, A.; Facci, P.; Maraldi, T.; Zattoni, A.; Reschiglian, P.; Portolani, M. A new approach for the separation, characterization and testing of potential prionoid protein aggregates through hollow-fiber flow field-flow fractionation and multi-angle light scattering. Anal. Chim. Acta 2019, 1087, 121–130. [Google Scholar] [CrossRef] [PubMed]
- Kim, Y.B.; Yang, J.S.; Lee, G.B.; Moon, M.H. Evaluation of exosome separation from human serum by frit-inlet asymmetrical flow field-flow fractionation and multiangle light scattering. Anal. Chim. Acta 2020, 1124, 137–145. [Google Scholar] [CrossRef]
- de Oliveira, M.A.; Pound-Lana, G.; Capelari-Oliveira, P.; Pontífice, T.G.; Silva, S.E.D.; Machado, M.G.C.; Postacchini, B.B.; Mosqueira, V.C.F. Release, transfer and partition of fluorescent dyes from polymeric nanocarriers to serum proteins monitored by asymmetric flow field-flow fractionation. J. Chromatogr. A 2021, 1641, 461959. [Google Scholar] [CrossRef]
- Ashby, J.; Flack, K.; Jimenez, L.A.; Duan, Y.; Khatib, A.K.; Somlo, G.; Wang, S.E.; Cui, X.; Zhong, W. Distribution profiling of circulating MicroRNAs in serum. Anal. Chem. 2014, 86, 9343–9349. [Google Scholar] [CrossRef]
- Zhang, H.; Freitas, D.; Kim, H.S.; Fabijanic, K.; Li, Z.; Chen, H.; Mark, M.T.; Molina, H.; Martin, A.B.; Bojmar, L.; et al. Identification of distinct nanoparticles and subsets of extracellular vesicles by asymmetric flow field-flow fractionation. Nat. Cell Biol. 2018, 20, 332–343. [Google Scholar] [CrossRef]
- Meyer, J.L.; Wallace, J.B.; Eggert, S.L. Leaf Litter as a Source of Dissolved Organic Carbon in Streams. Ecosystems 1998, 1, 240–249. [Google Scholar] [CrossRef]
- Abelho, M. From litterfall to breakdown in streams: A review. TheScientificWorldJournal 2001, 1, 656–680. [Google Scholar] [CrossRef]
- Freeman, C.; Fenner, N.; Ostle, N.J.; Kang, H.; Dowrick, D.J.; Reynolds, B.; Lock, M.A.; Sleep, D.; Hughes, S.; Hudson, J. Export of dissolved organic carbon from peatlands under elevated carbon dioxide levels. Nature 2004, 430, 195–198. [Google Scholar] [CrossRef]
- Contribution of dissolved organic C to stream metabolism: A mesocosm study using 13C-enriched tree-tissue leachate. J. N. Am. Benthol. Soc. 2005, 24, 48–67. [CrossRef]
- Guéguen, C.; Dominik, J. Partitioning of trace metals between particulate, colloidal and truly dissolved fractions in a polluted river: The Upper Vistula River (Poland). Appl. Geochem. 2003, 18, 457–470. [Google Scholar] [CrossRef]
- Beggs, K.M.H.; Summers, R.S. Character and chlorine reactivity of dissolved organic matter from a mountain pine beetle impacted watershed. Environ. Sci. Technol. 2011, 45, 5717–5724. [Google Scholar] [CrossRef] [PubMed]
- Weishaar, J.L.; Aiken, G.R.; Bergamaschi, B.A.; Fram, M.S.; Fujii, R.; Mopper, K. Evaluation of specific ultraviolet absorbance as an indicator of the chemical composition and reactivity of dissolved organic carbon. Environ. Sci. Technol. 2003, 37, 4702–4708. [Google Scholar] [CrossRef]
- Miller, M.P.; McKnight, D.M. Comparison of seasonal changes in fluorescent dissolved organic matter among aquatic lake and stream sites in the Green Lakes Valley. J. Geophys. Res. Biogeosci. 2010, 115, 1–14. [Google Scholar] [CrossRef]
- Pifer, A.D.; Fairey, J.L. Improving on SUVA 254 using fluorescence-PARAFAC analysis and asymmetric flow-field flow fractionation for assessing disinfection byproduct formation and control. Water Res. 2012, 46, 2927–2936. [Google Scholar] [CrossRef]
- Coble, P.G.; Green, S.A.; Blough, N.V.; Gagosian, R.B. Characterization of dissolved organic matter in the Black Sea by fluorescence spectroscopy. Nature 1990, 348, 432–435. [Google Scholar] [CrossRef]
- Guéguen, C.; Cuss, C.W. Characterization of aquatic dissolved organic matter by asymmetrical flow field-flow fractionation coupled to UV-Visible diode array and excitation emission matrix fluorescence. J. Chromatogr. A 2011, 1218, 4188–4198. [Google Scholar] [CrossRef]
- Cuss, C.W.; Guéguen, C. Determination of relative molecular weights of fluorescent components in dissolved organic matter using asymmetrical flow field-flow fractionation and parallel factor analysis. Anal. Chim. Acta 2012, 733, 98–102. [Google Scholar] [CrossRef]
- Cuss, C.W.; Guéguen, C. Distinguishing dissolved organic matter at its origin: Size and optical properties of leaf-litter leachates. Chemosphere 2013, 92, 1483–1489. [Google Scholar] [CrossRef]
- Cuss, C.W.; Guéguen, C. Relationships between molecular weight and fluorescence properties for size-fractionated dissolved organic matter from fresh and aged sources. Water Res. 2015, 68, 487–497. [Google Scholar] [CrossRef] [PubMed]
- Coble, P.G. Characterization of marine and terrestrial DOM in seawater using excitation-emission matrix spectroscopy. Mar. Chem. 1996, 51, 325–346. [Google Scholar] [CrossRef]
- Mangal, V.; Stenzler, B.R.; Poulain, A.J.; Guéguen, C. Aerobic and Anaerobic Bacterial Mercury Uptake is Driven by Algal Organic Matter Composition and Molecular Weight. Environ. Sci. Technol. 2019, 53, 157–165. [Google Scholar] [CrossRef] [PubMed]


Disclaimer/Publisher’s Note: The statements, opinions and data contained in all publications are solely those of the individual author(s) and contributor(s) and not of MDPI and/or the editor(s). MDPI and/or the editor(s) disclaim responsibility for any injury to people or property resulting from any ideas, methods, instructions or products referred to in the content. |
© 2023 by the authors. Licensee MDPI, Basel, Switzerland. This article is an open access article distributed under the terms and conditions of the Creative Commons Attribution (CC BY) license (https://creativecommons.org/licenses/by/4.0/).