Article

Multiplexed Detection of Human Papillomavirus Based on AzaBODIPY-Doped Silica-Coated Polystyrene Microparticles

1
Institute for Nanotechnology Innovation, Rhodes University, Makhanda 6140, South Africa
2
Chemical and Optical Sensing Division, Bundesanstalt für Materialforschung und -prüfung (BAM), Richard Willstätter Str. 11, 12489 Berlin, Germany
*
Authors to whom correspondence should be addressed.
Chemosensors 2023, 11(1), 1; https://doi.org/10.3390/chemosensors11010001
Submission received: 31 October 2022 / Revised: 7 December 2022 / Accepted: 8 December 2022 / Published: 20 December 2022
(This article belongs to the Section (Bio)chemical Sensing)

Abstract

:
Human papillomavirus (HPV) DNA detection can enable the early diagnosis of high-risk HPV types responsible for cervical cancer. HPV detection is also essential for investigating the clinical behavior and epidemiology of particular HPV types, characterization of study populations in HPV vaccination trials and monitoring the efficacy of HPV vaccines. In this study, two azaBODIPY dyes (1 and 2) were used as references and were doped into polystyrene particles (PS40), while a short HPV DNA single strand was used as a target molecule and was covalently bound to the silica shell. These particles were employed as optical probes in 1:1 hybridization assays, and their potential applicability as a tool for multiplex assays for the detection of different strands of HPV was evaluated using flow cytometry. A good separation in the fluorescence of the four different concentrations prepared for each dye was observed. To perform the hybridization assays, HPV18, HPV16, HPV11 and HPV6 single strands were attached to the particles through EDC-mediated coupling. The c-DNA-1-PS40 and c-DNA-2-PS40 particles exhibited low limit of detection (LOD) and quantification (LOQ) values for HPV11, and a narrow detection range was obtained. Multiplexed assay experiments were successfully performed for both particles, and the results proved that c-DNA-1-PS40 could potentially be used as a tool for multiplexing assays and merits further in-depth study in this context.

1. Introduction

The fluorescence of organic dyes has been extensively used as a signal transduction tool to provide highly sensitive fluorescence-based detection techniques [1,2]. However, some of these organic fluorophores have major drawbacks, such as environmental sensitivity due to their molecular nature, photostability and their bioconjugation possibilities [3]. The absence of functional groups for further conjugation to biomolecules without interfering with the target’s binding specificity or causing it to precipitate can be problematic [3,4]. To combat these limitations, polystyrene or silica particles can be used as carrier platforms for the analysis since they can be produced at low cost, in large batches and different sizes, and because they can be facilely doped with organic dyes [5,6,7,8]. While silica nanoparticles are mainly used for ensemble measurements, polystyrene (PS) microparticles are commonly used in single particle-based methods, including many commercial assays, because of their high refractive index and excellent scattering properties [9,10]. However, combining polystyrene and silica particles results in beads that combine the properties of easy modification and tolerance to organic (co-)solvents with the presence of organic functional groups, a low sedimentation tendency and good scattering properties [11,12]. AzaBODIPY-doped PS particles coated with a silica shell were used for the assays in this study. Similar BODIPY-doped particles have been studied previously [13,14]. The dyes are used as a reference and are doped into polystyrene particles [14], while short DNA single-strands corresponding to specific genetic sequences of the Human Papillomavirus (HPV) were used as a target, the complementary strands of which were covalently bound to the silica shell. The detection of HPV is essential due to its relevance as a carcinogen and its presence in many different diseases, including cervical cancer, the second most common cancer among women worldwide [15]. Hence, HPV DNA detection can enable the early diagnosis of high-risk HPV types responsible for cervical cancer.
In an earlier work, some of us reported polystyrene (PS) microparticles with convergently grown mesoporous silica shells as a promising tool for multiplexed bioanalytical assays [14]. In that study, two different PS particles were used, i.e., particles prepared with poly(vinylpyrrolidone) of molecular weights 10 and 40 kDa as stabilizing agents, PVP10 and PVP40, yielding PS10 and PS40, in combination with mesoporous silica particles to detect HPV types using a BODIPY dye as a reference. In this study, two unfunctionalized azaBODIPY dyes were separately doped into PS40 particles in combination with a non-porous silica shell for the multiplex detection of HPV DNA sequences by flow cytometry. AzaBODIPY dyes have potential in this regard due to their structural versatility, photochemical stability, high molar absorption coefficients and tunable emission wavelengths [16].
Microparticles encoded with combinations of fluorophores of different fluorescence wavelengths at different intensity levels have proved useful for the multiplexed detection of biomarkers through their laser excitation and flow cytometry detection setups [4,10,17]. Multiplex analyses can simultaneously perform multiple discrete assays in a single tube with the same sample [18]. In comparison to large-scale traditional assays such as ELISAs and microarrays, which require analysis of one antigen at a time and relatively large volumes of sample for multiple assays, bead-based suspension array technology (SAT) is an attractive alternative [18,19,20,21]. SAT based on spherical microparticles is a low-cost, flexible and high-throughput method capable of simultaneous detection of multiple molecular targets in a single sample (multiplexed analysis) using small volumes of the sample. In this method, for a successful multiplexed analysis, each bead must be encoded with a unique identifier to facilitate the quantification of the attached probe molecule [18,19,20,21].
The doping of identically-sized particles with two different dyes, emitting at two different wavelengths, can be used to achieve this type of assay [22]. This method circumvents problems such as particle aggregation, which compromises size-coded bead assays, while allowing for higher-number multiplexing. The aim of this study is to use PS particles doped with azaBODIPY dyes, coated with a silica shell and appropriately functionalized to analyze their sensitivity, general functionality and utility for use in flow-cytometry for DNA hybridization assays. Specific genetic sequences of different types of human papillomavirus (HPV) were chosen as the analytes for both single and multiplexed assays. The multiplexed assays were studied on four HPV types, 6, 11, 16 and 18.

2. Materials and Methods

2.1. Materials

Absolute ethanol (EtOH), tetraethylorthosilicate (TEOS), ammonia, 3-aminopropyltriethoxysilane (APTES), methanol (MeOH), hydrochloric acid (HCl) (37%), pentylamine, succinic anhydride, N,N-dimethylformamide (DMF), amino-modified DNA, complementary (c-DNA), target sequence DNA (t-DNA), 2-(N-morpholino)ethanesulfonic acid (MES), 1-(3-dimethylaminopropyl)-3-ethylcarbodiimide (EDC), N-hydroxysuccinimide (NHS) solution, magnesium chloride (MgCl2), tetramethylammonium chloride (TMAC), ethylenediaminetetraacetic acid (EDTA), trisaminomethane (Tris), sodium dodecyl sulfate (SDS) and tetrahydrofuran (THF) were purchased from Sigma-Aldrich. AzaBODIPYs 1 and 2 were synthesized according to the reported literature procedures except for the modifications noted for 1 (Figure S1 in Supplementary Information) below [23,24,25,26,27,28]. The photophysical properties [28,29] are provided in Figure S2 and Table S1 in Supplementary Information. The anionic PS40 polystyrene core (PS40) was synthesized as reported earlier [11]. Limits of detection (LOD, according to DIN 32645:2008-11) and limits of quantification (LOQ) were determined according to the procedures reported in [14,30]; for more experimental details, see the Supplementary Information.

2.2. Equipment

1H NMR spectra were recorded at room temperature in CDCl3 on a Bruker AMX 600 instrument operating at 600 MHz. Transmission electron microscopy (TEM) images were obtained using a JEOL TEM 1210 transmission electron microscope at a 100 kV accelerating voltage. TEM samples were prepared by placing a drop of conjugate or nanoparticle solution on the sample grid and allowing it to dry prior to measurements. Ultraviolet-visible (UV–vis) absorption spectra were measured for solution studies at room temperature on a Shimadzu UV-2550 and an Analytik Jena Specord 210 plus spectrophotometer with a 1 cm pathlength quartz cuvette. Energy dispersive (EDX) spectroscopy was carried out on an INCA PENTA FET coupled to the VAGA TESCAM using 20 kV accelerating voltage. Thermogravimetric analysis (TGA) was performed using a Perkin Elmer TGA 4000 analyzer. The analysis was carried out under a nitrogen flow rate of 120 cm−3 min−1. The weighed sample masses were heated from 50 to 850 °C at a heating rate of 10 °C min−1. Flow cytometric analysis was performed on a BD Accuri C6 equipped with a 488 and 635 nm argon and diode laser for excitation, respectively. Forward-scattered (FSC) and sideward-scattered light (SSC) were detected at 180 and 90°, respectively, with 488 nm bandpass filters and gains of 137 and 180. Fluorescence (FL1) was detected at 90° with a 520−50 band-pass filter and a gain of 650. The fluorescence in channels FL3 and FL4 (red channel, 675/25 nm; λex = 650 nm) were used for recording the analytical signals and for decoding in the multiplexing experiments. All samples were measured in dispersion using water at a concentration of ≈ 1 × 10⁻⁵ % (w/v). Each run was performed under the same instrumental settings with a run time of 60 s for all the experiments. Results are reported by gating the signal appropriately, followed by data export to Origin 9.1 (OriginLab) for further data handling.

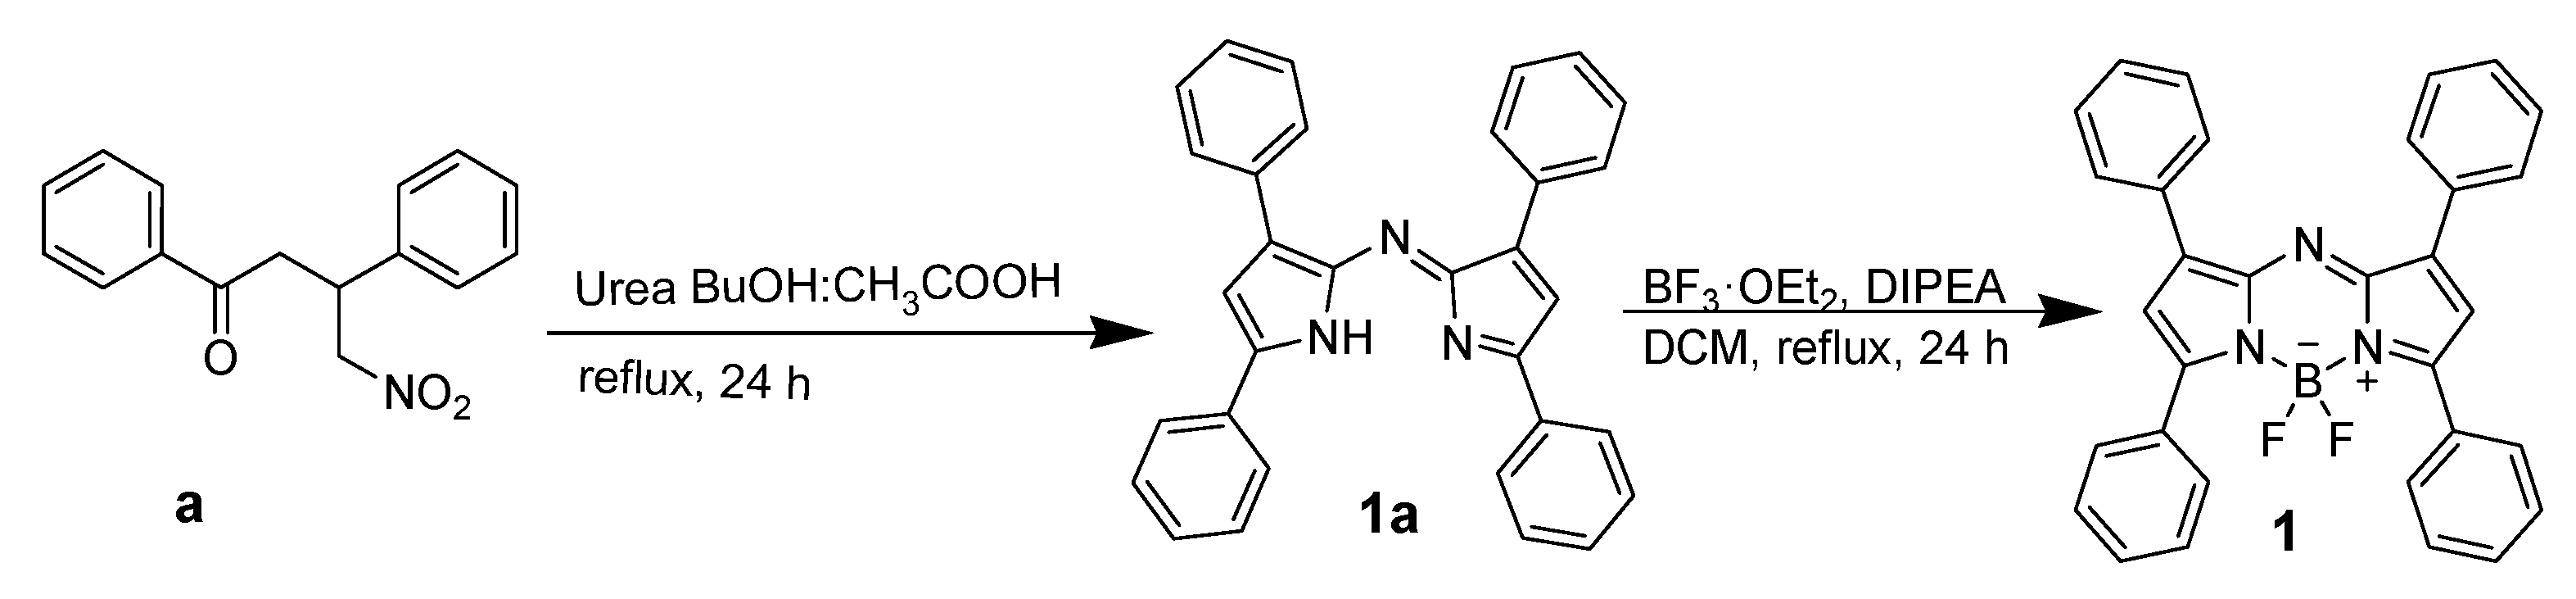
2.3. Synthesis of AzaBODIPY 1

A modified synthetic procedure was used to synthesize azadipyrromethane 1a (Scheme 1). A mixture of a 1,3-(bis-(hetero)aryl)-4-nitrobutanone a (1 mmol) and urea (35 mmol) was refluxed in 50 mL of n-BuOH: AcOH (4:1) for 24 h. The dark blue product precipitated from the solution. The dark brown reaction mixture was filtered, and the product was recrystallized from dichloromethane/hexane (1:4) to give pure product 1a as a dark blue solid.
Azadipyrromethene 1a obtained in 98% yield; 1H NMR (600 MHz, CDCl3): δ/ppm 7.33−7.36 (2H, m, Ar-H), 7.44−7.55 (12H, m, Ar-H), 7.76 (2H, d, J = 7.1 Hz, Ar-H), 7.90 (2H, s, Ar-H) and 8.22 (4H, d, J = 7.1 Hz, Ar-H).
Diisopropylamine (0.8 mL, 4.8 mmol) was added to a solution of 1a (1 mmol) in dichloromethane (50 mL), and the mixture was stirred for 1 h. BF3·OEt2 (0.6 mL, 5.0 mmol) was added at room temperature, and the resulting mixture was refluxed until the starting material was completely converted (ca. 2 h) to the corresponding product (monitored with thin layer chromatography). The cold reaction mixture was diluted with water and extracted twice with dichloromethane (100 mL). The combined organic layers were dried with sodium sulfate and concentrated in vacuo. The crude products were purified by flash chromatography using dichloromethane/hexane (2:1) as eluent to obtain the products as shiny coppery-colored crystals.
AzaBODIPY 1 obtained in 62% yield; IR (νmax/cm−1): 2953 (=C-H stretch), 2916−2849 (-C-H stretch), 1682 (C=N stretch), 1544–1504 (Ar C-C), 1340–1027 (C-N stretch); 1H NMR (600 MHz, CDCl3): δ/ppm 7.47 (2H, s, Ar-H), 7.50 (2H, t, J = 7.2 Hz, Ar-H), 7.53–7.56 (10H, m, Ar-H), 8.15–8.17 (4H, m, Ar-H) and 8.25 (4H, d, J = 9.0 Hz, Ar-H).

2.4. Preparation of PS40 Particles

Polyvinylpyrrolidone (PVP)-stabilized microparticles were synthesized by dispersion polymerization with 4,4-azobis(4-cyanovaleric acid) (ACVA) as the initiator. First, 1.7 g (1.8 weight % (w/w) with regard to total weight of solvent) of the stabilizer (PVP40) was dissolved in 100 mL ethanol in a 250 mL 3-necked round-bottom flask with a magnetic stirrer. The solution was heated to 75 °C in an oil bath. ACVA was weighed separately (2.1 weight % (w/v) with regard to the volume of monomer) and dissolved in 20 mL ethanol. Styrene (9.6% (w/w) with regard to the total weight of solvent) was filtered through a basic alumina column to remove the stabilizer and then added to the ACVA solution. Both solutions were degassed simultaneously with an Ar stream for 30 min. Afterwards, the solution containing ACVA and styrene was directly transferred to the preheated PVP solution and the mixture was stirred for 24 h at 500 rpm. The particles were subsequently separated from the solution by centrifugation and washed thrice with methanol. The microparticles were obtained as a white solid after drying overnight in a vacuum oven. The product was stored at room temperature without any further treatment.

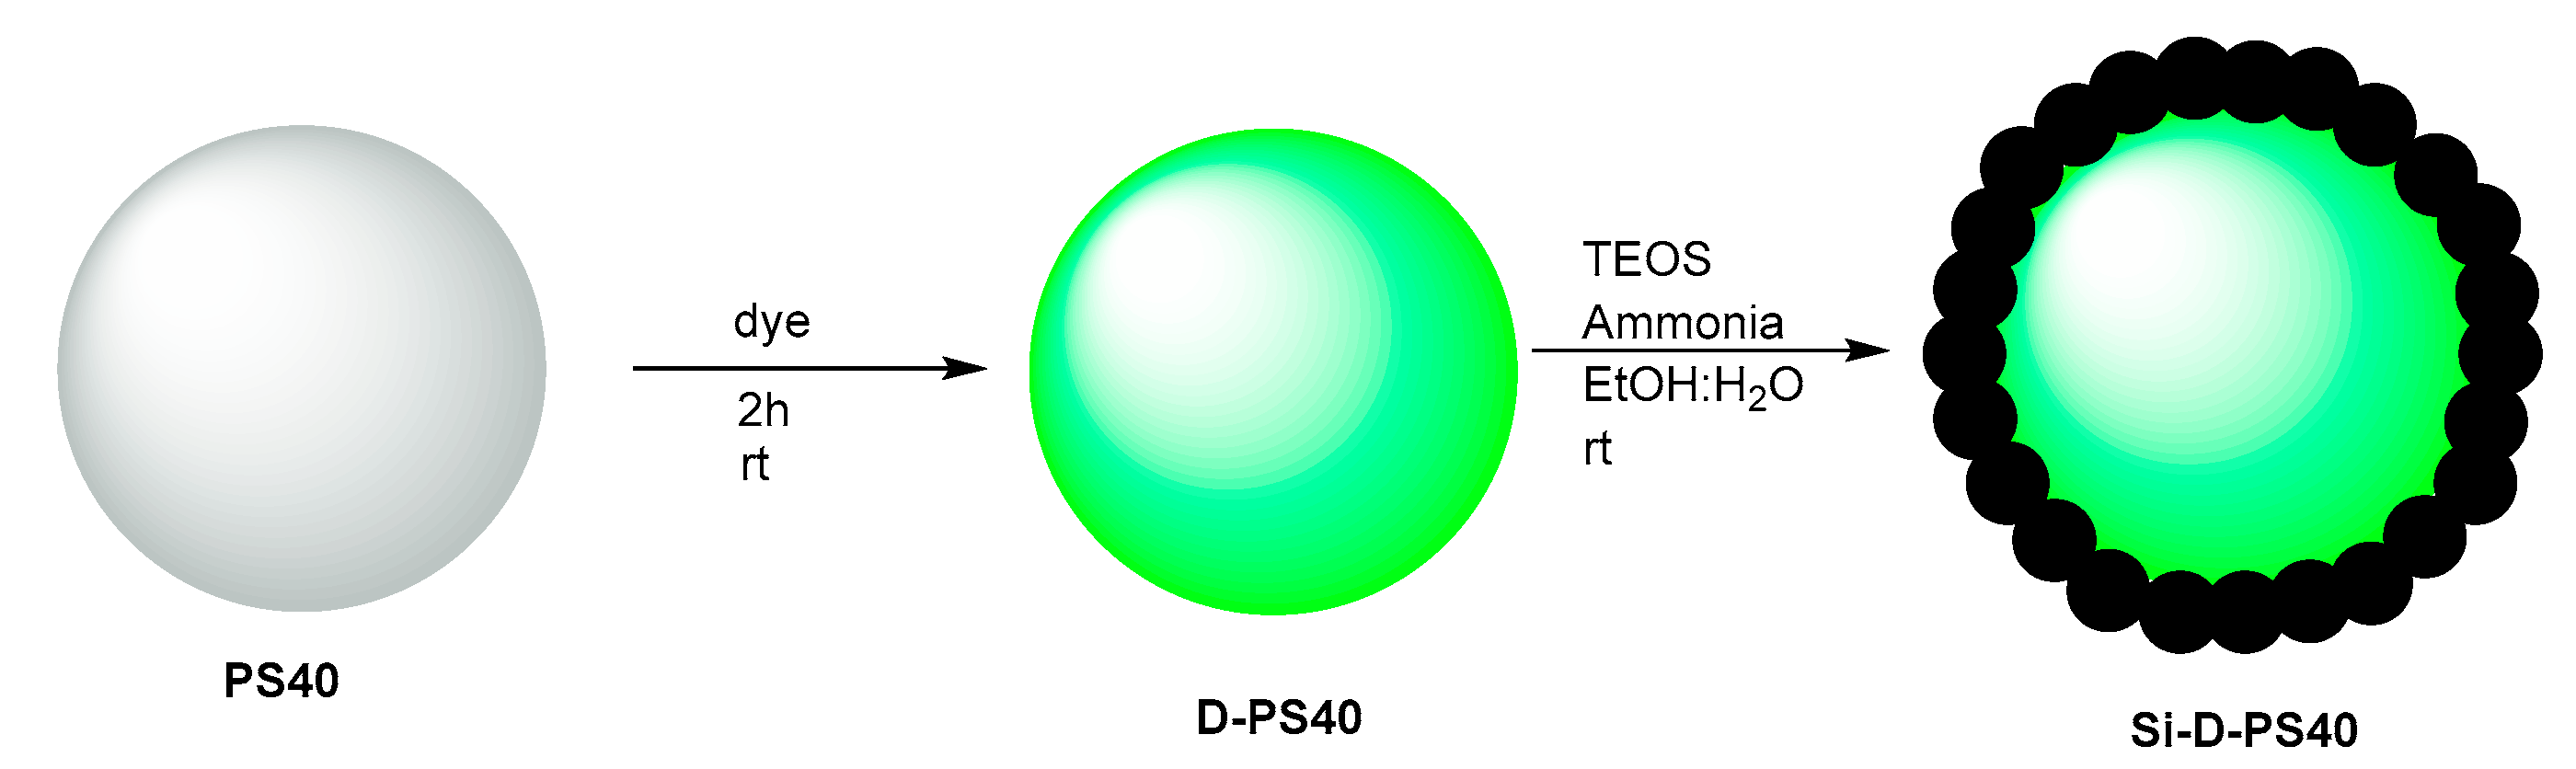
2.5. Doping of PS40 Particles

A stock solution (5%) was prepared with 250 mg of PS40 in 5 mL of Milli-Q water. 1.3 mL of this solution was added to 130 µL of THF and immediately put on a rotator at 40 rpm at room temperature. Then, 300 µL of ca. 5% anionic polystyrene suspension and 30 µL of a solution of dye D (D = 1 or 2) in THF were added, and the mixture was immediately vortexed. Four different dye concentrations were added to the solutions (Scheme 2), namely 14, 7.5, 3.5 and 1.5 × 10⁻³ M. The particles were centrifuged (three times at 1 min, 10,000 rpm) after rotating for another 2 h, washed twice with 1.5 mL of Milli-Q water and once with absolute ethanol and dried in a vacuum oven overnight at room temperature to obtain D-doped PS40 (D-PS40). Only THF was added to prepare a blank solution.

2.6. Coating of PS40 with Silica Shell

About 10 mg of the D-PS40 particles were weighed in Eppendorf tubes and suspended in 1 mL of absolute ethanol. About 20 μL of Milli-Q water was added. The suspension was sonicated for a few minutes and then vortexed. An amount of 30 μL of TEOS and ammonia was added, and the solution was vortexed (Scheme 2). The particles were left to mix at room temperature for 20 h in a Thermomixer. The suspension was washed by centrifugation (10 min, 6000 rpm) three times in Milli-Q water with subsequent removal of the supernatant. The silica-coated D-PS40 (Si-D-PS40) particles prepared in this manner were dispersed in 5 mL of 70% ethanol using a vortex followed by centrifugation. This was repeated twice for 5 min, and each time the supernatant was removed. The particles were then put in the oven to dry overnight.

2.7. Functionalization with APTES and COOH Groups

For the functionalization with amino groups (Scheme 3), ca. 20 mg of the Si-D-PS40 particles were dispersed in 800 µL of ethanol. A total of 400 µL of a 1 M HCl solution in ethanol was added to activate the surface of the particles, and the mixture was sonicated for 5 min. The particles were washed twice with 400 µL of ethanol and dispersed in 400 µL of ethanol. Then, 4 µL of APTES was added for amino modification, and the mixture was left to react in a Thermomixer (500 rpm) at room temperature overnight. The amino-functionalized Si-D-PS40 (NH2-D-PS40) particles prepared in this manner were washed three times with an EtOH:H2O mixture (1:1). Then, they were dried in vacuo at room temperature.
For the preparation of carboxylic-acid-substituted Si-D-PS40 particles (COOH-D-PS40) particles, 5 mg of the corresponding NH2-D-PS40 amino group-modified particles were dispersed in 1.5 mL of ethanol by using 2 mL Eppendorf tubes. Then, 30 µL of succinic anhydride in DMF (10%, 10 mg in 100 µL) was added, and the mixture was left to react in a thermomixer (800 rpm) at room temperature overnight. Then, the particles were washed three times with an EtOH:H2O mixture (1:1). In the last step, 500 µL of ethanol was added to provide the final concentration of 1% (w/v) as a stock solution.

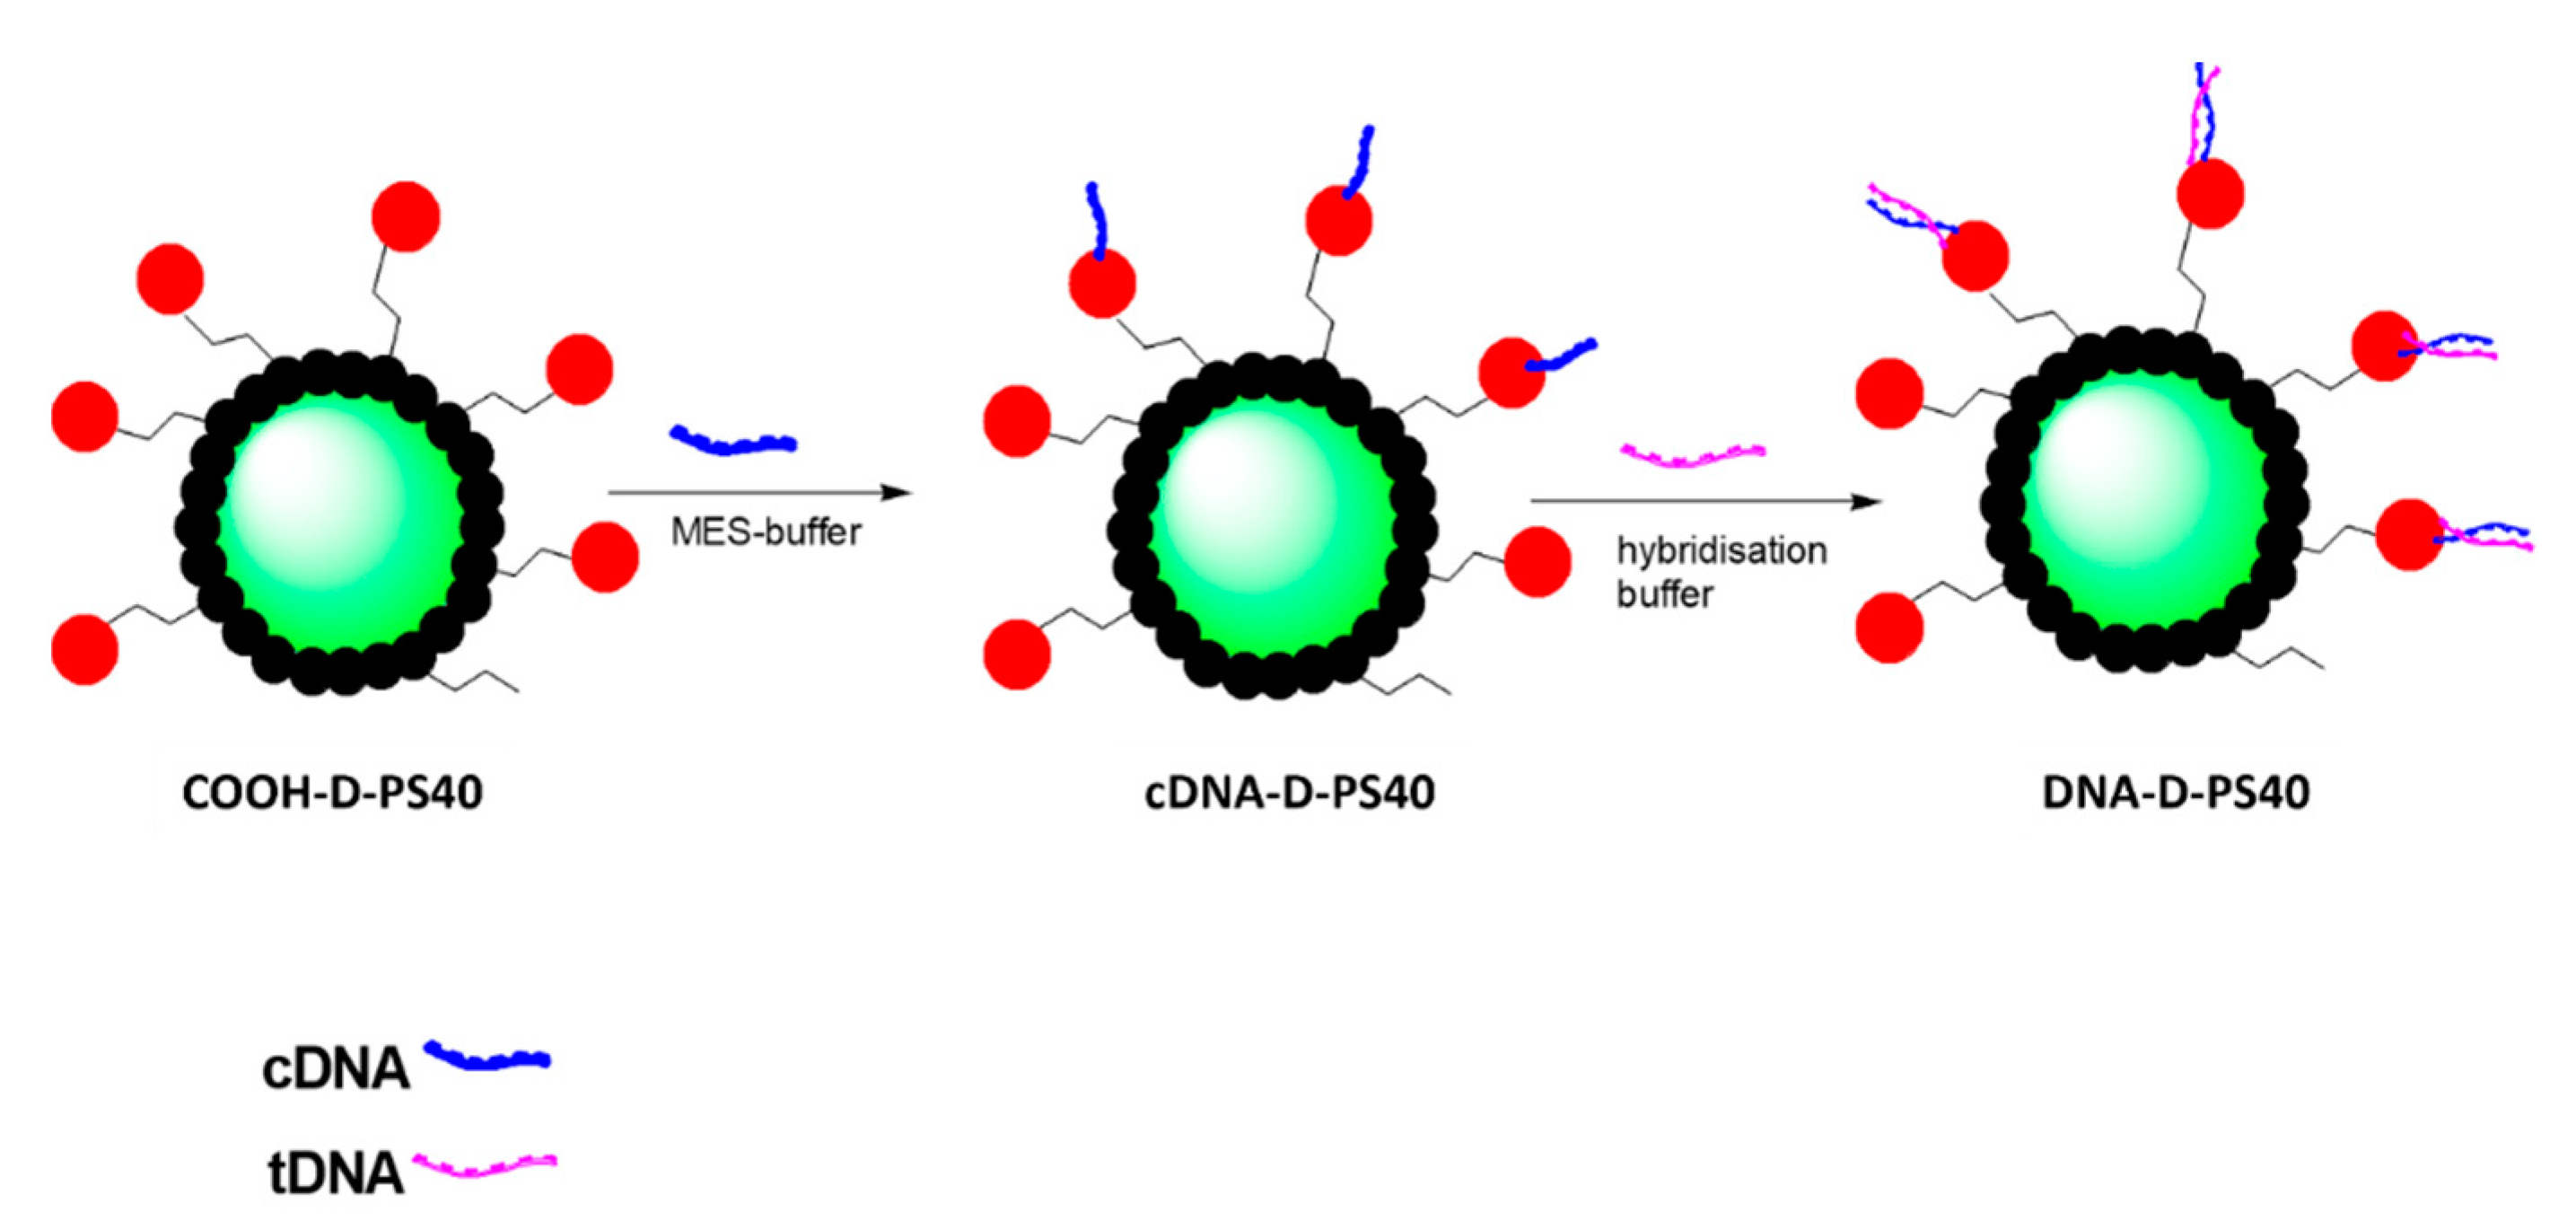
2.8. Coupling with c-HPV and Hybridization Assay
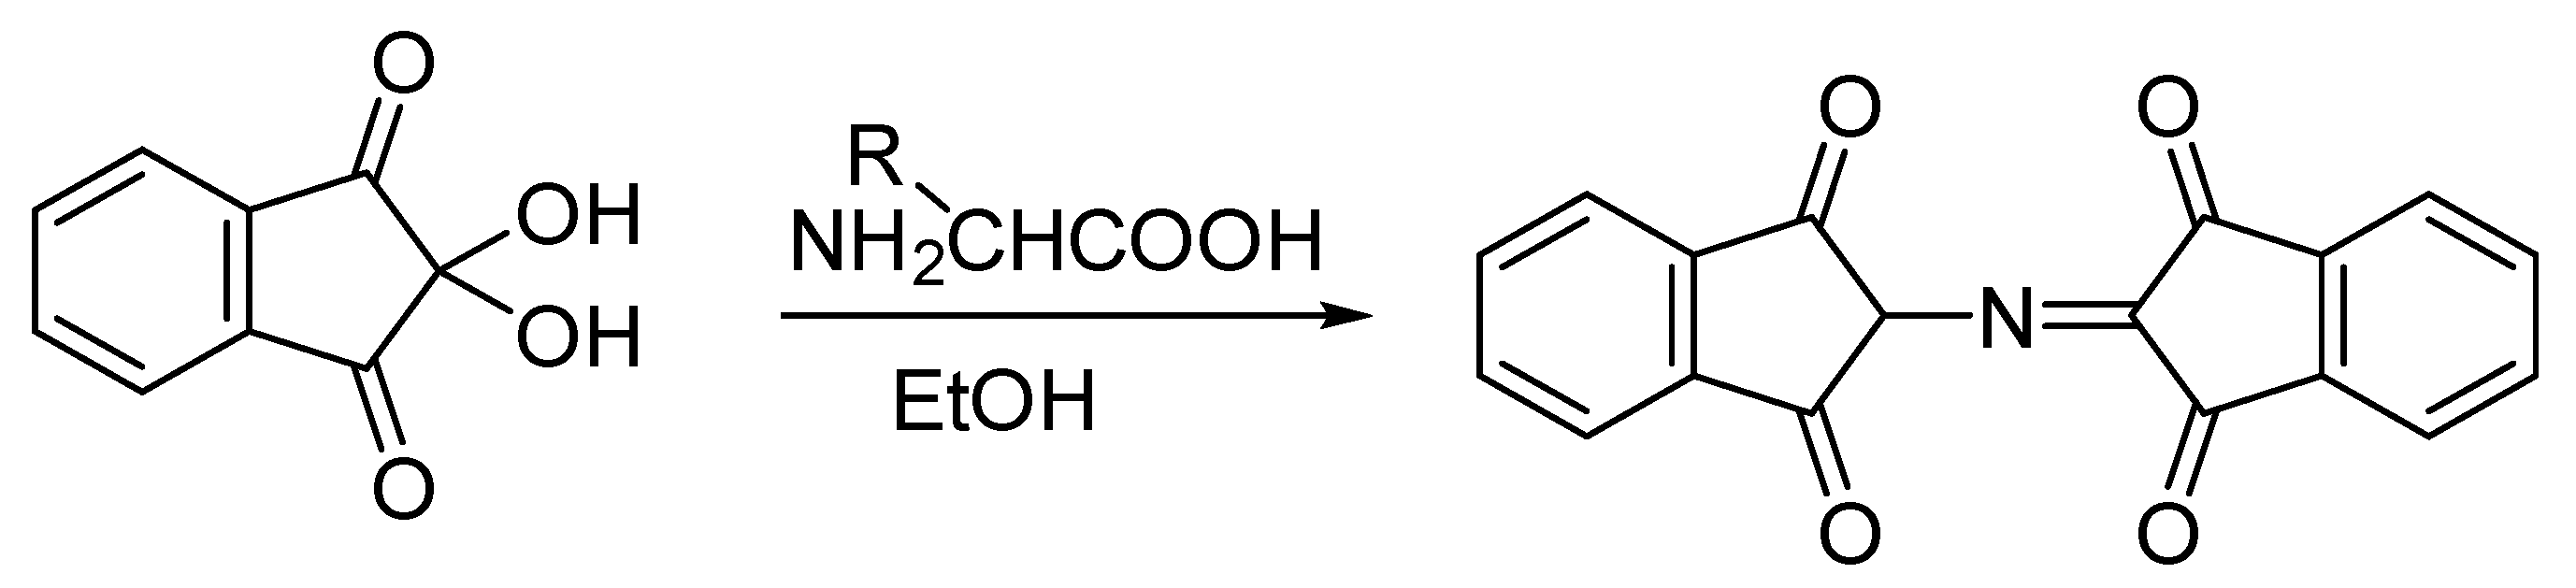
For the coupling of c-DNA to the COOH-D-PS40 particles (Scheme 4), 10 µL of 1% (w/v) stock solution of COOH-D-PS40 particles was dispersed in 200 µL of MES buffer (pH 5, 0.1 M). To this dispersion, 80 µL of a freshly prepared EDC solution and 160 µL of an NHS solution in MES buffer were added. After being left for 15 min at room temperature, 12 µL of a 0.1 mM c-HPV solution was added, and the mixture was left to react in a Thermomixer (1000 rpm) at room temperature overnight to obtain the c-HPV coupled particles (c-HPV-D-PS40). 200 µL of Tris/SDS buffer (0.1 M Tris-HCl with 0.05% SDS) was added, and after centrifugation, the mixture was washed twice with 1000 µL of Tris/SDS (0.1 M Tris–HCl with 0.05% SDS). Finally, the particles were dispersed in 200 μL of 0.1 M Tris–HCl MgCl2 (pH 8) to reach a stock solution concentration of 0.025%.
For the hybridization assays, 5 µL of the c-HPV modified stock solution was mixed with 95 µL of hybridization buffer. A total of 5 µL of the complementary t-HPV was added at concentrations of 2, 0.2, 0.1, 0.02, 0.01, 0.002, 0.0002, 0.00002 and 0.00001 pmol/µL along with a blank measurement with no t-HPV. The hybridization buffer was a mixture of Tris (50 mmol) and MgCl2 (80 mmol) in water (pH 8).

2.9. Ninhydrin Test

The ninhydrin test (Scheme 5) was used to quantify amino groups (Table 1) by following the protocol of Soto Cantu et al. [31]. A total of 5 mg of amino-functionalized particles were dispersed in 1.4 mL of ethanol, and 0.4 mL of a ninhydrin solution (0.35%) was added. The reaction was carried out in a Thermomixer at 65 °C and 10 rpm over 2 h. Upon cooling, the mixture was centrifuged, and 0.5 mL of the supernatant was diluted with 1.5 mL of ethanol. The absorbance of the solution was measured on a Specord 210 plus spectrophotometer from Analytik Jena.

3. Results and Discussion

3.1. Synthesis and Characterization

Experiments were performed using PS40 polystyrene particles produced according to our established protocol [11]. The PS40 particles were stabilized by poly(vinylpyrrolidone) (PVP) with an average molecular weight of ca. 40 kDa. PVP also acts as a capture agent, promoting precipitation of silica seeds on the surface which are further overgrown during the shell formation step [32,33]. The polystyrene particles had a diameter of 2.5 μm. The relatively large surface area provides a desirable environment for enhancing reaction kinetics and enables the use of small reaction volumes. Unfunctionalized hydrophobic azaBODIPY dyes 1 and 2 were used to encode the PS40 particles (Figure 1).
To confirm the successful doping of PS40 beads with the azaBODIPY dyes, fluorescence spectra of 1 and 2 of the particles were measured at excitation wavelengths of 650 and 700 nm in ethanol, respectively, at a concentration of 1.0 µM. As shown in Figure S3 in the Supplementary Material, when the dye is incorporated in the PS40 beads, blue shifts of 12 and 5 nm are observed in the emission spectra of 1 and 2, respectively, since azaBODIPYs are known to be solvatochromic [34]. The environment of the dye differs markedly in the PS40 beads from that in ethanol solution. The light scattering properties of the polystyrene beads may also have an influence, as reported by Lagorio et al. [35]. They showed that the scattering of light can lead to light re-absorption processes, which produce emission spectral distortions depending on the layer thickness of the fluorescent material, sample absorption at the excitation and emission wavelengths, and the excitation wavelength. As expected, no emission was observed for the undoped PS40 beads.
Figure 1. Schematic diagram of a dye-doped and silica-coated polystyrene core-shell particle functionalized with DNA strands [11] (left), a typical flow cytometer measurement cell (middle), highlighting the hydrodynamic focusing of the single particles and their optical interrogation via scattering (forward, FSC, 180° geometry; sideward, SSC, 90° geometry) and fluorescence channels (FL1-FL4) [36], and typical measurement results (right; histogram, density dot plot).
Chemosensors 11 00001 g001
The doping of PS40 particles was carried out in THF, and the particles were washed twice with ethanol in dispersion/centrifugation cycles. For further modification, the azaBODIPY dye-doped PS40 particles were redispersed in an ethanol:water mixture functionalization medium to prepare a stock concentration of 1% w/v. The formation of a hydrophilic silica shell on the surface of the PS40 particles was achieved by following an ammonia-catalyzed sol–gel process with TEOS as a precursor. Since the aim of this work was to use the particles produced in DNA hybridization assays as carriers for the target strands, further functionalization of the silica shell was vital. Aminopropyltriethoxysilane was condensed on the surface of the core/shell particles, to provide amino groups as anchors for further conjugation in a ring-opening reaction with succinic anhydride to form carboxylic acid moieties on the surface (COOH-D-PS40 in Scheme 3). In order to quantify the amino groups on the surface of the NH2-D-PS40 particles, a ninhydrin test was carried out. In this test, primary amines react with ninhydrin and produce the dye Ruhemann’s Purple, which has an absorption maximum at 580 nm [37]. Spectra of the colored supernatant of the suspension were measured with a spectrophotometer. A calibration curve was obtained with pentylamine which is provided in Figure S4 of the Supplementary Material. Table 1 provides the concentration of the amino groups in mM in solution and in mM.g−1 of solid. The concentration of the amino groups was found to be around 2.19, 6.04 and 2.43 × 10⁻⁵ mM g−1 for the blank non-doped particles (NH2-B-PS40), dye-doped NH2-1-PS40 and NH2-2-PS40 particles, respectively.
As can be observed in Figure S4B in the Supplementary Information, azaBODIPY 1 leached out at 65 °C during the ninhydrin test experiment. To avoid this, all experiments were carried out at room temperature. The low concentration of amino groups on the surface of these particles compared to values reported in the literature [14] could be due to an incomplete formation of the shell and/or because the SiO2 coating did not result in a shell with a significantly increased surface area. The different elements present in both the blank and doped particles were confirmed by EDX analysis. As shown in Figure 2A, the EDX data for the bare PS40 particles (left) contain strong peaks for carbon and oxygen atoms from the polystyrene core. The presence of Si, B, N, O and F peaks confirms the successful adsorption of the azaBODIPY dyes and the presence of silica coating (Figure 2B, right). In addition, the high carbon content in the silica shelled particles can be attributed to the diffusion of PVP chains of the polymeric core into the shell layer via capillary forces due to the small size of the SiO2 seeds on the surface [38].
SEM was used to view the morphology of the particles and to determine their diameters (Figure 2). The SEM images were processed by ImageJ [39], a freely available open-source software. The projection area of individual particles was determined using ImageJ’s built-in analysis tool. Statistical analysis of all counted particles was carried out to calculate the mean diameter size and the standard deviation (σ). The doped particles had an average diameter of 2.50 ± 0.03 μm, whereas the average value for the doped silica-coated particles was 2.55 ± 0.03 μm, implying a shell thickness of ca. 0.025 μm. This increase in the particle size is consistent with successful coating of the particles. The size distribution can be described with a coefficient of variation (Cν), which corresponds to the ratio of the standard deviation to mean size (χm). The coefficients of variation (Cν = σ/χm) for the doped and doped silica-coated particles amounted to 1.6 and 1.5%, respectively. Since these values are less than 5%, an acceptable level of monodispersity was achieved. This is of great importance for comparability and data interpretation in suspension array technologies (SATs), especially with regard to cytometric assays [40].
Different silica shell morphologies can be obtained depending on the synthetic strategy. Water-based emulsifier-free emulsion techniques can be used to prepare positively or negatively charged polymeric core templates [38]. In this work, negatively charged polymer cores were synthesized. Figure 3 and Figure 4 show the TEM images of the uncoated, silica-coated, and APTES and COOH functionalized particles. The coated particles show an assembly of small silica nanoparticles fused together to varying degrees to form the shell. The particle morphology is rougher in appearance for the coated particles compared to the uncoated particles (Figure 3 and Figure 4).
Thermogravimetric analyses were performed for azaBODIPY 1 and the D-PS40, Si-D-PS40 and NH2-D-PS40 particles under a nitrogen atmosphere to determine the success of the functionalization. The decomposition temperature was found to increase with the functionalization of the particles. The decomposition temperature (Td) values obtained at a 5% weight loss were ≈199 ± 1 °C for azaBODIPY 1, ≈239 ± 1 °C for D-PS40, ≈ 304 ± 1 °C for Si-D-PS40 and ≈341 ± 1 °C for NH2-D-PS40 (Figure 4). The TGA profiles of the particles also reveal three phases which can be assigned to the following processes: up until ≈280 ± 1 °C, water desorption takes place (phase 1) followed by core burning until ca. 450 °C (phase 2) [32]. In the third phase, condensation reactions and removal of organic residues from the silica domain occur until only the inorganic SiO2 remains [41]. The SiO2 content was estimated to be 1.6%, which is consistent with the presence of a thin silica shell as would be anticipated based on the TEM images, the low silicon composition observed by EDX and the small diameter increase of the particles in the SEM images. The Td value for azaBODIPY 1 increased from 170 to 288 °C when doped onto the polystyrene bead, which implies that there is enhanced thermal stability in this context (Figure 5).

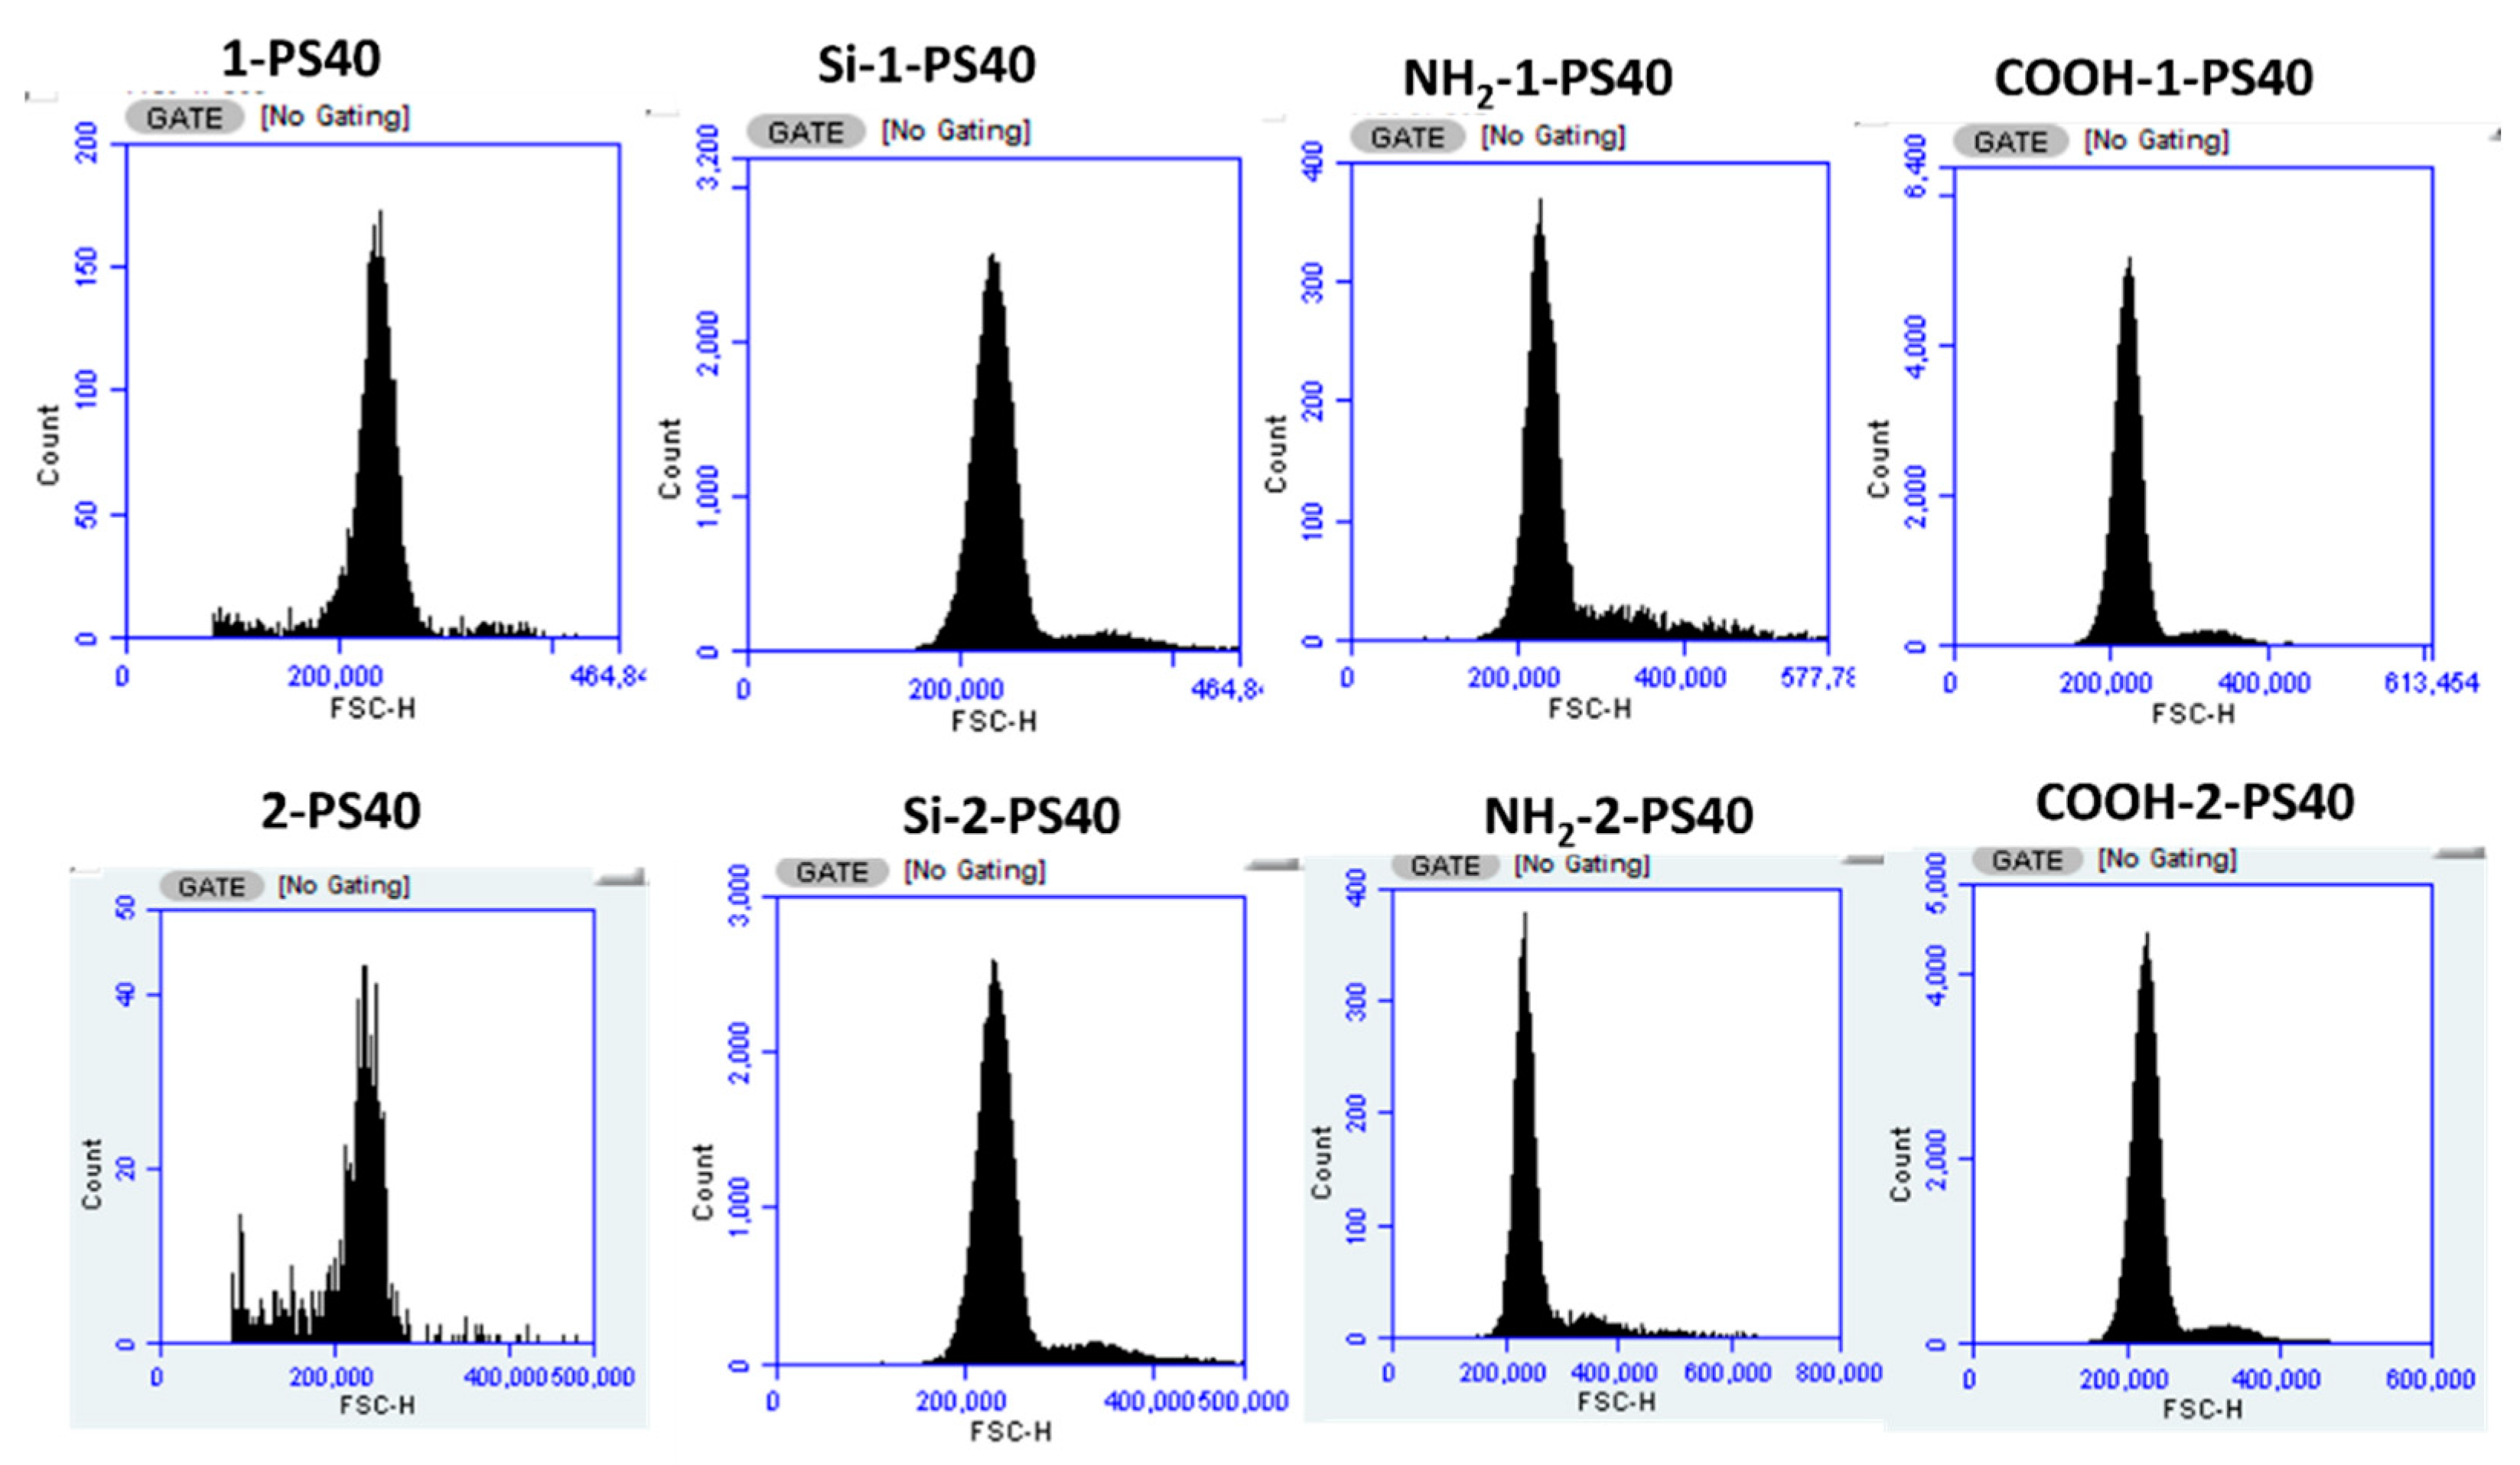
3.2. Characterization of the Particles in Flow Cytometry

To characterize the particles by flow cytometry, dynamic light scattering was used to gain insight into their size, granularity and the overall outside structure of the particles by measuring the forward (FSC) and sideward scattering (SSC). The FSC correlates with the volume of the particles and is a measure of the diffraction of the light at a flat angle, whereas, with SSC, the scattering of the light is detected at right angles. Larger particles with an uneven surface lead to high values for FSC and SSC, while smaller particles with an even surface result in lower values. To investigate the potential utility of the doped silica-coated particles as SAT elements, their scattering properties were compared to those of the bare core particles. The difference in size should be significant to enable successful detection by cytometry.
There is an increase in the FSC and SSC intensities on moving from blank PS40 particles to the silica-coated particles, which further increases upon functionalization with APTES to obtain NH2 functional groups (Table 2). The statistical analyses of these measurements in Table 2 show the differences in the Cν values before and after silica coating. Values of more than 5% were obtained for both uncoated and silica-coated particles, indicative of less monodispersed particles. However, the monodispersity improves slightly upon functionalization with APTES, as indicated by the decrease in the Cν values.
Figure 6 contains histogram plots obtained in flow cytometry measurements for the uncoated, silica-coated, and APTES and COOH functionalized PS40 particles doped with azaBODIPYs 1 and 2 (Figure 6). This plot provides qualitative information on the properties of the particles, such as their size distributions and the presence of secondary particles with high-intensity values. In the histogram plot, three different regions can be identified; the main peak centered at the peak maximum (χm ± 3σ, derived from a Gaussian fit), secondary particles at lower values (<χm − 3σ) and aggregated particles at higher values (>χm + 3σ). For the 1-PS40 particles, a bell-shaped distribution was observed with both secondary particles at lower FSC-H values and aggregated particles at higher FSC-H values. In contrast, the histogram plot of 2-PS40-doped particles showed a slightly left-skewed distribution with secondary particles at lower FSC-H values. A right-skewed distribution was observed upon modification of the doped PS40 particles with silica, APTES and COOH, with the data lacking any hint of smaller secondary particles.

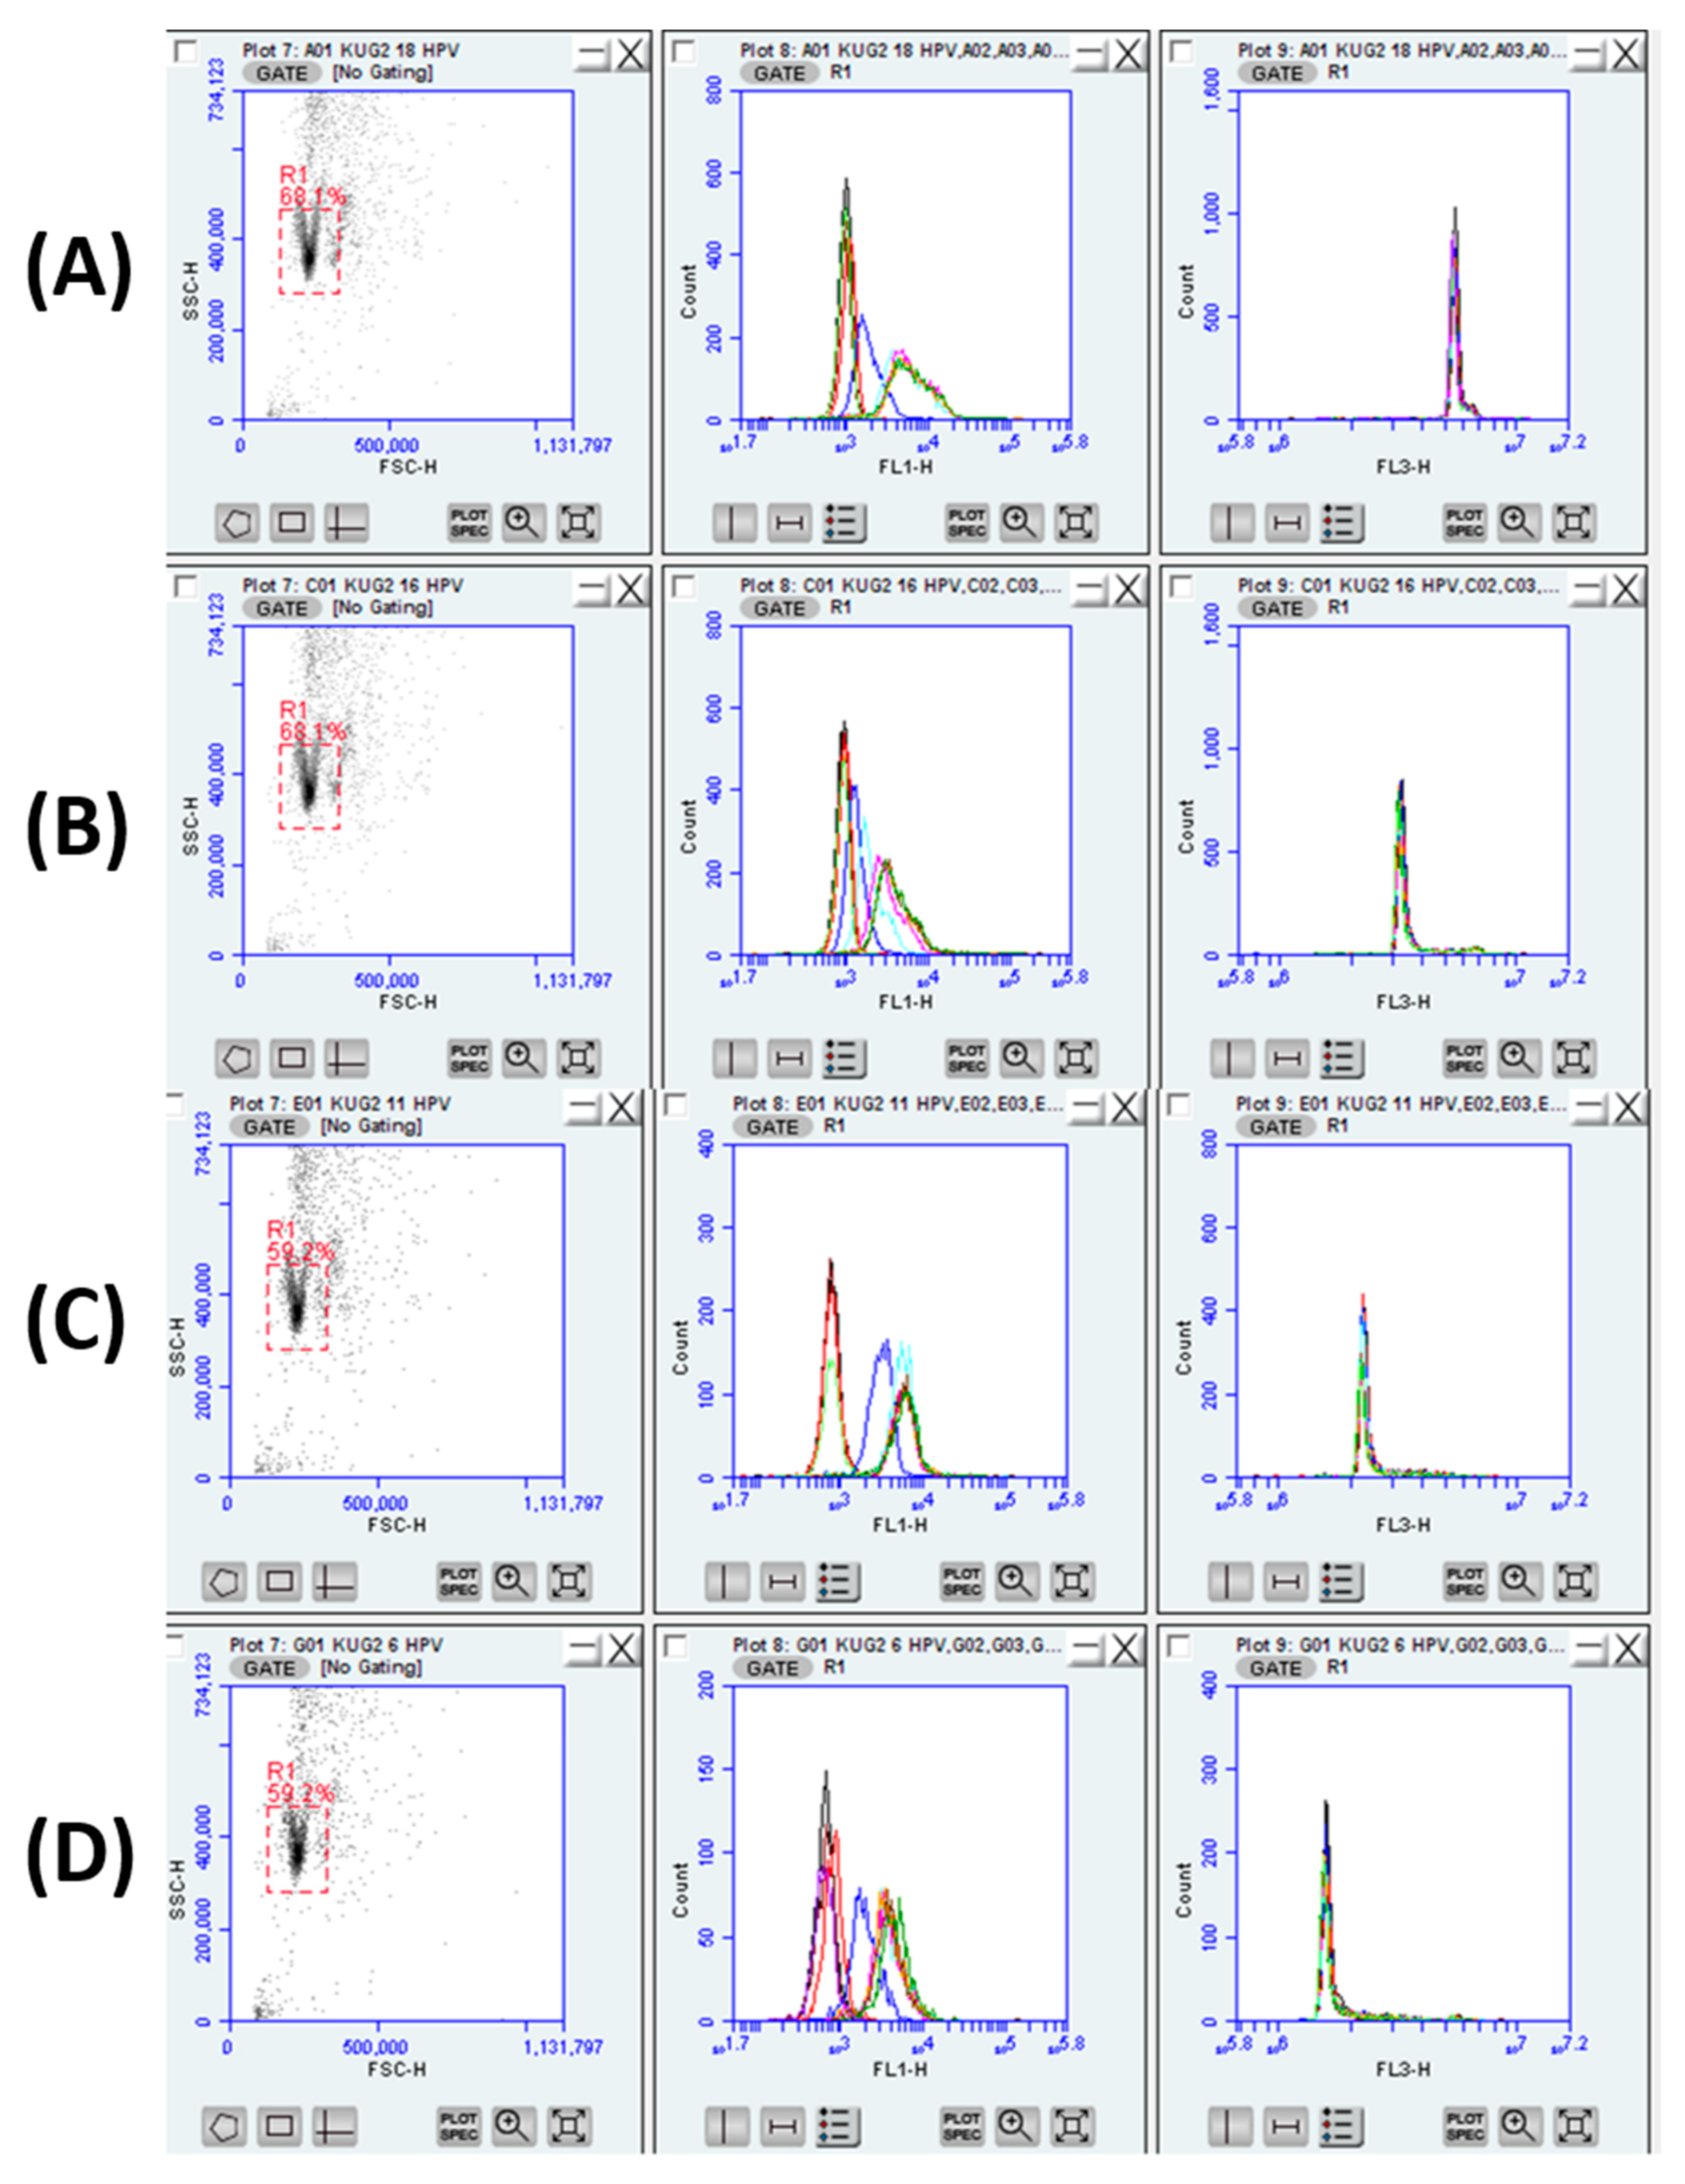
3.3. HPV Detection Using Flow Cytometry

For HPV detection studies, three structurally different dyes were used, and four concentrations of each were prepared. However, problems can be encountered when using dyes as a color code to generate larger library codes, including spectral cross-talk or concentration quenching. In this work, these can be neglected since the dyes were sterically loaded into the PS core by swelling [42,43,44,45]. BODIPY dyes [43,45] are excellent candidates for this application due to their photostability and bright color. In this context, azaBODIPY dyes were applied for the first time following the dye encoding procedure for PVP-stabilized PS cores shown in Scheme 2. The following concentrations were prepared: C1 = 14 mM, C2 = 7 mM, C3 = 3.5 mM and C4 = 1.75 mM in THF. All particle population distributions are well resolved in the fluorescence histogram plots (FL1-H and FL3-H and/or FL4-H) and the correlation plot between FL1-H and FL3-H (Figure 7). Figure 7, Figure 8 and Figure 9 show a dot and histogram plot for the doped (D-PS40) and the COOH functionalized (COOH-D-PS40) particles. 1 and 2 emit red fluorescence at 672 ± 13 and 731 ± 14 nm, respectively, at excitation wavelengths of 650 and 700 nm. This matches the optical layout of the conventional benchtop cytometer that was used (Figure 1). As shown in Table S2 in the Supplementary Material, the D-PS40 lost some of the dye they were coded with initially. The red boxes inside the dot plots highlight the location of the doped PS40 particles before the formation of the silica shell (Figure 7A).
The flow cytometry was measured after each step during the synthesis and modification of the doped PS40 silica-coated particles to monitor the separation in the fluorescence of the four different concentrations prepared for each dye. Figure 8 and Figure 9 show the results obtained for all the dyes after doping and functionalization with the COOH groups of the PS40 particles. As shown in Figure 8 and Figure 9, both the doping and COOH steps of the particles doped with 1 resulted in an acceptable separation of the concentrations from highest to lowest with both layers and as expected, the fluorescence increased with dye concentration (Figure 8A and Figure 9A). The highest and the lowest concentrations were well separated upon doping with 2, but the middle two concentrations were not (Figure 8B and Figure 9B). These results could be due to the leaching out of 2 during the reaction and/or washing stage.

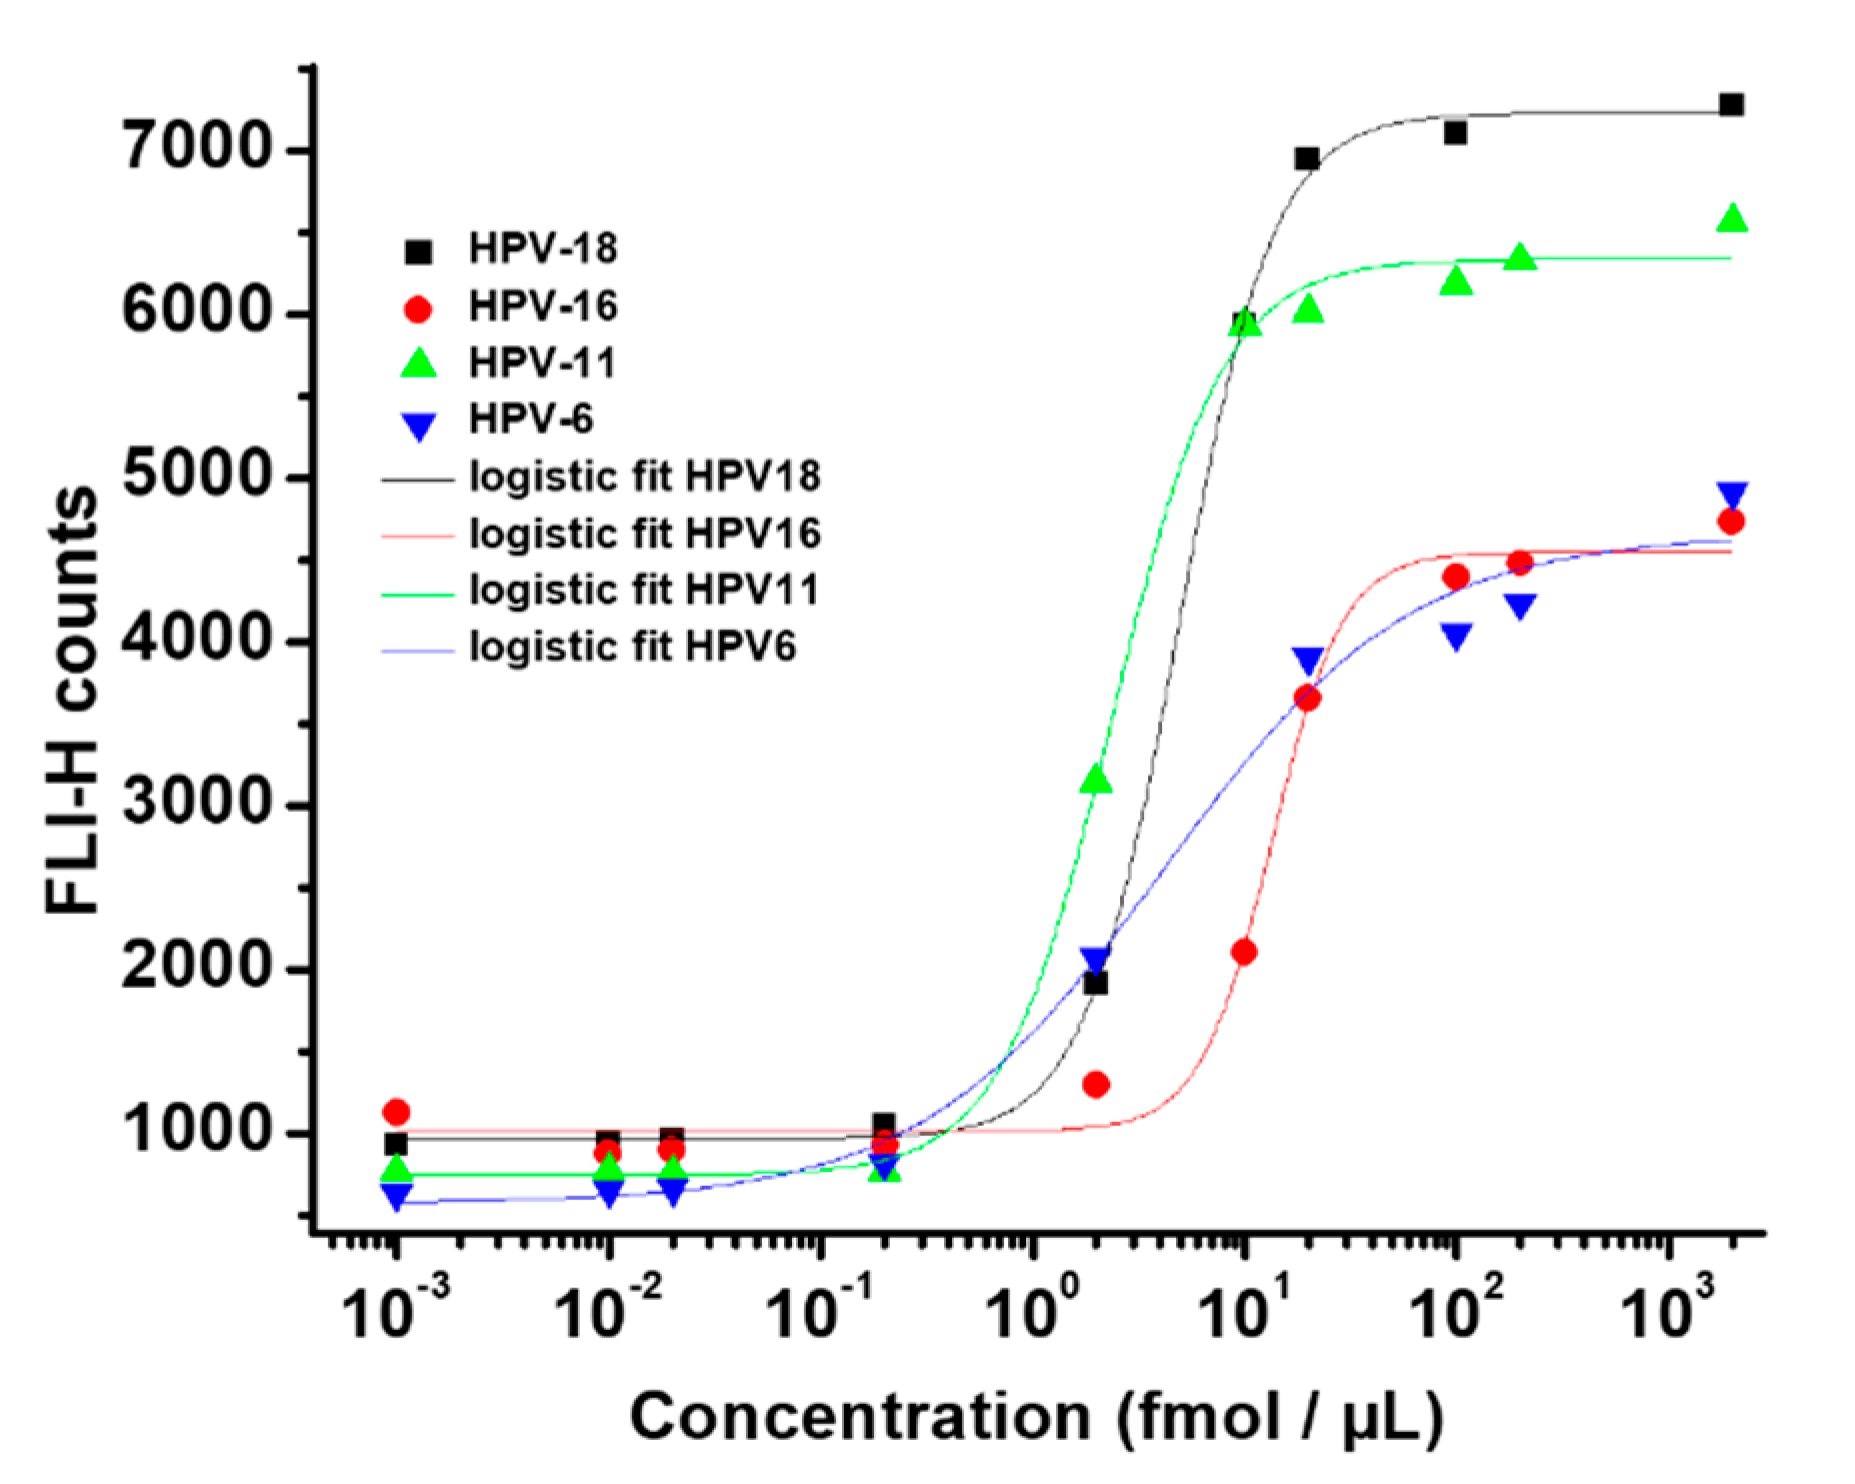
3.4. Hybridization Assays

The hybridization assays were performed using different strands of c-DNA. HPV18, HPV16, HPV11 and HPV6 were attached to the particles through EDC-mediated coupling. A c-DNA with an amino group at the 5′-position was covalently bound to COOH-D-PS40, where D represents azaBODIPYs 1 and 2. The c-DNA-D-PS40 was hybridized with the corresponding t-DNA complementary strand, and the suspension of c-DNA-D-PS40 was then measured on the cytometer. To prepare for the hybridization and multiplex assay experiments, the PS40 particles doped with C1, C2, C3 and C4 concentrations of azaBODIPYs 1 and 2 were covalently linked with HPV18, HPV16, HPV11 and HPV6 DNA strands, respectively (Table 3). Each concentration contained a different c-DNA strands that were mixed with the corresponding t-DNA. Nine different concentrations of the t-DNA were prepared, and upon mixing with c-DNA-D-PS40 particles, the fluorescence properties of the particles were measured in flow cytometry. The results obtained are presented in Figure 10 and Figure S5 in the Supplementary Material, with c-DNA-1-PS40 provided as an example. The fluorescence measured in the FL1-H channel corresponding to the 6-carboxyfluorescein (FAM) labeled, complementary t-DNA strand increased with the concentration of t-DNA added to each c-DNA-D-PS40 particle. As expected, only one signal was observed in the FL3-H channel during this titration, this channel identifying the c-DNA sequence through the unique dye and concentration that have been used for doping the PS40 core. The data in Figure 10 and Figure S5 were used to plot the calibration curves presented in Figure 11 and Figure 12.
The sensitivities of the model assays using D-PS40 particles were compared to those of existing techniques by determining the limit of detection (LOD) values. For example, Horejsh et al. derived the LOD value as the background signal plus 10σ and found values of ca. 30 fmol for a molecular beacon-based, amplification-free direct binding assay without washing [46]. On the other hand, Thiollet et al. used quantum-dot encoded microspheres and determined similar detection limits but had to perform several washing steps after hybridization [47]. Sarma et al. [11] reported an LOD of < 1 fmol, i.e., ca. 0.1–0.2 fmol without extra washing. In addition to quantifying the LOD, logistic regression can be used to determine the limit of quantification (LOQ) and define the linear range to adequately describe the hybridization assay performance of the materials.
In this study, a logistic function was used to fit the data and to obtain the linear range (EC20 to EC80) and the limit of quantification (LOQ, EC20). The data obtained for the 1:1 assays in this study are summarized in Table 4, and the calibration curves are shown in Figure 11 and Figure 12. c-DNA16-1-PS40, c-DNA18-1-PS40, c-DNA6-2-PS40 and c-DNA16-2-PS40 had LOD values > 5 fmol µL−1, while values < 1 fmol µL−1 were obtained for c-DNA11-1-PS40, c-DNA6-1-PS40, c-DNA18-2-PS40 and c-DNA11-2-PS40. Therefore, both types of particles exhibit very high sensitivity towards the detection of c-DNA11. These LOD values are slightly higher than what has been reported previously for other similar systems mentioned above. In comparison to the ELISA and microarray assay, however, which have LODs ranging from 1 pg/mL to 10 nm/mL [18,48,49,50,51], SAT-based assays exhibit higher sensitivity with LOD values in the 0.1−5 fmol µL−1 range and lower [11,12,14].
The LOQ values were also relatively low for c-DNA18-1-PS40, c-DNA11-1-PS40, c-DNA18-2-PS40 and c-DNA11-2-PS40. On the other hand, the detection ranges (represented as the linear range in Table 4) of the assays were determined to lie between 0.99−23 fmol µL−1, a relatively narrow range. This could have a beneficial impact if the measurements are carried out at lower concentrations.

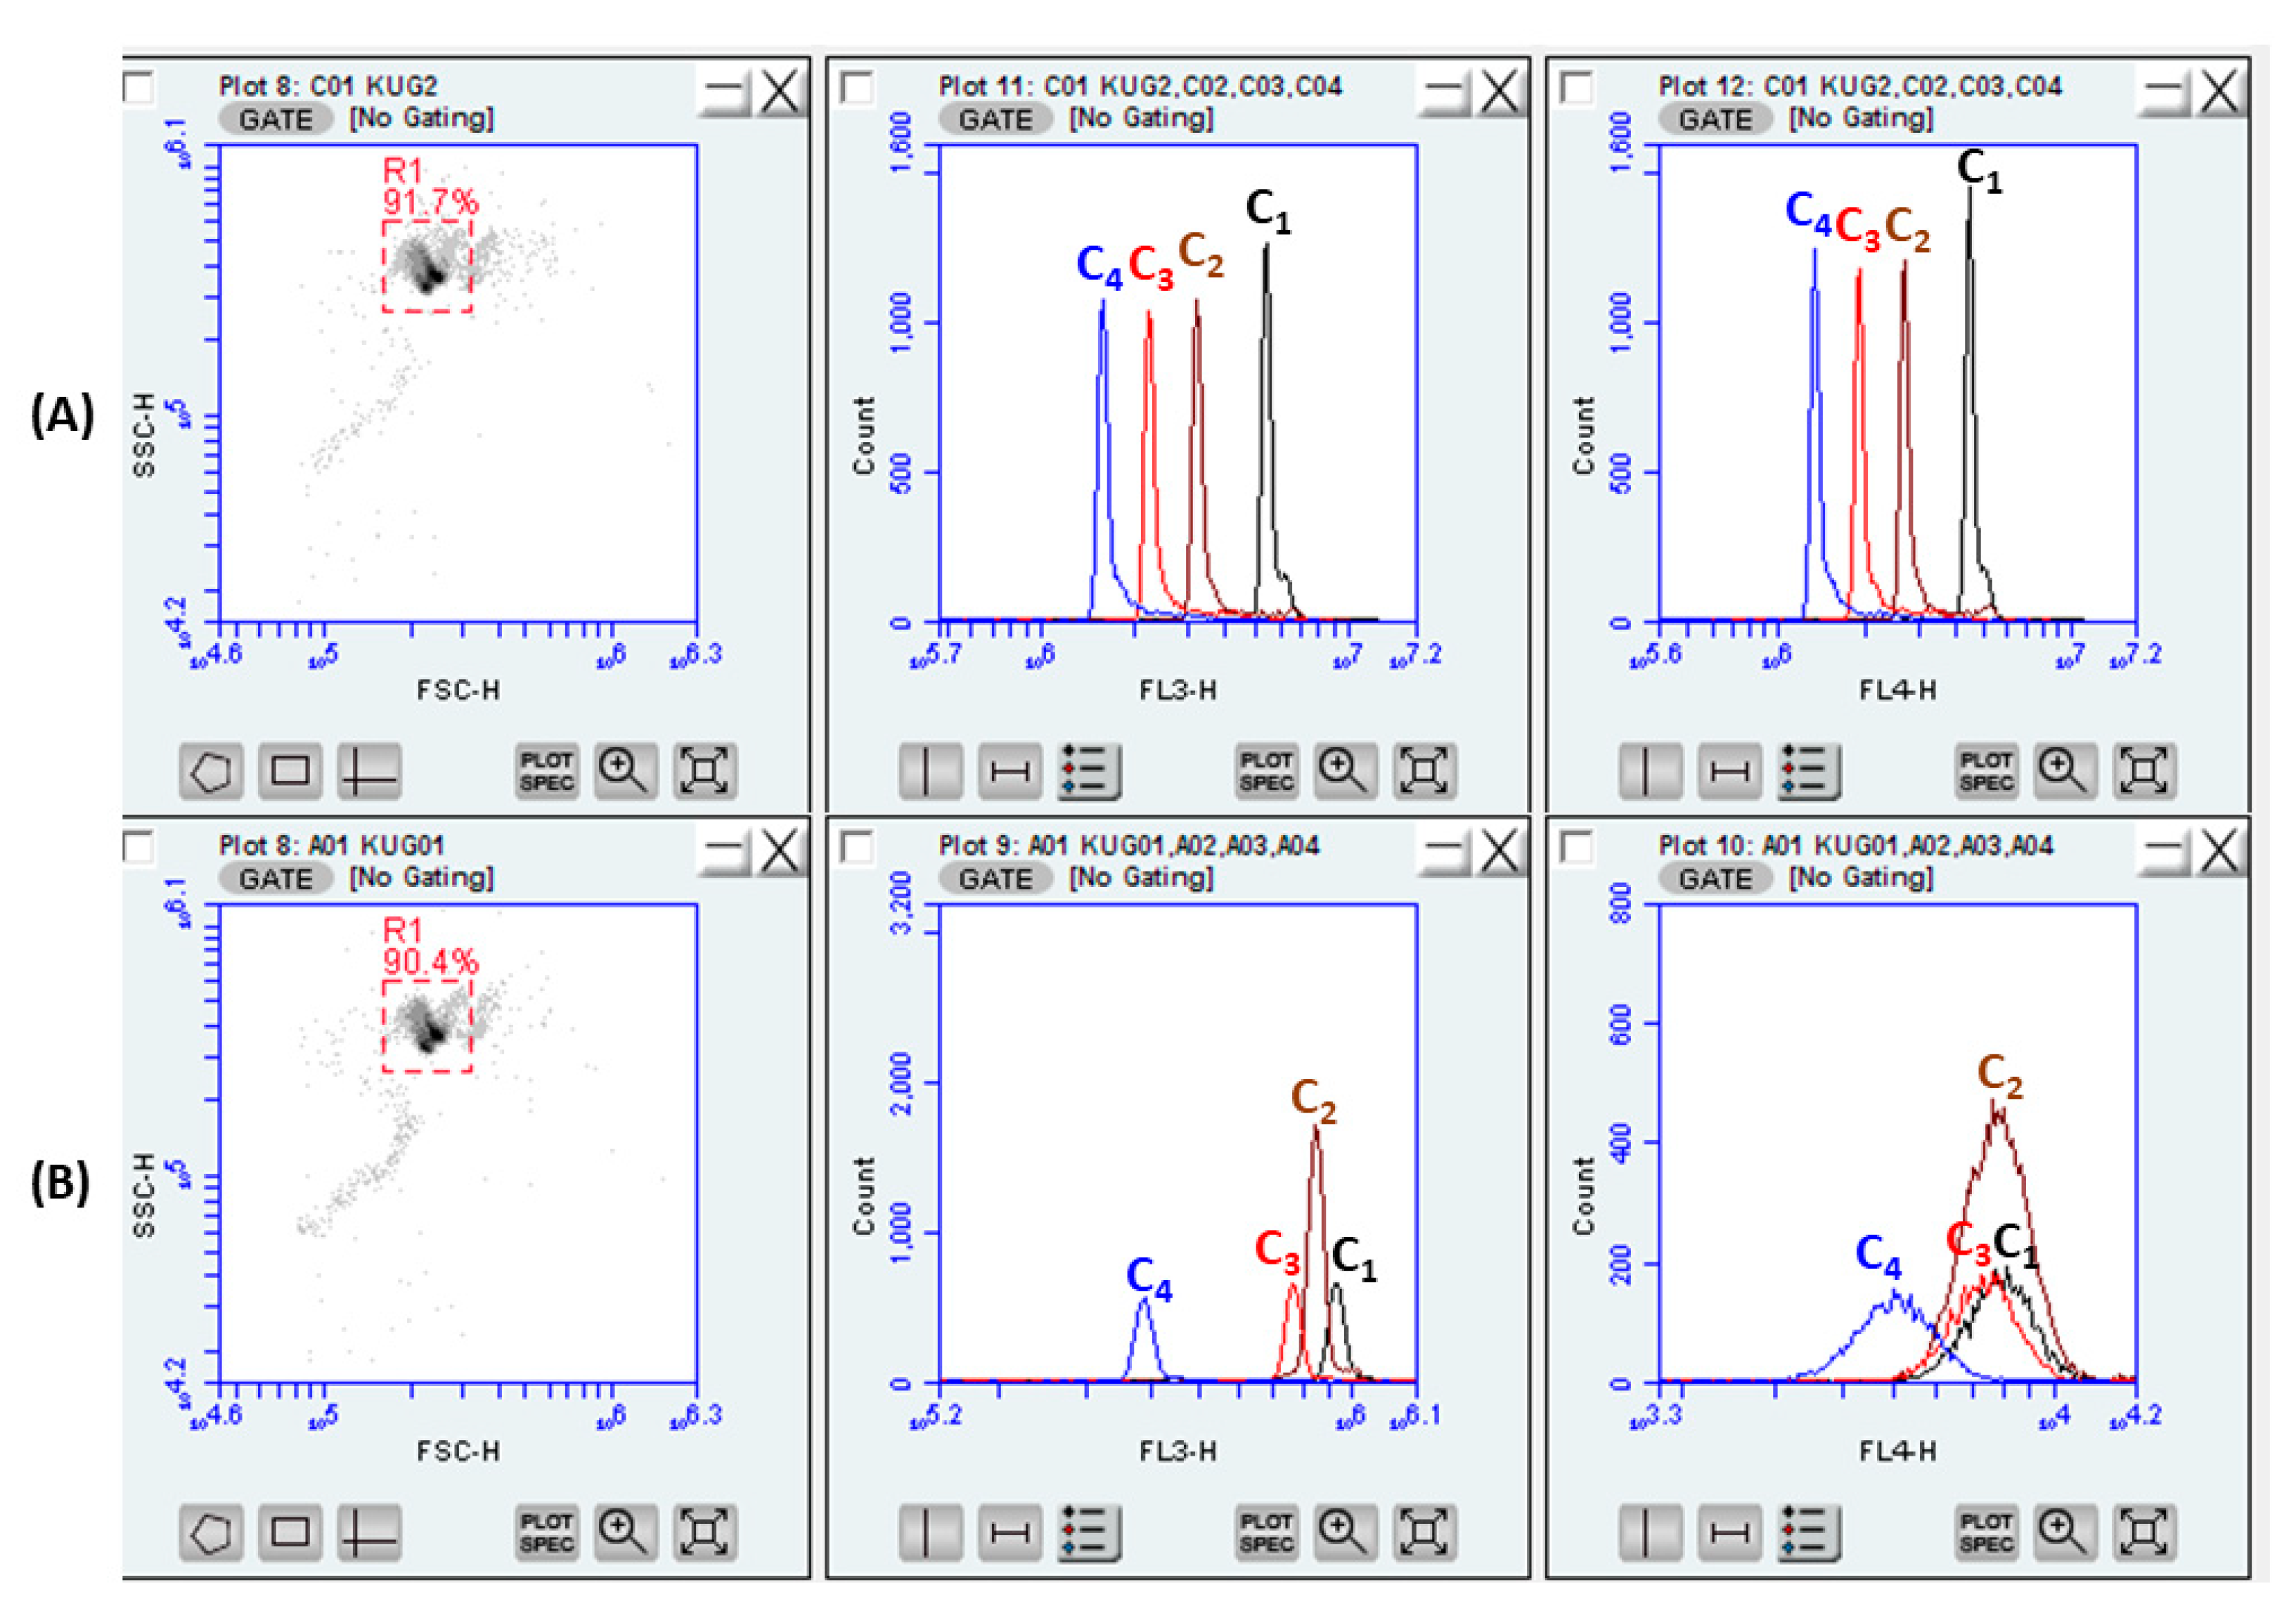
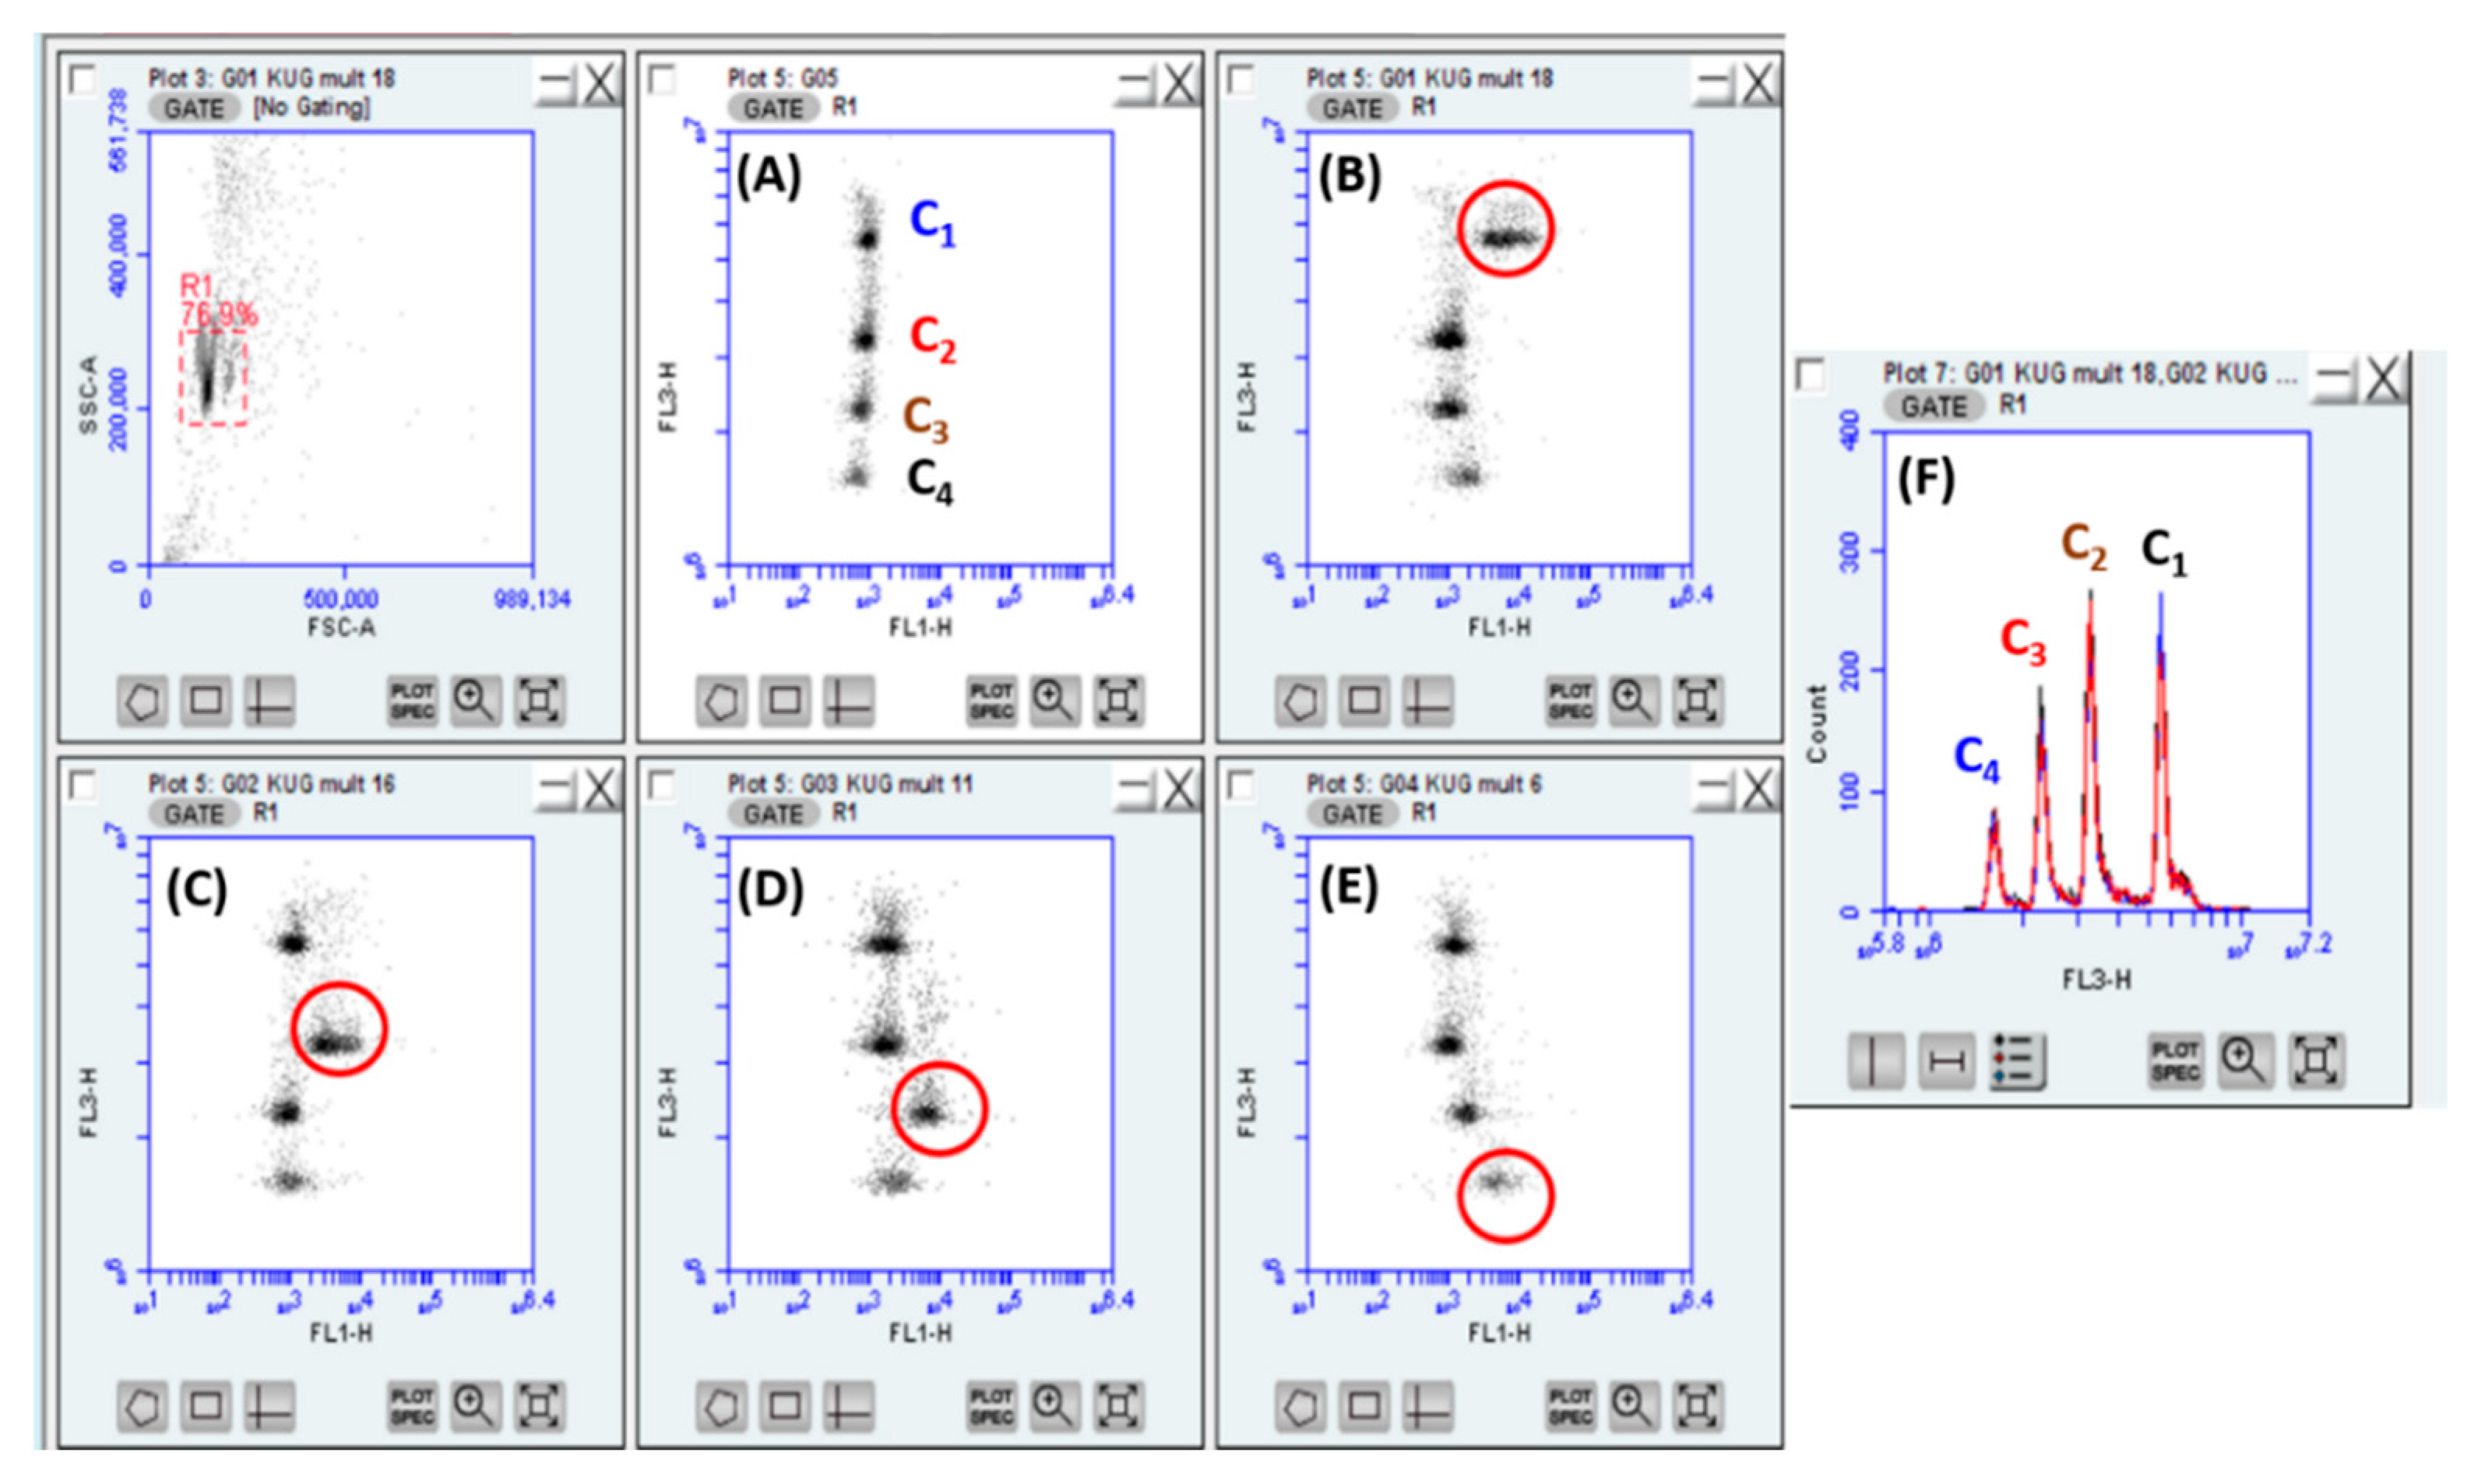
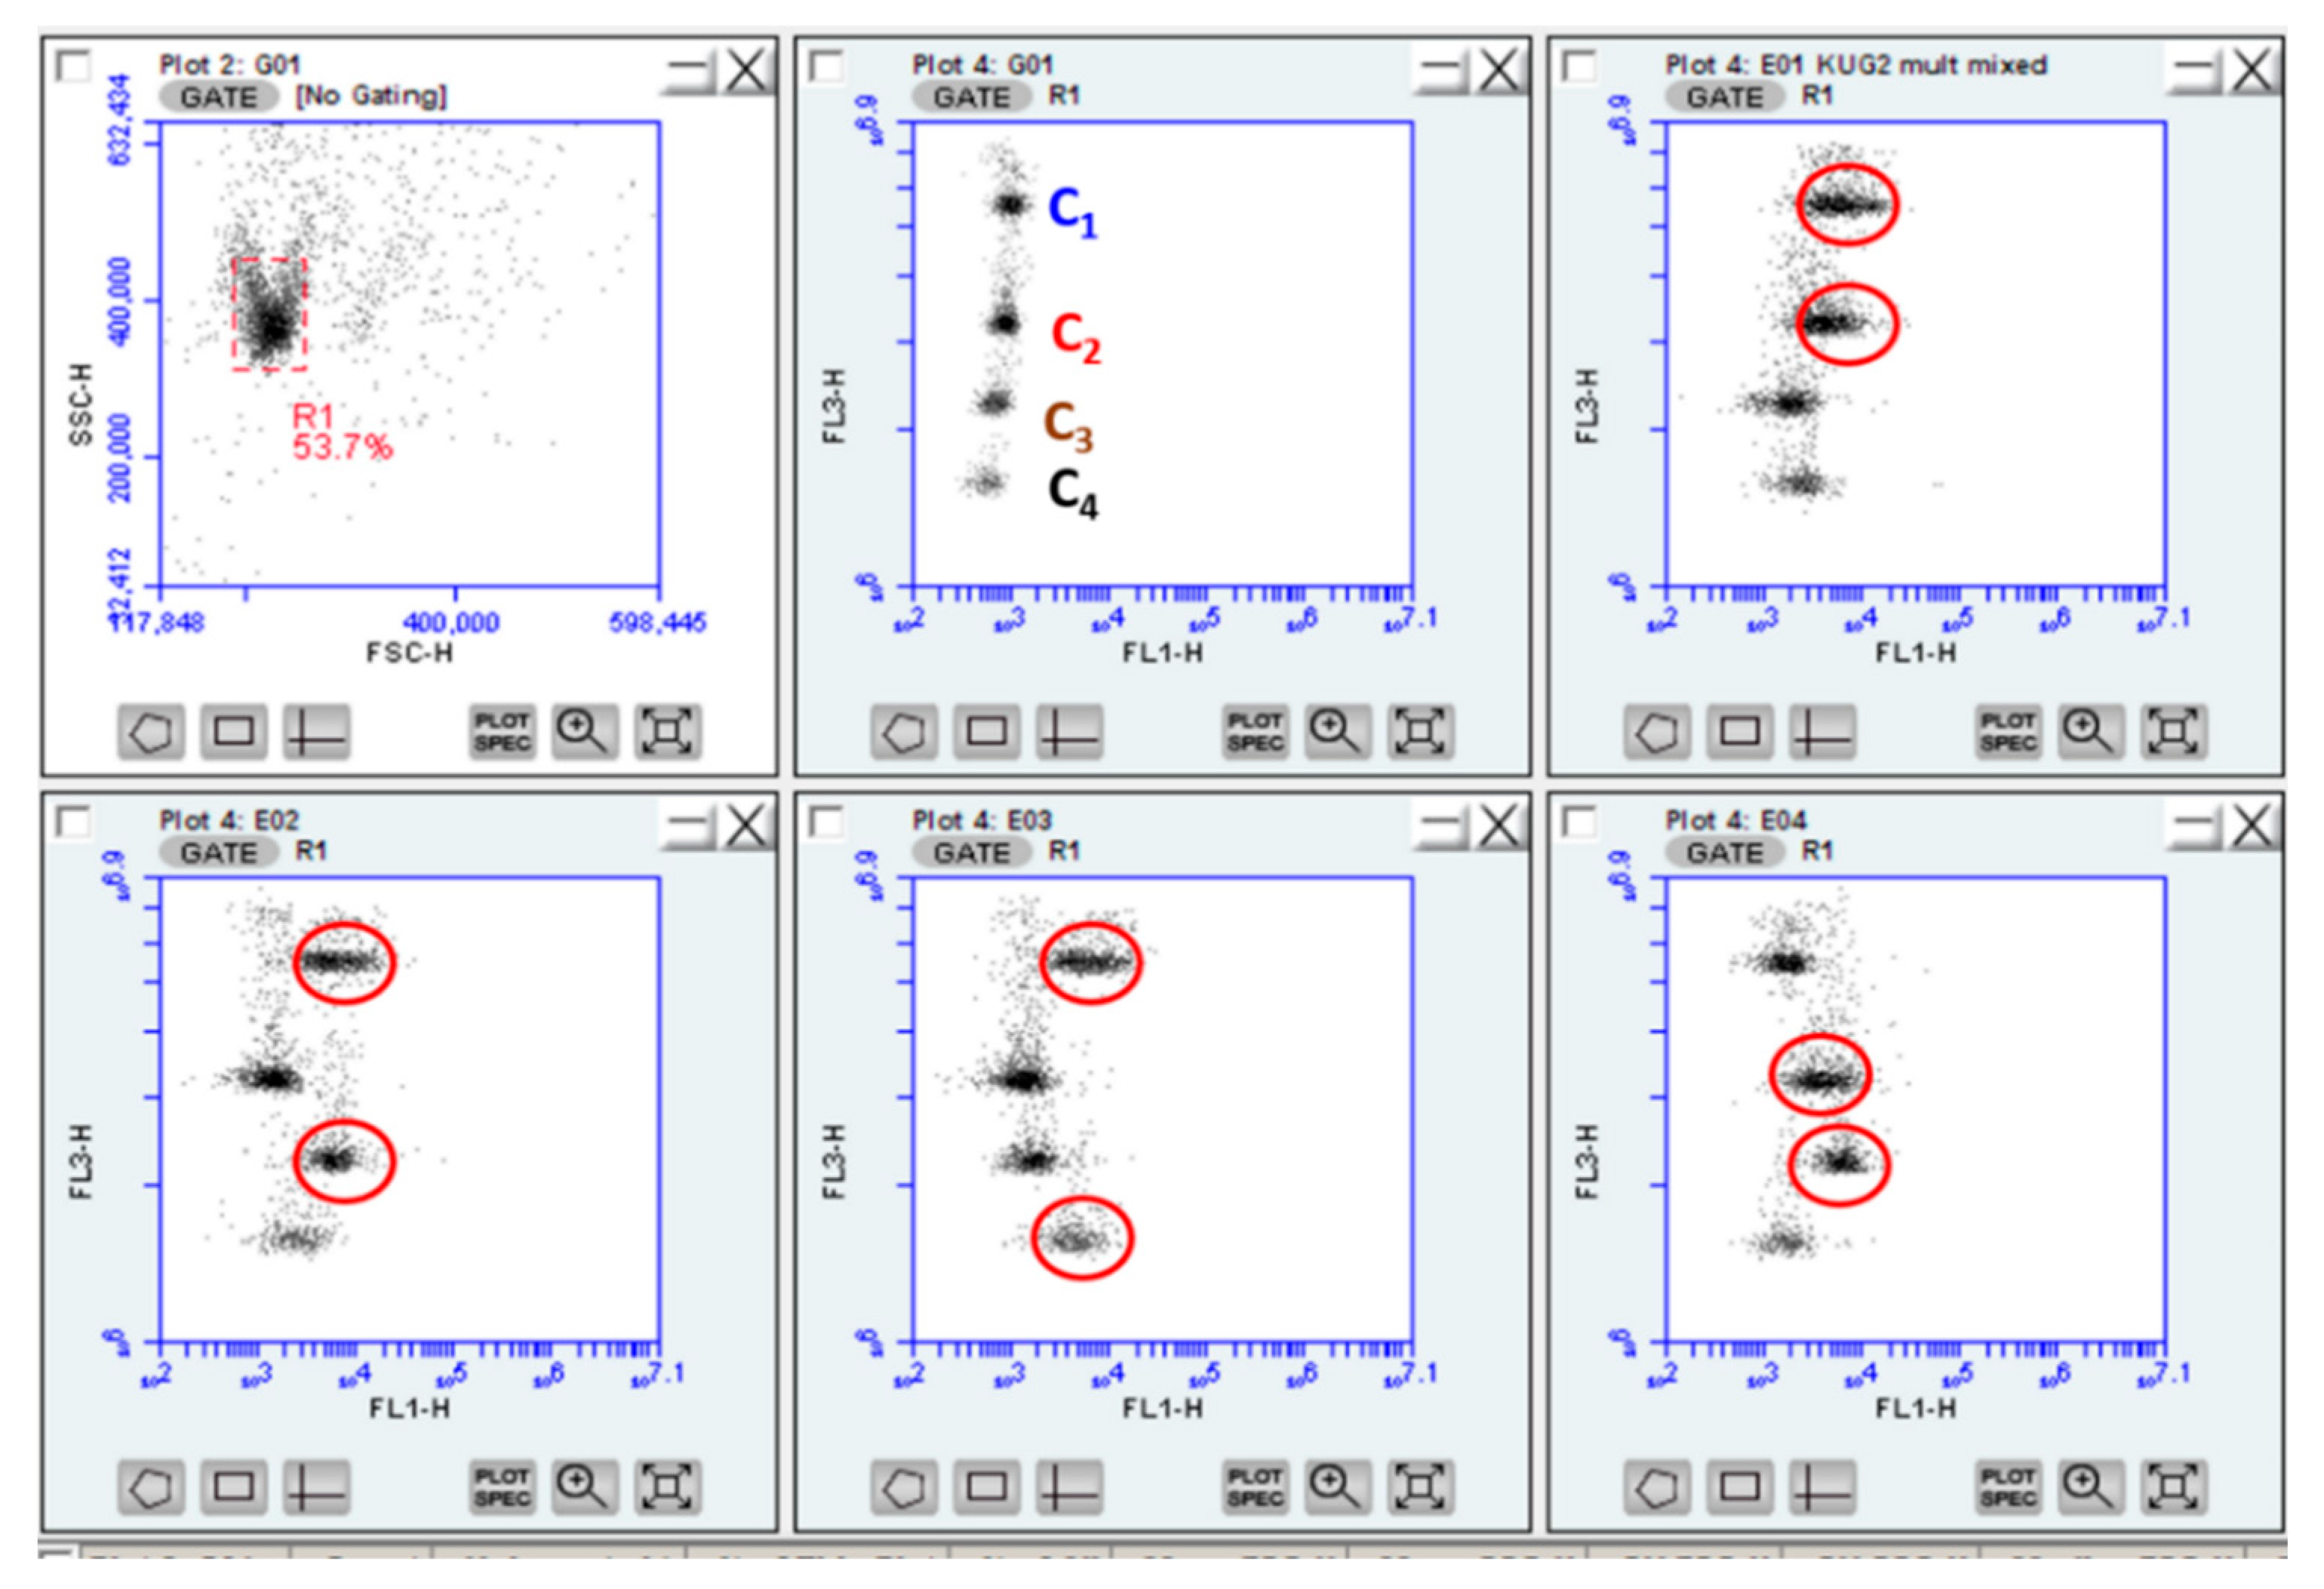
3.5. Multiplexed Assays

After optimizing the parameters of each assay separately in a nonmultiplexed format, the assays were multiplexed by preparing several particles containing different DNA strands. For these assays, the main focus was on c-DNA-1-P40 because it had met the requirement of having a fluorescence signal that lies in a different region than that of the 6-FAM marker that was used to label the t-DNA with peaks for the different concentrations that are well separated. The monodispersity was maintained after the incorporation of all the dye concentrations, as shown by the dot plots presented in Figure 9, Figure 10, Figure 13 and Figure 14. Since the c-DNA-1-PS40 particles contain four different concentrations, four batches are present in the FL3-H fluorescence channel (Figure 13F). The 4:1 assay presented in Figure 13 shows the fluorescence of the particles plotted against the green fluorescence (FL1-H) corresponding to the complementary c-DNA used in a dot plot for the four batches.
The first experiment that was performed involved a 4:1 assay format, in which a mixture of the four types of particles containing the four different c-DNA strands for the determination of different HPV species was mixed in a solution containing only one type of t-DNA strand. Figure 13B shows the mixture for the incubation of particles only in the presence of HPV18 t-DNA (encoded with the highest dye concentration). Figure 13C–E shows similar experiments in the presence of only HPV16, HPV11 and HPV6, respectively. An increase in the signal of FL1 was only observed for the coded particles corresponding to the complementary c-DNA used. This demonstrates that a qualitative analysis of the sample is already possible.
In the second experiment, 4:2 and 4:3 assay formats were performed to further investigate the sensitivity and selectivity of the c-DNA-1-PS40 particles. Solutions containing two or three types of t-DNA stands were added to a mixture of the four types of particles containing four different c-DNA strands (Figure 14 and Figure 15). Binding of the functionalized c-DNA in the PS40 particles to the t-DNA enhances the fluorescence (FL1-H). The c-DNA-1-PS40 particle still shows high sensitivity and selectivity to the two types of t-DNA that are added. However, when three strands were added, the sensitivity was lost in some cases, possibly due to human error. On the other hand, the multiplex assay experiments on the c-DNA-2-PS40 were unsuccessful (Figure S6 in the Supplementary Material). There was no clear separation in the fluorescence of the particles in the flow cytometry in both FL3-H and FL4-H channels. This was attributed to the loss of some dye in c-DNA18-2-PS40, c-DNA16-2-PS40 and c-DNA11-2-PS40 during the washing stages. This could be optimized by using dye concentrations that would ensure a better separation on the cytometry even after the washing stages. Low concentrations would be recommended in this context.

4. Conclusions

The PS40 particles were successfully doped with four different concentrations of azaBODIPYs 1 and 2 for use in multiplex assays and were subsequently coated with silica and further functionalized with APTES and then COOH-groups. Flow cytometry, SEM and TEM were used to prove the formation of the D-PS40, Si-D-PS40, NH2-D-PS40, COOH-D-PS40 and c-DNA-D-PS40 particles. The ninhydrin test was used to determine that the concentration of the NH2 groups in the 10−5 M g−1 range. There was a clear separation in the fluorescence of the four different concentrations of 1-PS40 measured in the FL3-H and FL4-H fluorescence channels. The FL3-H fluorescence channel gave the best results and was used to study 1:1 hybridization and multiplexed assays. The c-DNA-1-PS40 and c-DNA-2-PS40 particles showed low LOD and LOQ values for HPV11, and a narrow detection range was obtained. The multiplexed assay experiments were successfully performed on c-DNA-1-PS40 particles, and the results proved that these particles could potentially be used as a tool for multiplexing assays, thus, they merit further in-depth study in this context.

Supplementary Materials

The following supporting information can be downloaded at: https://www.mdpi.com/article/10.3390/chemosensors11010001/s1, Figure S1: 600 MHz 1H NMR spectrum of azaBODIPY 1 in CDCl3; Figure S2: Normalized absorption spectra and emission spectra of azaBODIPYs 1 and 2 in EtOH; Figure S3: Emission spectra of Blank, 1-PS40 and 2-PS40 with excitation wavelengths at 650 and 700 nm in EtOH, respectively; Figure S4: (A) UV-visible absorption spectra and a calibration curve for pentylamine at 580 nm, and (B) absorption spectra of particles functionalized with amino groups (APTES) in the presence of a ninhydrin solution in EtOH; Figure S5: Flow cytometry measurements for the 1:1 hybridization assay of complementary FAM-labeled t-DNA towards the C1-C4 concentrations of (A) c-DNA18-2-PS40, (B) c-DNA16-2-PS40, (C) c-DNA11-2-PS40 and (D) c-DNA6-2-PS40 particles at nine different concentrations of the strand complementary to the target, showing dot plots (left) and the fluorescence measured in the FL1-H (middle) and FL3-H (right) channels; Figure S6: Flow cytometry measurements of the 4:1 multiplex assay using DNA-2-PS40. (A–D) The assay response in the presence of the HPV18, HPV16, HPV11 and HPV6 t-DNA strands, respectively. (E) The assay response to the particles free of HPV t-DNA strands; Table S1: Photophysical properties of 1 and 2 in different solvents; Table S2: Absorption and concentration of COOH functionalized Si-PS40 particles. The dye concentration in the particles was also determined using the Beer–Lambert law in EtOH.

Author Contributions

Conceptualization, G.K., E.C. and K.R.; formal analysis, G.K. and E.C.; investigation, G.K., E.C. and C.T.; resources, K.R., J.M. and T.N.; data curation, G.K. and J.M.; writing—original draft preparation, G.K.; writing—review and editing, G.K., E.C., C.T., K.R., J.M. and T.N.; visualization, G.K. and E.C.; supervision, J.M., K.R. and T.N.; project administration, K.R. and J.M.; funding acquisition, J.M., K.R. and T.N. All authors have read and agreed to the published version of the manuscript.

Funding

This research was funded by The Department of Science and Technology (DST) and National Research Foundation (NRF) of South Africa through DST/NRF South African Research Chairs Initiative for Professor of Medicinal Chemistry and Nanotechnology to T.N. (uid: 62620), CSUR, and ISRR grants from the NRF of South Africa to J.M. (uids: 93627 and 119259), a Focus Area Analytical Sciences grant from BAM/BMWK to K.R. (TF-20, MamaLoCA), an Individual Research Grant from German Research Foundation (DFG) to E.C. (CL 761/1-1), and a DAAD-NRF in-country doctoral scholarship to G.K. (uid: 101816) is gratefully acknowledged.

Data Availability Statement

Not applicable.

Acknowledgments

Experimental support by K. Gawlitza, M. Grüneberg and S. Benemann (all BAM) regarding TEM, TGA and SEM measurements, respectively, is gratefully acknowledged.

Conflicts of Interest

The authors declare no conflict of interest.

References

  1. Sameiro, M.; Goncalves, T. Fluorescent Labeling of Biomolecules with Organic Probes. Chem. Rev. 2009, 109, 190–212. [Google Scholar] [CrossRef]
  2. Kramer, J.; Kang, R.; Grimm, L.M.; De Cola, L.; Picchetti, P.; Biedermann, F. Molecular Probes, Chemosensors, and Nanosensors for Optical Detection of Biorelevant Molecules and Ions in Aqueous Media and Biofluids. Chem. Rev. 2022, 122, 3459–3636. [Google Scholar] [CrossRef] [PubMed]
  3. Resch-Genger, U.; Grabolle, M.; Cavaliere-Jaricot, S.; Nitschke, R.; Nann, T. Quantum dots versus organic dyes as fluorescent labels. Nat. Methods 2008, 5, 763–775. [Google Scholar] [CrossRef] [PubMed]
  4. Jensen, E.C. Use of fluorescent probes: Their effect on cell biology and limitations. Anat. Rec. 2012, 295, 2031–2036. [Google Scholar] [CrossRef] [PubMed]
  5. Vogel, R.; Surawski, P.P.T.; Littleton, B.N.; Miller, C.R.; Lawrie, G.A.; Battersby, B.J.; Trau, M. Fluorescent organosilica micro- and nanoparticles with controllable size. J. Colloid Interface Sci. 2007, 310, 144–150. [Google Scholar] [CrossRef]
  6. Borisov, S.M.; Mayr, T.; Mistlberger, G.; Klimant, I. Dye-Doped Polymeric Particles for Sensing and Imaging. In Advanced Fluorescence Reporters in Chemistry and Biology II: Molecular Constructions, Polymers and Nanoparticles; Demchenko, A.P., Ed.; Springer: Heidelberg, Germany, 2010; pp. 193–228. [Google Scholar] [CrossRef]
  7. Gubala, V.; Giovannini, G.; Kunc, F.; Monopoli, M.P.; Moore, C.J. Dye-doped silica nanoparticles: Synthesis, surface chemistry and bioapplications. Cancer Nanotechnol. 2020, 11, 1. [Google Scholar] [CrossRef]
  8. Visaveliya, N.R.; Köhler, J.M. Softness Meets with Brightness: Dye-Doped Multifunctional Fluorescent Polymer Particles via Microfluidics for Labeling. Adv. Opt. Mater. 2021, 9, 2002219. [Google Scholar] [CrossRef]
  9. Djoba Siawaya, J.F.; Roberts, T.; Babb, C.; Black, G.; Golakai, H.J.; Stanley, K.; Bapela, N.B.; Hoal, E.; Parida, S.; Van Helden, P. An evaluation of commercial fluorescent bead-based luminex cytokine assays. PLoS ONE 2008, 3, e2535. [Google Scholar] [CrossRef] [Green Version]
  10. Spiro, A.; Lowe, M.; Brown, D. A bead-based method for multiplexed identification and quantitation of DNA sequences using flow cytometry. Appl. Environ. Microbiol. 2000, 66, 4258–4265. [Google Scholar] [CrossRef]
  11. Sarma, D.; Gawlitza, K.; Rurack, K. Polystyrene Core–Silica Shell Particles with Defined Nanoarchitectures as a Versatile Platform for Suspension Array Technology. Langmuir 2016, 32, 3717–3727. [Google Scholar] [CrossRef]
  12. Sarma, D.; Carl, P.; Climent, E.; Schneider, R.J.; Rurack, K. Multifunctional polystyrene core/silica shell microparticles with antifouling properties for bead-based multiplexed and quantitative analysis. ACS Appl. Mater. Interfaces 2018, 11, 1321–1334. [Google Scholar] [CrossRef] [PubMed] [Green Version]
  13. Hiruta, Y.; Nemoto, R.; Kanazawa, H. Design and synthesis of temperature-responsive polymer/silica hybrid nanoparticles and application to thermally controlled cellular uptake. Colloids Surfaces B 2017, 153, 2–9. [Google Scholar] [CrossRef] [PubMed]
  14. Tobias, C.; Climent, E.; Gawlitza, K.; Rurack, K. Polystyrene microparticles with convergently grown mesoporous silica shells as a promising tool for multiplexed bioanalytical assays. ACS Appl. Mater. Interfaces 2021, 13, 207–218. [Google Scholar] [CrossRef] [PubMed]
  15. Schmitt, M.; Bravo, I.; Snijders, P.J.; Gissmann, L.; Pawlita, M.; Waterboer, T. Bead-based multiplex genotyping of human papillomaviruses. J. Clin. Microbiol. 2006, 44, 504–512. [Google Scholar] [CrossRef] [PubMed] [Green Version]
  16. Loudet, A.; Burgess, K. BODIPY dyes and their derivatives: Syntheses and spectroscopic properties. Chem. Rev. 2007, 107, 4891–4932. [Google Scholar] [CrossRef]
  17. Liu, J.; Sun, L.; Zhan, H.; Fan, L.-F. Preparation of Fluorescence-Encoded Microspheres Based on Hydrophobic Conjugated Polymer–Dye Combination and the Immunoassay. ACS Appl. Bio Mater. 2019, 2, 3009–3018. [Google Scholar] [CrossRef]
  18. Elshal, M.F.; McCoy, J.P. Multiplex bead array assays: Performance evaluation and comparison of sensitivity to ELISA. Methods 2006, 38, 317–323. [Google Scholar] [CrossRef] [Green Version]
  19. Birtwell, S.; Morgan, H. Microparticle encoding technologies for high-throughput multiplexed suspension assays. Integr. Biol. 2009, 1, 345–362. [Google Scholar] [CrossRef]
  20. Nolan, J.P.; Sklar, L.A. Suspension array technology: Evolution of the flat-array paradigm. Trends Biotechnol. 2002, 20, 9–12. [Google Scholar] [CrossRef]
  21. Harich, R.; Roger, C.; Garnier, L.; Bienvenu, J.; Fabien, N. Comparison of anti-CCP autoantibodies measurement by ELISA and a bead-based assay in a large patient cohort. Clin. Biochem. 2014, 47, 485–488. [Google Scholar] [CrossRef]
  22. Fulton, R.J.; McDade, R.L.; Smith, P.L.; Kienker, L.J.; Kettman, J.R. Advanced multiplexed analysis with the FlowMetrixTM system. Clin. Chem. 1997, 43, 1749–1756. [Google Scholar] [CrossRef] [PubMed] [Green Version]
  23. Dannhardt, G.; Kiefer, W.; Krämer, G.; Maehrlein, S.; Nowe, U.; Fiebich, B. The pyrrole moiety as a template for COX-1/COX-2 inhibitors. Eur. J. Med. Chem. 2000, 35, 499–510. [Google Scholar] [CrossRef] [PubMed]
  24. Peseke, K.; Götze, L.; Reinke, H.; Cedeño, Q.A.; Suarez, J.Q.; Andreu, M.G.; Castro, H.V. A Synthesis of Substituted Tetrahydro-2-pyranols. J. Prakt. Chem. 1997, 339, 656–659. [Google Scholar] [CrossRef]
  25. Gresser, R.; Hartmann, H.; Wrackmeyer, M.; Leo, K.; Riede, M. Synthesis of thiophene-substituted aza-BODIPYs and their optical and electrochemical properties. Tetrahedron 2011, 67, 7148–7155. [Google Scholar] [CrossRef]
  26. Arroyo, I.J.; Hu, R.; Tang, B.Z.; López, F.I.; Peña-Cabrera, E. 8-Alkenylborondipyrromethene dyes. General synthesis, optical properties, and preliminary study of their reactivity. Tetrahedron 2011, 67, 7244–7250. [Google Scholar] [CrossRef] [Green Version]
  27. Gresser, R.; Hummert, M.; Hartmann, H.; Leo, K.; Riede, M. Synthesis and characterization of near-infrared absorbing benzannulated aza-BODIPY dyes. Chem. Eur. J. 2011, 17, 2939–2947. [Google Scholar] [CrossRef] [PubMed]
  28. Majumdar, P.; Mack, J.; Nyokong, T. Synthesis, characterization and photophysical properties of an acenaphthalene fused-ring-expanded NIR absorbing aza-BODIPY dye. RSC Adv. 2015, 5, 78253–78258. [Google Scholar] [CrossRef]
  29. Gorman, A.; Killoran, J.; O’Shea, C.; Kenna, T.; Gallagher, W.M.; O’Shea, D.F. In vitro demonstration of the heavy-atom effect for photodynamic therapy. J. Am. Chem. Soc. 2004, 126, 10619–10631. [Google Scholar] [CrossRef]
  30. Armbruster, D.A.; Pry, T. Limit of blank, limit of detection and limit of quantitation. Clin. Biochem. Rev. 2008, 29 (Suppl. S1), S49–S52. [Google Scholar]
  31. Soto-Cantu, E.; Cueto, R.; Koch, J.; Russo, P.S. Synthesis and rapid characterization of amine-functionalized silica. Langmuir 2012, 28, 5562–5569. [Google Scholar] [CrossRef]
  32. Hong, J.; Han, H.; Hong, C.K.; Shim, S.E. A direct preparation of silica shell on polystyrene microspheres prepared by dispersion polymerization with polyvinylpyrrolidone. J. Polym. Sci. A 2008, 46, 2884–2890. [Google Scholar] [CrossRef]
  33. Sarma, D.; Mielke, J.; Sahre, M.; Beck, U.; Hodoroaba, V.-D.; Rurack, K. TSEM-based contour analysis as a tool for the quantification of the profile roughness of silica shells on polystyrene core particles. Appl. Surf. Sci. 2017, 426, 446–455. [Google Scholar] [CrossRef]
  34. Lu, H.; Mack, J.; Yang, Y.; Shen, Z. Structural modification strategies for the rational design of Red/NIR region BODIPYs. Chem. Soc. Rev. 2014, 43, 4778–4823. [Google Scholar] [CrossRef] [PubMed] [Green Version]
  35. Lagorio, M.G.; Román, E.S. How does light scattering affect luminescence? Fluorescence spectra and quantum yields in the solid phase. J. Chem. Educ. 2002, 79, 1362–1367. [Google Scholar] [CrossRef]
  36. Castillo-Hair, S.M.; Sexton, J.T.; Landry, B.P.; Olson, E.J.; Igoshin, O.A.; Tabor, J.J. FlowCal: A User-Friendly, Open Source Software Tool for Automatically Converting Flow Cytometry Data from Arbitrary to Calibrated Units. ACS Synth. Biol. 2016, 5, 774–780. [Google Scholar] [CrossRef] [PubMed] [Green Version]
  37. Friedman, M.; Williams, L.D. Stoichiometry of formation of Ruhemann’s purple in the ninhydrin reaction. Bioorg. Chem. 1974, 3, 267–280. [Google Scholar] [CrossRef]
  38. Leng, W.; Chen, M.; Zhou, S.; Wu, L. Capillary force induced formation of monodisperse polystyrene/silica organic− inorganic hybrid hollow spheres. Langmuir 2010, 26, 14271–14275. [Google Scholar] [CrossRef]
  39. Schneider, C.A.; Rasband, W.S.; Eliceiri, K.W. NIH Image to ImageJ: 25 years of image analysis. Nat. Methods 2012, 9, 671–675. [Google Scholar] [CrossRef]
  40. Corrie, S.R.; Lawrie, G.A.; Trau, M. Quantitative analysis and characterization of biofunctionalized fluorescent silica particles. Langmuir 2006, 22, 2731–2737. [Google Scholar] [CrossRef]
  41. Song, X.; Gao, L. Fabrication of hollow hybrid microspheres coated with silica/titania via sol− gel process and enhanced photocatalytic activities. J. Phys. Chem. C 2007, 111, 8180–8187. [Google Scholar] [CrossRef]
  42. Rollié, S.; Sundmacher, K. Determination of cluster composition in heteroaggregation of binary particle systems by flow cytometry. Langmuir 2008, 24, 13348–13358. [Google Scholar] [CrossRef] [PubMed]
  43. Descalzo, A.B.; Xu, H.-J.; Xue, Z.-L.; Hoffmann, K.; Shen, Z.; Weller, M.G.; You, X.-Z.; Rurack, K. Phenanthrene-fused boron− dipyrromethenes as bright long-wavelength fluorophores. Org. Lett. 2008, 10, 1581–1584. [Google Scholar] [CrossRef] [PubMed]
  44. Behnke, T.; Würth, C.; Hoffmann, K.; Hübner, M.; Panne, U.; Resch-Genger, U. Encapsulation of hydrophobic dyes in polystyrene micro-and nanoparticles via swelling procedures. J. Fluoresc. 2011, 21, 937–944. [Google Scholar] [CrossRef]
  45. Wittmershaus, B.P.; Baseler, T.T.; Beaumont, G.T.; Zhang, Y.-Z. Excitation energy transfer from polystyrene to dye in 40-nm diameter microspheres. J. Lumin. 2002, 96, 107–118. [Google Scholar] [CrossRef]
  46. Horejsh, D.; Martini, F.; Poccia, F.; Ippolito, G.; Di Caro, A.; Capobianchi, M.R. A molecular beacon, bead-based assay for the detection of nucleic acids by flow cytometry. Nucleic Acids Res. 2005, 33, e13. [Google Scholar] [CrossRef] [PubMed] [Green Version]
  47. Thiollet, S.; Higson, S.; White, N.; Morgan, S.L. Investigation and development of quantum dot-encoded microsphere bioconjugates for DNA detection by flow cytometry. J. Fluoresc. 2012, 22, 685–697. [Google Scholar] [CrossRef] [PubMed]
  48. AbCam ELISA Kits Specifications. Available online: http://www.abcam.com (accessed on 30 October 2022).
  49. Momenbeitollahi, N.; Cloet, T.; Li, H. Pushing the detection limits: Strategies towards highly sensitive optical-based protein detection. Anal. Bioanal. Chem. 2021, 413, 5995–6011. [Google Scholar] [CrossRef] [PubMed]
  50. Selvarajah, S.; Negm, O.H.; Hamed, M.R.; Tubby, C.; Todd, I.; Tighe, P.J.; Harrison, T.; Fairclough, L.C. Development and validation of protein microarray technology for simultaneous inflammatory mediator detection in human sera. Mediators Inflamm. 2014, 2014, 820304. [Google Scholar] [CrossRef] [Green Version]
  51. Haab, B.B.; Dunham, M.J.; Brown, P.O. Protein microarrays for highly parallel detection and quantitation of specific proteins and antibodies in complex solutions. Genome Biol. 2001, 2, research0004.1. [Google Scholar] [CrossRef]
Scheme 1. Synthesis of azadipyrromethene 1a and azaBODIPY 1.
Chemosensors 11 00001 sch001
Scheme 2. A schematic representation of dye doping and silica coating of the PS40 particles. D = azaBODIPY dyes 1 or 2; and TEOS = tetraethylorthosilicate.
Chemosensors 11 00001 sch002
Scheme 3. Functionalization of Si-D-PS40 particles with APTES, and subsequently with carboxylic acid groups.
Chemosensors 11 00001 sch003
Scheme 4. A schematic representation for the covalent bonding of the c-DNA to the COOH-D-PS40 particles in the first step, and in the second step hybridization with the t-DNA.
Chemosensors 11 00001 sch004
Scheme 5. A schematic representation of the ninhydrin reaction.
Chemosensors 11 00001 sch005
Figure 2. EDX spectra and SEM images of (A) PS40 (left) and (B) azaBODIPY dye-doped and silica-coated PS40 particles (right).
Chemosensors 11 00001 g002
Figure 3. TEM images of doped PS40, silica-coated, and APTES and COOH functionalized PS40 particles.
Chemosensors 11 00001 g003
Figure 4. TEM images of doped PS40 and doped silica-coated PS40 particles showing unmodified and modified surfaces.
Chemosensors 11 00001 g004
Figure 5. TGA profiles of 1-PS40, 1, Si-1-PS40 and NH2-1-PS40 at a heating rate of 20 °C min−1 under a nitrogen atmosphere.
Chemosensors 11 00001 g005
Figure 6. Histogram plots for the single particle flow cytometric analyses of 1-PS40, Si-1-PS40, NH2-1-PS40 and COOH-1-PS40 (top); 2-PS40, Si-2-PS40, NH2-2-PS40 and COOH-2-PS40 (bottom).
Chemosensors 11 00001 g006
Figure 7. (A) Dot plots for the single particle flow cytometric analysis for (left to right) Blank, 1-PS40 and 2-PS40. (B) Fluorescence plots for the (left to right) Blank, 1-PS40 and 2-PS40 analyzed at FL3-H and FL4-H channels, respectively.
Chemosensors 11 00001 g007
Figure 8. Characterization of a single particle flow cytometric analysis of (A) 1-PS40 and (B) 2-PS40 showing dot plots (left) and the separation in the fluorescence of the four different concentrations of each of these dyes in the FL3-H and FL4-H channels (middle and right). The red boxes inside the dot plots highlight the location of the doped PS40 particles before the formation of the silica shell.
Chemosensors 11 00001 g008
Figure 9. Characterization of a single particle flow cytometric analysis of (A) COOH-1-PS40 and (B) COOH-2-PS40, showing dot plots (left) and the separation in the fluorescence of the four different concentrations of each of these dyes in the FL3-H and FL4-H channels (middle and right).
Chemosensors 11 00001 g009
Figure 10. Flow cytometry measurements for the 1:1 hybridization assay of complementary FAM-labeled t-DNA towards the C1-C4 concentrations of (A) c-DNA18-1-PS40, (B) c-DNA16-1-PS40, (C) c-DNA11-1-PS40 and (D) c-DNA6-1-PS40 particles at the nine different concentrations shown in Figure 11 of the strand complementary to the target, showing dot plots (left) and the fluorescence measured in the FL1-H (middle) and FL3-H (right) channels highlighted with a series of different colors.
Chemosensors 11 00001 g010
Figure 11. Calibration curves for the hybridization of complementary FAM-labeled t-DNA towards c-DNA-1-PS40 particles using nine concentrations of the strand complementary to the target. A logistic function was used to fit the data and to extract the linear range (EC20 to EC80) and the limit of quantification (LOQ, EC20).
Chemosensors 11 00001 g011
Figure 12. Calibration curves for the hybridization of complementary FAM-labeled t-DNA towards c-DNA-2-PS40 particles using nine concentrations of the strand complementary to the target. A logistic function was used to fit the data and to extract the linear range (EC20 to EC80) and the limit of quantification (LOQ, EC20).
Chemosensors 11 00001 g012
Figure 13. Flow cytometry measurements of the 4:1 multiplex assay with c-DNA-1-PS40. (A) The assay response to the particles free of HPV t-DNA strands. (BE) The assay response in the presence of the HPV18, HPV16, HPV11 and HPV6 t-DNA strands, respectively. The detected t-DNA is highlighted with a red circle. (F) The signal in the FL3-H fluorescence channel for the c-DNA-1-PS40 particles doped with four different concentrations of 1.
Chemosensors 11 00001 g013
Figure 14. Flow cytometry measurements of the 4:2 multiplex assay with c-DNA-1-PS40. The detected t-DNA is highlighted with a red circle.
Chemosensors 11 00001 g014
Figure 15. Flow cytometry measurements of the 4:2 and 4:3 multiplex assays with c-DNA-1-PS40. The detected t-DNA is highlighted with a red circle.
Chemosensors 11 00001 g015
Table 1. Concentrations of the amino groups on the NH2-D-PS40 particles.
NH2-D-PS40AbsorbanceConc. (mM) Mass (mg)Conc. (mM g−1) (×10−5) 1
NH2-1-PS402.3 × 10−26.0 × 10−216.0
NH2-2-PS401.3 × 10−22.4 × 10−212.4
NH2-B-PS405.3 × 10−32.2 × 10−212.2
1 M/g = number of moles per mass of supporting particles.
Table 2. Statistical analysis of the scattering properties of unmodified and modified PS40 particles.
Mean FSC-H
(×105)
Cν FSC-H
(%)
Mean SSC-H
(×105)
Cν SSC-H (%)
Blank2.277.8 (±0.39)3.4711.8 (±0.59)
Si-1-PS402.498.2 (±0.41)4.3611.5 (±0.58)
Si-2-PS402.3911.8 (±0.59)3.9711.4 (±0.57)
NH2-Blank2.627.4 (±0.37)3.8610.7 (±0.53)
NH2-1-PS402.677.2 (±0.36)3.8910.8 (±0.54)
NH2-2-PS402.786.7 (±0.34)3.8810.9 (±0.55)
Table 3. Details of the hybridization assays with azaBODIPYs 1 and 2.
Concentration of Dye Added (mM)HPV c-DNA Strand AddedName of Material
C1 = 14HPV-18c-DNA18-1-PS40
C2 = 7HPV-16c-DNA16-1-PS40
C3 = 3.5HPV-11c-DNA11-1-PS40
C4 = 1.75HPV-6c-DNA6-1-PS40
C1 = 14HPV-18c-DNA18-2-PS40
C2 = 7HPV-16c-DNA16-2-PS40
C3 = 3.5HPV-11c-DNA11-2-PS40
C4 = 1.75HPV-6c-DNA6-2-PS40
Table 4. LOD values, LOQ values and linear ranges for c-DNA-1-PS40 and c-DNA-2-PS40.
c-DNA-1-PS40HPV18HPV16HPV11HPV6
LOD (fmol µL−1)1.476.640.780.83
LOQ (fmol µL−1)1.097.451.405.41
Linear range (fmol µL−1)2.4−107.8−23.01.0−5.50.66−2.50
c-DNA-2-PS40HPV18HPV16HPV11HPV6
LOD (fmol µL−1)0.225.270.674.72
LOQ (fmol µL−1)3.364.463.149.40
Linear range (fmol µL−1)0.99−9.017.04−17.70.82−2.075.4−13.7
Disclaimer/Publisher’s Note: The statements, opinions and data contained in all publications are solely those of the individual author(s) and contributor(s) and not of MDPI and/or the editor(s). MDPI and/or the editor(s) disclaim responsibility for any injury to people or property resulting from any ideas, methods, instructions or products referred to in the content.

