Article

Enhancing the Performance of Two Different Commercial CO2 Indicators Using Digital Colourimetric Analysis, DCA

School of Chemistry and Chemical Engineering, Queens University Belfast, David Keir Building, Stranmillis Road, Belfast BT95AG, UK
*
Author to whom correspondence should be addressed.
Chemosensors 2022, 10(12), 544; https://doi.org/10.3390/chemosensors10120544
Submission received: 10 October 2022 / Revised: 9 November 2022 / Accepted: 13 December 2022 / Published: 19 December 2022
(This article belongs to the Section Optical Chemical Sensors)

Abstract

:
Two different, commercial colourimetric CO2 indicators are made in the lab, namely one based on an indicator in solution for monitoring the level of dissolved CO2 in an aquarium, i.e., a drop check indicator, and another based on an ink, for monitoring the level of CO2 in breath (capnography), i.e., a correct tracheal placement indicator. The selected commercial indicators are limited currently in terms of the analytical information they provide (qualitative) as they are normally assessed by eye. Thus, in each case, for both the lab-made and commercial indicators, colour photography coupled with digital image analysis, i.e., digital colour analysis (DCA), is used to convert the colour data from the indicator into a quantitative measure of CO2 and so markedly improve the quality of the analytical information provided by original indicator. This is the first time either indicator has been studied as a quantitative analytical system. The CO2 sensitivity of each of the lab-made indicators is found to match well that of its commercial counterpart. A simple program is provided to help non-experts and experts alike to apply DCA in this way. The potential of DCA to enhance the performance of other commercial indicators is discussed briefly.

Graphical Abstract

1. Introduction

Carbon dioxide (CO2) is a chemical of great importance. For example, through photosynthesis, plants convert CO2 into the food and fuel necessary for the continued existence of most known forms of life [1]. Furthermore, since CO2 is a product of aerobic respiration, it is also an indicator of life and, through the decay of organic matter, death [1]. Although there is not much CO2 in the atmosphere (ca. 412 ppmv), the level is rising and, in so doing, creating environmental problems such as global warming and the acidification of the oceans [2,3,4]. CO2 at low concentrations has few, if any, toxicological effects so that the maximum workspace level over an 8 h period is 5000 ppmv, although good workspace air quality is considered to be <1000 ppmv, i.e., <0.1% [2]. Higher concentrations (>5%) cause hypercapnia and respiratory acidosis and concentrations above 10% can cause convulsions, coma, and death [5].
Amongst its industrial applications, CO2 is used as a supercritical solvent in caffeine extraction, an inert gas in fire extinguishers, and a pressurizing gas in oil recovery [6]. In the drinks industry, it is used to make carbonated beverages and in the food industry, it is used in modified atmosphere packaging (MAP) as an active packaging gas, which accounts currently for over 60 billion packages pa. [7].
The measurement of CO2 levels in the gas phase is often carried out using infrared (IR) spectroscopy, based on its absorption spectrum in the region of 4200–4400 nm. However, IR spectroscopy suffers from interference from other gaseous species, requires long path lengths, and uses expensive and often bulky equipment [8]. The measurement of dissolved CO2 is usually carried out using a Severinghaus electrode, which employs a pH electrode in contact with a thin layer of an aqueous sodium bicarbonate (NaHCO3) solution, covered by a plastic film, such as polypropylene, which acts as a gas-permeable membrane, GPM, [9]. The diffusion of CO2 in the test medium through the GPM leads to a pH change in the aqueous bicarbonate solution layer, due to the formation of carbonic acid, which is measured by the pH electrode. Although still widely used, the Severinghaus electrode is relatively expensive, not particularly robust, and prone to electrical interference [1].
In recent years, a number of colour-based, CO2 indicators have emerged as possible inexpensive, disposable alternatives to the analytical methods outlined above [1,6,10,11,12]; however, few have proved commercially viable and those that have are usually assessed by eye and so provide largely qualitative information with regard to the level of CO2. A major barrier to using such indicators for quantitative analysis is the need to measure the absorbance, A, of the film using UV-vis spectrophotometry, which is expensive, bulky, and not conducive to use in the field. However, in a recent paper, we showed that for such simple, two-colour indicators, an apparent absorbance value, A′, can be determined, using just a digital camera and digital image analysis software, which is directly proportional to A [13]. It has been shown that the latter process, referred to here as digital colour analysis (DCA) for brevity, can significantly upgrade the quality, and so the value, of the analytical information provided by different indicators, including those for CO2 [13].
In this paper, we use two established, commercial, qualitative analysis CO2 indicators, very different in form and function, to demonstrate the efficacy of DCA in rendering the indicators suitable for quantitative analysis. The first is water-based and used in aquaria and the second is ink-film-based and used in anaesthesiology. To our knowledge, neither of these indicators has been the subject of an in-depth analytical study before, despite their widespread use, and neither has been demonstrated as able to function as a quantitative analytical system. Given the proprietary nature of the commercial indicators, best guess formulated equivalent indicators were made in the laboratory so as to allow others to reproduce the work and to provide evidence of the most likely key ingredients in the commercial indicators. A downloadable program is also provided, which generates an appropriate value of A′ from an image of either of these indicators, and so will help the expert and non-expert alike to readily transform these indicators from qualitative to quantitative analytical systems.

2. Materials and Methods

2.1. Materials

The commercial CO2 drop checker used for monitoring the level of dissolved CO2 in aquarium water was obtained from Fluval Aquatics (Fluval CO2 Indicator set, Fluval Aquatics, Yorkshire, UK). In this set, in addition to the glass container, vide infra, an aqueous indicator is supplied and, in this work, 60 drops (~3 mL) of this solution were added to 10 mL of a 1.43 mM NaHCO3 aqueous solution, to produce a working indicator solution, referred to as the ‘Fluval indicator’, in which the dye concentration was ca. 3.21 × 10⁻⁵ M. The whole device (i.e., glass container plus indicator) is referred to as the ‘Fluval drop checker’. The commercial CO2 indicator for identifying the presence of CO2 in exhaled breath, i.e., the capnography indicator, used in this work was the Nellcor™ Easy Cap II Adult Colourimetric CO2 Detector (Medtronic, Dublin, Ireland). We shall refer to the whole device as the ‘Easy Cap detector’ and the CO2 indicator film inside it as the ‘Easy Cap indicator’.
Unless otherwise stated, all chemicals were purchased from Sigma-Aldrich (Gillingham, UK) and were of the highest purity available. The gases used in this work (such as CO2, Ar, 5% CO2 in air, and 1% CO2 in air) were purchased from BOC (Surrey, UK) and were of the highest purity available. Different gas blends of CO2 with Ar were generated using a Cole-Parmer rotameter-based gas blender (Cole-Parmer, Cambridge, UK). An Anéolia Legend O2/CO2 gas analyser (Anéolia, Moissy Cramayel, France) was used to verify the % CO2 in all blended gas mixtures.

2.2. Methods

2.2.1. Preparation of the Lab-Based Drop Check Indicator Solution for Aquaria

Most CO2 drop checkers use a CO2 indicator solution that employs the pH indicator dye, bromothymol blue (BTB), dissolved in an aqueous sodium bicarbonate solution [14].Thus, the CO2 aqueous model indicator prepared for this work was made as follows: 0.1 g of bromothymol blue (sodium salt, BTB) was added to 100 mL of double-distilled, deionised water and the mixture was then placed in a sonicating bath for 20 min, after which the dye had fully dissolved to produce a 0.1% w/v solution of BTB. In a separate experiment, 0.3 g of NaHCO3 was added to 250 mL deionised water and mixed, and then 10 mL of this solution were added to a 100 mL volumetric flask and made up to the mark with deionised water to produce a 1.43 mM NaHCO3 aqueous solution. Finally, to a glass jar containing 50 mL of the 1.43 Mm aqueous solution, 0.89 mL of the 0.1 wt% (1.55 × 10⁻⁴ M) BTB solution was added, and the resulting dark blue solution, referred to as the ‘lab-based drop check indicator’, with [BTB] = 2.71 × 10⁻⁵ M, was stirred at room temperature for 30 min before use. That the pH indicator dye in the Fluval indicator was the same as that used in the lab-based drop check indicator, i.e., BTB, was confirmed by comparing their UV-vis absorption spectra and their absorption peak maxima for HD and D, i.e., λmax(HD) and λmax(D), respectively. Examples of the spectra and a table with the measured values of λmax(HD) and λmax(D) are given in Section S1 of the Supplementary Materials.

2.2.2. Preparation of the Lab-Based Capnography Indicator

Most commercial CO2 indicators used for capnography use an ink comprising a pH indicator and base dissolved in a non-volatile, hygroscopic liquid, such as glycerol, which is then absorbed onto filter paper [15]. Thus, for this application, a CO2 model capnography indicator ink was made using 1 mL of a 0.01 % w/v aqueous solution of cresol red (CR), 40 μL of a 7 mM aqueous solution of Na2CO3, and 30 mg of glycerol; the final CR concentration was 2.43 × 10⁻⁴ M. This ink was then spread evenly over a 47 mm diameter Whatman™ Glass Microfibre filter paper (Buckinghamshire, UK) and allowed to soak in before being dried in an oven at 30 °C for 2 h to produce the purple-coloured indicator film, henceforth referred to as the ‘lab-based capnography indicator’. That the pH indicator dye in the Easy Cap indicator was the same as that used in the lab-based capnography indicator, i.e., CR, was once again confirmed by comparing their UV-vis absorption spectra and their values for λmax(HD) and λmax(D) (see Section S1 in the Supplementary Materials).

2.2.3. Other Methods

All UV-vis spectra were recorded using a Cary 60 UV-vis spectrophotometer (Agilent, Dublin, Ireland). All photography was carried out using a Canon EOS 700D digital camera (Canon Inc., London, UK) and each recorded digital image of an indicator was processed for its red, green, and blue colour space values (i.e., RGB values) using the freely available processing software, Image J [16], from which a value for the apparent absorbance, A′, was derived [13]. All photographic images were recorded using a D65 daylight lamp as the illumination source, since digital photography requires a well-lit environment for good colour reproduction [13]. In determining the sensitivity of the aquaria CO2 indicator solution to CO2, the liquid was added to a 1 cm spectrophotometric cell and each different CO2/Ar gas mixture of known composition, was bubbled gently (flow rate = ca. 0.3 mL s−1) through the cuvette via a syringe needle for 15 min, to ensure full equilibration of the solution, before UV-vis measurements and digital photographs were recorded. By contrast, in a similar study of a capnography indicator, the CO2-sensitive ink film was fixed in a glass gas cell, and then exposed to different levels of CO2 for 10 min before being photographed. A schematic illustration of the set-up used in the latter work is illustrated in Section S2, Figure S3 in the Supplementary Materials. The structures in HD and D form, the colours and pKa values of the two dyes, BTB, and CR, used in this work, are given in Section S3 of the Supplementary Materials.

3. Results and Discussion

3.1. Colourimetric CO2 Indicators and Apparent Absorbance, A’

Most, if not all, colour-based CO2 indicators use a pH indicator dye, D, which responds to the change in pH in the surrounding (encapsulating) medium, be it an aqueous solution or an ink film, due to the formation of carbonic acid and its subsequent deprotonation. The latter process can be summarised by the following expression:
CO 2   ( g ) + H 2 O   K 1   H + + HCO 3
In most CO2 indicators, sufficient base is present, often in the form of NaHCO3, so that the partial pressure of CO2, PCO2, is directly related to the concentration of H+, [H+], i.e.,
PCO2 = [Na+][H+]/K1
where [Na+] is the base concentration [1,17]. When a pH-indicating dye is also present, as with a CO2 colourimetric indicator, the following indicator dye equilibrium must be considered:
HD   K a   D + H +
Colour A Colour B
where Ka is the acid dissociation constant of the pH indicator dye and HD and D are the protonated and deprotonated forms of the dye, with colours A and B, respectively. Since the dye concentration is usually very low, it is assumed that its presence has no significant effect on the equilibrium reaction (1), and, as a consequence, Equation (2) can be modified to
R = αPCO2
where α is a constant (= K1/Ka[Na+]) and R is the ratio of the concentrations of HD and D, i.e., R = [HD][D]. Equation (4) is the basis of the responses exhibited by most colourimetric CO2 indicators after equilibration with the system under test [1,10].
As noted earlier, commercial CO2 indicators are often used as qualitative indicators, and the base concentration and dye are chosen so that only the extreme regions in CO2 level can be readily identified. This certainly appears to be the case with the CO2 indicators used in aquarium water and breath monitoring. When used in this way, Equation (4) shows that if PCO2 is, (i) so high that R is ≫1, e.g., >5, then most (>83%) of the dye, will be in its protonated form, and the indicator will appear colour A, or (ii) so low that R is ≪1, say <0.2, then most (>83%) of the dye, will be in its deprotonated form, and the indicator will appear colour B. In monitoring the CO2 level in aquarium water, neither of these extreme colours is desirable, since—as we shall see—they represent a danger to either the fish (since high CO2 is toxic) or plants (low CO2 hinders growth) [14]. By contrast, in breath monitoring, observing the indicator regularly flipping between these extreme colours is the desired result, as it indicates correct tracheal intubation, which is the role played by most commercial CO2 breath indicators, such as the Easy Cap detector used in this work [11,18,19].
In order to use a CO2 indicator for quantitative analysis, usually its absorbance, A, needs to be monitored at a wavelength where either HD, or more usually D, absorbs most strongly. Under such conditions, A is simply related to R and so PCO2, by the following expression:
(AoA)/(AA) = R = αPCO2
where Ao and A are the fixed, measured absorbances of the CO2 indicator when the dye is completely in its deprotonated and protonated forms, respectively, i.e., in their extreme colour forms, colour B and colour A, respectively. Not surprisingly, in the case of a CO2 indicator, the values of Ao and A are taken as the measured values of A, when the indicator is exposed to the extreme levels of CO2, of 0 and 1 atm, respectively. Equation (5) shows that once values of Ao and A have been determined, then for a CO2 indicator the value of the ambient level of CO2, PCO2, can be determined by just measuring the absorbance, A, of the indicator.
As noted earlier, it has been shown that DCA can be used to generate an apparent absorbance, A’, value for an indicator which is directly proportional to its real absorbance, A [13,20]. In DCA, the apparent absorbance values are calculated using either the red, green, or blue component values (ranging from 0–255) derived from analysis of the digital image of the indicator, i.e., RGB(red), RGB(green), and RGB(blue), depending on what colour the dye absorbs most strongly [13], which is RGB(red) for the indicator systems reported here. Thus, in this work, values of A′ were calculated using the following expression:
A′ = log {255/RGB(red)}
Note, the same approach to digital image analysis, i.e. DCA, using Equation (6) has been used in many studies [21,22], including a recent study published in this journal for a colourimetric sensor for mercury ions [23]. The use of RGB colour analysis with indicators for quantitative analysis is not new and has been extensively reviewed recently [24,25,26]. It is particularly popular and effective when used with an indicator array, often in combination with principal component analysis [13,22,24,27,28]. It might be expected that the combination of the three indices, i.e., RGB(red), RGB(green), and RGB(blue) in some form, as found in the change in the colour parameter, ΔE, [29] which is often used in such studies [29,30,31,32], might yield more accurate results. However, most CO2 indicators, such as the ones used here, are simple, one-dye, two-colour, systems and a detailed study of such systems reveals that A is not proportional to ΔE, but is proportional to A′ [13]; the latter relationship is necessary if the optical signal is to be easily related to the underlying theory, i.e., Equation (5) and A to PCO2. Of course, this does not mean that there is no combination of the three indices that would give a parameter that is proportional to A, but it is not clear what that combination might be, nor what additional benefit, if any, it might afford. Thus, in this work, as elsewhere [13,21,22,23], the use of just one of the indices, here RGB(red), and Equation (6), appears sufficient to generate a parameter, A′, that is suitable, easily understood, readily calculated, and simple to employ for quantitative analysis.
A simple demonstration of the direct relationship between A and A′ for a CO2 indicator, which is presented for the first time here, can be obtained by simply saturating with CO2 an aqueous NaHCO3 (1.43 mM) solution of the pH indicator dye, BTB, 2.71 × 10⁻⁵ M and then measuring its absorption spectrum and photographing it as it degasses in ambient air. Note, the composition of this BTB aqueous solution is the same as that of the lab-based drop check indicator described in Section 2.2.1. The indicator solution, before and after saturation with CO2, is blue and yellow, respectively. Once saturated, the UV-vis absorption spectrum of the solution and its colour, captured using UV-vis spectroscopy and digital photography, respectively, is then recorded as a function of time as it slowly loses its dissolved CO2 to the ambient atmosphere. The results of this work are illustrated in Figure 1a,b, respectively.
Each of the photographic images of the BTB aqueous solution illustrated in Figure 1a was subjected to DCA analysis to yield a value for A′, calculated using Equation (6), so as to generate an A′ vs. t dataset for the indicator solution. Similarly, the UV-vis spectra illustrated in Figure 1b were used to generate a parallel A vs. t dataset, where A was the measured absorbance value recorded at λ(max) for the deprotonated form of the BTB dye, D, at 618 nm. The combination of these two datasets in the form of a plot of A vs. A′ then yields an excellent straight line, as illustrated in Figure 1c, thereby highlighting the direct relationship between A and A′ for the BTB aqueous solution CO2 indicator and the appropriateness of the image analysis method, DCA, used in this work.

3.2. The Aquarium CO2 Indicator

Aquaria ecosystems are usually made up of fish and plants. Plants are important because they offer shelter, supply shade and cooler temperatures during the warmer months, protect small and delicate fish, improve water quality by absorbing nitrates and help prevent the growth of nuisance algae [33]. However, whilst plants need CO2 to thrive, and so a dissolved CO2 level >15 ppm, at dissolved concentrations >30 ppm fish become susceptible to CO2 poisoning, which leads to lethargy, increased or rapid respiration, and ultimately death [33]. Thus, in aquaria, the control, and thus the accurate measurement, of the level of dissolved CO2 is important to ensure that the CO2 level in the aquarium is safe for fish, whilst being sufficient for plant growth, with an ideal level lying in the range 15–30 ppm [14,33].
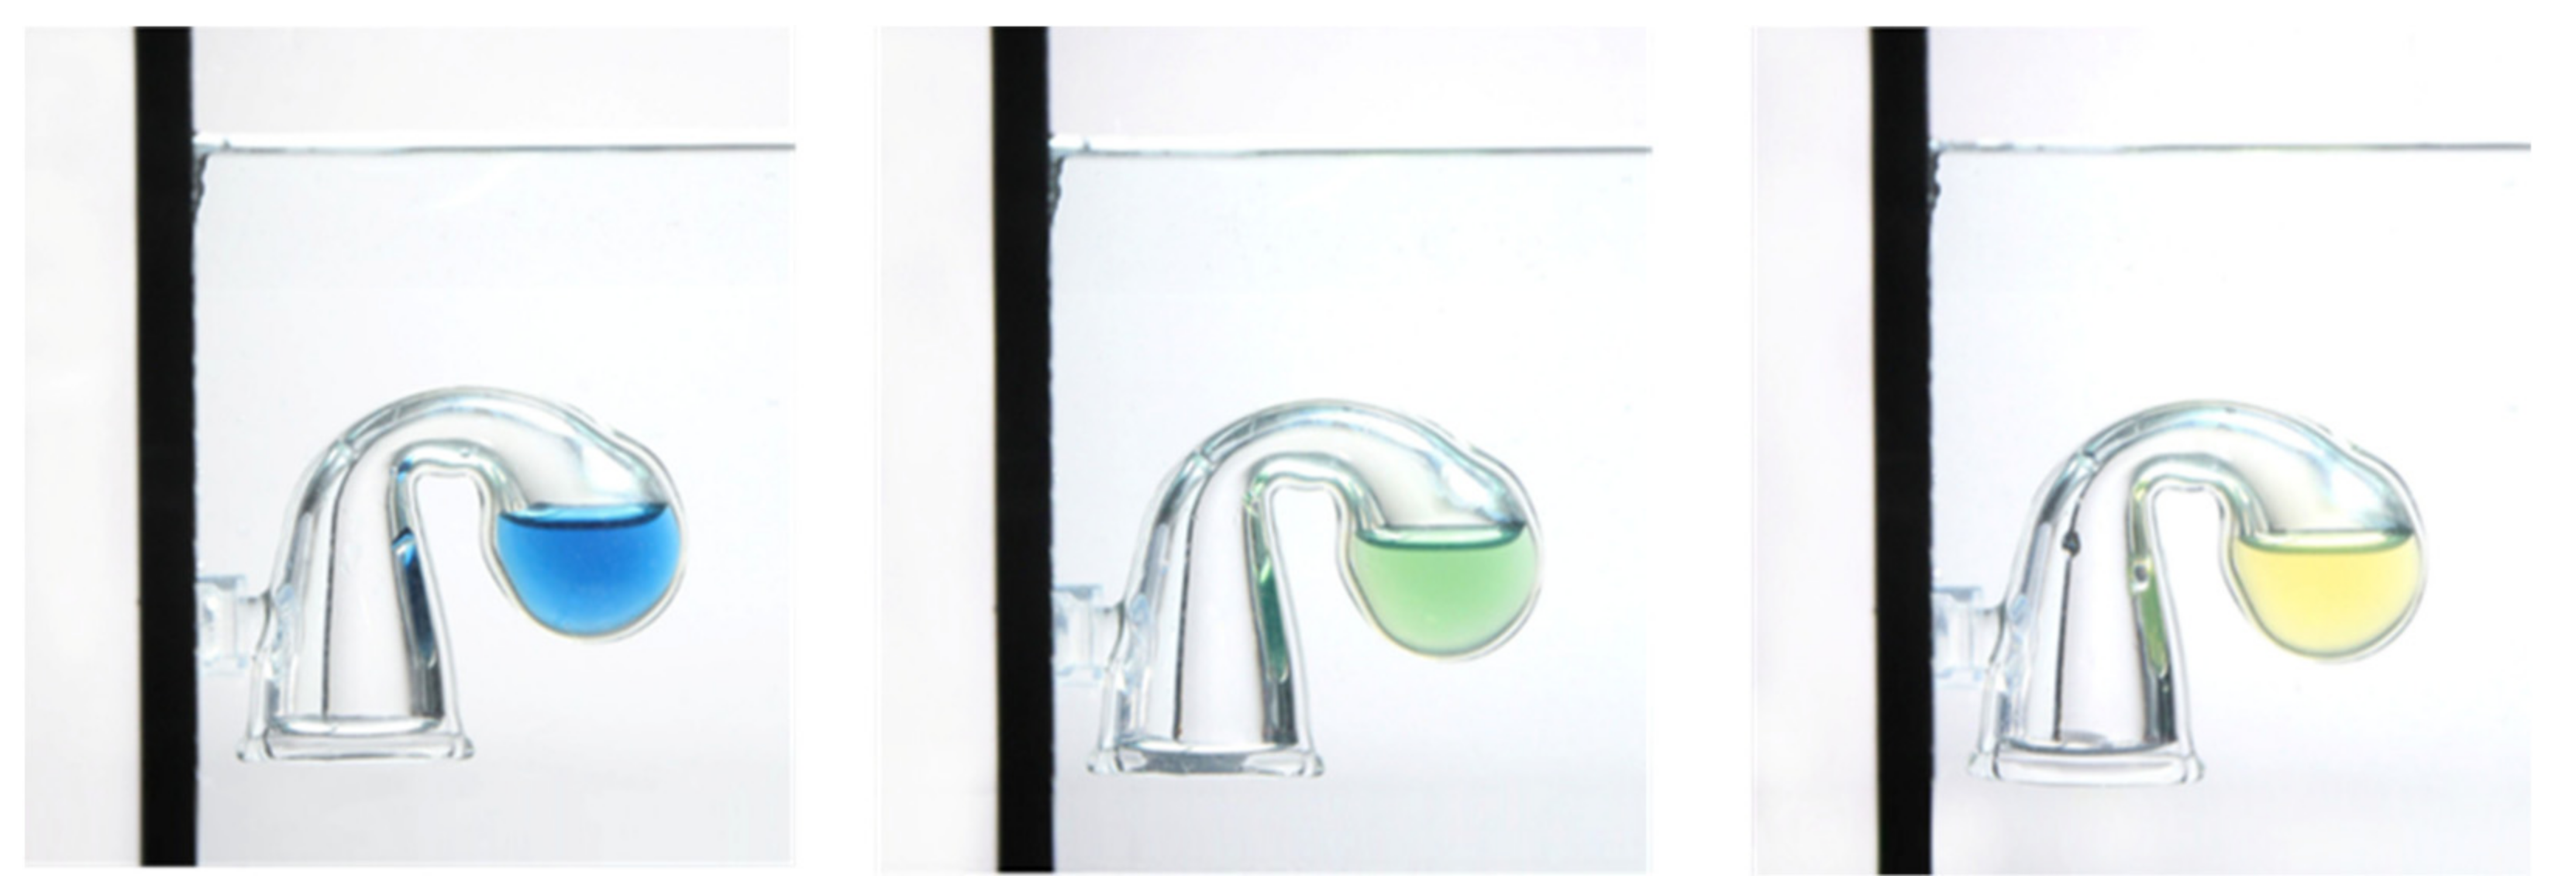
The monitoring of CO2 in aquaria is largely qualitative and achieved using a CO2 drop checker. The latter is often in the form of a small glass or plastic vessel that houses an aqueous NaHCO3 solution containing a pH indicator, which is invariably BTB. This CO2 indicator solution does not come into contact with aquarium water, but equilibrates with the CO2 in the aquarium water, via an intervening headspace that exists between the aquarium water and the indicator solution. Figure 2 is an example of a glass drop check CO2 indicator, containing a BTB CO2 indicating solution, mounted on the inside of a fish tank.
The BTB pH indicator solution used to generate the data in Figure 1 is typical of that used in a drop check CO2 indicator and, as indicated, ideally, a blue-coloured solution in the CO2 drop checker should alert the user to low CO2 levels (<15 ppm), green should indicate that the CO2 level is good (15–30 ppm), and yellow should highlight the presence of high CO2 levels (>30 ppm) [34].
The problem with the indicator solution used currently in most CO2 drop checkers is that the two-colour changes, namely, blue to green, and green to yellow, are gradual and hard to judge clearly by eye. It follows from the discussion in Section 3.1 that the BTB indicator solution in the drop checker will appear mostly yellow when R = 5, mostly blue when R = 0.2, and most green when R = ca. 1.6, but, given the pKa of BTB is ca. 7.3 [35], at R values of 5, 0.2, and 1.6, the pH of the aqueous NaHCO3 solution will be 6.6, 8.0, and 7.1, respectively. Now, it can be shown that the relationship between [CO2(aq)] (in ppm) and the pH of an aqueous NaHCO3 solution, of concentration [NaHCO3] (in mM), is given by the following expression:
[CO2(aq)] (units ppm) = 9.76[NaHCO3] × 10(7−pH)
Thus, in practice, when the indicator solutionin the drop checker, with its bicarbonate concentration of 1.43 mM, appears mostly yellow (R = 5), blue (R = 0.2), and green (R = 1.6), the actual level of dissolved CO2 will be 34, 1.4, and 11 ppm, respectively, i.e., worryingly far from the desired ideal values of 30, 15, and 23 ppm, respectively. As a consequence, the current methodology associated with commercial CO2 drop checkers is very limited in its usefulness since, in practice, it is yellow when the level of CO2 is >30 ppm and blue when the level of [CO2(aq)] is far below the minimum value of 15 ppm needed for aquatic plants to thrive.
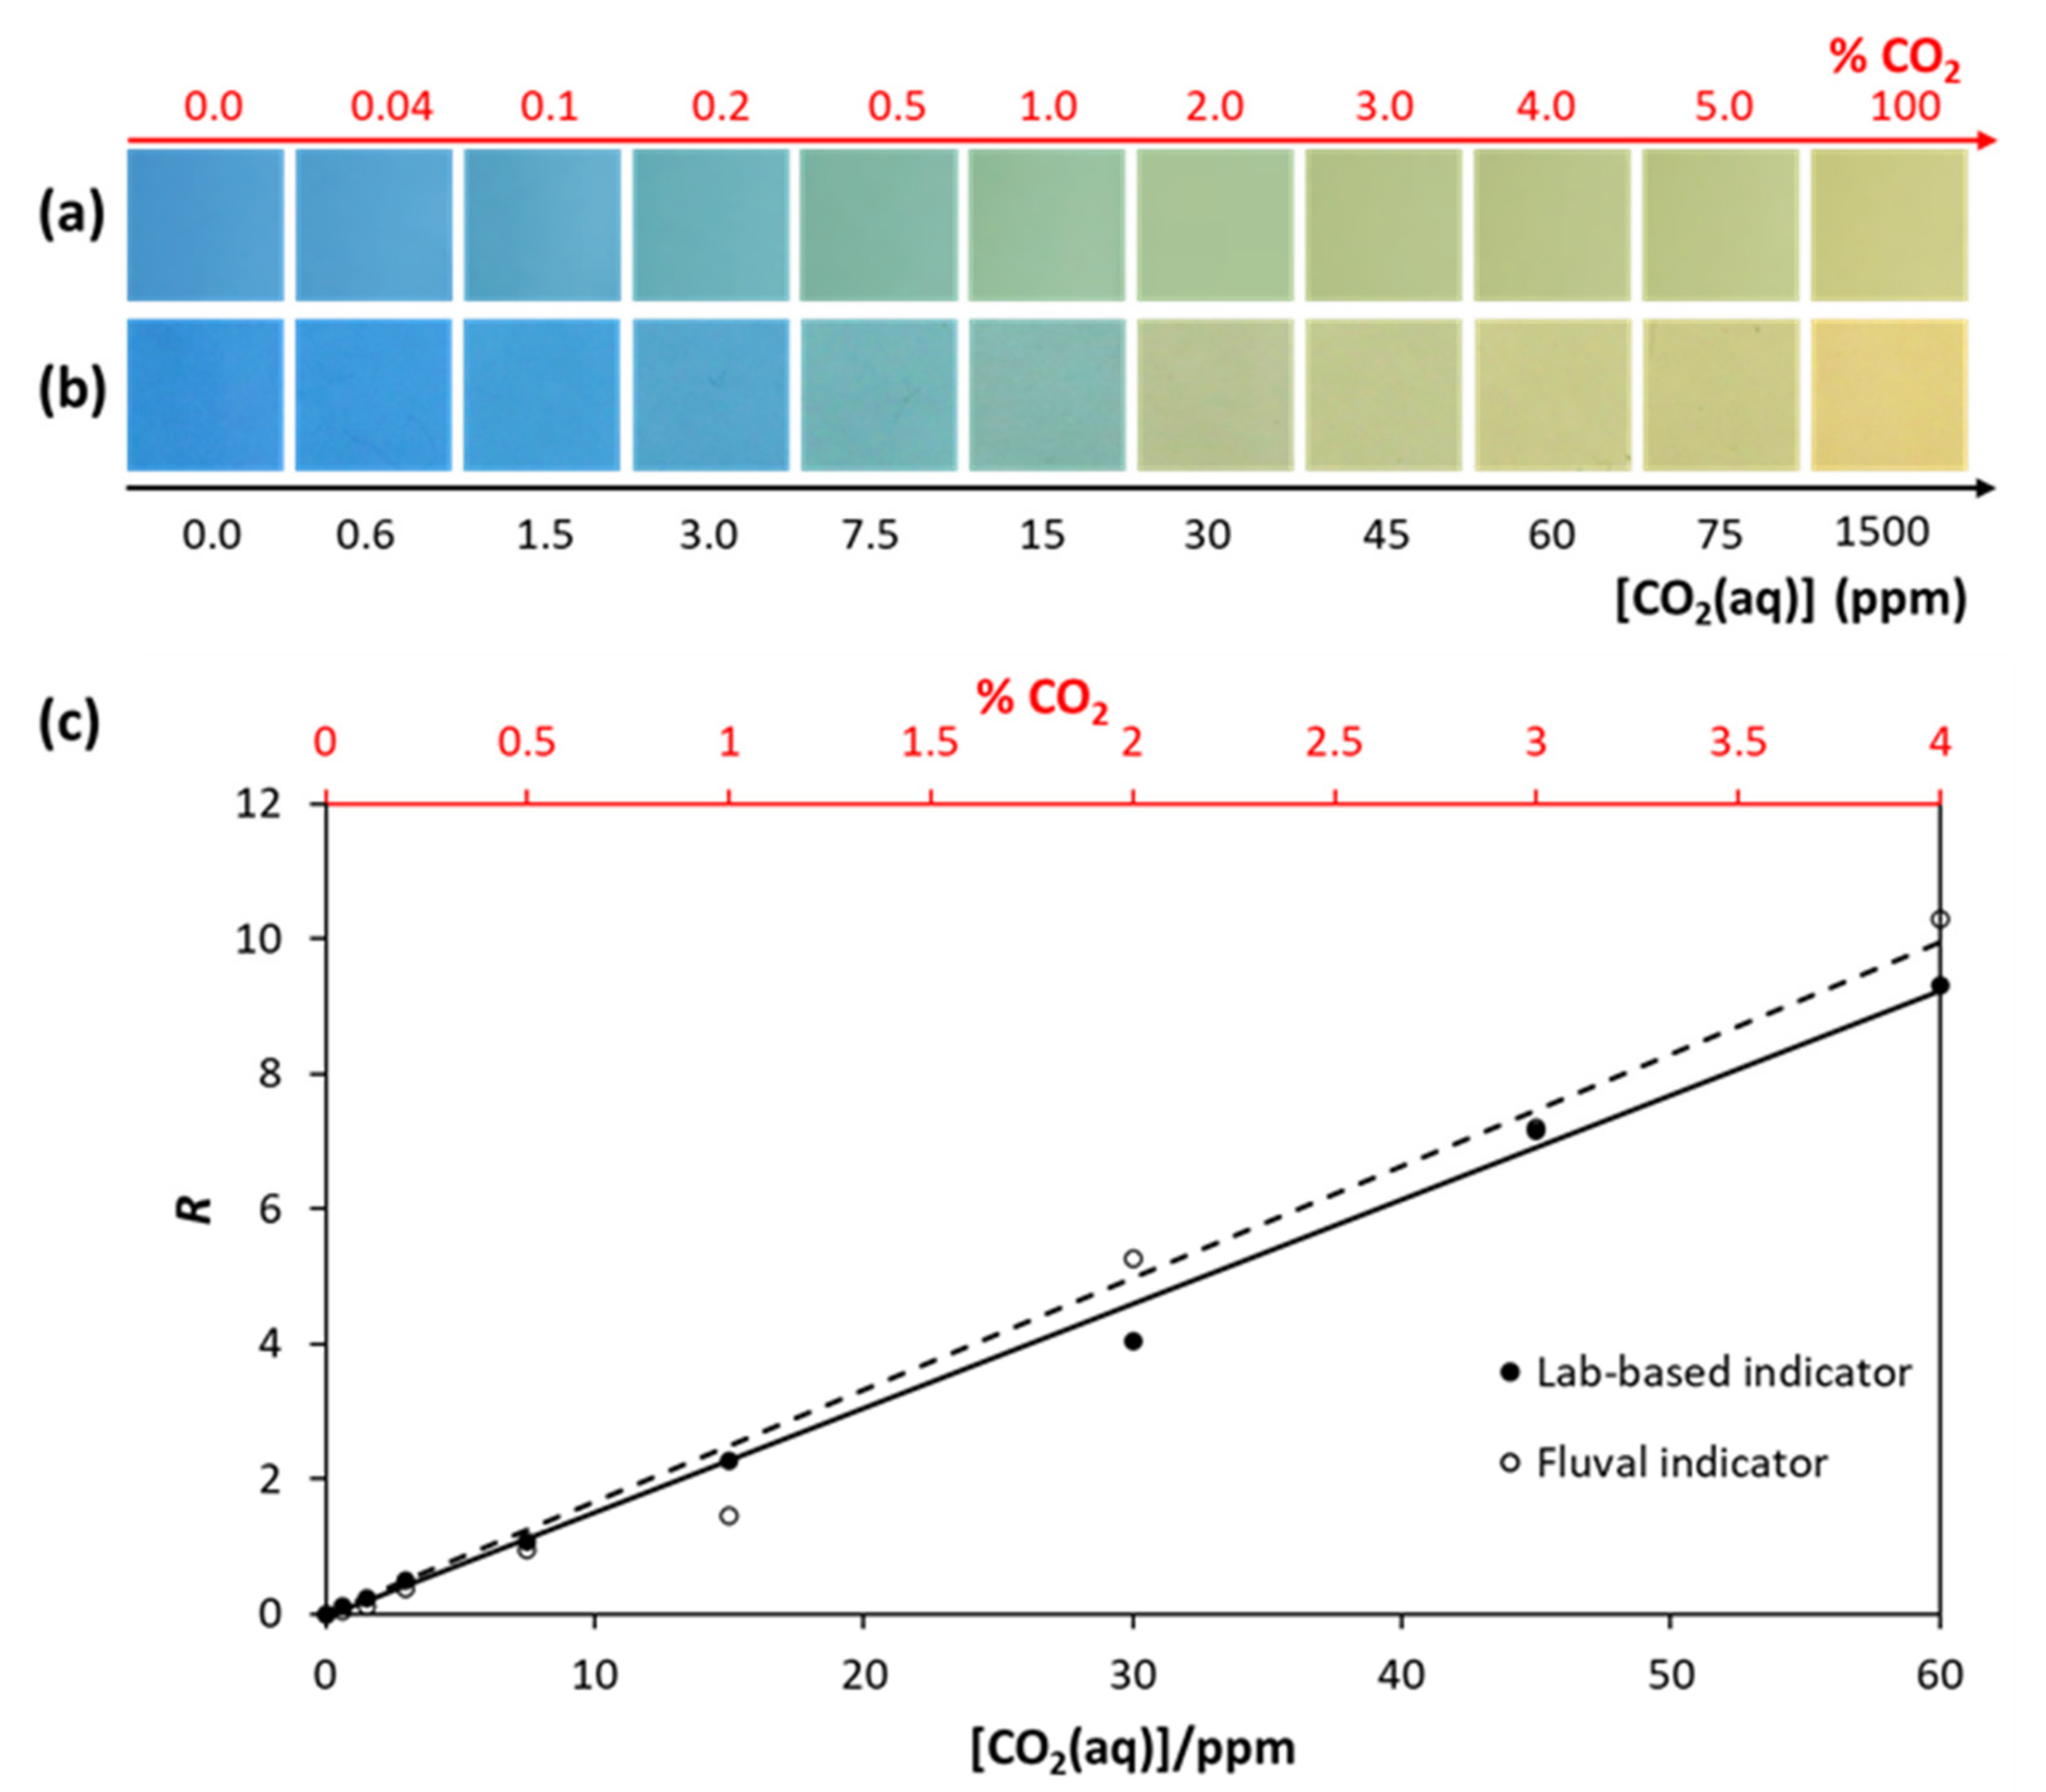
The poor performance of current commercial drop checker indicator solutions can be vastly improved by applying DCA to the system, instead of assessing it by eye, since the former method allows the indicator to provide an accurate assessment of the level of dissolved CO2 and give a reliable warning if the value of [CO2(aq)] falls outside the desired range of 15–30 ppm. In order to demonstrate the ability of DCA to transform a drop checker indicator solution into one capable of quantitative analysis, the lab-based drop check indicator solution (2.71 × 10⁻⁵ M BTB dissolved in a 1.43 mM NaHCO3) was placed in a 1 cm cuvette, saturated with different levels CO2, and at each value its colour was photographed. Note, as all this work was carried out at 25 °C, the temperature of most aquaria, it follows from Henry’s law that the level of dissolved CO2 in water purged with pure CO2 at 1 atm, i.e., 100% CO2, is 0.03428 M, or ca. 1500 ppm [36]. The above process was then repeated using a commercial CO2 drop check indicator solution, i.e., the Fluval indicator and the digital images of the lab-based drop check and the Fluval indicator solutions after exposure to different % levels of CO2 are illustrated in Figure 3a and 3b, respectively. These photographs show that, as suggested earlier, for both indicator solutions the transition of the indicator from blue to green and then from green to yellow is hard to gauge by eye, and that both indicators are only distinctly blue well below the lower limit of 15 ppm.
Encouragingly, for both indicators, when the photographs in Figure 3a,b were analysed using DCA, the values of R, calculated using Equation (5) from the apparent absorbances values, A′, associated with the images, appear linearly related to [CO2(aq)], as expected, given the relevant form of Equation (5) for this work is as follows:
(AoA′)/(A′ − A) = R = α′[CO2(aq)]
where Ao and A are the apparent absorbance values, determined from the associated digital images, of the drop check indicator solution before and after saturation with CO2, and α′ is the sensitivity of the indicator in units ppm−1.
As an aside, although it might initially seem technically difficult to generate a value for A for the drop check indicator in the field, in practice this can be simply achieved by initially placing the drop check indicator into a glass containing carbonated water, whereupon it will change from blue to bright yellow within a few minutes which, when photographed, will provide a value of A. The drop check CO2 indicator can then be rinsed with water and placed in the aquarium where, after a few hours, its colour will reflect the value of [CO2(aq)] in the aquarium water.
The plots of R vs. [CO2(aq)], illustrated in Figure 3c, show that the lab-based drop check indicator reported here has approximately the same sensitivity as that of the Fluval indicator (α′ = 0.17 compared to 0.15 ppm−1). Figure 3c also shows that DCA is able to transform a barely adequate indicator of [CO2(aq)] in aquarium water to one that can provide quantitative information and so can be used to readily identify the points when the level is <15 and >30 ppm, i.e., at R values of ca. 2.4 and 4.8, respectively. The values of RGB(red), from the photographic images in Figure 3a,b, and values of A′ and R, calculated subsequently using Equations (6) and (8), respectively, are given in Table S3 in Section S4 of the Supplementary Materials, along with the plots of A′ vs. [CO2(aq)] for the two indicator solutions, given in Figure S4.

3.3. The Capnography Indicator

In medicine, the monitoring of the concentration, or partial pressure, of CO2, PCO2, in the respiratory gases is known as capnography [11,37], and this measurement is a particularly important tool when the anaesthetist is inserting a tube for carrying the anaesthetic gases into the trachea, rather than the oesophagus, of the patient [38]. Endotracheal intubation is a regular part of an anaesthetist’s duties as it is used to provide oxygen, ventilation, airway protection, and anaesthetic gases to a patient [39]. While endotracheal intubation is a routine procedure, it is accompanied by a well-recognised risk that the tube may be incorrectly inserted into a patient’s oesophagus, or placed improperly in the trachea so that only one lung is correctly ventilated [38]. As a result, incorrect tracheal intubation can lead to a life-threatening oxygen deficiency [38].
The measurement of CO2 in the exhaled breath, the normal level of which is 4–5% [40], of endotracheally intubated patients can be used to indicate correct tracheal intubation and show a steady breathing rate [41]. Although infrared absorption spectroscopy is very good for monitoring CO2 levels in breath, the equipment is expensive and bulky [8,37,42]. By contrast, it has been established that colourimetric CO2 indicators are relatively inexpensive, facile to operate, and can provide a quick, reliable confirmation of correct endotracheal tube placement, which improves any clinical assessment possible in the field [43,44].
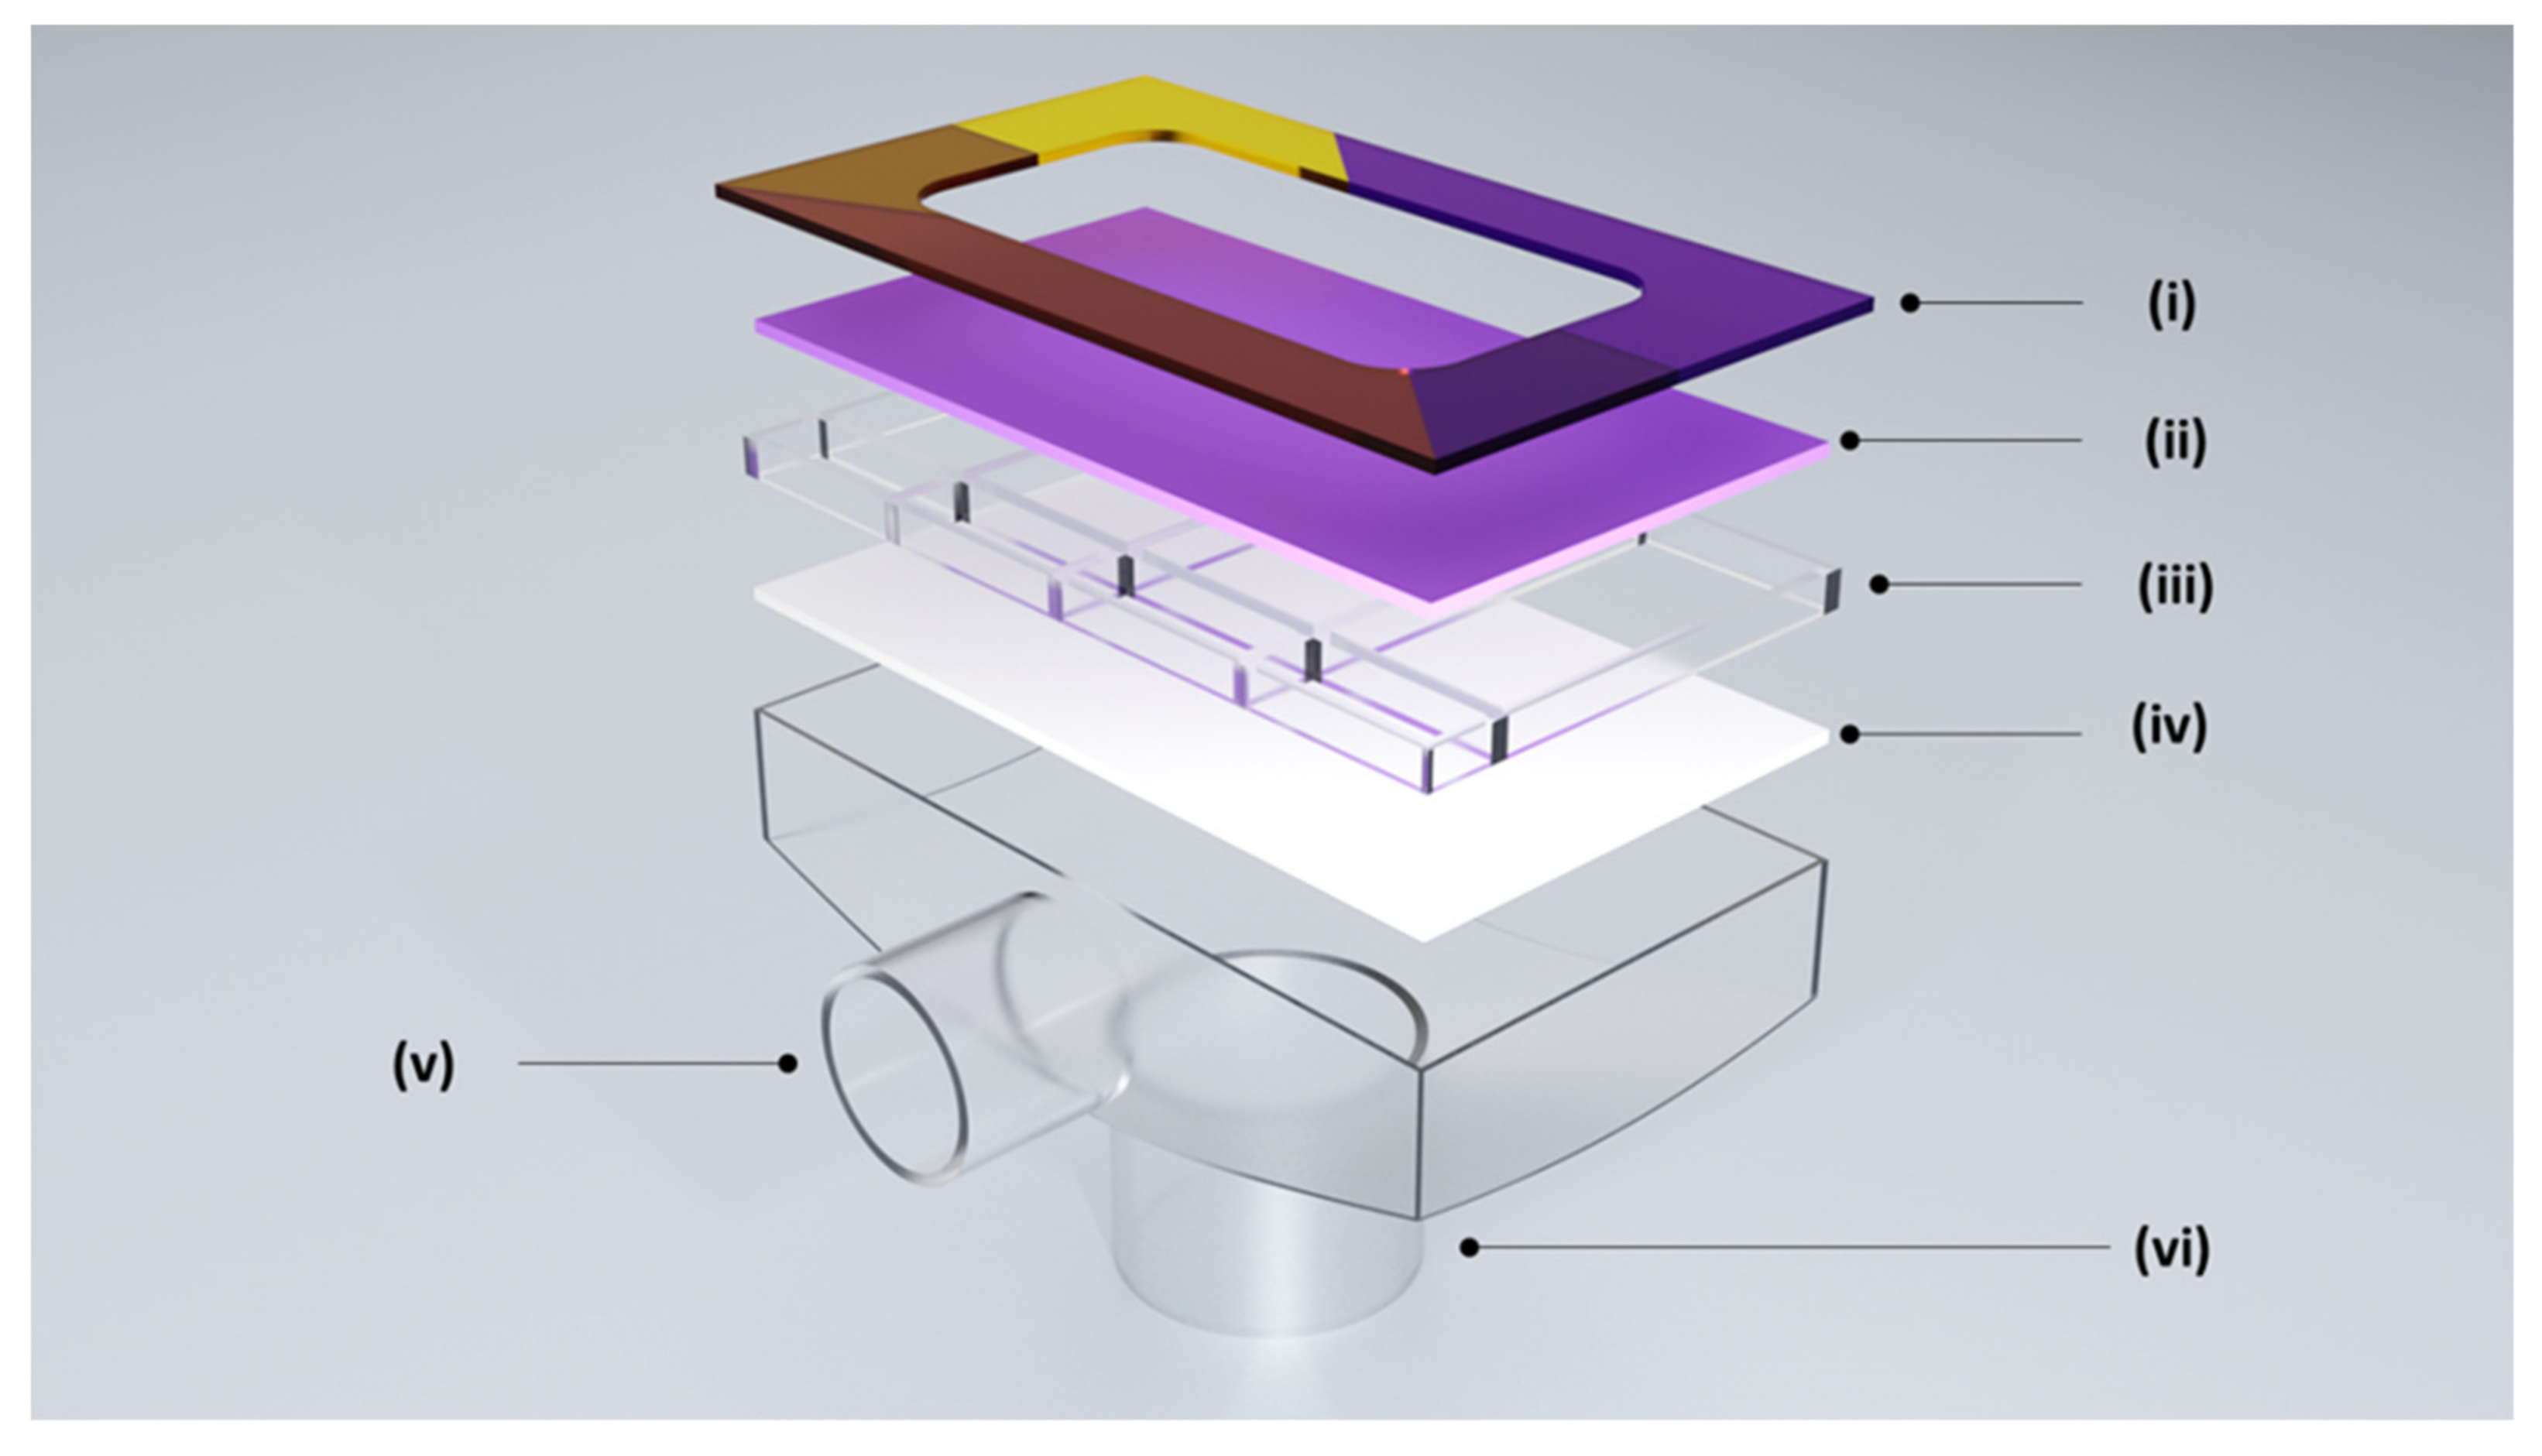
Several commercial CO2 indicators have been developed for use as a capnography-based correct tracheal indicator [45,46,47,48] and all have similar features to that used in this work, namely a Nellcor™ Easy Cap II Adult Colourimetric CO2 Detector (Medtronic, Dublin, Ireland), a schematic diagram of which, highlighting the key components of the indicator, is shown in Figure 4 [49].
The key feature of all commercial capnography indicators for ensuring correct tracheal intubation is a CO2-sensitive indicator film. These are usually made by dissolving a pH-sensitive dye, such as CR, in an aqueous solution containing glycerol (a humectant) and sodium carbonate (a pH buffer), soaking it into a white fibrous material, such as filter paper, and allowing it to dry [15], and so this method was employed in the preparation of the lab-based capnography indicator used in this work. Confirmation that A is proportional to A′ when using CR was achieved using the same degassing experiment as employed for BTB (see Figure 1), the results of which are illustrated in Figure S5, in Section S5 in the Supplementary Materials.
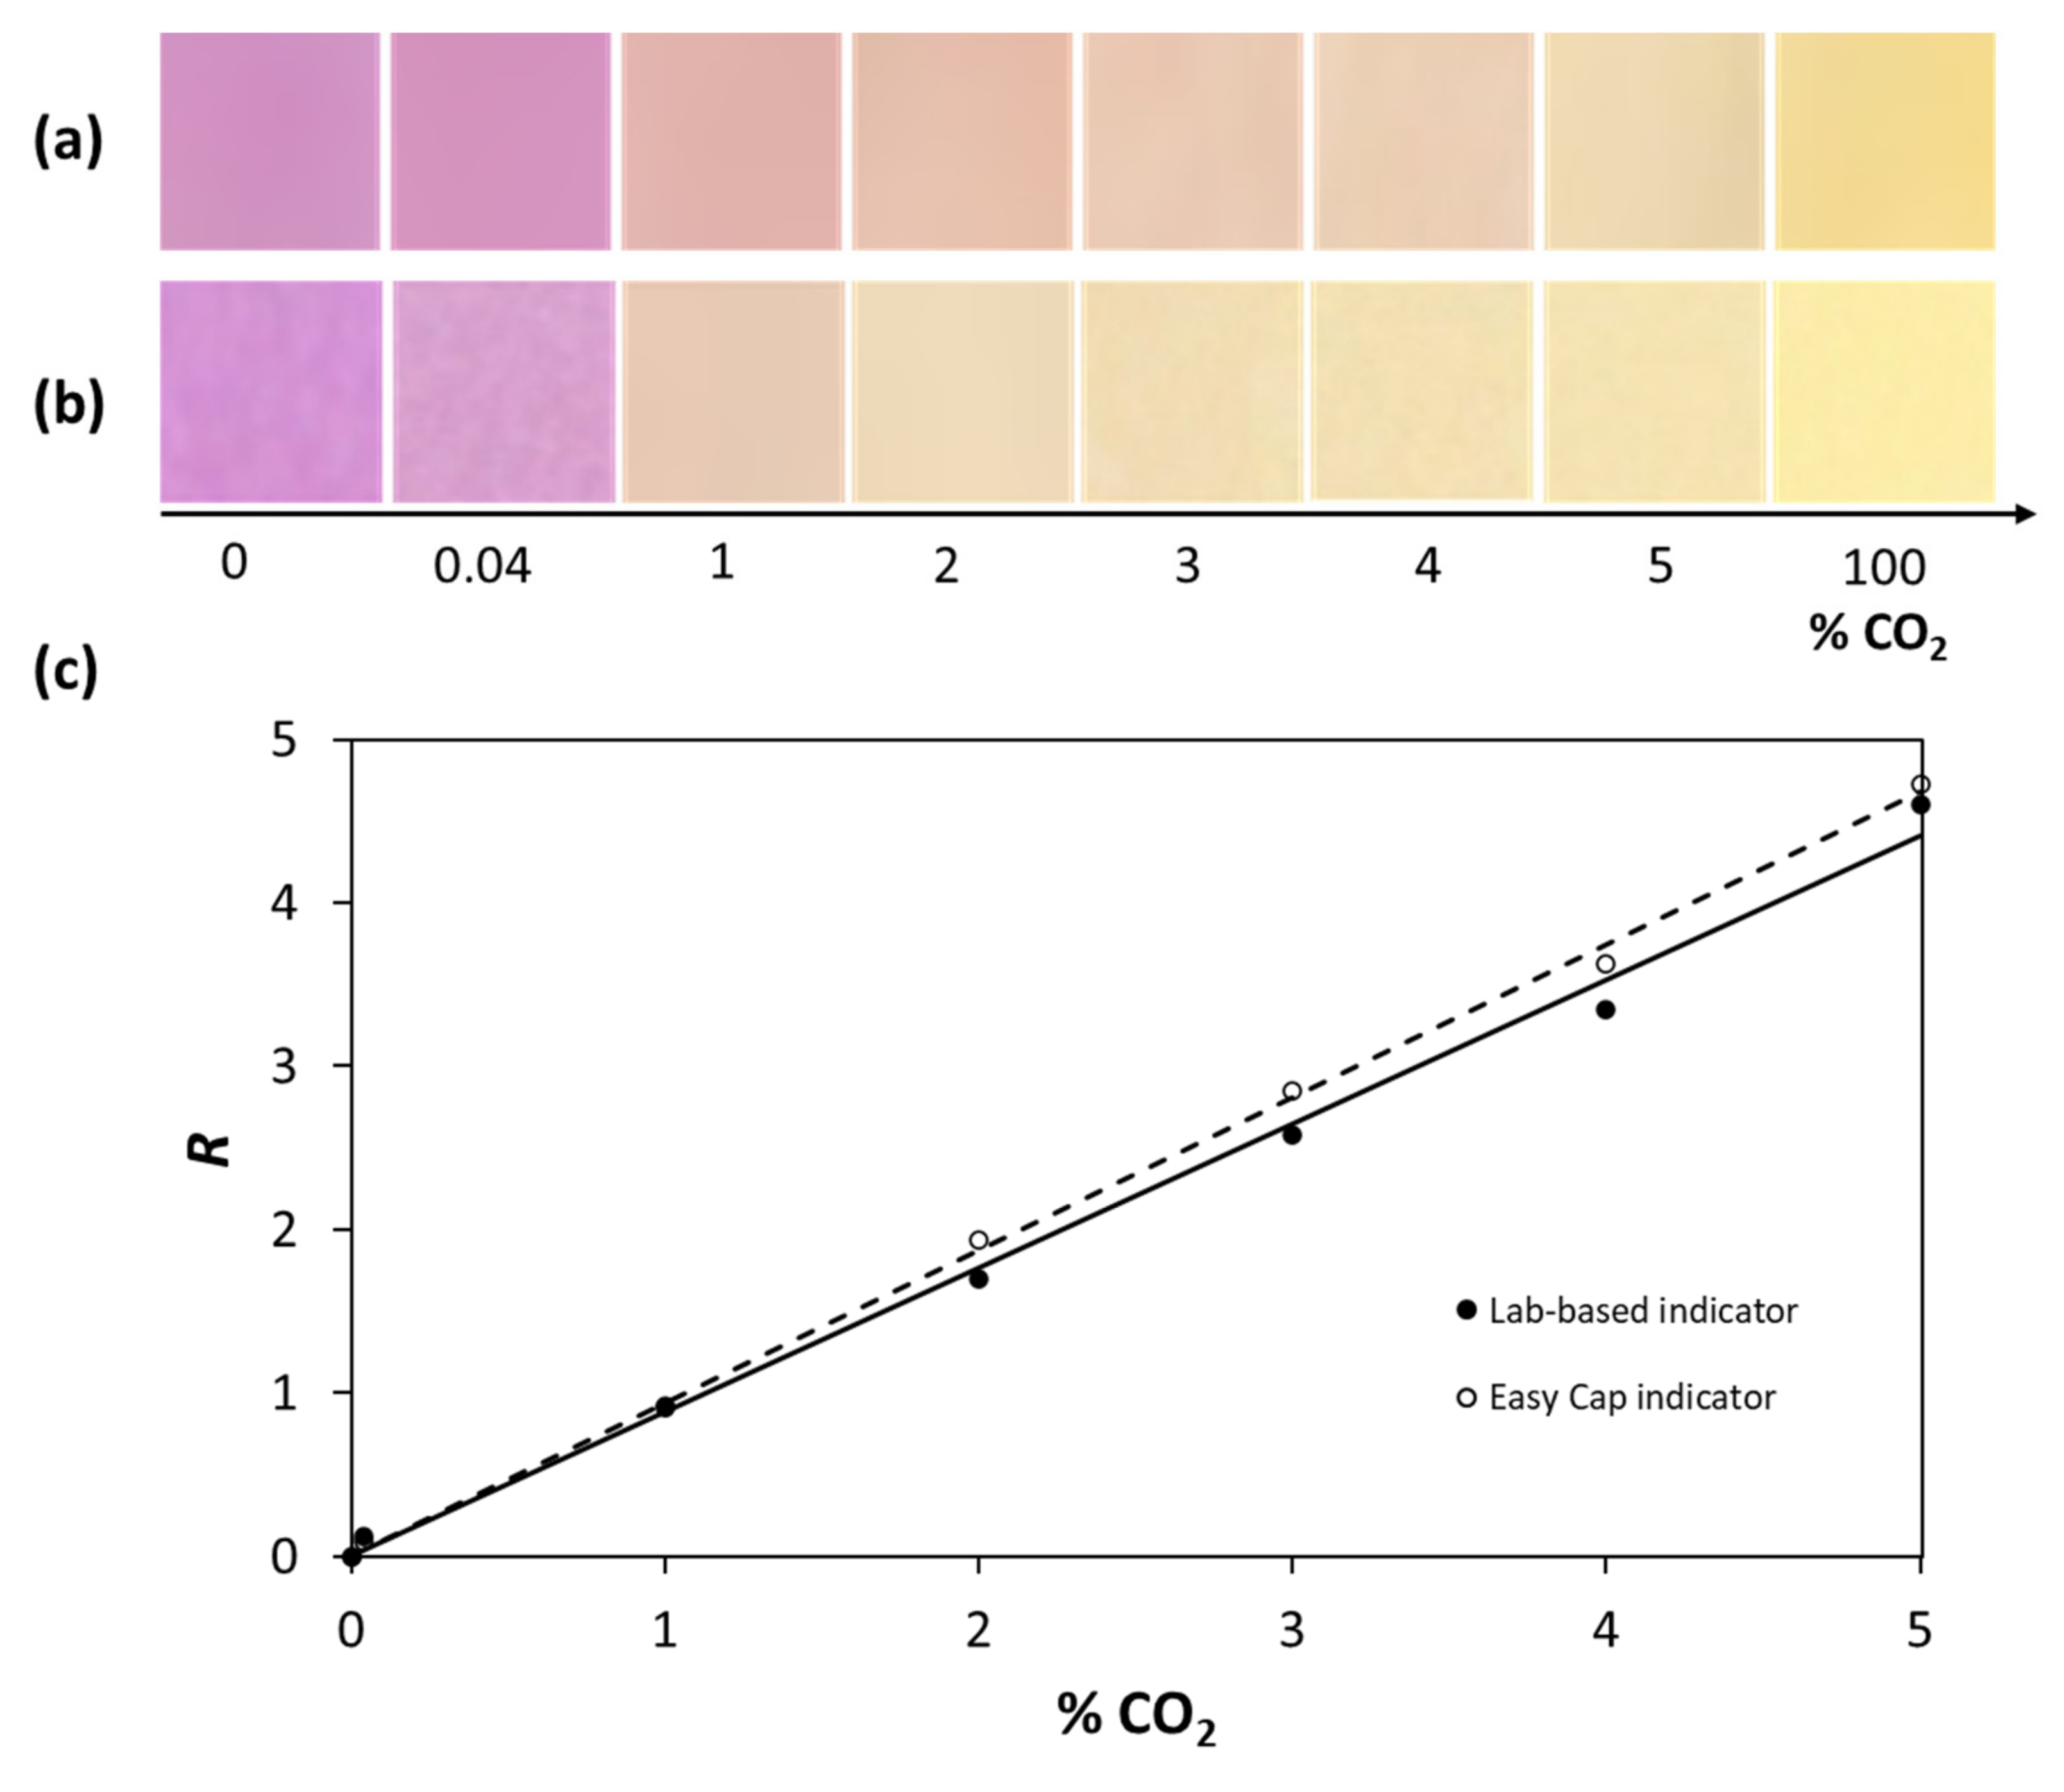
In a typical experiment, the lab-based capnography indicator was exposed to different levels of CO2 and photographed each time. The results of this work and those for the Easy Cap indicator are illustrated in Figure 5a,b, respectively. The photographs show that both indicators are initially purple in the absence of CO2 and yellow in the presence of 100% CO2, with an approximate midway transition in colour at ca. 1% CO2.
For each indicator, the digital images in Figure 5 were subjected to DCA, in order to derive their associated apparent absorbance values, which were then used to calculate a value for R, using Equation (5) for the % CO2 in the gas stream used to produce the indicator’s colour. The values of RGB(red), from the photographic images in Figure 5a,b, and values of A′ and R, calculated subsequently using Equations (6) and (5), respectively, are given in Table S4 in Section S5 of the Supplementary Materials, along with the plots of A′ vs. [CO2(aq)] for the two indicator solutions (Figure S6).
The results of this work, in the form of R vs. % CO2, are illustrated in Figure 5c and both show that R is proportional to % CO2, as predicted by Equation (5). The lab-based drop capnography indicator appears to be a good facsimile of that used in the commercial capnography detector, i.e., the Easy Cap indicator, not only in terms of the great similarity in the initial and final colours of the two indicators but also their sensitivities, as given by the values of the gradients of the lines of best fit illustrated in Figure 5c, i.e., the values of α in Equation (5) of 0.88 and 0.93% CO2−1, respectively.
The colour wheel on the Easy Cap detector has three colours, namely purple, brown, and yellow, indicating % CO2 levels of ca. 0.04%, 0.5–2%, and ≥5%, respectively. Thus, not surprisingly, the device is appropriate for identifying correct tracheal replacement, by showing a change in colour from purple to yellow that oscillates in time with the patients breathing in and out, respectively.
When DCA is used on either of the capnography indicators, the observed colour changes can be readily transformed into something that resembles a real-time capnography waveform, i.e., a plot of % CO2 versus time. A typical capnography waveform is illustrated in Figure S7 in section S6 of the Supplementary Materials, and the shape of such waveforms can be used to diagnose various conditions, such as hypo- and hyperventilation and various types of emboli, such as cardiac embolism and cardiac arrest, emphysema, and obstructive diseases, such as asthma [50]. However, as a typical number of breaths per minute is 10–20, any device recording an accurate capnography wave needs to be fast responding, i.e., <0.2 s, in order to capture all the features associated with the various different conditions listed above.
Unfortunately, the capnography indicator on filter paper films used in this work, and used currently in most commercial correct intubation indicators, such as the Easy Cap indicator, have response and recovery times of ca. 2 and 5 s, respectively, and, consequently, the % CO2 vs. time waveforms they produce are distorted versions of the actual capnography waves. The latter point was illustrated by recording the apparent absorbance vs. time profiles for the lab-based capnography and Easy Cap indicators, used to generate the data in Figure 5, as they were exposed to a stream of inhaled and exhaled breath. In this work, Equation (5), coupled to the appropriate value of α, given in Figure 5, was then used to convert the A′ vs. t data into the % CO2 vs. t profiles illustrated in Figure 6a,b, respectively.
Although the % CO2 vs. t waveforms associated with the lab-based capnography and Easy Cap indicators illustrated in Figure 6 are sufficient to confirm correct tracheal intubation, they clearly lack the definition that is required for a rigorous capnography waveform diagnosis. However, even the distorted waveforms provided by these two capnography indicators, illustrated in Figure 6, should allow the identification of some of the medical conditions that produce very pronounced and distinctive features in their capnography waveforms, such as hyper- and hypoventilation, bronchospasm, and rebreathing [51]. Other works have shown that much better defined % CO2 vs. t waveforms, comparable to those recorded using a conventional infra-red-based capnometer, with response times <0.2 s, can be achieved by operating such indicators at an elevated temperature, ca. 55 °C [52].
The above work shows that DCA can significantly improve the functionality of a typical commercial capnography indicator, so much so that such indicators could be used to provide invaluable diagnostic information at a low cost, especially if operated at a temperature sufficient to generate a % CO2 vs. t profile that more accurately reflects the shape of the actual underlying capnography waveform.

3.4. A Simple A′ Calculator

In order to help facilitate the use of DCA with the above indicators and many others, we have developed a simple program, incorporated into an Excel file entitled ‘A′ calculator.xlsm’, which calculates the value of A′ (based on RGB(red)), of any part of an imported photographic JPEG image. The program has a pointer that allows the indicator part of the image to be selected and its associated value of A′ to be calculated instantly. An example image file, ‘drop check green image.jpeg’, is provided to test the program, along with a short tutorial movie, ‘Tutorial for A′ calculator.mp4’, to help any user use the program, and all three of the above files can be downloaded from the following website: https://www.profandrewmills.com/2022/10/dca-tutorial/ (accessed on 7 November 2022) [53].

4. Conclusions

Two very different commercial CO2 indicators, which have not previously been the subject of a detailed analytic study, were replicated in the lab. For each indicator type, it was shown that DCA is able to transform the indicator from one that can provide qualitative information with regard to the ambient level of CO2 into a quantitative detector of CO2. To our knowledge, this is the first reported example of DCA transforming a commercial or non-commercial CO2 indicator for use in aquaria or capnography from a qualitative to a quantitative analytical system. For both the aquarium and capnography indicators studied, the colour change and sensitivity exhibited by the commercial form of the indicator were matched very well by their lab-made facsimiles. Since most mobile phones have the digital camera image quality and processing power to render it capable of DCA, the use of such indicators for quantitative analysis appears easily extended to use in the field, as noted by others when using indicators for detecting analytes other than CO2 [21,22,23].

Supplementary Materials

The following supporting information can be downloaded at: https://www.mdpi.com/article/10.3390/chemosensors10120544/s1, Figure S1: UV-vis spectra of the lab-based drop check indicator solution (solid line), comprising 2.71 × 10⁻⁵ M BTB in a 1.43 mM NaHCO3 aqueous solution and that of the Fluval indicator solution (broken line), in which [BTB] = ca. 2.96 × 10⁻⁵ M BTB; Figure S2: UV-vis spectra of (solid line) an aqueous solution of the cresol red (CR) dye used to make the lab-based capnography indicator and that of the dye in an aqueous solution used to make the Easy Cap indicator; Figure S3: Schematic illustration of the set-up used to record the digital images of the indicator film under test when exposed to different, known levels of CO2 in CO2/Ar gas stream, generated using a gas blender. The key components of the system were (i) a digital camera, (ii) a glass gas cell with a detachable face, and (iii) the indicator film under test; Figure S4: Plots of A′ vs. [CO2(aq)] (in ppm) and % CO2 for (black circles, solid line) the lab-based and (open circles, broken line) the commercial Fluval BTB-based CO2 indicators for aquaria. Data from Table S3; Figure S5: Plots of regularly recorded, (a) digital photographic images and (b) UV/Vis absorption spectra of a NaHCO3 aqueous solution (1.43 mM) containing CR, initially saturated with 100% CO2 for 10 min and then allowed to lose the dissolved CO2 to ambient air over time and (c) subsequent plot of A vs A’ for the same solution, with values of A and A’ determined from the UV/Vis spectrum in (b) and the photographic images in (a), respectively; Figure S6: Plots of A′ vs. % CO2 for (black circles, solid line) the lab-based and (open circles, broken line) the commercial CR-based capnography CO2 indicators. Data from Table S4; Figure S7: Normal capnography waveform with (i) inspiration flat phase, (ii) expiration upstroke, (iii) alveolar plateau, and (iv) inspiration downstroke; Table S1: Wavelengths of the absorption maxima for the deprotonated and protonated forms of the BTB and CR dyes in aqueous solution; Table S2: Structures and pKas of BTB and CR; Table S3: Measured RGB(red), and calculated A′ and R data as a function of % CO2 for the lab-based and commercial BTB-based aquaria indicators; Table S4: Measured RGB(red), and calculated A′ and R data as a function of % CO2 for the lab-based and commercial CR-based capnography indicators.

Author Contributions

Conceptualization, A.M.; methodology, A.M. and L.M.; validation, L.M., D.Y. and C.O.; formal analysis, L.M., D.Y. and C.O.; investigation, L.M. and D.Y.; writing—original draft preparation, A.M. and L.M.; writing—review and editing, A.M., L.M. and D.Y.; supervision, A.M. and D.Y. All authors have read and agreed to the published version of the manuscript.

Funding

This work was funded by the EPSRC (EP/T007575/1).

Institutional Review Board Statement

Not applicable.

Informed Consent Statement

Not applicable.

Data Availability Statement

All data are provided in full in the results section of this paper and Supplementary Materials accompanying this paper.

Conflicts of Interest

The authors declare no conflict of interest.

References

  1. Mills, A. Optical sensors for carbon dioxide and their applications. In Sensors for Environment, Health and Security; Baraton, M.I., Ed.; Springer: Dordrecht, The Netherlands, 2009. [Google Scholar]
  2. Küçükhüseyin, Ö. CO2 monitoring and indoor air quality. REHVA Eur. HVAC J. 2021, 58, 54–59. [Google Scholar]
  3. The Atmosphere: Getting a Handle on Carbon Dioxide. Available online: https://climate.nasa.gov/news/2915/the-atmosphere-getting-a-handle-on-carbon-dioxide/#:~:text=The%20concentration%20of%20carbon%20dioxide,million%20(ppm)%20and%20rising (accessed on 7 November 2022).
  4. Falkenberg, L.J.; Bellerby, R.G.J.; Connell, S.D.; Fleming, L.E.; Maycock, B.; Russell, B.D.; Sullivan, F.J.; Dupont, S. Ocean acidification and human health. Int. J. Environ. Res. Public Health 2020, 17, 4563. [Google Scholar] [CrossRef] [PubMed]
  5. Langford, N.J. Carbon dioxide poisoning. Toxicol. Rev. 2005, 24, 229–235. [Google Scholar] [CrossRef] [PubMed]
  6. Gerlach, G.; Ulrich, G.; Oelßner, W. Carbon Dioxide Sensing, Fundamentals, Principles and Applications; Wiley-VCH: Weinhem, Germany, 2019. [Google Scholar]
  7. Parry, R.T. Principles and Applications of Modified Atmosphere Packaging of Foods; Springer: Boston, MA, USA, 1993. [Google Scholar]
  8. Aguayo-Lopez, M.L.; Capitan-Vallvey, L.F.; Fernandez-Ramos, M.D. Optical sensor for carbon dioxide gas determination, characterization and improvements. Talanta 2014, 126, 196–201. [Google Scholar] [CrossRef]
  9. Severinghaus, J.W.; Bradley, A.F. Electrodes for blood pO2 and pCO2 determination. J. Appl. Physiol. 1958, 13, 515–520. [Google Scholar] [CrossRef]
  10. Mills, A.; Eaton, K. Optical sensors for carbon dioxide: An overview of sensing strategies past and present. Quim. Anal. 2000, 19, 75–86. [Google Scholar]
  11. Dervieux, E.; Theron, M.; Uhring, W. Carbon dioxide sensing-biomedical applications to human subjects. Sensors 2021, 22, 188. [Google Scholar] [CrossRef]
  12. Puligundla, P.; Jung, J.; Ko, S. Carbon dioxide sensors for intelligent food packaging applications. Food Control 2012, 25, 328–333. [Google Scholar] [CrossRef]
  13. Yusufu, D.; Mills, A. Spectrophotometric and digital colour colourimetric (DCC) analysis of colour-based indicators. Sens. Actuators B 2018, 273, 1187–1194. [Google Scholar] [CrossRef] [Green Version]
  14. CO2: Striking the Balance. Available online: https://www.practicalfishkeeping.co.uk/features/co2-striking-the-balance/ (accessed on 7 November 2022).
  15. Fehder, C.G. Apparatus for Determining Whether Respiratory Gas is Present in a Gaseous Sample. US Patent 1991/ 5179002 A, 25 April 1991. [Google Scholar]
  16. ImageJ. Available online: https://imagej.nih.gov/ij/index.html (accessed on 7 November 2022).
  17. Mills, A.; Chang, Q. Tuning colourimetric and fluorimetric gas sensors for carbon dioxide. Anal. Chim. Acta 1994, 285, 113–123. [Google Scholar] [CrossRef]
  18. Tracheal Intubation. Available online: https://en.wikipedia.org/wiki/Tracheal_intubation (accessed on 7 November 2022).
  19. Umeda, A.; Ishizaka, M.; Ikeda, A.; Miyagawa, K.; Mochida, A.; Takeda, H.; Takeda, K.; Fukushi, I.; Okada, Y.; Gozal, D. Recent insights into the measurement of carbon dioxide concentrations for clinical practice in respiratory medicine. Sensors 2021, 21, 5636. [Google Scholar] [CrossRef] [PubMed]
  20. Williams, D.L.; Flaherty, T.J.; Alnasleh, B.K. Beyond λmax: Transforming visible spectra into 24-bit color values. J. Chem. Educ. 2007, 84, 1873–1877. [Google Scholar] [CrossRef]
  21. Ruttanakorn, K.; Phadungcharoen, N.; Laiwattanapaisal, W.; Chinsriwongkul, A.; Rojanarata, T. Smartphone-based technique for the determination of a titration equivalence point from an RGB linear-segment curve with an example application to miniaturized titration of sodium chloride injections. Talanta 2021, 233, 122602. [Google Scholar] [CrossRef]
  22. Lima, M.J.A.; Sasaki, M.K.; Marinho, O.R.; Freitas, T.A.; Faria, R.C.; Reis, B.F.; Rocha, F.R.P. Spot test for fast determination of hydrogen peroxide as a milk adulterant by smartphone-based digital image colorimetry. Microchem. J. 2020, 157, 105042. [Google Scholar] [CrossRef]
  23. Firdaus, M.; Aprian, A.; Meileza, N.; Hitsmi, M.; Elvia, R.; Rahmidar, L.; Khaydarov, R. Smartphone coupled with a paper-based colorimetric device for sensitive and portable mercury ion sensing. Chemosensors 2019, 7, 25. [Google Scholar] [CrossRef] [Green Version]
  24. Alberti, G.; Zanoni, C.; Magnaghi, L.R.; Biesuz, R. Disposable and low-cost colorimetric sensors for environmental analysis. Int. J. Environ. Res. Public Health 2020, 17, 8331. [Google Scholar] [CrossRef] [PubMed]
  25. Fernandes, G.M.; Silva, W.R.; Barreto, D.N.; Lamarca, R.S.; Lima Gomes, P.C.F.; Petruci, J.d.S.; Batista, A. Novel approaches for colorimetric measurements in analytical chemistry—A review. Anal. Chim. Acta 2020, 1135, 187–203. [Google Scholar] [CrossRef]
  26. Kanchi, S.; Sabela, M.I.; Mdluli, P.S.; Inamuddin; Bisetty, K. Smartphone based bioanalytical and diagnosis applications: A review. Biosens. Bioelectron. 2018, 102, 136–149. [Google Scholar] [CrossRef]
  27. Pan, Y.; Liu, X.; Qian, L.; Cui, Y.; Zheng, X.; Kang, Y.; Fu, X.; Wang, S.; Wang, P.; Wang, D. A hand-held optoelectronic tongue for the identification of heavy-metal ions. Sens. Actuators B 2022, 352, 130971. [Google Scholar] [CrossRef]
  28. Zhang, Y.; Lim, L.T. Colorimetric array indicator for NH3 and CO2 detection. Sens. Actuators B 2018, 255, 3216–3226. [Google Scholar] [CrossRef]
  29. Araki, H.; Kim, J.; Zhang, S.; Banks, A.; Crawford, K.E.; Sheng, X.; Gutruf, P.; Shi, Y.; Pielak, R.M.; Rogers, J.A. Materials and device designs for an epidermal UV colorimetric dosimeter with near field communication capabilities. Adv. Funct. Mater. 2017, 27, 1604465. [Google Scholar] [CrossRef]
  30. Naghdi, S.; Rezaei, M.; Abdollahi, M. A starch-based pH-sensing and ammonia detector film containing betacyanin of paperflower for application in intelligent packaging of fish. Int. J. Biol. Macromol. 2021, 191, 161–170. [Google Scholar] [CrossRef] [PubMed]
  31. Al Obaidi, A.; Karaca, I.M.; Ayhan, Z.; Haskaraca, G.; Gultekin, E. Fabrication and validation of CO2-sensitive indicator to monitor the freshness of poultry meat. Food Packag. Shelf Life 2022, 34, 100930. [Google Scholar] [CrossRef]
  32. Choi, I.; Choi, H.; Lee, J.S.; Han, J. Novel color stability and colorimetry-enhanced intelligent CO2 indicators by metal complexation of anthocyanins for monitoring chicken freshness. Food Chem. 2022, 404, 134534. [Google Scholar] [CrossRef]
  33. Heleine, M.F. Freshwater Aquariums for Dummies; Wiley: Hoboken, NJ, USA, 2020. [Google Scholar]
  34. Farmer, G. Aquascaping: A Step-by-Step Guide to Planting, Styling, and Maintaining Beautiful Aquariums; Skyhorse Publishing: New York, NY, USA, 2020. [Google Scholar]
  35. Anh, D.H.; Cheunrungsikul, K.; Wichitwechkarn, J.; Surareungchai, W. A colorimetric assay for determination of methyl parathion using recombinant methyl parathion hydrolase. Biotechnol. J. 2011, 6, 565–571. [Google Scholar] [CrossRef]
  36. Mook, W.G. Environmental Isotopes in the Hydrological Cycle: Principles and Applications; UNESCO and International Atomic Energy Agency: Paris, France, 2000. [Google Scholar]
  37. Long, B.; Koyfman, A.; Vivirito, M.A. Capnography in the emergency department: A review of uses, waveforms, and limitations. J. Emerg. Med. 2017, 53, 829–842. [Google Scholar] [CrossRef]
  38. Lederman, D.; Lampotang, S.; Shamir, M.Y. Automatic endotracheal tube position confirmation system based on image classification- a preliminary assessment. Med. Eng. Phys. 2011, 33, 1017–1026. [Google Scholar] [CrossRef]
  39. Rabitsch, W.; Nikolic, A.; Schellongowski, P.; Kofler, J.; Kraft, P.; Krenn, C.G.; Staudinger, T.; Locker, G.J.; Knöbl, P.; Hofbauer, R.; et al. Evaluation of an End-Tidal Portable ETCO2 Colorimetric Breath Indicator (COLIBRI). Am. J. Emerg. Med. 2004, 22, 4–9. [Google Scholar] [CrossRef]
  40. Banik, G.D.; Mizaikoff, B. Exhaled breath analysis using cavity-enhanced optical techniques: A review. J. Breath Res. 2020, 14, 043001. [Google Scholar] [CrossRef]
  41. Vincent, T.A.; Gardner, J.W. A low cost MEMS based NDIR system for the monitoring of carbon dioxide in breath analysis at ppm levels. Sens. Actuators B 2016, 236, 954–964. [Google Scholar] [CrossRef] [Green Version]
  42. Ward, K.R.; Yealy, D.M. End-tidal carbon dioxide monitoring in emergency medicine, Part 1: Basic principles. Acad. Emerg. Med. 1998, 5, 628–636. [Google Scholar] [CrossRef] [PubMed] [Green Version]
  43. Anton, W.R.; Gordon, R.W.; Jordan, T.M.; Posner, K.L.; Cheney, F.W. A Disposable End-Tidal CO2 Detector to Verify Endotracheal Intubation. Ann. Emerg. Med. 1991, 20, 271–275. [Google Scholar] [CrossRef] [PubMed]
  44. Gravenstein, J.S.; Jaffe, M.B.; Paulus, D.A. Capnography, 2nd ed.; Cambridge University Press: Cambridge, UK, 2011. [Google Scholar]
  45. Mercury Medical StatCO2® CO2 Detector. Available online: https://www.mercurymed.com/product/statco2-mini-statco2-neo-statco2/ (accessed on 7 November 2022).
  46. MaxCap™ CO2 Indicator. Available online: https://resources.sun-med.com/resource/maxcap-literature-sheet/ (accessed on 7 November 2022).
  47. FloCap™ CO2 Indicator. Available online: https://resources.sun-med.com/resource/flocap-literature-sheet/ (accessed on 7 November 2022).
  48. Ventlab STAT Check™ CO2 Indicator. Available online: https://www.buyemp.com/product/ventlab-statcheck-ii-co2-indicator-detection-device/SC200) (accessed on 7 November 2022).
  49. Nellcor™ Easy Cap II. Available online: https://coastbiomed.com/product/easy-cap-ii-co2-detector (accessed on 7 November 2022).
  50. How to Read and Interpret End-Tidal Capnography Waveforms. Available online: https://www.jems.com/patient-care/how-to-read-and-interpret-end-tidal-capnography-waveforms/ (accessed on 7 November 2022).
  51. Capnography Waveform Infographics. Available online: https://ne-np.facebook.com/FOAMfrat/posts/capnography-waveforms-part-2-of-3-of-our-capnography-infographics/3013262415612563/ (accessed on 7 November 2022).
  52. Mills, A.; Lepre, A.; Wild, L. Breath-by-breath measurement of carbon dioxide using a plastic film optical sensor. Sens. Actuators B 1997, 39, 419–425. [Google Scholar] [CrossRef]
  53. DCA Tutorial. Available online: https://www.profandrewmills.com/2022/10/dca-tutorial/ (accessed on 7 November 2022).
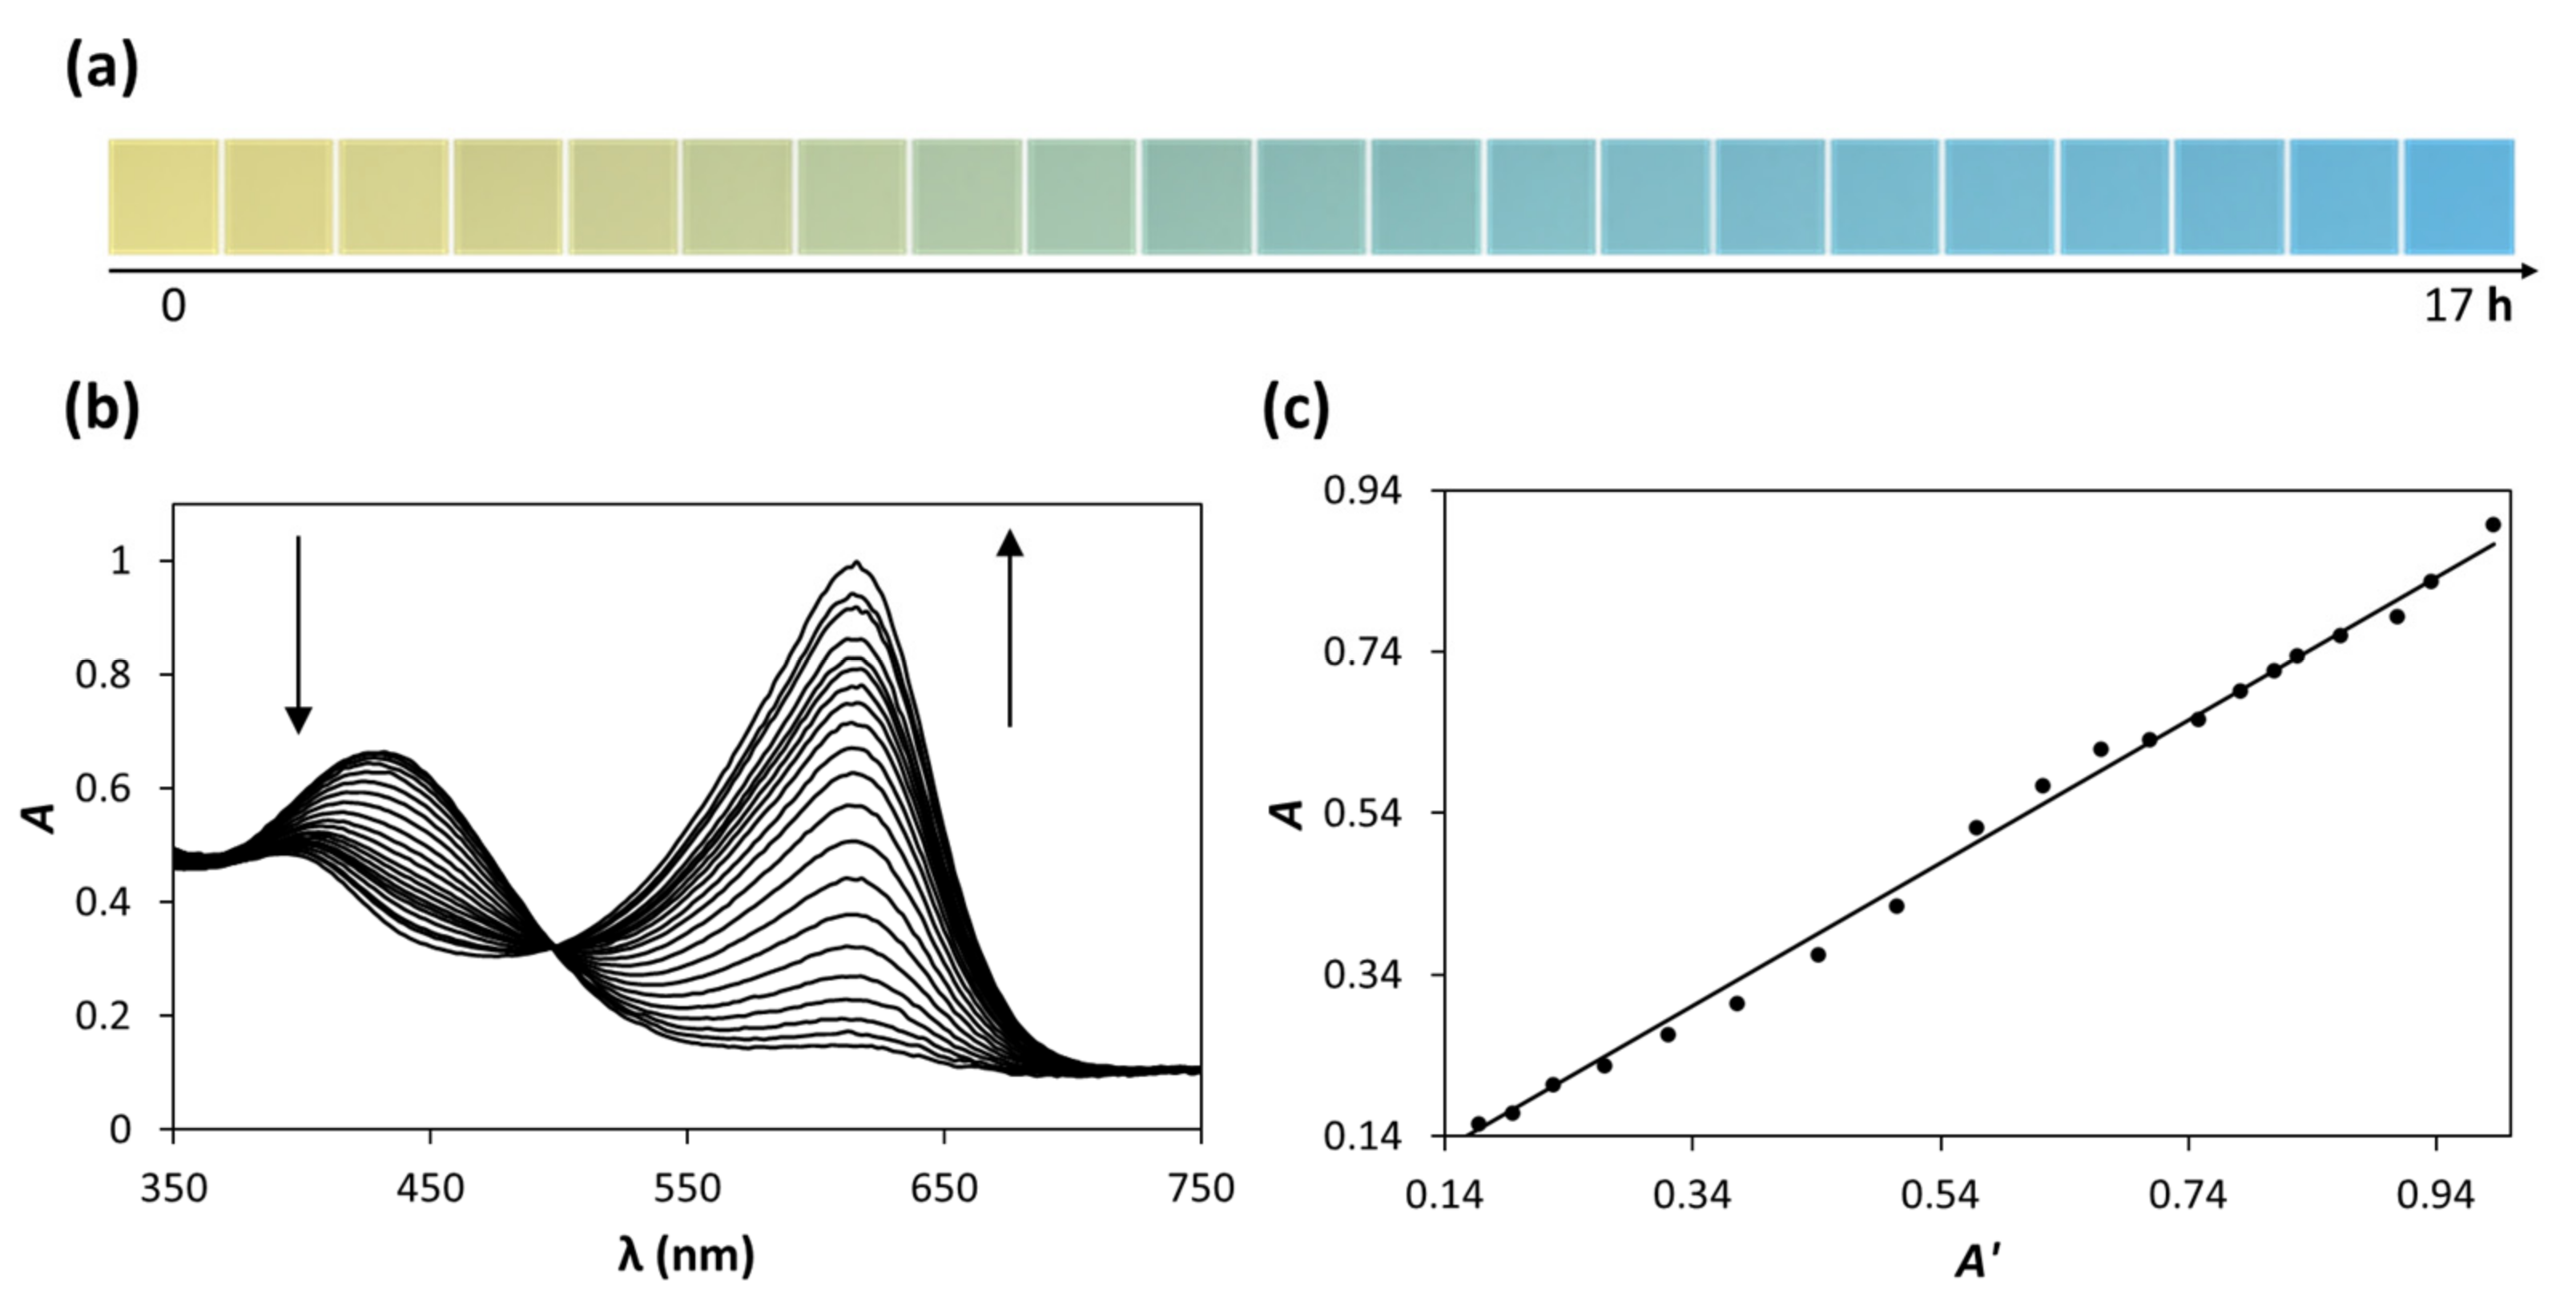
Figure 1. Regularly recorded, (a) digital photographic images and (b) UV-vis absorption spectra of a NaHCO3 aqueous solution (1.43 mM) containing 2.71 × 10⁻⁵ M BTB, initially saturated with 100% CO2 for 10 min and then allowed to lose the dissolved CO2 to ambient air over time and (c) subsequent plot of A vs. A′ for the same solution, with values of A and A′ determined from the UV-vis spectra in (b) and the photographic images in (a), respectively.
Chemosensors 10 00544 g001
Figure 2. Photographs of the aquaria CO2 drop checker, manufactured by Fluval Aquatics Ltd., mounted on the inside of a fish tank with the colour of the BTB CO2 solution ideally indicating (left) low CO2 levels, (centre) ‘good’ CO2 levels, and (right) high CO2 levels. The composition of the Fluval indicator solution is almost identical to that used in Figure 1.
Chemosensors 10 00544 g002
Figure 3. Photographs of (a) the lab-based drop check indicator and (b) Fluval indicator solutions when sparged with different CO2/Ar gas mixtures. The plots in (c) are of R vs. [CO2(aq)], where the values of R were calculated using Equation (8) and the apparent absorbance values determined from the digital images in (a) and (b). The solid and broken lines are those of best fit to the data for the lab-based drop check (black dots) and Fluval (open circles) indicators, respectively.
Chemosensors 10 00544 g003
Figure 4. Schematic illustration of the key components of a Nellcor™ Easy Cap II Adult Colourimetric CO2 Detector, the ‘Easy Cap detector’, where (i) is the outer plastic casing with colour wheel, (ii) Easy Cap indicator film, (iii) internal plastic support, (iv) white water-vapour absorbing layer and (v) and (vi) are the endotracheal tube and air/anaesthetic inlet gas connections, respectively.
Chemosensors 10 00544 g004
Figure 5. Photographs of (a) lab-based drop capnography indicator and (b) Easy Cap indicator films when sparged with different CO2/Ar gas mixtures. The plots in (c) are of R vs. % CO2, where the values of R were calculated using Equation (5) and the apparent absorbance values determined from the digital images in (a,b). The solid and broken lines are those of best fit to the data for the lab-based capnography indicator (black dots) and Easy Cap (open circles) indicators, respectively; the gradients of the lines of best fit, i.e., α in Equation (5), were 0.88 and 0.93% CO2−1, respectively.
Chemosensors 10 00544 g005
Figure 6. Plot of the % CO2 vs. time profiles recorded using a (a) lab-based capnography indicator and (b) Easy Cap indicator, when exposed to a cycle of inhaled and exhaled breath. Each profile was constructed using DCA to determine A′ at any time t, and Equation (5) and the appropriate value of α to then convert it to a value of % CO2.
Chemosensors 10 00544 g006
Publisher’s Note: MDPI stays neutral with regard to jurisdictional claims in published maps and institutional affiliations.