Article

An Economical and Portable Paper-Based Colorimetric Sensor for the Determination of Hydrogen Peroxide-Related Biomarkers

1
Chongqing Key Laboratory of High Active Traditional Chinese Drug Delivery System, Chongqing Medical and Pharmaceutical College, Chongqing 401331, China
2
School of Chemistry and Chemical Engineering, Chongqing University, Chongqing 401331, China
*
Author to whom correspondence should be addressed.
Chemosensors 2022, 10(8), 335; https://doi.org/10.3390/chemosensors10080335
Submission received: 5 July 2022 / Revised: 11 August 2022 / Accepted: 15 August 2022 / Published: 17 August 2022

Abstract

:
In this study, a paper-based sensor was developed for the detection of hydrogen-peroxide-related biomarkers, with glucose oxidase catalyzing as an example. Potassium iodide can catalyze the oxidation of 3,3′,5,5′-tetramethylbenzidine in the presence of hydrogen peroxide to colorize the paper-based biosensor detection area, which was imaged by a scanner, and the color intensity was analyzed by the Adobe Photoshop. Under the optimal conditions, the color intensity shows a good linear relationship with hydrogen peroxide and glucose concentrations in the ranges of 0.1–5.0 mM and 0.5–6.0 mM, respectively. The detection limit of hydrogen peroxide is 0.03 mM and the limit of quantification of glucose is 0.5 mM. Besides, the method was employed in measuring glucose concentration in fruit samples, and the spiked recoveries are in the range of 95.4–106.1%. This method is cost-effective, environmentally friendly, and easy to be operated, which is expected to realize the point-of-care testing of more hydrogen-peroxide-related biomarkers.

1. Introduction

A biosensor is a device that can convert interactions of biological molecules (including enzymes, nucleic acids, antibodies, and microorganisms) with other molecules or analytes into useful analysis signals [1]. At present, some biosensors with high specificity and sensitivity have been developed for medical care, environmental monitoring, food science and other fields, but there is still great room for the design and development of a biosensor device for point-of-care testing (POCT) [2]. Different from the traditional laboratory tests that require expensive instruments, complex operations and professional operators, users can use a POCT device for testing in a resource-limited environment almost without training [3]. Therefore, a POCT device has great application potential in developing countries, remote areas, and family testing. A POCT device should be portable and have a “sample-in-answer-out” system, so the development of a POCT device is also focused on miniaturization and integration [4].
In recent years, the analytical equipment based on cellulose filter paper has attracted much attention due to its unique advantages, such as it being abundant in nature, easy to obtain and degrade [5], as well as it being easy to be chemically modified [6]. Moreover, the large specific surface area and porous structure of cellulose filter paper help the target analyte to be rapidly adsorbed and diffused to the detection site [7]. Therefore, biosensors based on cellulose filter paper are usually of low cost, environmentally friendly, good biocompatibility, simple operation, and low consumption of samples and reagents, which are ideal POCT devices [8,9,10]. The detection signal of a paper-based colorimetric biosensor depends on the visual display, which can be viewed by naked eyes or smart phones and portable scanners. Numerous reports are focused on the research of paper-based colorimetric biosensors for medical diagnosis [11,12], pharmaceutical analysis [13], food safety control [14,15], and environmental protection [16,17,18]. For example, Moreira et al. [11] used cellulose filter paper as a testing platform, and molecularly imprinted polymer was applied to the surface of paper to form a detection layer. Coomassie blue was used as a dyeing dye to design and produce a test strip that can be used to detect amyloid β-42, a biomarker of Alzheimer‘s disease. A digital camera was used for photographing, an ImageJ program was used for processing color data, and the test strip can achieve quantitative detection of amyloid β-42 in the linear range of 1.0 ng/mL–10 μg/mL. Gong et al. [13] formed a polycaprolactone hydrophobic barrier on the cellulose filter paper by 3D printing, fixed xanthine oxidase (XOD) in the detection area of the lower filter paper, and fixed xanthine and chromogenic agent nitrotetrazolium blue chloride in the detection area of the upper filter paper. The two papers overlapped to form a piece of double-layer paper-based analysis equipment. The buffer solution was dropped onto the upper filter paper, and the reagents were brought into the lower layer for color reaction. When xanthine oxidase inhibitors exist in the solution, the color reaction will be inhibited. Finally, the inhibition activity of XOD in Salvia miltiorrhiza extracts were detected by this paper-based analysis equipment. Li et al. [15] fabricated a paper-based biosensor for malathion detection by fixing malathion hydrolase PoOPHM9 on cellulose filter paper by Pluronic F127-poly(acrylic acid)-enzyme conjugates. This interlocking network is conducive to the retention of enzyme activity. Malathion reacted with PoOPHM9 to produce mercaptan, which reacted with Ellman’s reagent, 5,5′-dithiobis (2-nitrobenzoic acid), and showed bright yellow or dark yellow for colorimetric detection. Using smart phones and image analysis software, the prepared paper-based biosensor can achieve the rapid colorimetric detection of 0.1–50 M malathion in 5 min. In short, the microfluidic analysis equipment with cellulose filter paper as the main recognition element has its unique advantages, which makes it possible to develop an analysis method with a simple instrument and operation.
Hydrogen peroxide (H2O2), which is an important reactive oxygen species that mediates many physiological processes in mammals, is one of the products of many oxidases [19]. Therefore, it is of great significance to realize the sensitive detection of H2O2. Horseradish peroxidase (HRP) is often involved in the catalytic oxidation of H2O2 and chromogenic reagent, which has been widely used in paper-based colorimetric sensors for the detection of glucose, hypoxanthine, lactic acid, glutamic acid, and uric acid through enzymatic cascade reactions [9,20,21]. Mooltongchun et al. [9] constructed a paper-based colorimetric biosensor for the detection of hypoxanthine based on XOD and HRP-mediated double-enzyme catalytic reactions using o-dianisidine as chromogenic agent. Paper-based colorimetric biosensor can realize the quantitative detection of hypoxanthine within 5–40 mg/L in 5 min, and the detection line and quantitative limit are 1.8 and 6.1 mg/L, respectively. With 4-aminoantipyrine/3,5-dichloro-2-hydroxy-benzenesulfonic acid and 4-aminoantipyrine/N-ethyl-N-(3-sulfopropyl)-3-methyl-aniline sodium salt as chromogenic reagent, Feng et al. [21] realized the simultaneous detection of glucose and uric acid in a paper-based microfluidic device by the dual-enzyme catalytic reaction of oxidase (glucose oxidase (GOx) and uricase) and HRP. However, as a natural enzyme, HRP has the limitations of time-consuming preparation and purification, high cost and sensitivity to temperature and pH [22]. Therefore, some substances with peroxidase-like activity begin to replace HRP in catalytic oxidation. Some nanomaterials, such as carbon nanomaterials, metal oxides, metal organic frameworks, noble metal nanoparticles and composites nanomaterials, have been reported to have peroxidase-like activities [23]. However, the synthesis conditions of these nanomaterials are usually harsh and complex, which will also cause certain harm to the environment and biology. It has been reported that iodide can oxidize colorless 3,3′,5,5′-tetramethylbenzidine (TMB) to the blue oxidized TMB (oxTMB) in the presence of H2O2, and iodide has the advantages of being inexpensive and does not require additional modification [24,25,26].
In this study, a universal paper-based colorimetric device was constructed and the POCT of H2O2-related biomarkers were carried out with a portable scanner. Taking GOx as an example, the paper-based biosensor was used to detect glucose in real samples. As shown in Scheme 1A, GOx catalyzes the oxidation of glucose to gluconic acid and H2O2 in the presence of oxygen. H2O2 oxidizes potassium iodide (KI) to iodic acid (HIO3). The HIO3 catalyzes the oxidation of colorless TMB to blue oxTMB in the acidic conditions. According to this principle, the mixed solution of GOx, TMB, and KI was dropped on the paper to prepare the paper-based biosensor (Scheme 1B). When the sample solution containing glucose was added to the paper-based biosensor, the color of the paper-based biosensor changed from colorless to blue and the glucose content in the sample can be determined. Finally, the performance of the paper-based biosensor was studied, and the method was applied in the detection of glucose in three kinds of fruit samples.

2. Materials and Methods

2.1. Materials and Reagents

KI, TMB, and maltose were purchased from Adamas-beta Reagent Co., Ltd. (Shanghai, China). H2O2 (30%), sodium dihydrogen phosphate, phosphoric acid, D-galactose, D-fructose, ascorbic acid, and D(−)-arabinose were purchased from Chengdu Chron Chemicals Co., Ltd. (Chengdu, China). GOx (265 U/mg), D(+)-anhydrous glucose, and D(+)-xylose were purchased from Shanghai Yuanye Bio-Technology Co., Ltd. (Shanghai, China). Sodium hydroxide was purchased from Titan Scientific Co., Ltd. (Shanghai, China). Sucrose was purchased from Aladdin Reagent Co., Ltd. (Shanghai, China). Ethanol was purchased from Chongqing Chuandong Chemical (Group) Co., Ltd. (Chongqing, China). TMB was prepared in ethanol, other chemicals were prepared in deionized water. Pear (Pyrus bretschneideri), apple (Malus pumila Mill), and coconut (Cocos nucifera Linnaeus) were purchased from a local fruit store. Adhesive polyvinyl chloride (PVC) backing was purchased from Shanghai Jieyi Biotechnology Co., Ltd. (Shanghai, China). Whatman grade 1 filter paper was purchased from GE (China) Co., Ltd. (Shanghai, China) and used in the fabrication of paper-based sensor.

2.2. Instrumentation

A UV-2600 UV–visible spectrophotometer (SHIMADZU, Kyoto, Japan) was used for spectrophotometric analysis. A DZF-6012 vacuum drying oven (Shanghai Yiheng Technology Instrument Co., Ltd., Shanghai, China) was used for drying during the fabrication of paper-based biosensor. The images were taken by a Canon Lide 400 scanner (Canon, Beijing, China) and analyzed by the Adobe Photoshop CC 2018.

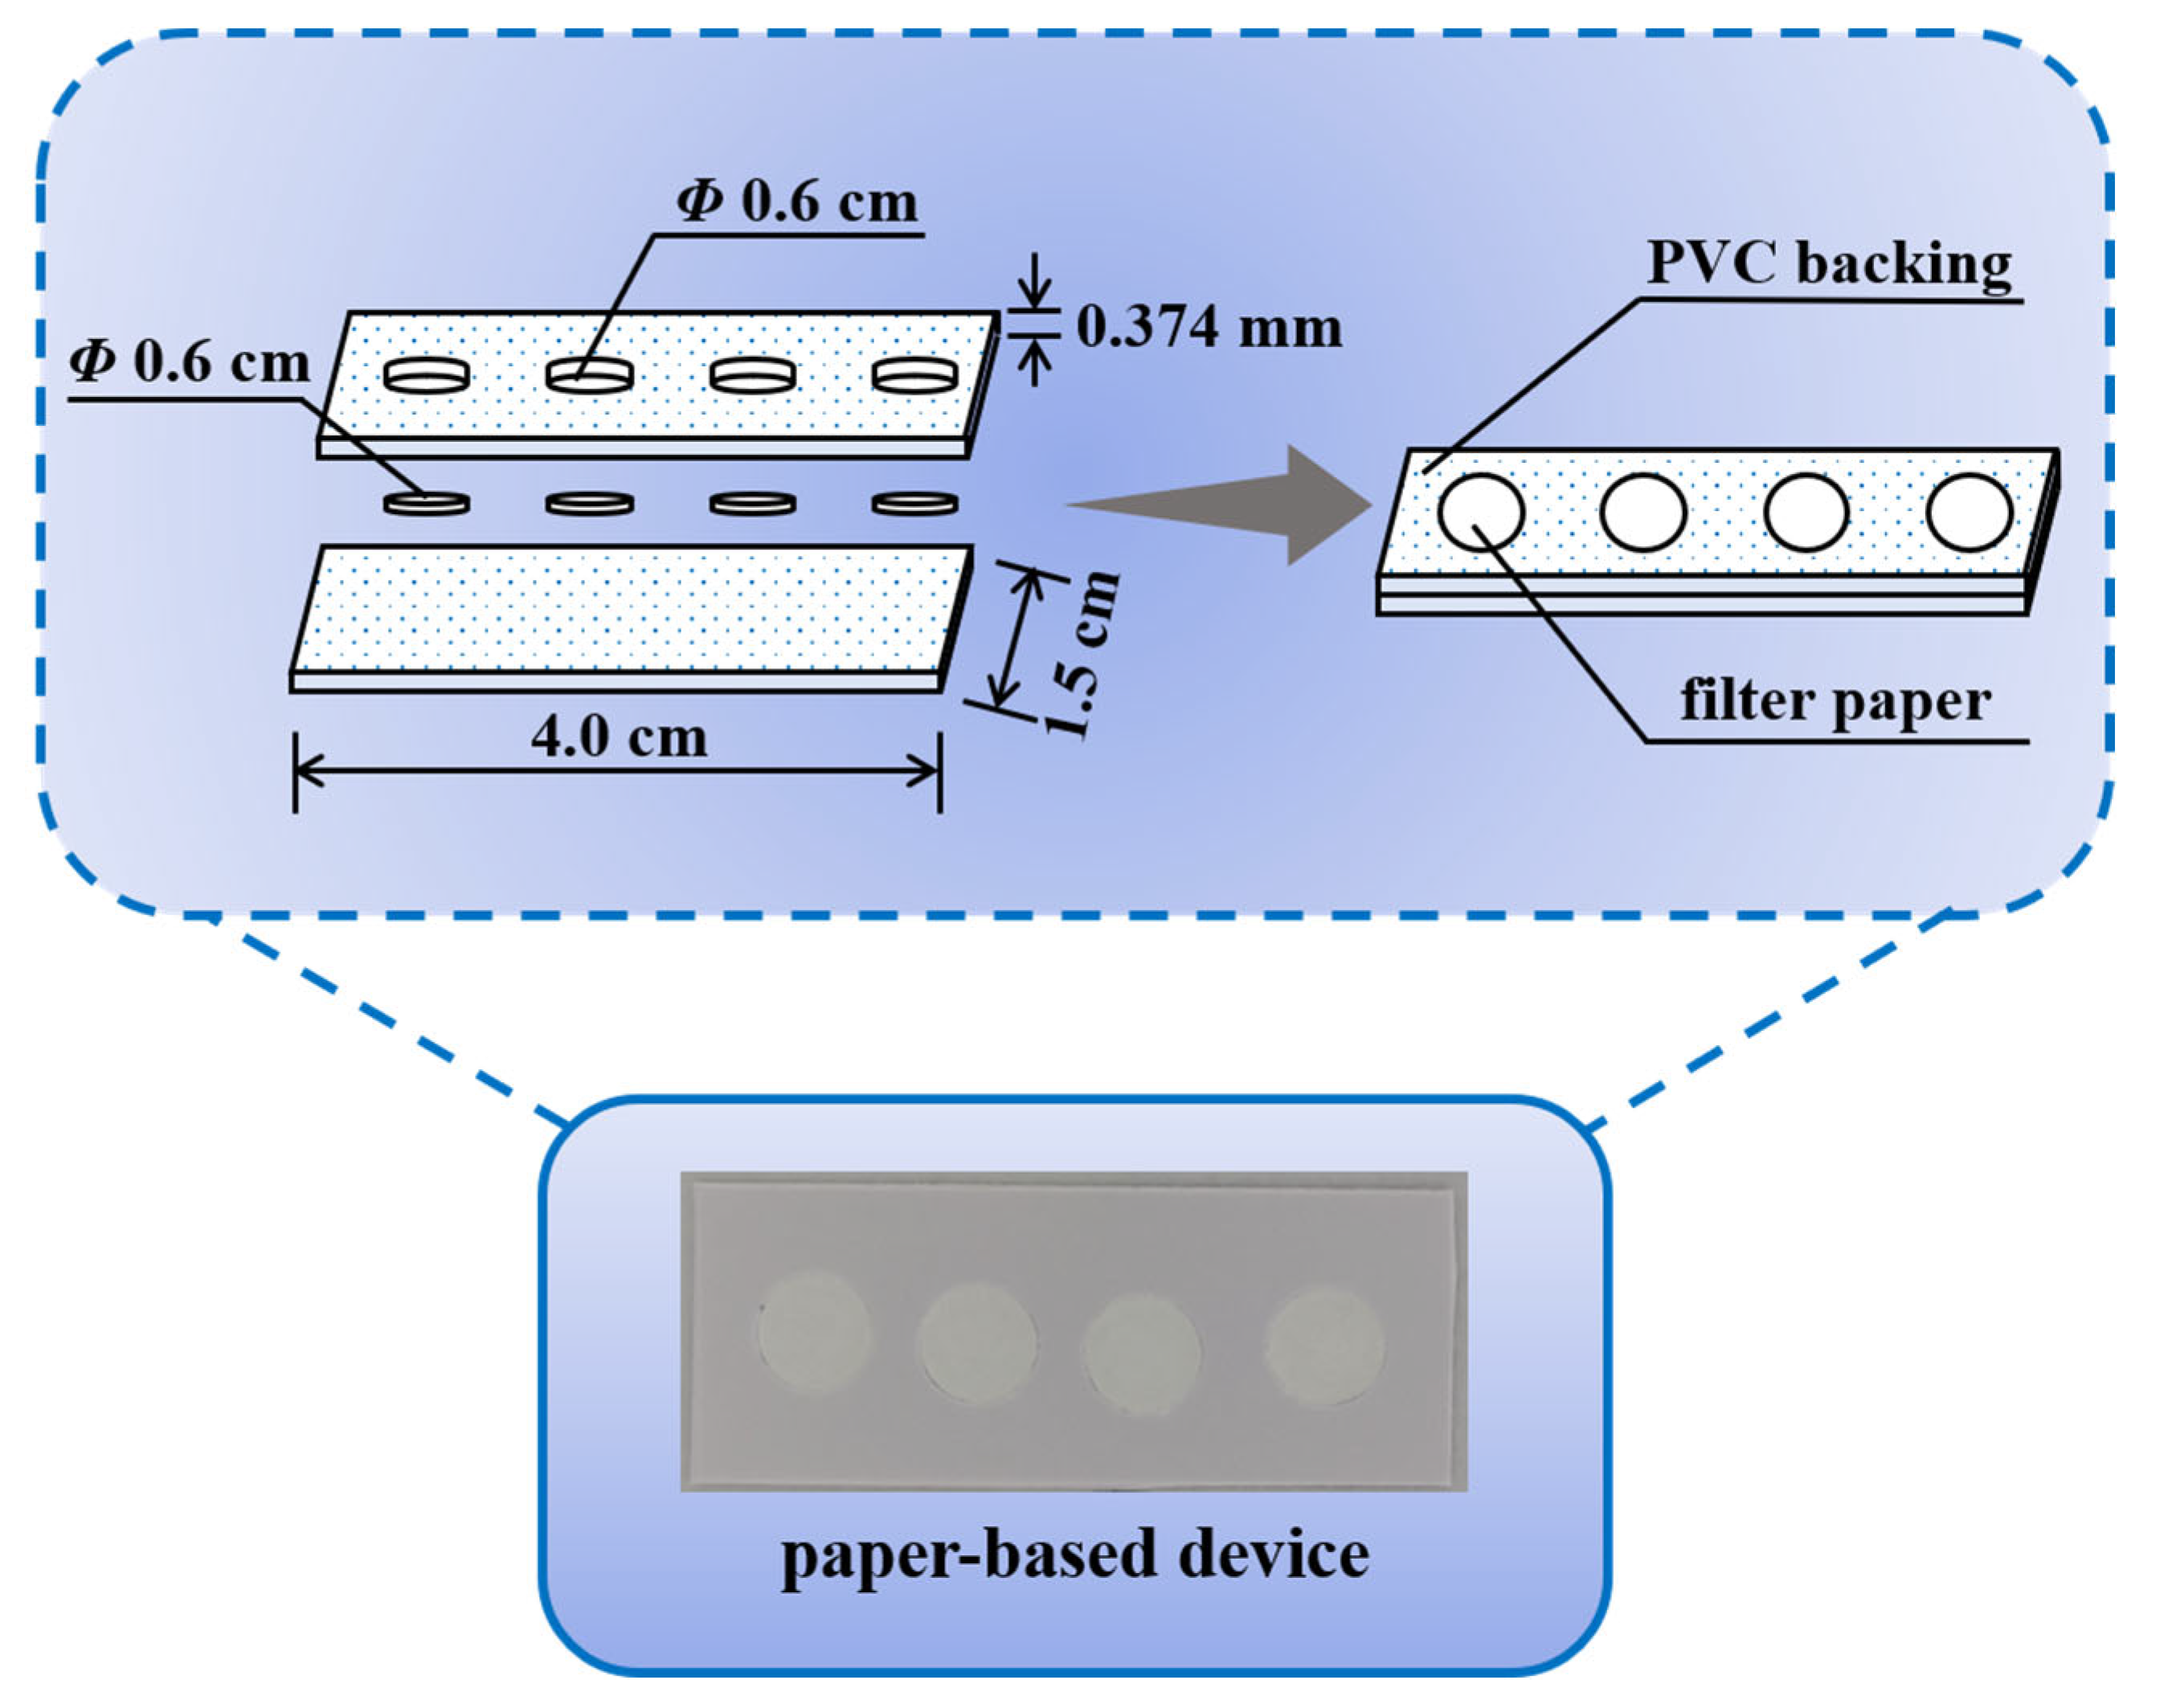
2.3. Fabrication of Paper-Based Device

The structure of the paper-based device is shown in Figure 1. In brief, the adhesive PVC backing was cut into small plates with a size of 1.5 × 4.0 cm by a paper cutter (Deli Group Co., Ltd., Ningbo, China). A PVC small plate was evenly punched with four small holes with a diameter of 6.0 mm by a puncher (Deli Group Co., Ltd., Ningbo, China). The covering paper on the back was torn off and stuck on the front of another complete PVC small plate. The Whatman grade 1 filter paper was punched into a small circular piece with a diameter of 6.0 mm, and was embedded into the circular hole in the PVC small plate as the detection area. Then, 6 μL mixture solution containing 7.0 mM of KI and 4.0 mM of TMB in pH 6 were dropped on the detection area to prepare the paper-based sensor. In total, 6 μL mixture solution containing 7.0 mM of KI, 4.0 mM of TMB, and 0.083 mg/mL of GOx in pH 6 were dropped on the detection area to prepare the paper-based biosensor. Finally, the paper-based sensor and paper-based biosensor were dried in a vacuum drying oven at 40 °C for 5.0 min, and were stored in a sealed vacuum bag at 4 °C to maintain the enzyme activity and prevent potassium iodide from being oxidized by the air.

2.4. Colorimetric Detection of H2O2 and Glucose

H2O2 and glucose were measured by the developed paper-based device. A mixture of KI and TMB in pH 6 was used for the analysis of H2O2, while a mixture of KI, TMB, and GOx in pH 6 was used for the analysis of glucose. For H2O2 assay, 6 μL of H2O2 of a certain concentration was dropped on the detection area of the paper-based sensor and reacted for 35 min at 25 °C. For glucose assay, 6 μL of glucose of certain concentration was dropped on the detection area of the paper-based biosensor and reacted for 45 min at 25 °C. The color change on the paper was measured by a Canon Lide 400 scanner (Canon, Beijing, China) with a resolution of 600-dpi. Adobe Photoshop CC 2018 was used for the analysis to obtain the Red-Green-Blue (RGB) channel strength, and the red channel strength was used to construct the calibration curve. All tests were repeated at least three times, and the data are shown as mean ± standard deviation (n ≥ 3).

2.5. Glucose Assay of Practical Samples

To verify the feasibility of the paper-based biosensor in practical sample analysis, the glucose levels in three fruit samples were determined by the proposed method. In brief, the apple and pear samples were peeled and cut into small pieces. Then, 100.0 g pulp of fruit sample was homogenized for 5.0 min using a portable juice blender (Leshui Electric Co., Ltd., Taizhou, China). The homogenate was stood for 20.0 min, and the supernatant was filtered through a 0.22 μm nylon membrane filter (Tianjin Navigator Lab Instrument Co., Ltd., Tianjin, China) to remove solid impurities. Coconut samples were directly made from coconut water filtered through a 0.22 μm nylon membrane filter to remove solid impurities. Before analysis, the fruit samples were diluted 80 times with deionized water to ensure that the initially detected glucose concentrations are within the linear range of this work. Different concentrations of glucose (1.0, 2.0, and 3.0, respectively) were spiked into fruit sample solution. Then, 6.0 μL of fruit sample solution was added to the detection area of paper-based biosensor and reacted at 25 °C for 45.0 min. The recoveries of fruit samples spiked with glucose were calculated by the linear relationship between the glucose concentration and the red channel strength.

3. Results

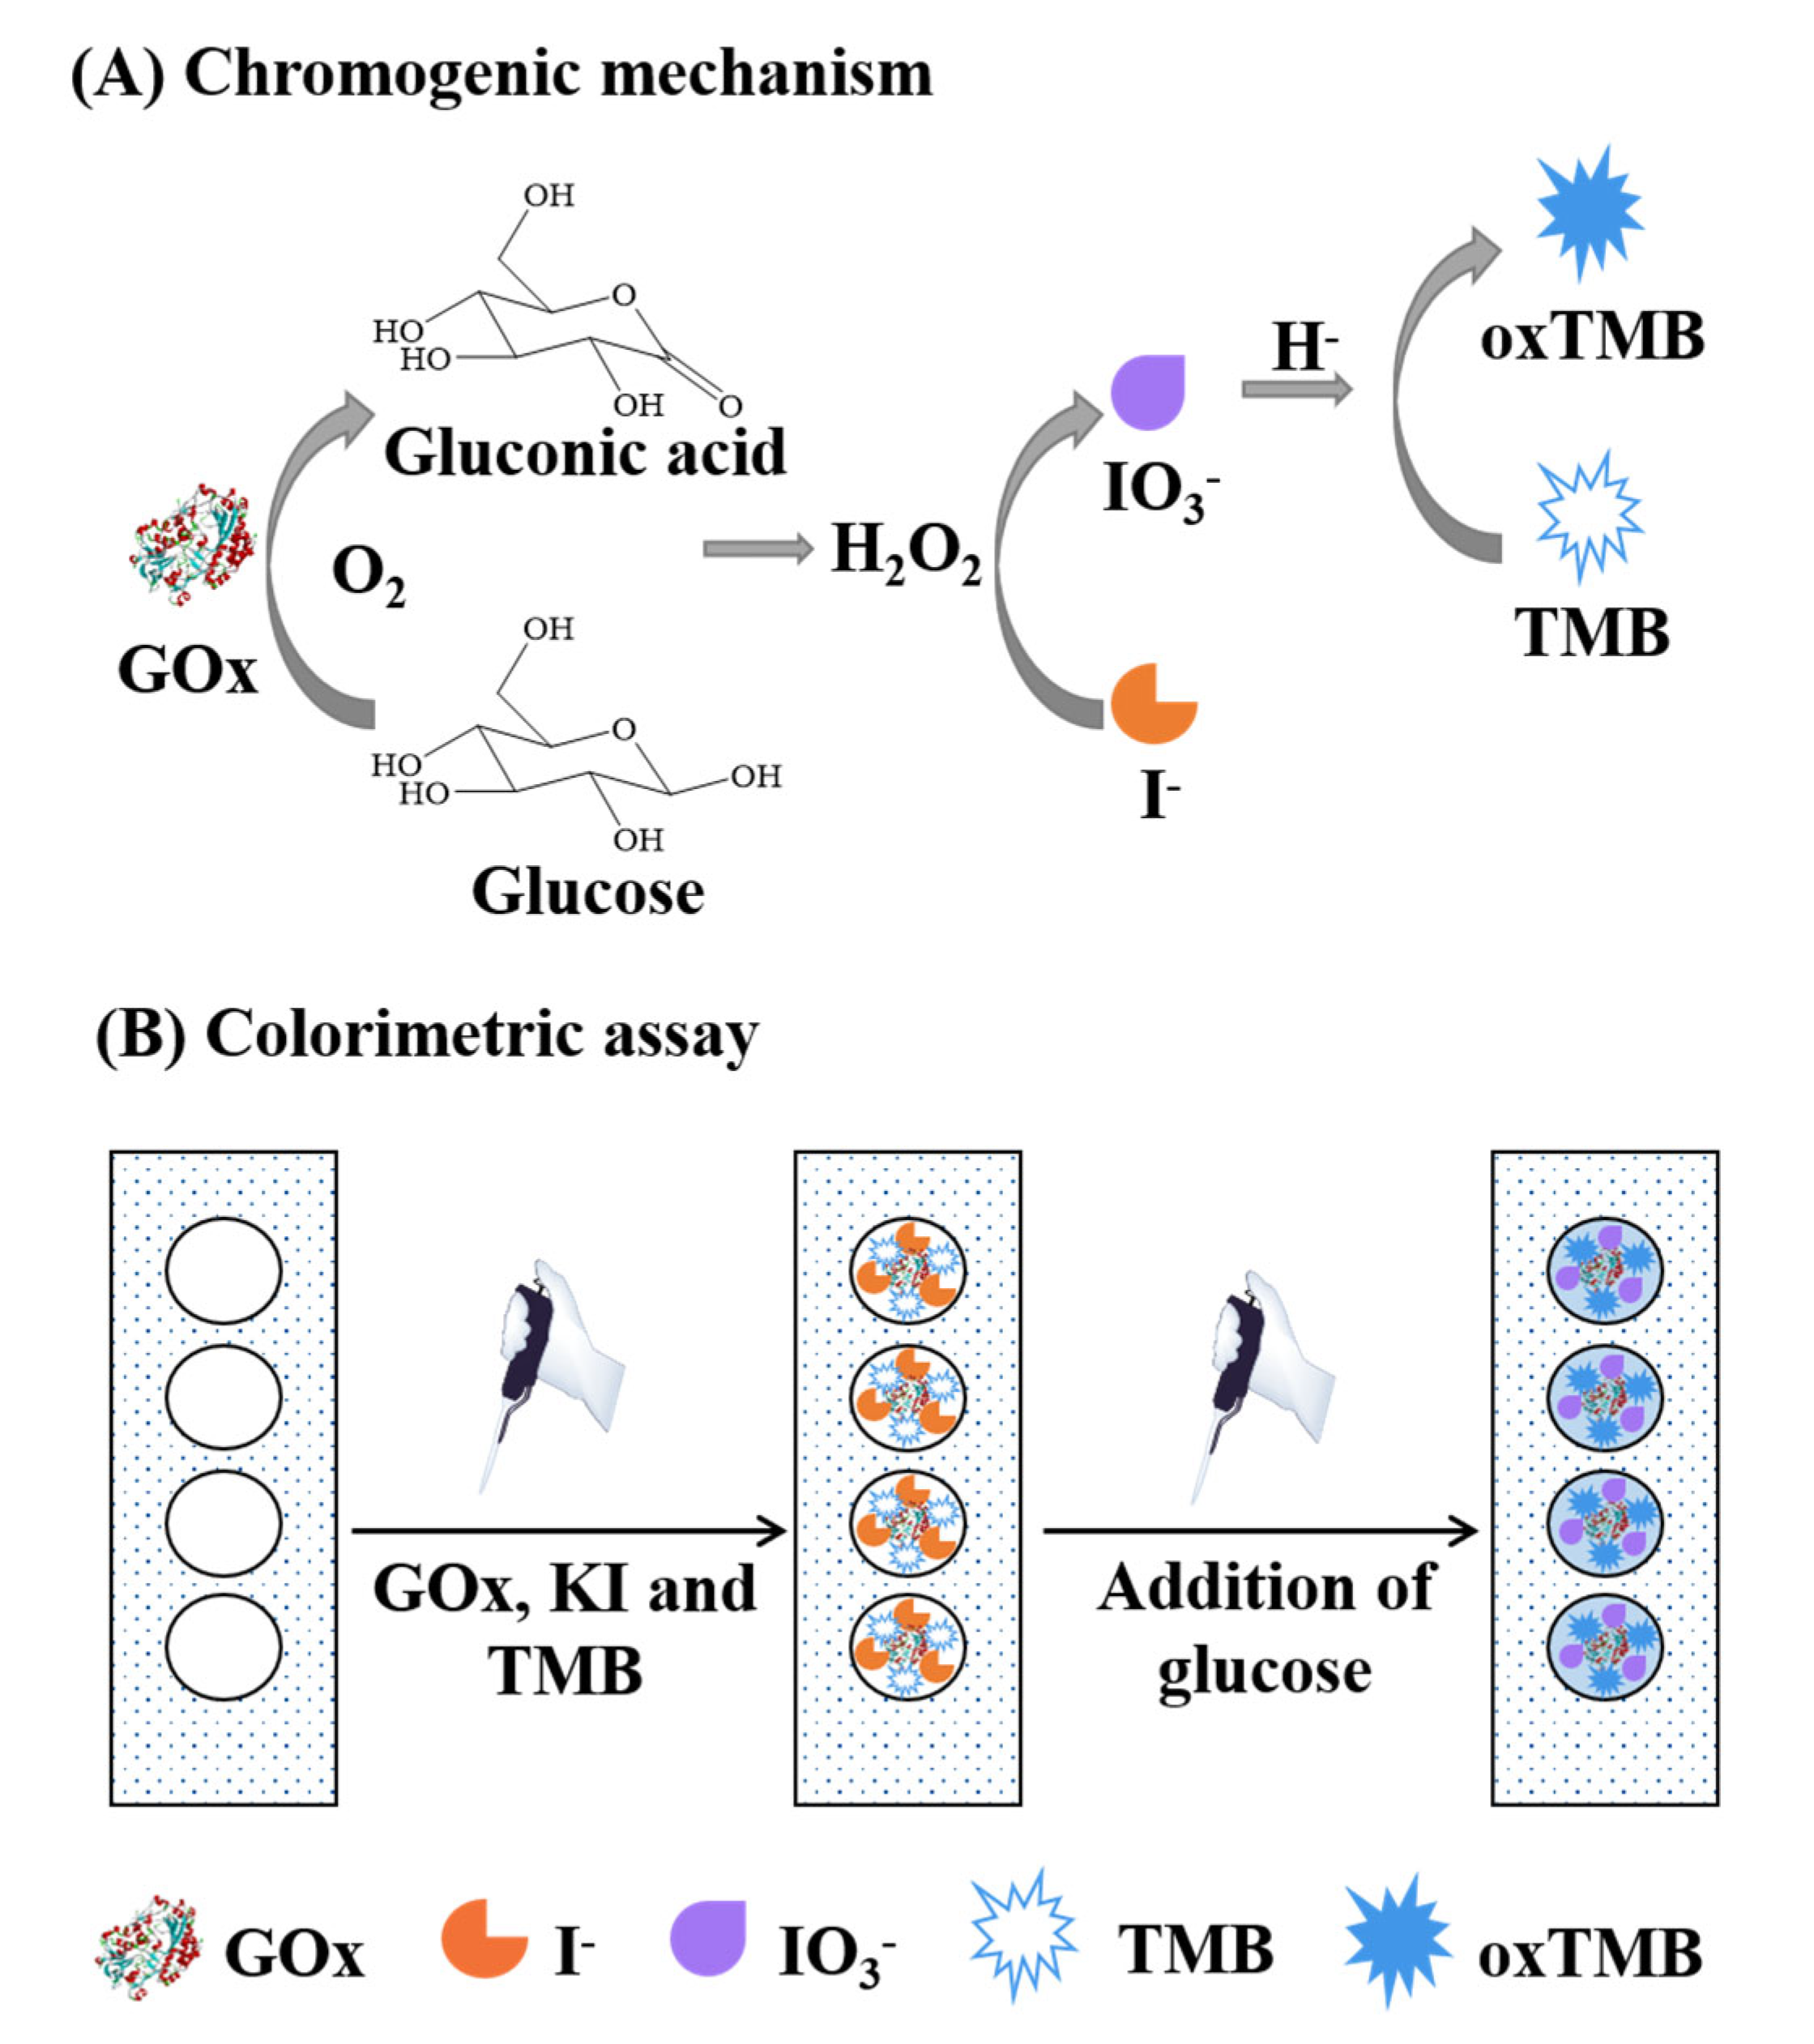
3.1. Design Principle of the Paper-Based Biosensor

In the presence of H2O2, KI can oxidize the colorless TMB to blue oxTMB by three steps [25]. First, H2O2 oxidizes KI to I2: 2KI + H2O2 → I2 + 2KOH. Then, H2O2 further oxidizes I2 to HIO3: I2 + 5H2O2 → 2HIO3 + 4H2O. Finally, HIO3 oxidizes TMB to oxTMB under acidic conditions, described by the following reaction: 3TMB + IO3 + 6H+ → 3oxTMB + I + 3H2O. In this study, a paper-based sensor was constructed based on the KI-TMB system for the determination of H2O2 and was further applied in the determination of H2O2-related biomarkers. As shown in Figure 2, TMB, KI, and H2O2 solutions were colorless and had no absorption peaks in the UV–Vis absorption spectra. The pairings of TMB, KI, and H2O2 also showed colorless and no oxTMB characteristic absorption peaks. These results indicate that H2O2 is not sufficient to oxidize TMB in the absence of a catalyst, and I cannot oxidize and discolor TMB. In addition, the reaction products of H2O2 and KI do not produce absorption peaks and colors to interfere with the oxTMB detection. When TMB, KI, and H2O2 coexisted, the blue oxTMB was generated and a strong characteristic absorption peak appeared at 652 nm. The characteristic absorption peak of oxTMB at 652 nm detected by UV–visible spectrophotometer can reflect the concentration of oxTMB in the reaction system, and then correlate to the concentration of H2O2. This reaction system was transferred to the paper-based sensor, and the concentration of H2O2 in the sample can be quantified according to the color change caused by oxTMB in the sensor. Furthermore, GOx can catalyze the oxidation of glucose to generate gluconic acid and H2O2 in the presence of dioxygen. Therefore, the addition of GOx in the KI-TMB detection system can be further used for the detection of glucose.

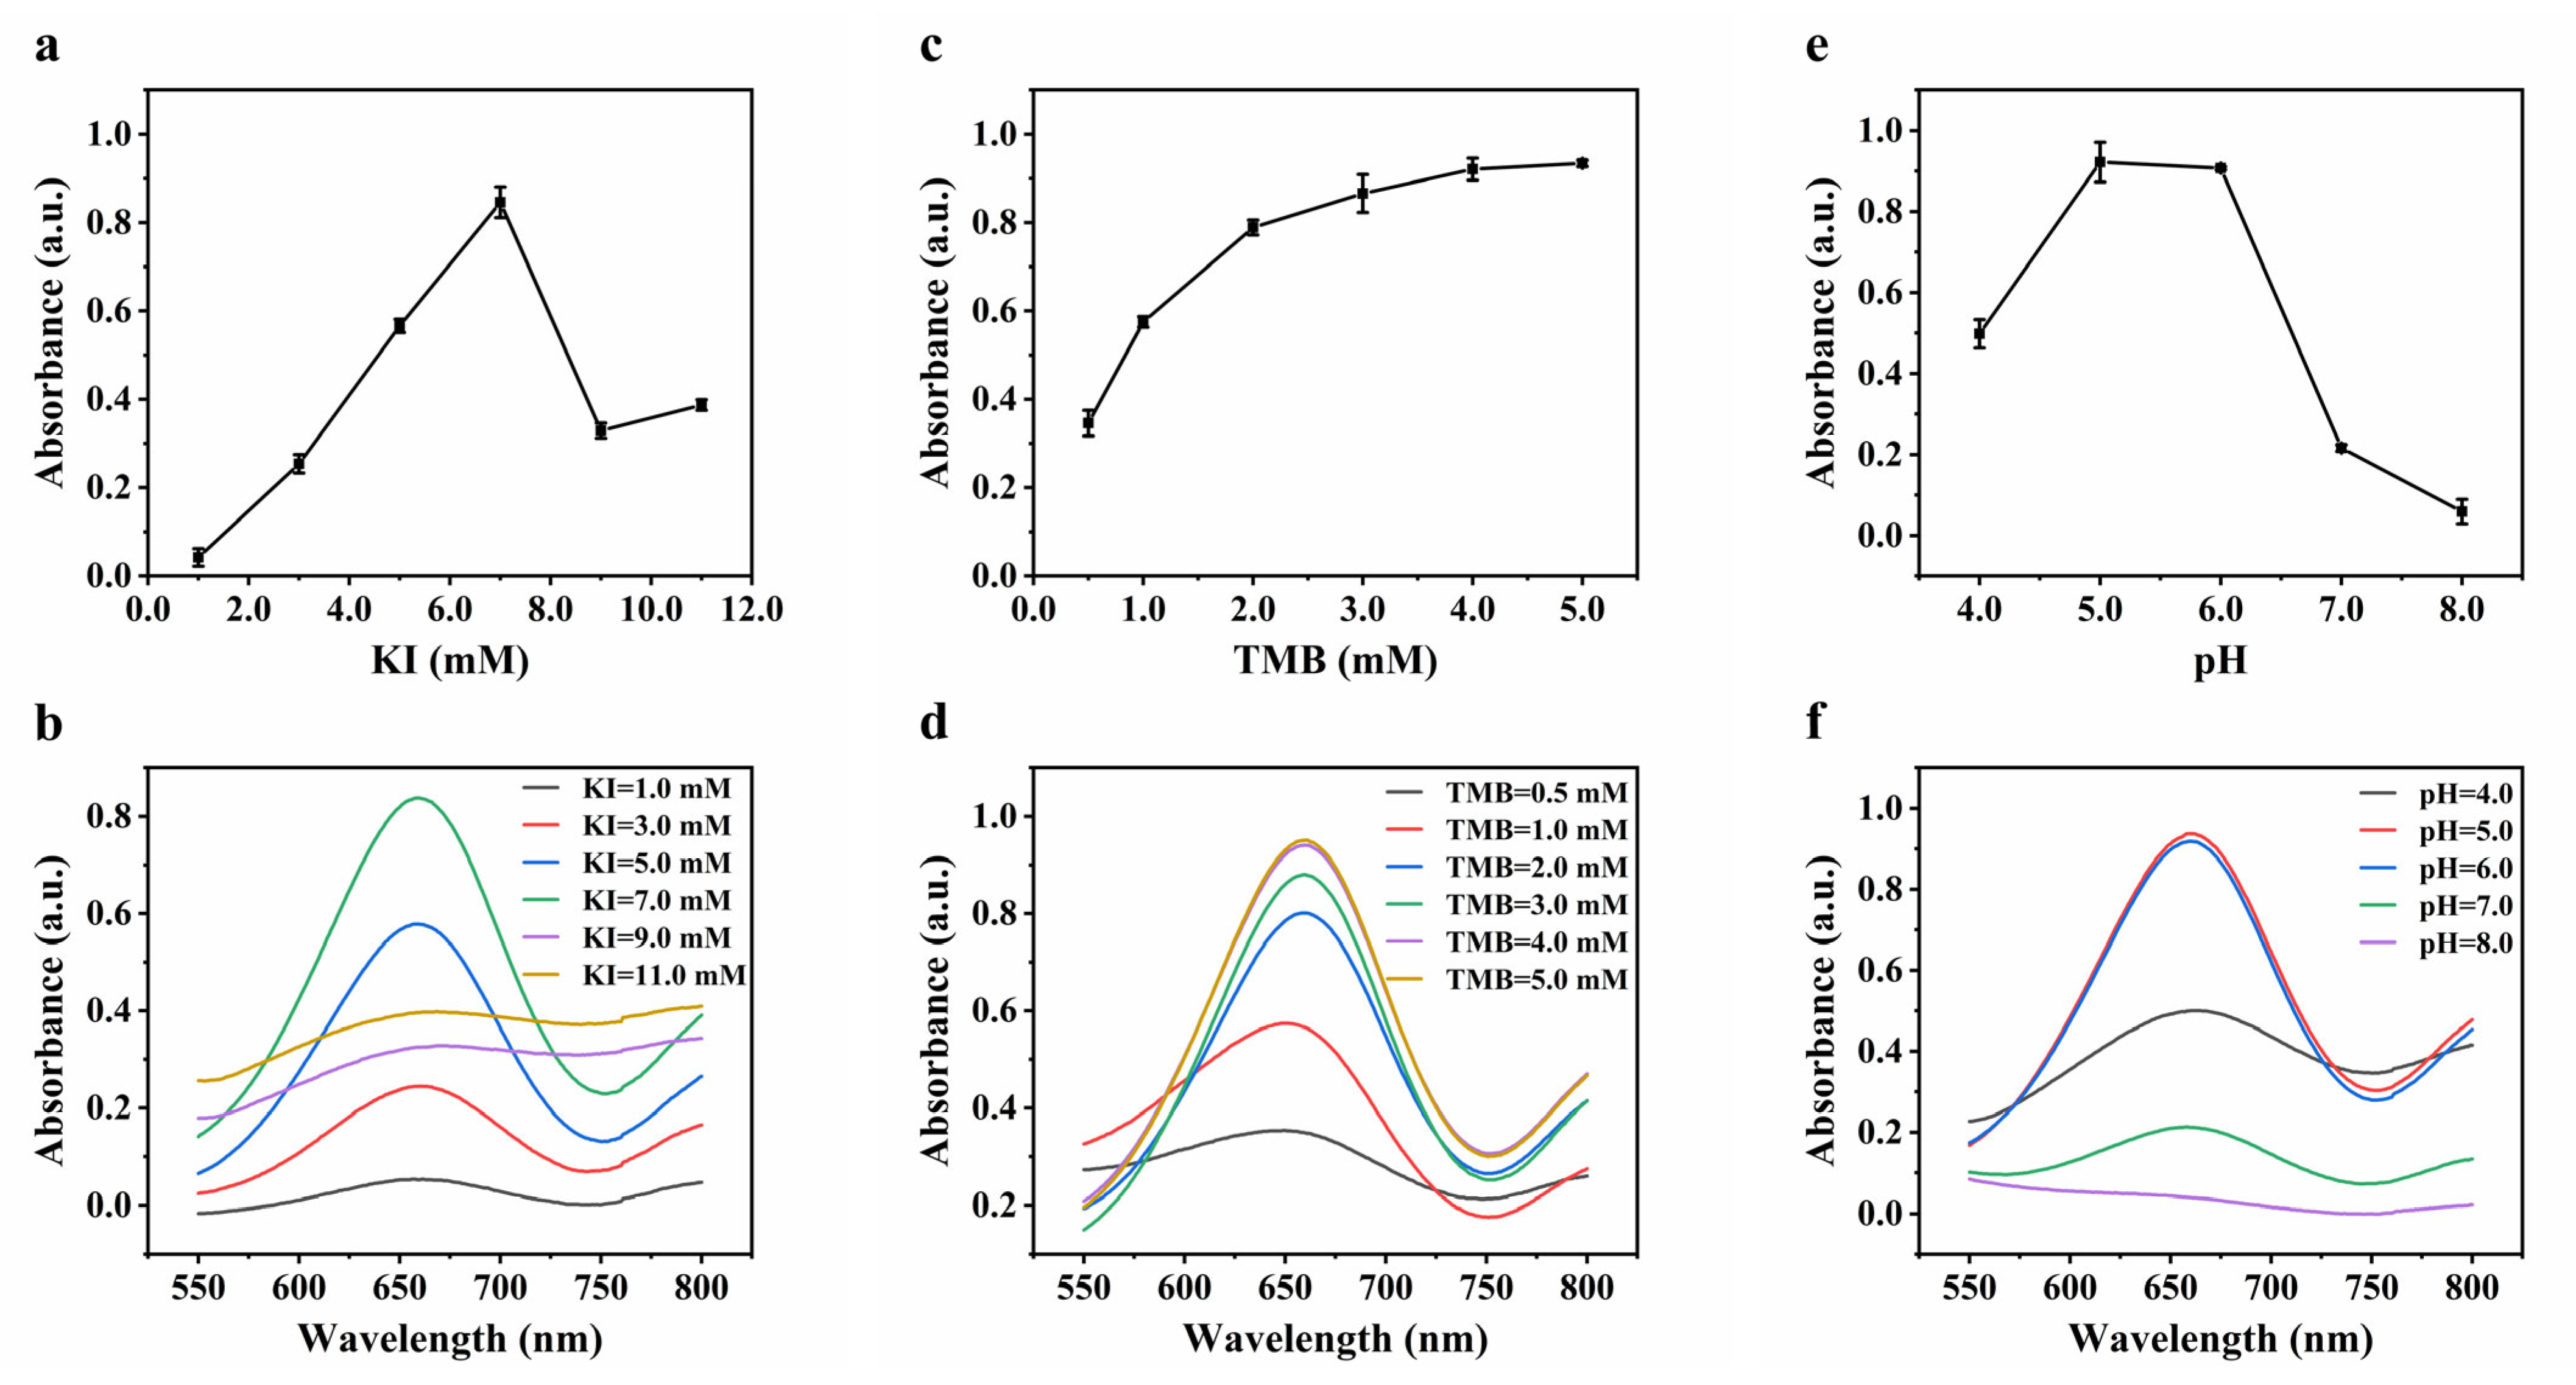
3.2. Optimization of Experimental Conditions

To obtain a good performance of the paper-based device, the general conditions, including the concentration of KI and TMB and the pH value of buffer solution, were optimized using the characteristic absorption peak of oxTMB at 652 nm as the marker. During the optimization of experimental conditions, the concentration of H2O2 in the sample was 1.0 mM. In order to develop a paper-based device for the detection at room temperature, the reaction temperature was kept at 25 °C during the whole reaction. Firstly, different concentrations (1.0, 3.0, 5.0, 7.0, 11.0, and 13.0 mM) of KI were investigated. As shown in Figure 3a, the absorbance of the solution increases with the increase in KI concentration from 1.0 to 7.0 mM, but it decreases sharply when KI concentration exceeds 7.0 mM because the precipitation occurred in the solution. It can be hypothesized that excessive KI was reduced by H2O2 to form excessive I2, which has low solubility in water, was precipitated and affected the absorbance of the solution (Figure 3b). Therefore, a KI concentration of 7.0 mM was used in the following experiments. Then, different concentrations of TMB (0.5, 1.0, 2.0, 3.0, 4.0, and 5.0 mM) were investigated. As shown in Figure 3c,d, the absorbance of the solution increases gradually when the TMB concentration is changed from 0.5 to 5.0 mM, and it reaches its highest at 4.0 and 5.0 mM, indicating that the oxidation capacity of the oxidation system to oxidize TMB reached the maximum under this condition. To reduce the cost, 4.0 mM TMB was chosen in the present work. In addition, different pH (4.0, 5.0, 6.0, 7.0, and 8.0) values were investigated. Figure 3e,f show that the KI-TMB detection system has better detection performance under pH 5.0 and 6.0, which is consistent with the principle that iodate needs to oxidize TMB in an acidic environment. However, an overly acidic environment (pH 4.0) will also lead to a decrease in detection performance. Considering a better stability at pH 6.0 than pH 5.0, the solution with a pH value of 6.0 was selected for subsequent experiments.
After the composition of the paper-based device being optimized, the effect of the reaction time of H2O2 on the KI-TMB system, and the effect of Gox concentration and glucose reaction time on the KI-TMB-Gox system, were investigated. The optimization results were evaluated by the RGB channel strength. In order to make the color change of the paper-based device more obvious, during the optimization of experimental conditions, the concentration of H2O2 in the sample was 3.0 mM and the concentration of glucose in the sample was 2.0 mM. As shown in Figure 4a, the gradual increasing color intensity of the red channel, green channel and blue channel corresponds to the increasing reaction time of H2O2. The increasing trend of color signal for H2O2 detection is gradually slowed down at 35 min, which was selected as the optimal reaction time of H2O2. In addition, the sensitivity of red channel strength is the highest in RGB channel strength, which was used as the indicator of color intensity value. On the other hand, the effect of different concentrations of Gox (0.017, 0.033, 0.083, 0.170, 0.330, 0.500, and 0.670 mg/mL) on the red channel color intensity were examined. As shown in Figure 4b, when Gox concentration is increased from 0.017 to 0.083 mg/mL, the color signal is increased. However, excessive enzymes may impede the contact between KI and TMB, thus hindering the occurrence of color reaction. Therefore, Gox with a concentration of 0.083 mg/mL was selected for the following experiment. In addition, Figure 4c shows the relationship between the red channel color intensity of glucose detection and the reaction time. The color intensity of the red channel is increased with the increase in reaction time, and becomes stable after 45 min, indicating that the enzymatic reaction is basically completed. Therefore, 45 min was selected as the best reaction time for glucose detection.

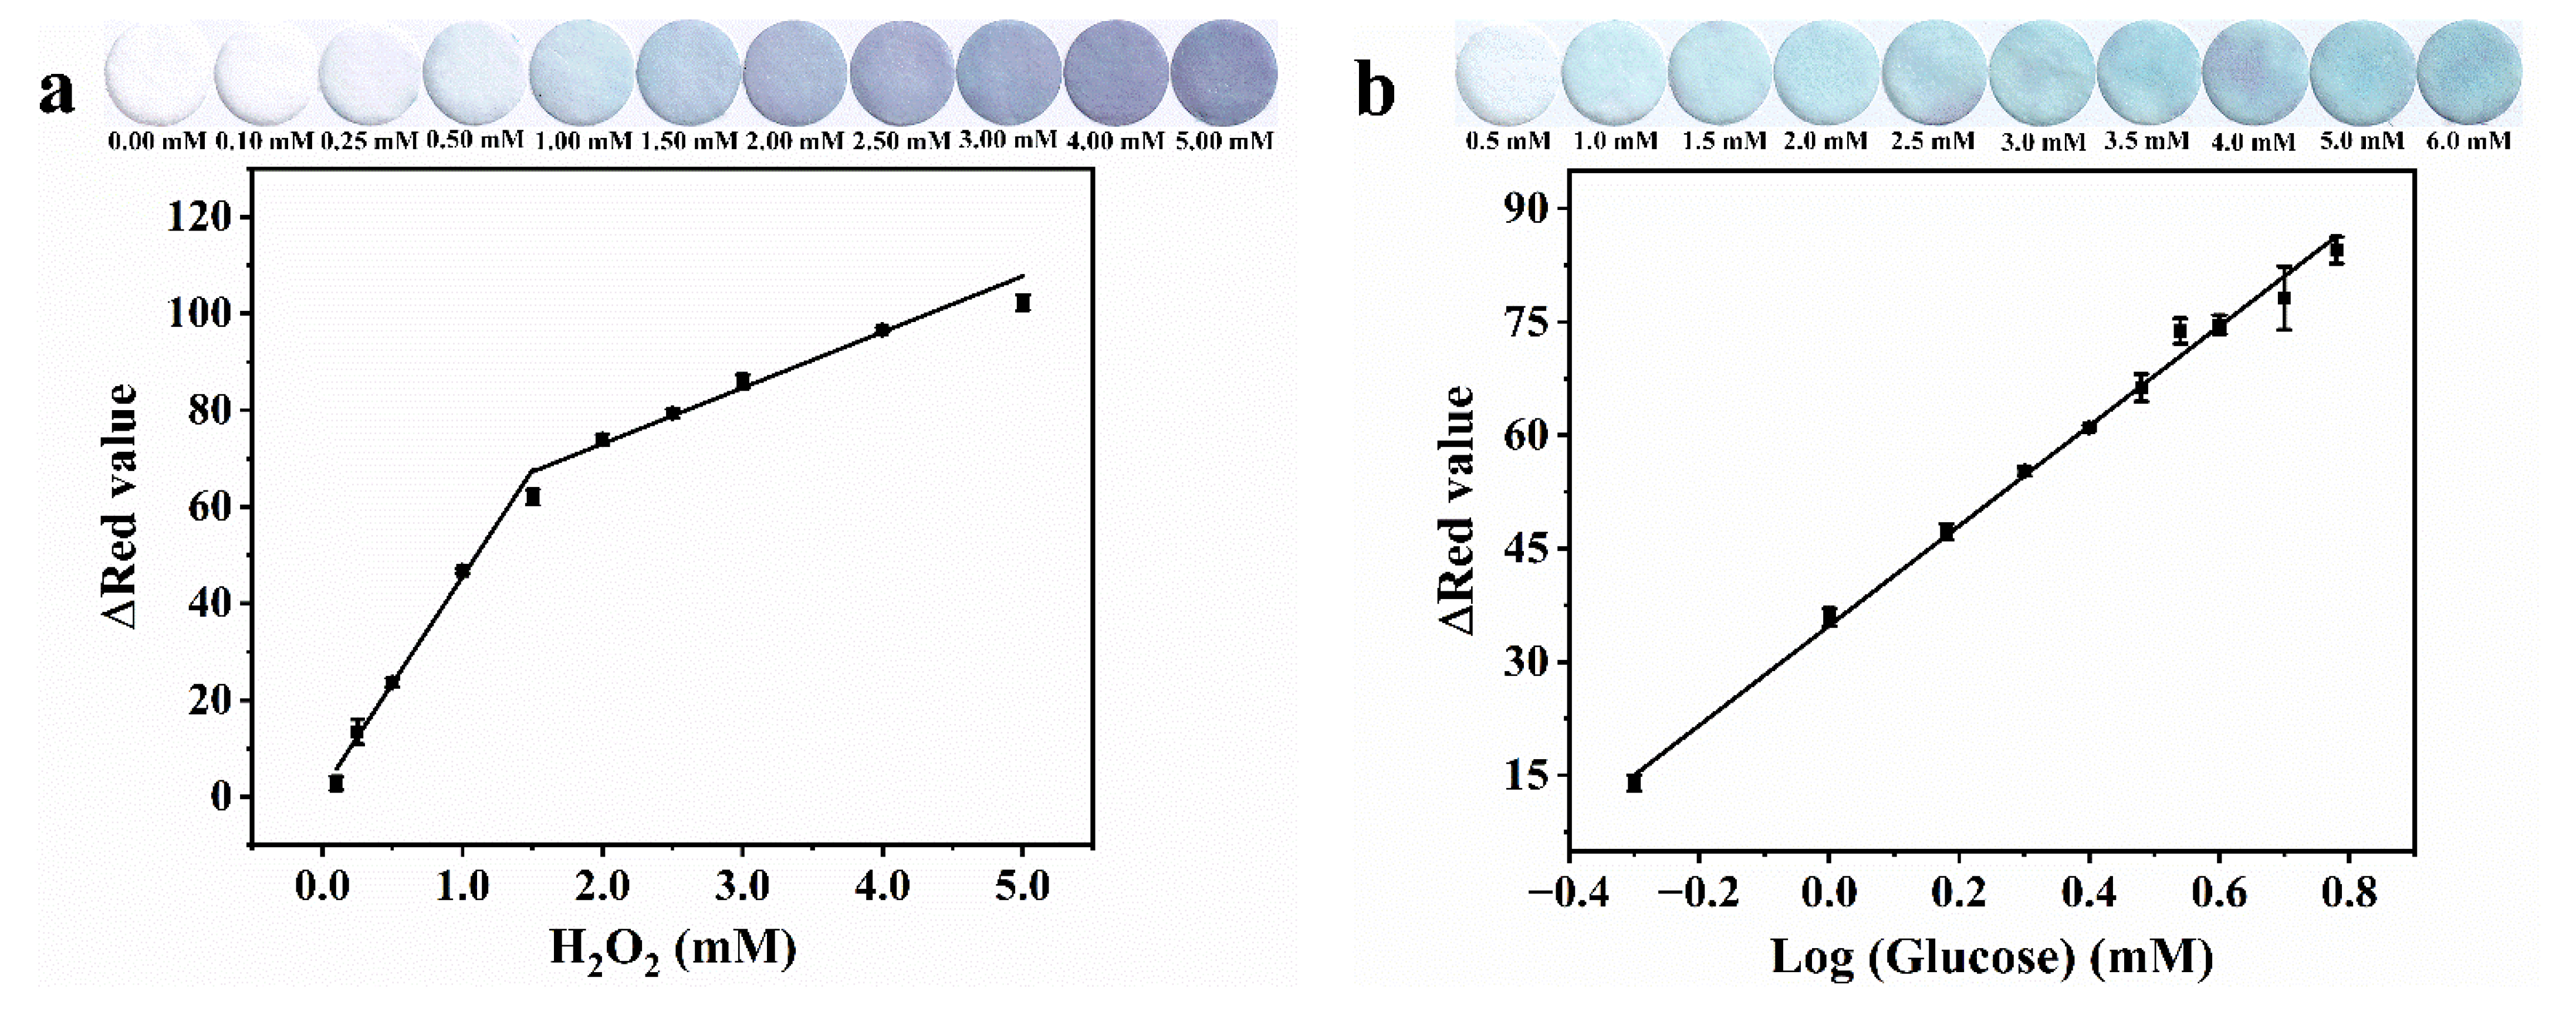
3.3. Analytical Performance

To evaluate the performance of the paper-based biosensor, within-batch and between-batch precisions, linear range, and limit of quantification of the method were investigated. The RSDs of the color intensity of within-batch (n = 5) and between-batch (n = 5) precision are 3% and 6%, respectively, which indicate that the paper-based biosensor is reliable. To explore the analytical performance of the paper-based sensor for the detection of H2O2, the corresponding images of the different concentrations of H2O2 on the paper-based sensor were recorded. The results are shown in Figure 5a. Under the optimal experimental conditions, the color intensity of the paper-based sensor and the concentration of H2O2 show a good linear relationship in two ranges of 0.1–1.5 mM (Y = 44.2090 C[H2O2] + 1.3559, R2 = 0.9799) and 1.5−5.0 mM (Y = 11.5630 C[H2O2] + 49.9586, R2 = 0.9679). According to the equation of limit of detection (LOD) = 3 σs/S (S is the slope of the calibration curve in Figure 5a, σs is the standard deviation of eleven blank tests), the LOD of H2O2 is calculated to be 0.03 mM. When the concentration of H2O2 is low, it reacts rapidly with I to produce IO3 and oxidize TMB. When the concentration of H2O2 is high, the number of electrons provided by I becomes insufficient, resulting in a slow production of IO3 and a gradual slope. Therefore, the response value and H2O2 concentration showed two linear relationships with different slopes [27]. Similarly, to explore the analytical performance of the paper-based biosensor for the detection of glucose, the color intensity of the reaction of different concentrations of glucose on paper-based biosensor were recorded. As shown in Figure 5b, there is a good linear relationship between the color intensity and the logarithm of glucose concentration in the range of 0.5−6.0 mM (Y = 66.0306 logC[glucose] + 34.8281, R2 = 0.9965), and the limit of quantitation (LOQ) is 0.5 mM. As compared with other H2O2 and glucose sensors (Table 1 and Table 2), this paper-based biosensor does not require large-scale instruments, is simple manufacture and low cost, and has satisfactory linear range, LOD and LOQ values.

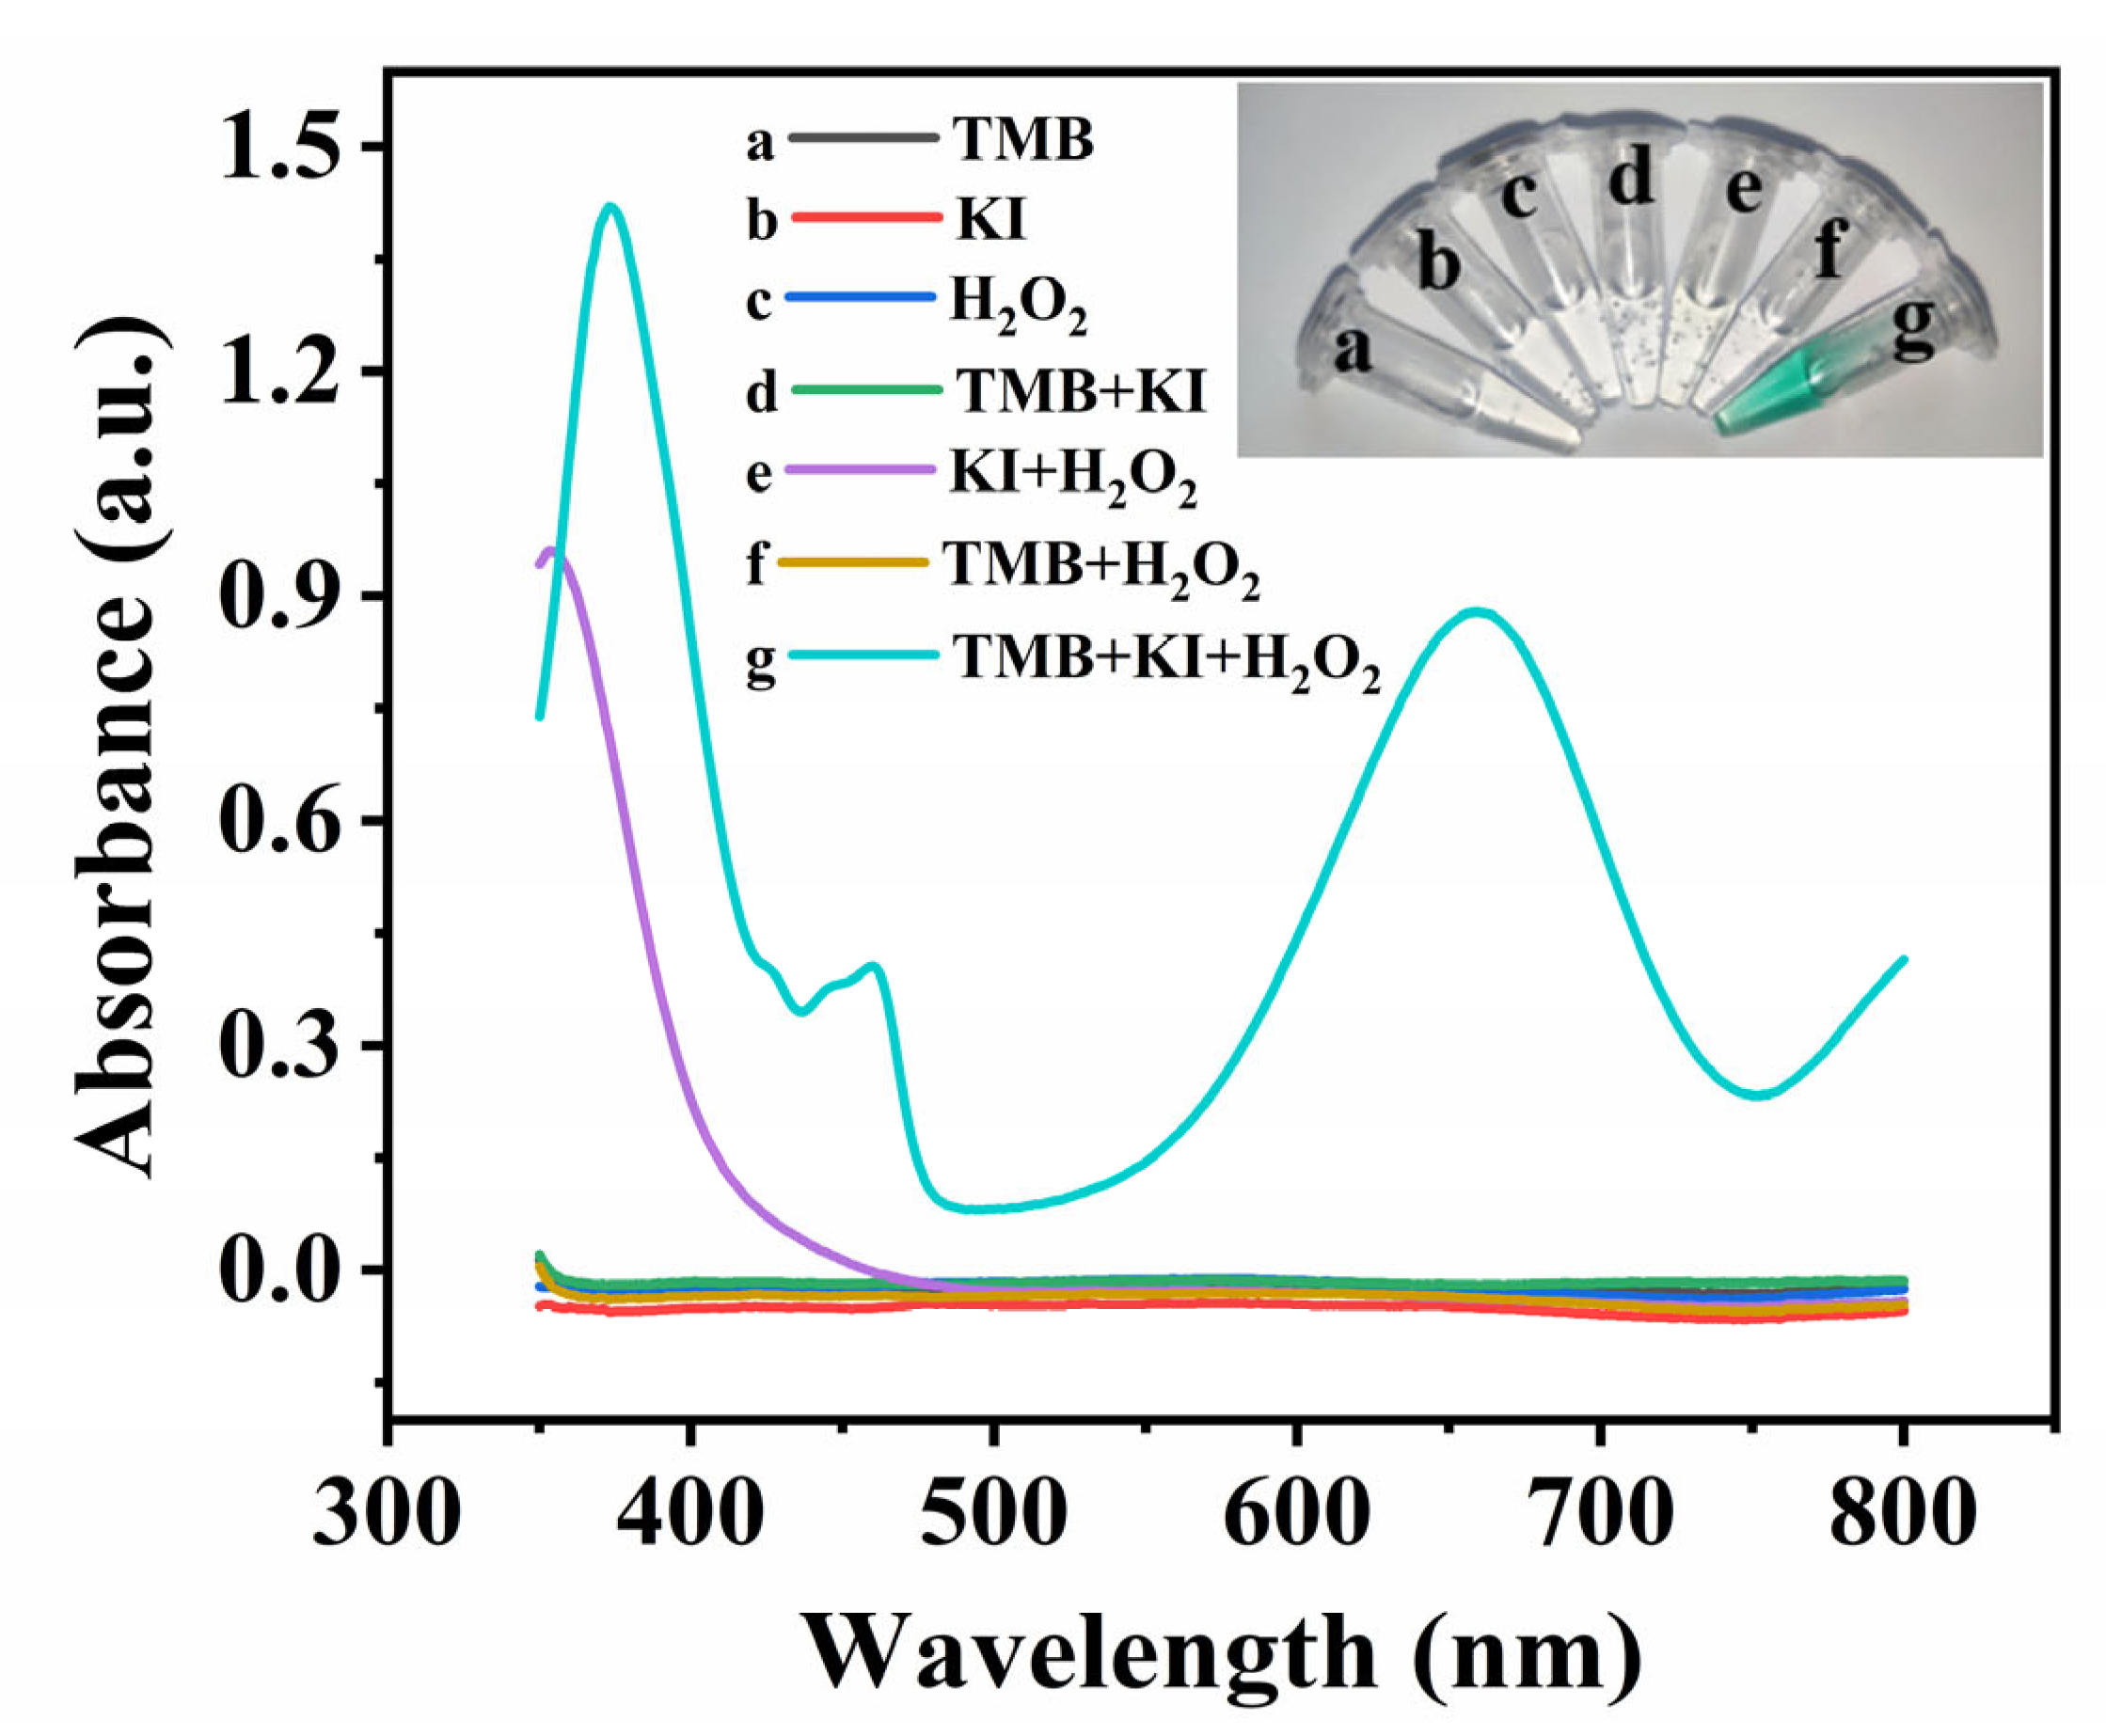
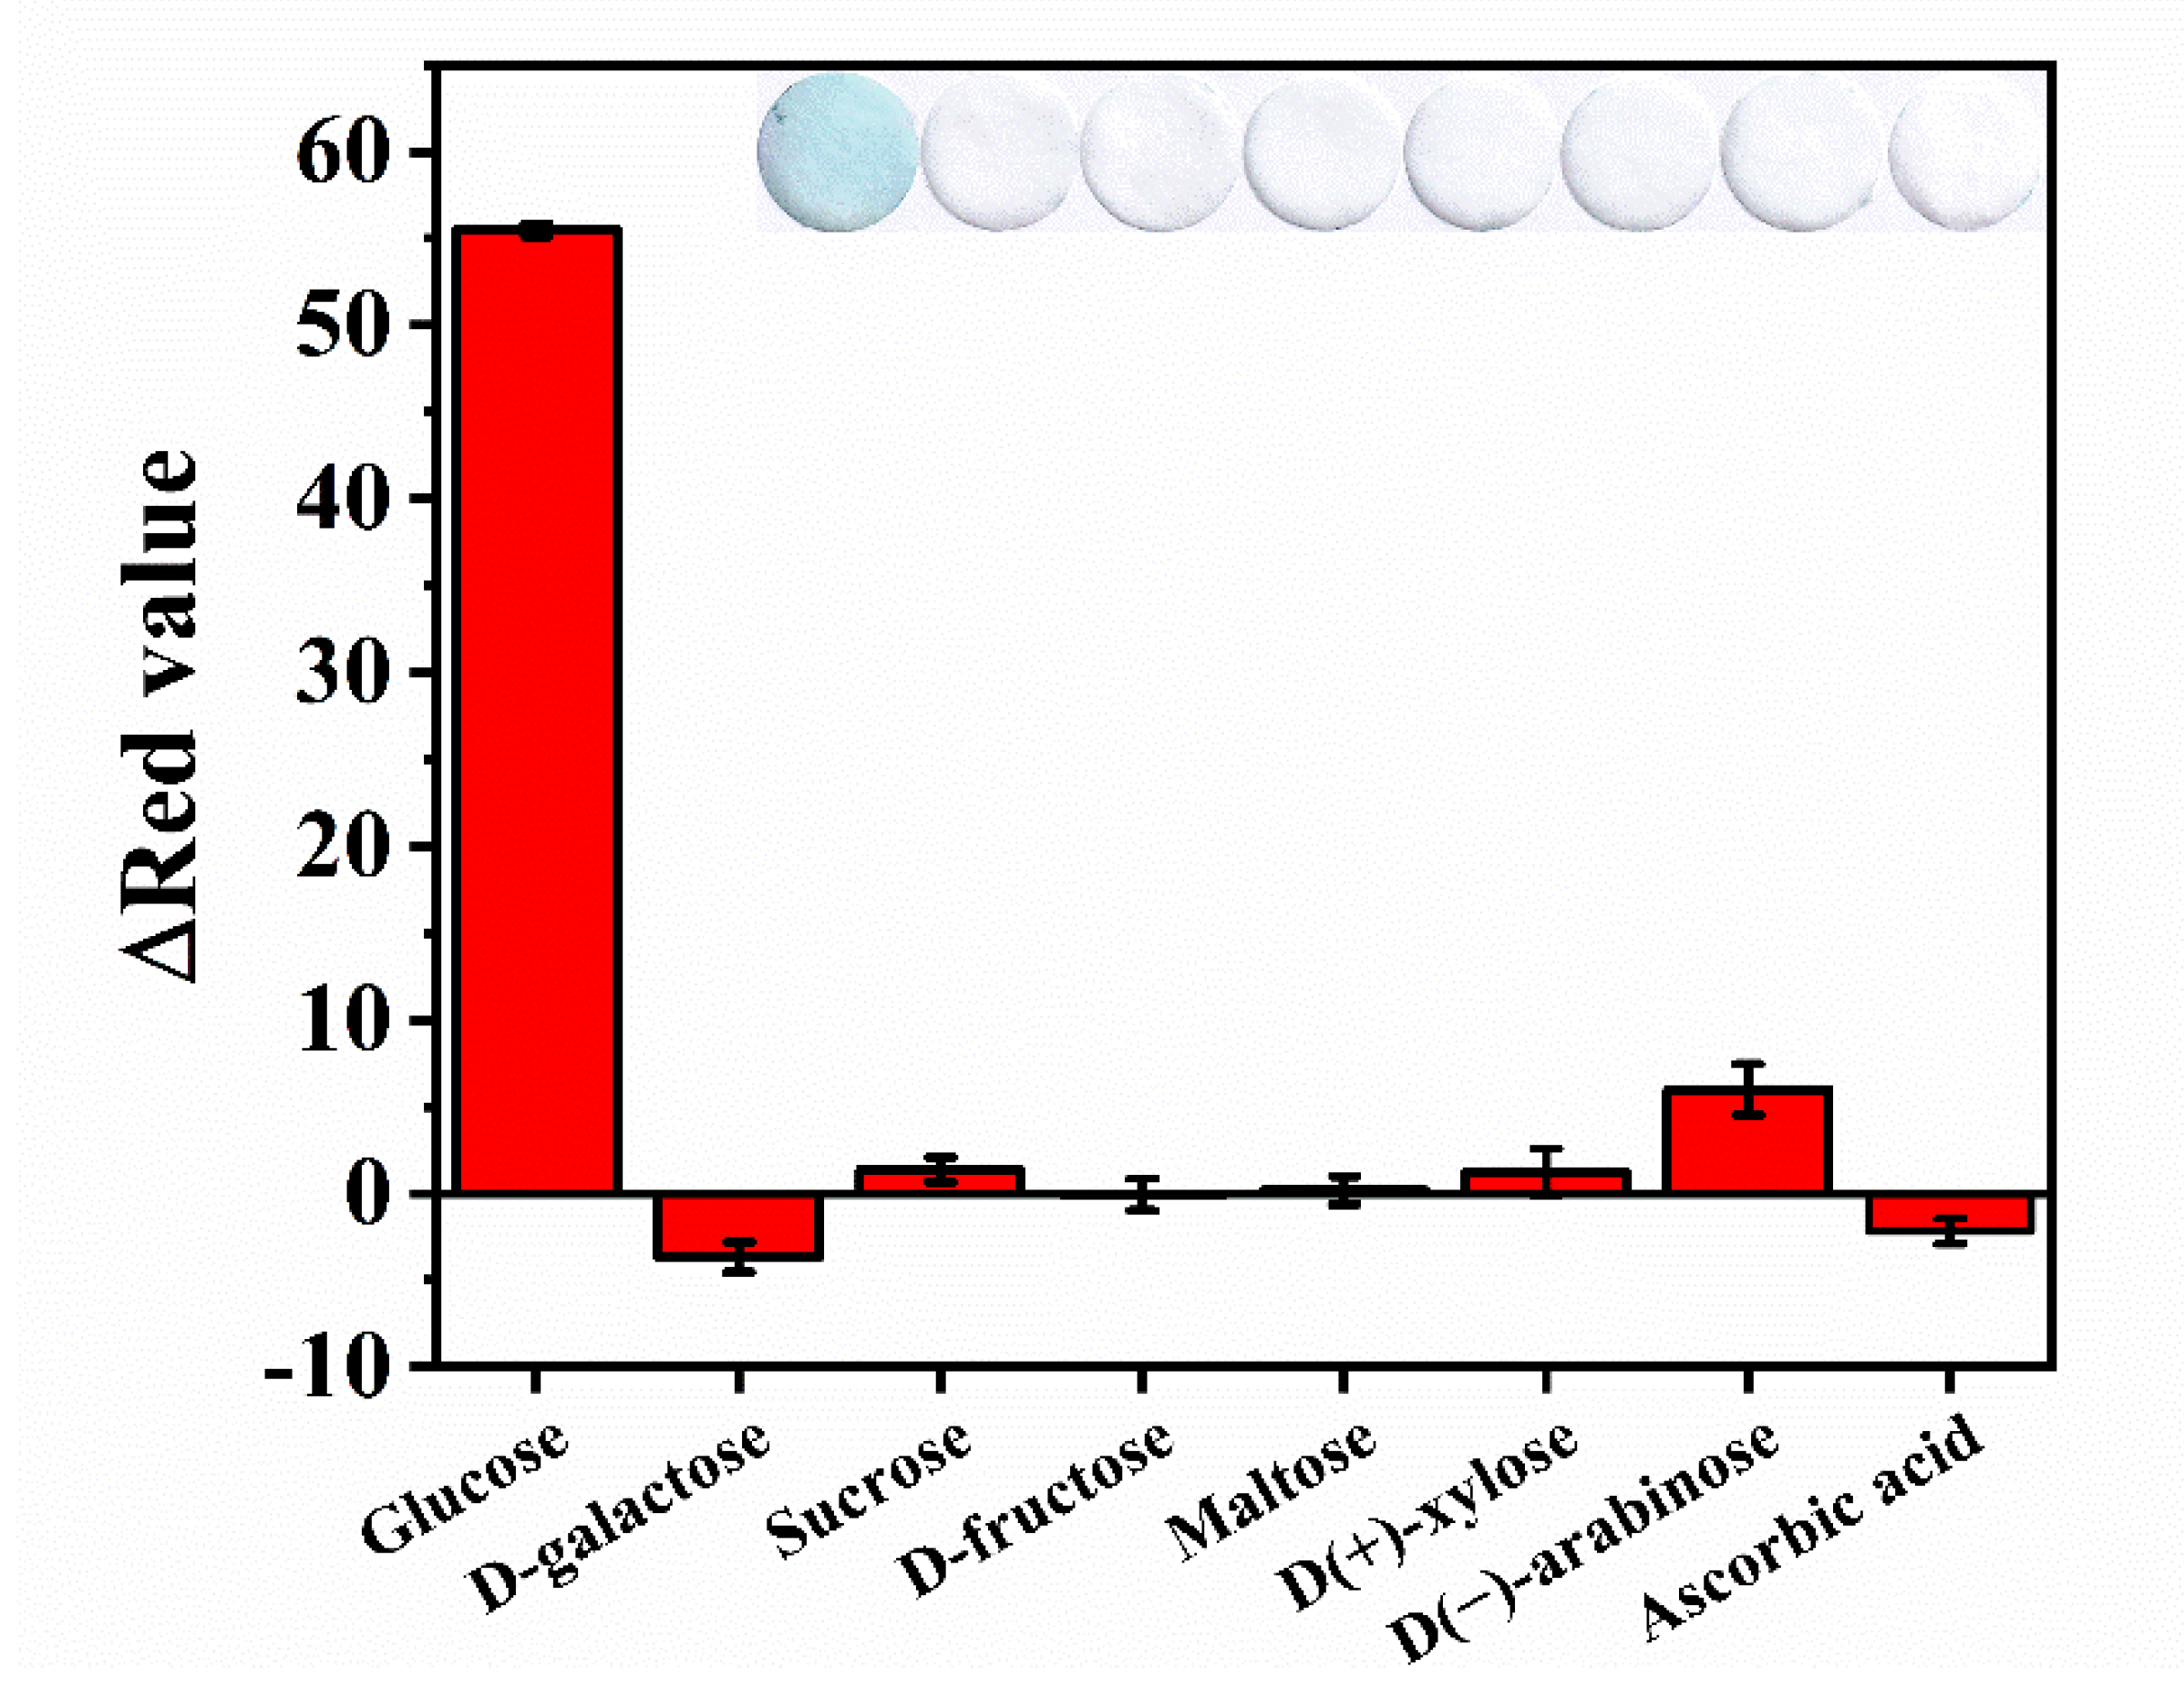
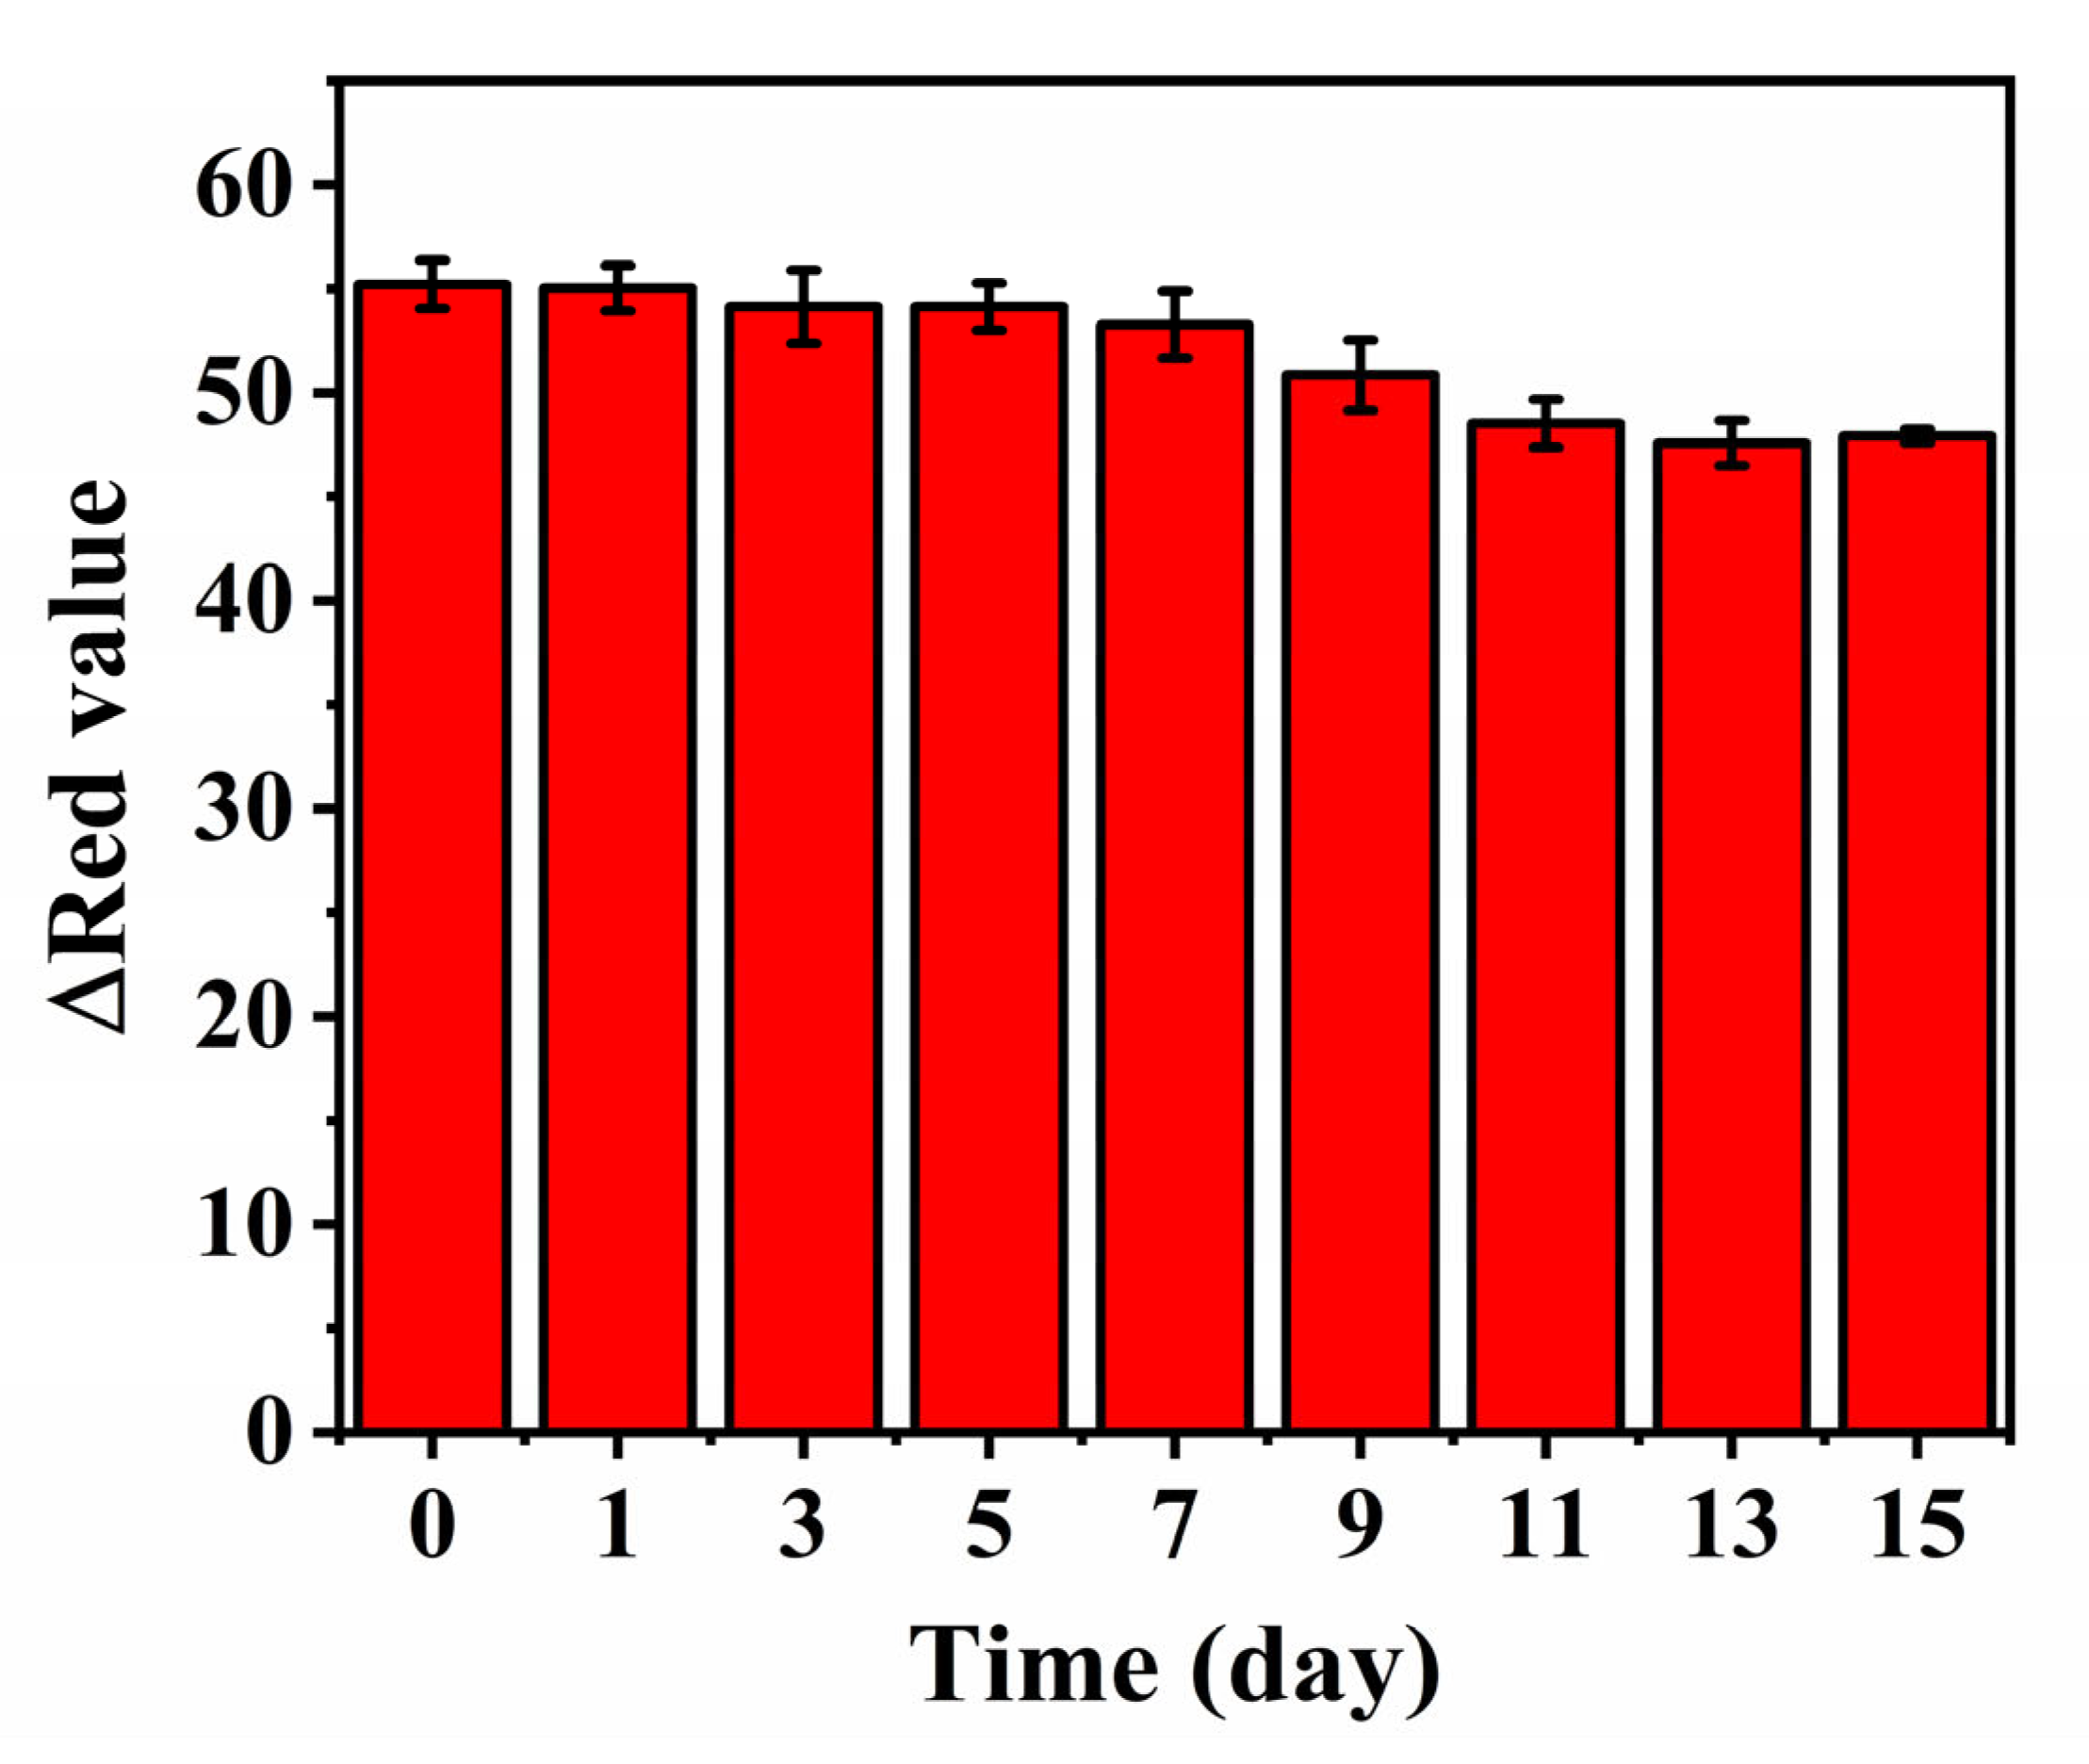
3.4. Selectivity and Stability of the Colorimetric Assay

To validate the selectivity of the glucose assay based on the paper-based biosensor in detecting glucose in fruits, other analogues of glucose, including 0.5 mM of D-galactose, sucrose, D-fructose, maltose, D(+)-xylose, D(−)-arabinose, and ascorbic acid, were examined under the same conditions as in the case of 2.0 mM of glucose. As the results show in Figure 6, the paper-based biosensor with glucose sample produces an obvious color signal of visible blue, while the interferences have no significant color signal that appeared, demonstrating that the developed colorimetric method has a very good selectivity for glucose detection. This excellent selectivity is attributed to the specific reaction between GOx and glucose.
The paper-based biosensor was packed in a sealed vacuum bag containing desiccant to avoid the influence of air and moisture on the paper-based biosensor, and it was stored in a 4 °C refrigerator for 15 days. With 2.0 mM glucose solution as the detection sample, the color intensity generated by adding glucose sample solution on the day of paper-based biosensor preparation (the 0th day of storage) was recorded as the initial color intensity. The color intensity of glucose sample solution was detected by the paper-based biosensor and was recorded every other day until 15 days of storage. Figure 7 shows that the color intensity retains 90% and 80% of its initial intensity after 7 and 15 days at 4 °C, respectively. The reduction in response may be caused by the loss of activity of GOx. These results prove a good storage stability of the paper-based biosensor, which is beneficial to the practical application of glucose detection.

3.5. Measurements of Glucose in Practical Samples

The developed paper-based biosensor was employed to detect glucose in three fruit samples (apple, pear, and coconut). The concentrations of glucose in apple, pear, and coconut samples detected by the paper-based biosensor are 123.3 ± 13.8 mM, 168.0 ± 8.2 mM, and 194.1 ± 25.8 mM, respectively. In addition, the three fruit samples were spiked with 1.0, 2.0, and 3.0 mM of glucose and analyzed by the same method, respectively. The recoveries are in the range of 95.4–106.1% (Table 3). These results show that the developed paper-based biosensor has good accuracy and high credibility in the detection of glucose in real samples.

4. Conclusions

In summary, a paper-based sensor was successfully developed for the detection of H2O2-related biomarker based on the KI-TMB system, and the method was applied in the detection of glucose in three kinds of fruit samples. As compared with other glucose detection methods, the developed method in this study is not only low-cost, environmentally friendly, and portable, but also does not require large-scale instruments for data analysis and processing. In addition, replacement of the traditional peroxidase by KI can further reduce the cost. In short, the biosensor developed in this study is simple and low cost, combined with other oxidases, it can be further used to detect other biomarkers related to H2O2 and has commercial application potential.

Author Contributions

Conceptualization, W.-Y.Z. and H.Z.; methodology, W.-Y.Z.; software, W.-Y.Z.; investigation, W.-Y.Z. and H.Z.; writing—original draft preparation, W.-Y.Z.; writing—review and editing, H.Z. and F.-Q.Y.; supervision, F.-Q.Y.; project administration, F.-Q.Y.; funding acquisition, H.Z. All authors have read and agreed to the published version of the manuscript.

Funding

This research was funded by Chongqing Medical and Pharmaceutical College, China, grant number YGZ2021133.

Institutional Review Board Statement

Not applicable.

Informed Consent Statement

Not applicable.

Data Availability Statement

Not applicable.

Conflicts of Interest

The authors declare no conflict of interest.

References

  1. Turner Anthony, P.F. Biosensors–Sense and Sensitivity. Science 2000, 290, 1315–1317. [Google Scholar] [CrossRef] [PubMed]
  2. Liu, D.; Wang, J.; Wu, L.; Huang, Y.; Zhang, Y.; Zhu, M.; Wang, Y.; Zhu, Z.; Yang, C. Trends in miniaturized biosensors for point-of-care testing. Trac-Trends Anal. Chem. 2020, 122, 115701. [Google Scholar] [CrossRef]
  3. Zhang, J.; Lan, T.; Lu, Y. Translating in vitro diagnostics from centralized laboratories to point-of-care locations using commercially-available handheld meters. Trac-Trends Anal. Chem. 2020, 124, 115782. [Google Scholar] [CrossRef] [PubMed]
  4. Liu, D.; Wang, Y.; Li, X.; Li, M.; Wu, Q.; Song, Y.; Zhu, Z.; Yang, C. Integrated microfluidic devices for in vitro diagnostics at point of care. Aggregate 2022, e184. [Google Scholar] [CrossRef]
  5. Kim, J.H.; Mun, S.; Ko, H.U.; Yun, G.Y.; Kim, J. Disposable chemical sensors and biosensors made on cellulose paper. Nanotechnology 2014, 25, 092001. [Google Scholar] [CrossRef] [PubMed]
  6. Kamel, S.; Khattab, T.A. Recent Advances in Cellulose-Based Biosensors for Medical Diagnosis. Biosensors 2020, 10, 67. [Google Scholar] [CrossRef] [PubMed]
  7. Busa, L.S.A.; Mohammadi, S.; Maeki, M.; Ishida, A.; Tani, H.; Tokeshi, M. Advances in Microfluidic Paper-Based Analytical Devices for Food and Water Analysis. Micromachines 2016, 7, 86. [Google Scholar] [CrossRef] [PubMed]
  8. Zhang, H.; Li, X.; Qian, Z.M.; Wang, S.; Yang, F.Q. Glucose oxidase-mediated sodium alginate gelation: Equipment-Free detection of glucose in fruit samples. Enzym. Microb. Technol. 2021, 148, 109805. [Google Scholar] [CrossRef] [PubMed]
  9. Mooltongchun, M.; Teepoo, S. A Simple and Cost-effective Microfluidic Paper-Based Biosensor Analytical Device and its Application for Hypoxanthine Detection in Meat Samples. Food Anal. Meth. 2019, 12, 2690–2698. [Google Scholar] [CrossRef]
  10. Liu, M.M.; Lian, X.; Liu, H.; Guo, Z.Z.; Huang, H.H.; Lei, Y.; Peng, H.P.; Chen, W.; Lin, X.H.; Liu, A.L.; et al. A colorimetric assay for sensitive detection of hydrogen peroxide and glucose in microfluidic paper-based analytical devices integrated with starch-iodide-gelatin system. Talanta 2019, 200, 511–517. [Google Scholar] [CrossRef]
  11. Moreira, F.T.C.; Correia, B.P.; Sousa, M.P.; Sales, G.F. Colorimetric cellulose-based test-strip for rapid detection of amyloid β-42. Mikrochim. Acta 2021, 188, 334. [Google Scholar] [CrossRef]
  12. Shariati, S.; Khayatian, G. Microfluidic nanopaper based analytical device for colorimetric and naked eye determination of cholesterol using the color change of triangular silver nanoprisms. New J. Chem. 2021, 45, 21788–21794. [Google Scholar] [CrossRef]
  13. Gong, X.; Shao, J.; Guo, S.; Pan, J.; Fan, X. Determination of inhibitory activity of Salvia miltiorrhiza extracts on xanthine oxidase with a paper-based analytical device. J. Pharm. Anal. 2021, 11, 603–610. [Google Scholar] [CrossRef] [PubMed]
  14. Ramalingam, S.; Collier, C.M.; Singh, A. A Paper-Based Colorimetric Aptasensor for the Detection of Gentamicin. Biosensors-Basel 2021, 11, 29. [Google Scholar] [CrossRef] [PubMed]
  15. Li, J.H.; Deng, X.L.; Zhao, Y.L.; Zhang, X.Y.; Bai, Y.P. Paper-Based Enzymatic Colorimetric Assay for Rapid Malathion Detection. Appl. Biochem. Biotechnol. 2021, 193, 2534–2546. [Google Scholar] [CrossRef]
  16. Tran, T.D.; Nguyen, P.T.; Le, T.N.; Kim, M.I. DNA-copper hybrid nanoflowers as efficient laccase mimics for colorimetric detection of phenolic compounds in paper microfluidic devices. Biosens. Bioelectron. 2021, 182, 113187. [Google Scholar] [CrossRef]
  17. Attaallah, R.; Amine, A. Highly selective and sensitive detection of cadmium ions by horseradish peroxidase enzyme inhibition using a colorimetric microplate reader and smartphone paper-based analytical device. Microchem. J. 2022, 172, 106940. [Google Scholar] [CrossRef]
  18. Liu, J.; Xing, Y.; Xue, B.; Zhou, X. Nanozyme enhanced paper-based biochip with a smartphone readout system for rapid detection of cyanotoxins in water. Biosens. Bioelectron. 2022, 205, 114099. [Google Scholar] [CrossRef]
  19. Rhee Sue, G. H2O2, a Necessary Evil for Cell Signaling. Science 2006, 312, 1882–1883. [Google Scholar] [CrossRef]
  20. Evans, E.; Gabriel, E.F.; Benavidez, T.E.; Tomazelli Coltro, W.K.; Garcia, C.D. Modification of microfluidic paper-based devices with silica nanoparticles. Analyst 2014, 139, 5560–5567. [Google Scholar] [CrossRef]
  21. Feng, L.X.; Tang, C.; Han, X.X.; Zhang, H.C.; Guo, F.N.; Yang, T.; Wang, J.H. Simultaneous and sensitive detection of multiple small biological molecules by microfluidic paper-based analytical device integrated with zinc oxide nanorods. Talanta 2021, 232, 122499. [Google Scholar] [CrossRef] [PubMed]
  22. Behrouzifar, F.; Shahidi, S.-A.; Chekin, F.; Hosseini, S.; Ghorbani-HasanSaraei, A. Colorimetric assay based on horseradish peroxidase/reduced graphene oxide hybrid for sensitive detection of hydrogen peroxide in beverages. Spectroc. Acta Pt. A-Molec. Biomolec. Spectr. 2021, 257, 119761. [Google Scholar] [CrossRef] [PubMed]
  23. Zhang, C.-Y.; Zhang, H.; Yang, F.-Q. Enhanced peroxidase-like activity of copper phosphate modified by hydrophilic phytic-acid and its application in colorimetric detection of hydrogen peroxide. Microchem. J. 2021, 168, 106489. [Google Scholar] [CrossRef]
  24. Lin, J.; Ni, P.; Sun, Y.; Wang, Y.; Wang, L.; Li, Z. Highly sensitive colorimetric determination of biothiols based on I-H2O2-3,3’,5,5’-tetramethylbenzidine system. Sens. Actuator B Chem. 2018, 255, 3472–3478. [Google Scholar] [CrossRef]
  25. Dogan, V.; Yuzer, E.; Kilic, V.; Sen, M. Non-enzymatic colorimetric detection of hydrogen peroxide using a μPAD coupled with a machine learning-based smartphone app. Analyst 2021, 146, 7336–7344. [Google Scholar] [CrossRef]
  26. Ye, X.; Shi, H.; He, X.; Wang, K.; He, D.; Yan, L.a.; Xu, F.; Lei, Y.; Tang, J.; Yu, Y. Iodide-Responsive Cu–Au Nanoparticle-Based Colorimetric Platform for Ultrasensitive Detection of Target Cancer Cells. Anal. Chem. 2015, 87, 7141–7147. [Google Scholar] [CrossRef]
  27. Yao, L.; Kong, F.Y.; Wang, Z.X.; Li, H.Y.; Zhang, R.; Fang, H.L.; Wang, W. UV-assisted one-pot synthesis of bimetallic Ag-Pt decorated reduced graphene oxide for colorimetric determination of hydrogen peroxide. Mikrochim. Acta 2020, 187, 410. [Google Scholar] [CrossRef]
  28. Zarif, F.; Rauf, S.; Khurshid, S.; Muhammad, N.; Hayat, A.; Rahim, A.; Shah, N.S.; Yang, C.P. Effect of pyridinium based ionic liquid on the sensing property of Ni0 nanoparticle for the colorimetric detection of hydrogen peroxide. J. Mol. Struct. 2020, 1219, 128620. [Google Scholar] [CrossRef]
  29. Lima, L.S.; Rossini, E.L.; Pezza, L.; Pezza, H.R. Bioactive paper platform for detection of hydrogen peroxide in milk. Spectroc. Acta Pt. A-Molec. Biomolec. Spectr. 2020, 227, 117774. [Google Scholar] [CrossRef]
  30. Sharma, L.; Gouraj, S.; Raut, P.; Tagad, C. Development of a surface-modified paper-based colorimetric sensor using synthesized Ag NPs-alginate composite. Environ. Technol. 2021, 42, 3441–3450. [Google Scholar] [CrossRef]
  31. Khazaei, S.; Mozaffari, S.A.; Ebrahimi, F. Polyvinyl alcohol as a crucial omissible polymer to fabricate an impedimetric glucose biosensor based on hierarchical 3D-NPZnO/chitosan. Carbohydr. Polym. 2021, 266, 118105. [Google Scholar] [CrossRef] [PubMed]
  32. Fatoni, A.; Aziz, A.N.; Anggraeni, M.D. Low-cost and real-time color detector developments for glucose biosensor. Sens. Biosensing. Res. 2020, 28, 100325. [Google Scholar] [CrossRef]
  33. Luo, X.; Xia, J.; Jiang, X.; Yang, M.; Liu, S. Cellulose-Based Strips Designed Based on a Sensitive Enzyme Colorimetric Assay for the Low Concentration of Glucose Detection. Anal. Chem. 2019, 91, 15461–15468. [Google Scholar] [CrossRef] [PubMed]
Scheme 1. Schematic diagram of working principle of the paper-based sensor.
Chemosensors 10 00335 sch001
Figure 1. Structure diagram of the paper-based device.
Chemosensors 10 00335 g001
Figure 2. UV–Vis absorption spectra of the solutions with different components. Insert is the photograph of the solutions.
Chemosensors 10 00335 g002
Figure 3. Effects of KI concentration (a), TMB concentration (c), and buffer pH (e) on the absorption at 652 nm of KI-TMB system for the detection of H2O2. UV–Vis spectra of the reaction system containing different concentrations of KI (b), TMB (d) and different pH (f).
Chemosensors 10 00335 g003
Figure 4. Effect of reaction time on the determination of H2O2 by the paper device with KI-TMB system (a). Effects of Gox concentration (b) and reaction time (c) on the determination of glucose by the paper device with KI-TMB-Gox system.
Chemosensors 10 00335 g004
Figure 5. Calibration curves for the determination of H2O2 (a) and glucose (b) by the paper device under the optimal conditions, respectively.
Chemosensors 10 00335 g005
Figure 6. Color intensity response in the presence of different sugars and ascorbic acid.
Chemosensors 10 00335 g006
Figure 7. Storage stability of the paper device in a refrigerator at 4 °C.
Chemosensors 10 00335 g007
Table 1. Determination of H2O2 using paper device and compared the results with other reported methods.
Detection MethodsMaterialLinear RangeLODRef.
UV–visible spectrophotometerSolution0.1–5.0 mM0.079 mM[23]
UV–visible spectrophotometerSolution0.4–4.0 mM0.12 mM[28]
Colorimetric analysis with a scannerPaper0.5–6.0 mM0.05 mM[16]
Colorimetric analysis with a smartphonePaper1.25–15.00 mM0.354 mM[29]
Colorimetric analysis with a smartphonePaper0.1–1.5 and 2−10 mM0.1 mM[30]
Colorimetric analysis with a scannerPaper0.1–5.0 mM0.03 mMThis work
Table 2. Determination of glucose using paper device and compared the results with other reported methods.
Detection MethodsMaterialLinear RangeLOD/LOQ (mM)Ref.
Electrical feature analysis with two electrodes cellElectrode1–18 mM0.2/-[31]
Colorimetric analysis with color sensor TCS230Solution0.1–2.5 mM0.14/0.58[32]
Diffusion diameter analysis with a Vernier caliperPaper1.4–7.0 mM-/1.4[3]
Colorimetric analysis with a scannerPaper0.5–5.0 mM0.1/-[16]
Colorimetric analysis with a cameraPaper1–11 mM0.45/-[33]
Colorimetric analysis with a scannerPaper0.5–6.0 mM-/0.5This work
Table 3. Recovery of glucose in fruit samples using the paper device.
SamplesInitially Detected Concentration (mM)Added (mM)Total Found ± SD (mM)Recovery (%)
Apple1.54 ± 0.171.02.50 ± 0.1995.5
2.03.58 ± 0.04101.8
3.04.47 ± 0.1597.6
Pear2.10 ± 0.101.03.14 ± 0.06104.5
2.04.09 ± 0.2499.5
3.04.96 ± 0.3595.4
Coconut2.43 ± 0.321.03.48 ± 0.09105.3
2.04.55 ± 0.29106.1
3.05.55 ± 0.18104.0
Publisher’s Note: MDPI stays neutral with regard to jurisdictional claims in published maps and institutional affiliations.

