Article

Microwave Interferometric Cytometry for Signal Analysis of Single Yeast Cells

1
WaveCore Division, Department of Electrical Engineering (ESAT), KU Leuven, 3001 Leuven, Belgium
2
Laboratory of Molecular Cell Biology, Institute of Botany and Microbiology, KU Leuven, 3001 Leuven, Belgium
3
Department of Electronics, Microelectronics, Computer and Intelligent Systems, Faculty of Electrical Engineering and Computing, University of Zagreb, Unska 3, 10000 Zagreb, Croatia
*
Author to whom correspondence should be addressed.
These authors contributed equally to this work.
Chemosensors 2022, 10(8), 318; https://doi.org/10.3390/chemosensors10080318
Submission received: 30 June 2022 / Revised: 28 July 2022 / Accepted: 4 August 2022 / Published: 8 August 2022
(This article belongs to the Special Issue Microfluidic Devices for Biological Quantitative Analysis)

Abstract

:
Microwave dielectric sensing offers a rapid, label-free, and non-invasive way of characterization and sensing of biological materials at the microfluidic scale. In this work, a dielectric sensing is achieved with a microwave interferometric setup that is applied to cytometric applications. A fast way to analyze and design an interferometric system at microwave frequencies in software tools is proposed together with a novel manufacturing and assembly process, which enables a short recovery time and avoids extensive microwave-microfluidic chip fabrication. The simulation and measurement results of the interferometric setup are in agreement with an excellent match at levels below S21 = −60 dB. The sensitive microwave setup is evaluated on measurements of 3 µm polystyrene spheres and finally applied for characterization of a widely used laboratory Saccharomyces cerevisiae strain, the S288C, in a frequency range from 4 to 18 GHz.

1. Introduction

Microwave dielectric characterization and heating techniques have drawn great interest in microfluidics scale for rapid heating [1,2], polymerase chain reaction [3], and detection of biogenic liquids and analysis of biological cells. The dielectric properties of the cell, determined by the constitutions of the cell including its size and morphology, the membrane formation, the cytoplasm, and the organelles, are representations of the cell’s physiological status. Because electromagnetic signals at microwave frequencies go beyond the cell membrane, microwave dielectric characterization has been studied in many different scenarios and on numerous biological cells. For example, the interference technique and a lock-in amplifier were used as a detection system on a resonant structure for measuring the dielectrophoretic response of the CHO cells [4]. The interference technique was also used to distinguish the viability of single yeast cells [5]. The bulk impedances were measured with electrodes to acquire membrane capacitance and cytoplasm conductivity for characterization and classification of human non-small cell lung carcinoma cells [6] and so on. In other words, the dielectric properties of biological cells and the corresponding sensing is being promoted as ideal for quantitative analysis of single cell in microfluidics [7,8,9,10,11].
Interferometric dielectric spectroscopy technique is a highly sensitive, broadband, and label-free method for lab-on-chip platforms [12,13,14,15,16]. It is flexible in terms of sensor selection [17] and straightforward in permittivity extraction [14,18,19]. The interferometric technique utilizes the capability of power splitters and combiners, attenuators, and phase shifters to create two signals from one source having almost identical amplitude and opposite phase, through which a negative interference null at a certain frequency is achieved. The two signals cancel out each other, forming a based line signal close to zero, which is normally smaller than −60 dB from the source signal value. Thus, a small effective permittivity change of the MUT caused by a single cell in a suspension medium can be detected. However, the signal of the single cell and the extracted permittivity are sensitive to the contrast of the dielectric properties between the cell and the medium, the size of the cell, the topology of the sensing electrodes, and the flow height of the cell [12].
The state of art low-frequency impedance characterization techniques [4,20,21] measure the effects of ionic current flow, electrode polarization, and membrane potential of the cell. However, the measurements using microwave frequency can detect the membrane dielectric changes and cytoplasm ionic concentration changes [4]. In the meanwhile, the broadband measurements specify the entire spectral response of the cell.
To tackle the challenge of analyzing the signal profile of a single cell from the system response, we introduce in this paper a novel system modeling and signal profile simulation technique for interferometric cytometry on single cell measurement. The Scattering-parameter (S-parameter) measurements of every component are loaded in the Keysight Advanced Design System (ADS) software tool for system modeling. Electromagnetic simulations of a short length sensing electrode with a particle, cube with 3 um side length, on top at different locations above the sensing electrodes are generated by means of Computer Simulation Technology (CST) software tool. This is needed to model the interferometric system as the signal varies once the particle is passing by the electrodes in flow. Furthermore, we propose a new design and fabrication of the microfluidic channel for easy disassembly and cleaning to solve the clogging issue and reuse of the electrodes. Finally, the 3 µm polystyrene spheres (PSSs) were detected to validate the system setup. Afterwards, the setup was applied to measure the yeast strain of S288C with a reported average diameter of 4 µm to extract the permittivity change of material under test (MUT) caused by yeast cells flowing over the sensor electrodes in the microfluidic channel.

2. Materials and Methods

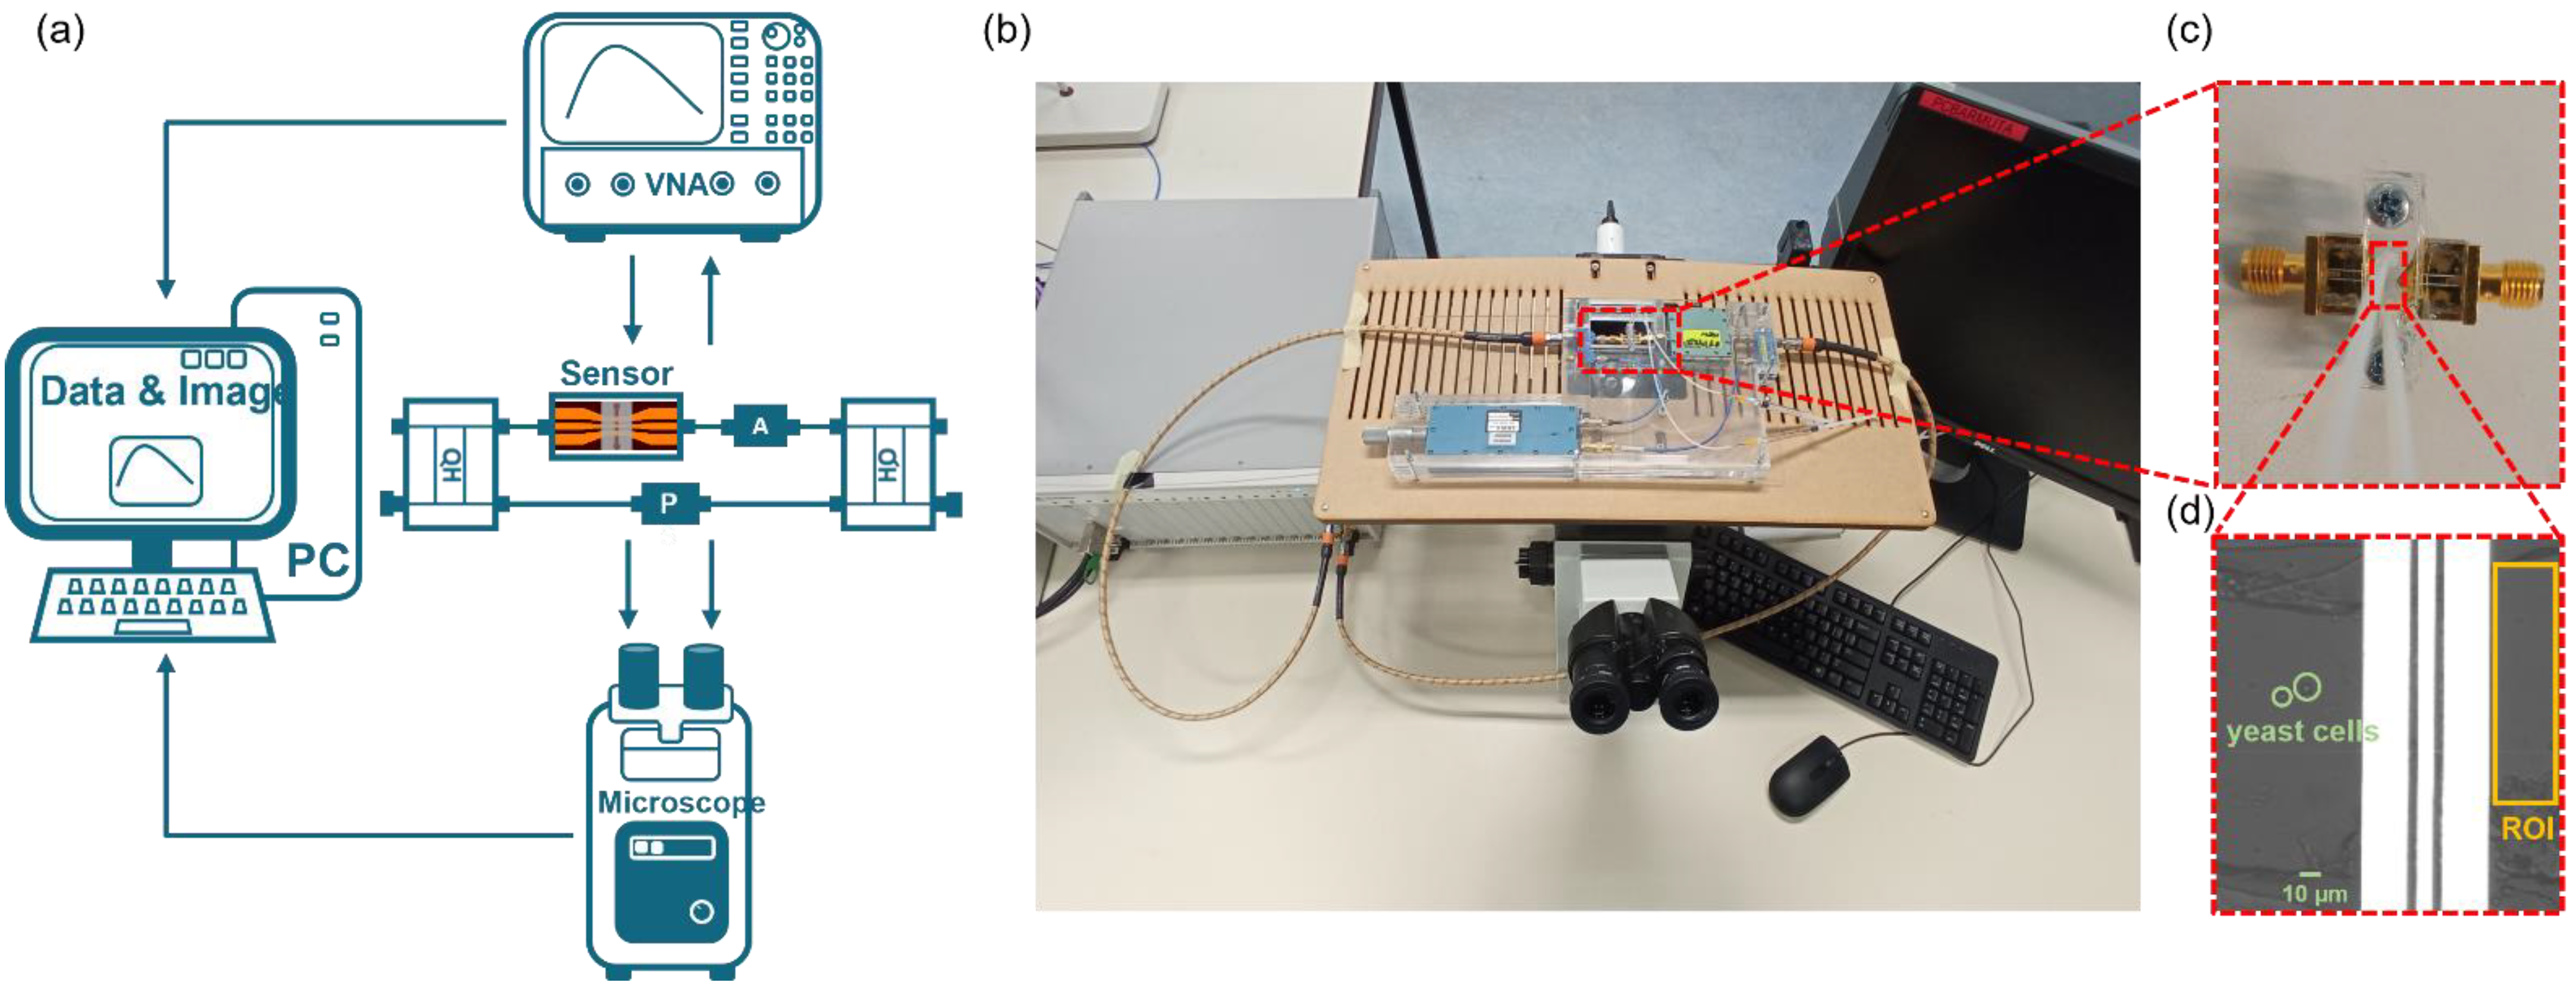
2.1. System Setup and Sensor Design

2.1.1. System Setup and Measurement Principle

The proposed system setup of microwave interferometric cytometry is shown in Figure 1a, which consists of four parts: (1) the proposed interferometric cytometry together with the designed microfluidic sensor; (2) the vector network analyzer (VNA, Keysight M9375A, Keysight, Santa Rosa, CA, USA) that generates high-frequency signals and provides the readout of the two-port S-parameter measurements; (3) an inverted microscope (Olympus IX73, Olympus Corporation, Tokyo, Japan, and Hamamatsu ORCA Flash 4 LT+ camera, Hamamatsu, Hamamatsu, Japan) for recording images of the yeast cells passing through the sensor to validate and correlate the microwave detection with the optical images; and (4) a computer for saving the data of electrical detection and the images of the optical system. Figure 1b shows the system setup during measurements.
During the single cell measurements, the high-frequency signals (4–18 GHz) generated from VNA are separated at the port 1 by a 90-degree coupler (SigaTek, SQ16506, 4–18 GHz, SigaTek LLC, Wayne, IN, USA) into two branches, the material-under-test (MUT) branch, and the reference (REF) branch, with 90 degrees phase difference. The MUT branch consists of the CPW sensor with a microfluidic channel and one attenuator (Narda 4799, 0–18 GHz, Narda-MITEQ, Hauppauge, NY, USA). While the REF branch contains only a phase-shifter (Arra 9428a, 0–18 GHz, ARRA INC, Bay Shore, NY, USA). The readout at port 2 of another 90-degree coupler, combining the two signals from both branches, has a base phase difference of 180 degrees. By respectively tuning the attenuator and phase-shifter to match the losses of the two branches and make their phases reversed, the interference null at a certain frequency can be achieved. This means that the base signal from the tuned setup is small compared to the input signal (the transmission signal is attenuated by generally −60 to −80 dB). Thus, small signal changes caused by single cells passing over the sensor inside the microfluidic channel can be detected with the proposed setup. The S-parameters of the system are measured and shown in Figure 2a, which is tuned at f 0 = 13   GHz to −67 dB with a quality factor ( Q = f 0 / f 3 d B ) equals to 3.8 × 10 4 . Then, the single cell measurements can be carried out at f 0 with high sensitivity.

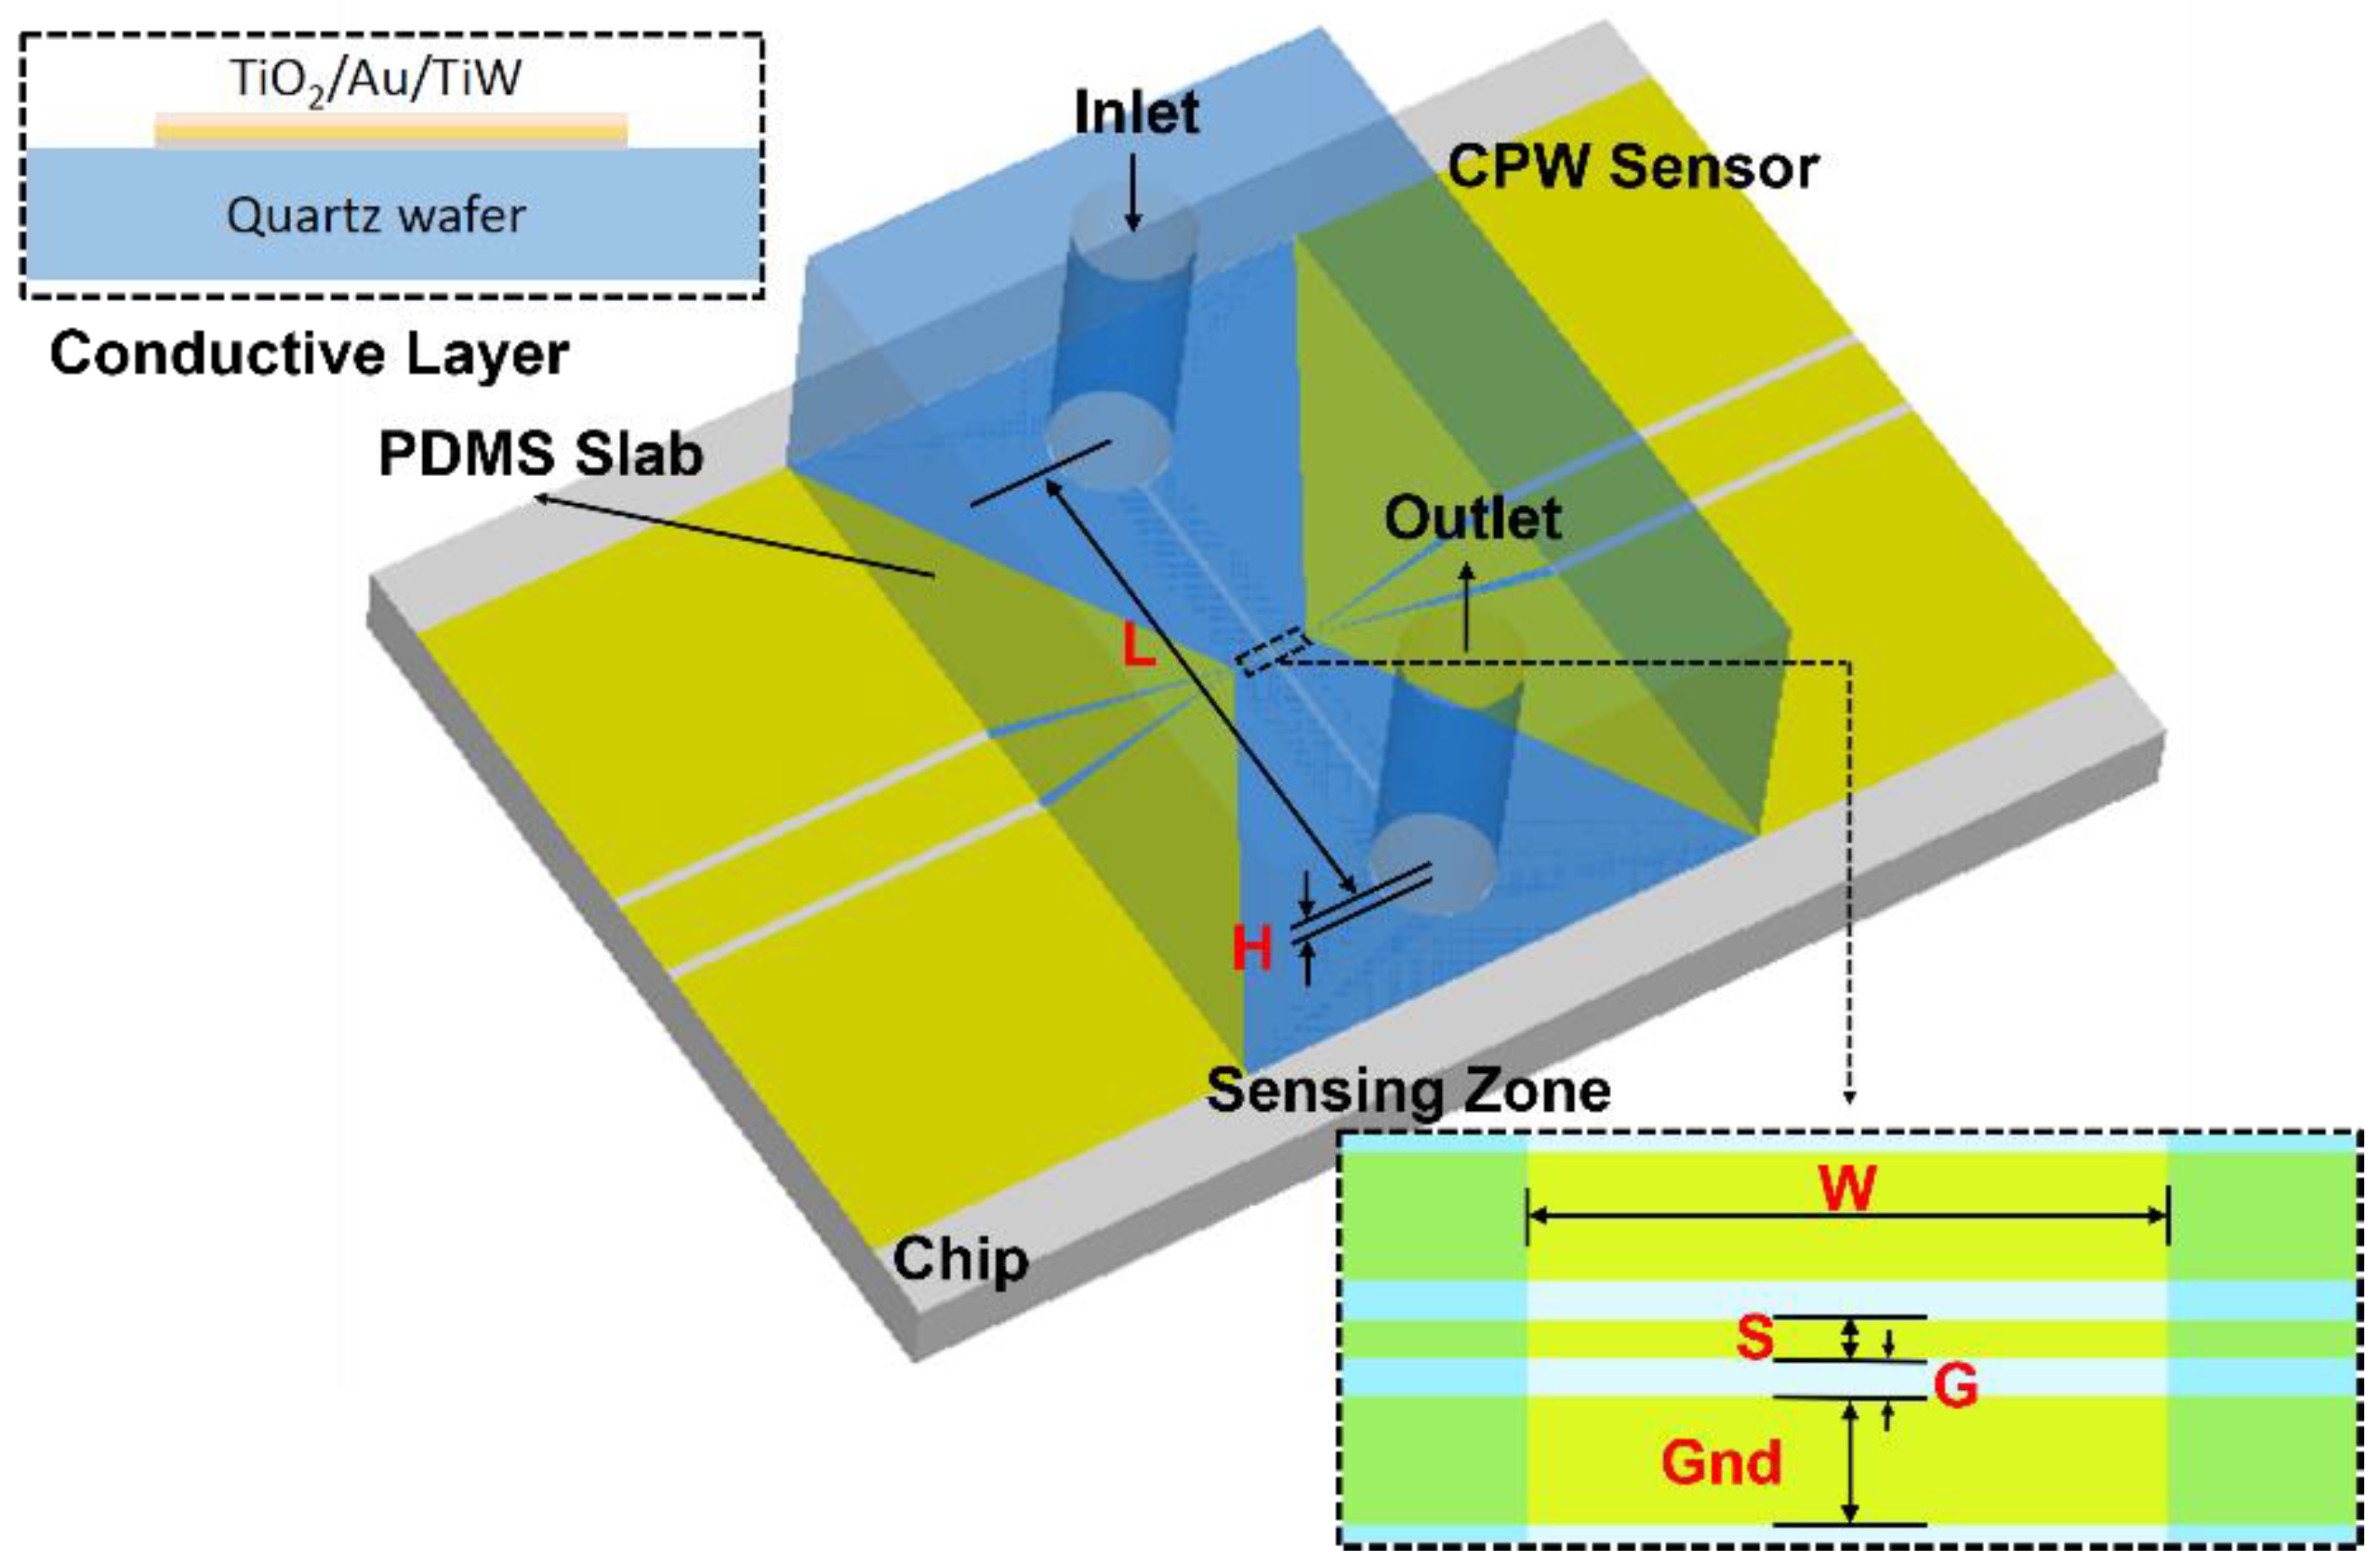
2.1.2. Sensor Design and Fabrication

For single cell measurements, a tapered co-planar waveguide (CPW) sensor is chosen for its planar structure which is compatible with the integration with a microfluidic channel and connections to the interferometric system. The dimensions of the electrodes should be comparable to the dimensions of the cells under test. The width of the sensing signal line and gap is both 6 µm and the ground is 20 µm wide.
The tapered CPW structure is fabricated on a 1 mm Quartz wafer using photoresist patterning, sputter coating, and lift-off techniques to form a 400 nm TiO2/Au/TiW conductor layer [22].
The microfluidic channel (Figure 3) is made by pasting the laser-cut super thin double-coated adhesive tape (Nitto, No.5601, 10 µm, Nitto Denko, Osaka, Japan) on top of the sensor, then applying a 4 mm thick polydimethylsiloxane (PDMS) slab for interconnecting the tubing with the microfluidic channel. The entire sensor and microfluidics structure is clamped by a polymethacrylate (PMMA) fixture on top and bottom with screws. As well, this new microfluidic structure can be easily disassembled, cleaned, and replaced with a new double-coated adhesive tape if the channel is clogged by the cells, making the electrode chip reusable. The S-parameter of the sensor structure with water filled liquid channel on top is shown in Figure 2b.

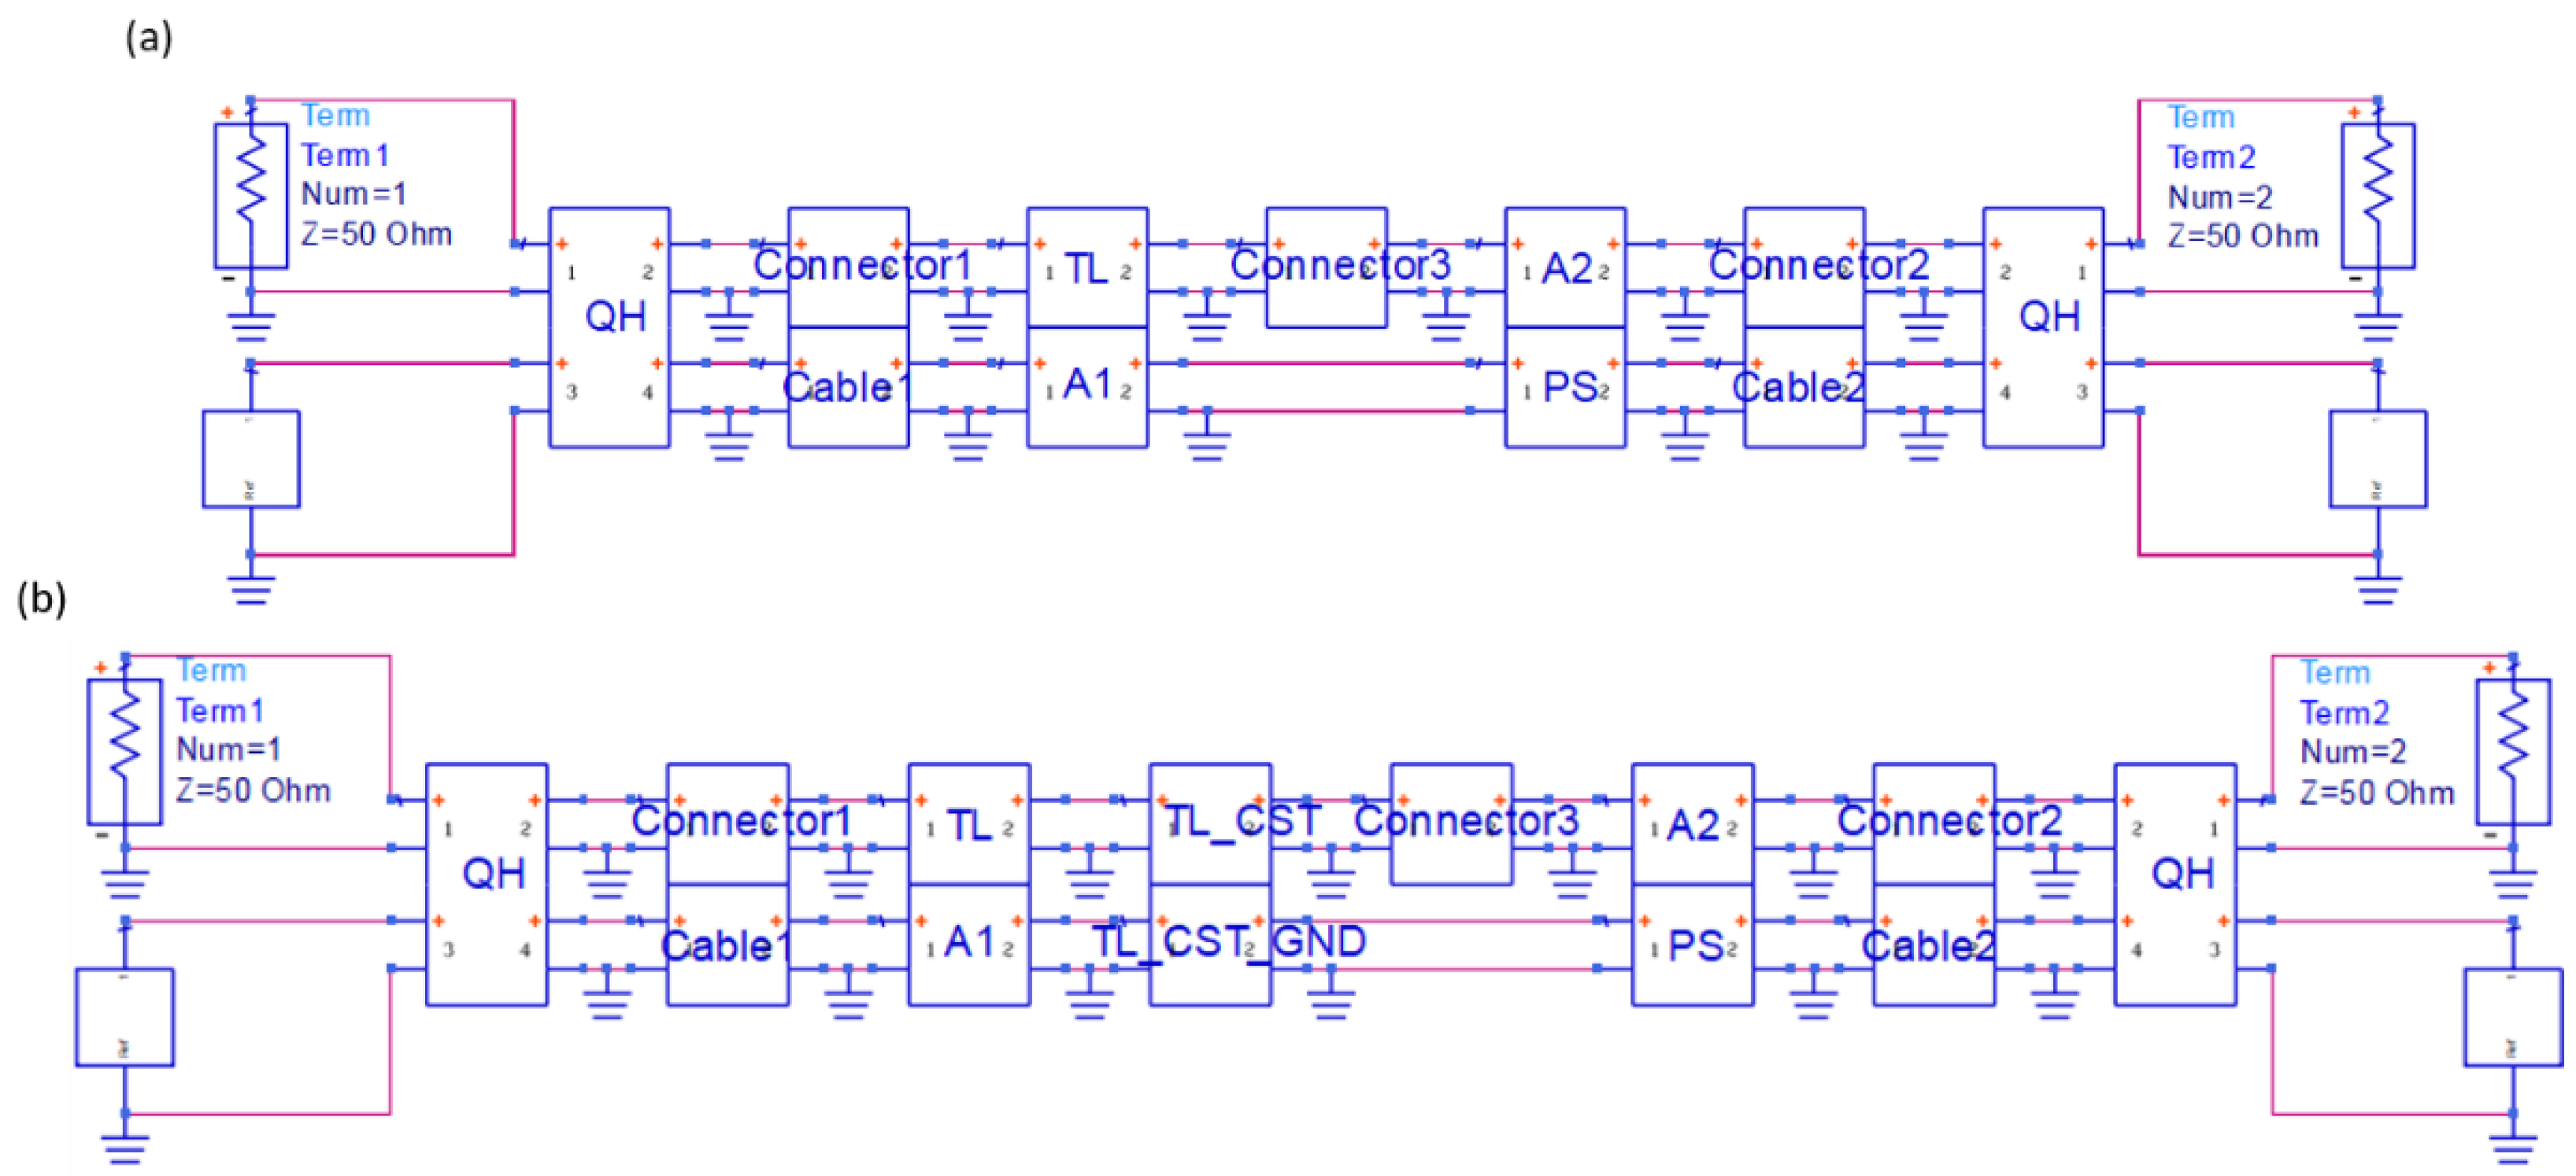
2.2. Modeling of the System

The microwave interferometric cytometry system is modeled in ADS (Figure 4). For system modeling, the different components of the interferometric cytometry are presented as independent units in ADS (Figure 4a), which are represented by the measured S-parameters of the corresponding components. The loaded S-parameters are measured with VNA, which is calibrated up to the ports of each component. The comparison of the modeled (blue dots) and measured (orange line) system response S-parameters is shown in Figure 5a, in which the system was tuned to 11 GHz to have the S21 be around −60 dB. The modeled system in ADS is in good match with the measured system response. The discrepancy in the S11 and S22 is mainly due to the reflections between different components caused by the mismatches. The S12 and S21 differences in the interference nulls are mostly coming from the inadequate sampling of the system model (frequency step is 5 MHz), in other words, the frequency step needs to be smaller to acquire the deep interference nulls. Thus, in Figure 5b, the system was modeled with a frequency step of 50 kHz in the frequency range of 12–14 GHz. The measured interference null at 13 GHz is −65 dB, while the modeled interference null is −62 dB, proving that the system model is in good comparison with the real laboratory-grade measurements.
For the sensor simulation, a small sensing CPW section of the length T equals 10 µm has been modeled in CST (Figure 6). To obtain fast and accurate simulation results of the particle passing through the sensing CPW, the cubic particle with a side length R = 3 µm is used in the model. The simulations are carried out for the particle at different positions relative to the cross-section of the sensing CPW at a center height of 2.5 µm above the substrate. The simulation results depicted in Figure 7 are the magnitude and the phase of transmission signal S21. The blue solid line and the orange ribbons around it are simulation results and their error range, respectively. While the yellow solid line and blue ribbon around it are respectively the mirrored simulation results and their error range of the left half to demonstrate their symmetry with the right half of the simulation results. The particle introduces signal variations when it passes through the region with high electromagnetic (EM) fields. As well, in correspondence with the EM field intensity, which is highest at the two gaps and relatively low at the center of the signal line, the variation signal caused by the particle shows a profile of “M” shape for both the magnitude and phase of S21.
To have a particle signal profile of the modeled system response, the simulation results of the sensor in CST are combined with the system modeling in ADS, as given in Figure 4b. The TL_CST unit is introduced in both the two branches for a better match of the signals and highlights the signal variation caused by the particle. The TL_CST_GND unit in the REF branch is loaded with simulation results of the particle above the ground signal, while the one in the MUT branch is loaded with simulation results of the particle at different positions relative to the sensing CPW. The overall simulation results are provided in Figure 8 for a 3 µm cubic particle passing through the CPW sensor with signal and gap widths equal to 6 µm. The interferometric cytometry system tuned to −62 dB at 13 GHz and a magnitude change of ~0.1 dB and a phase change of ~3 degrees can be detected.

2.3. Selection and Cultivation of the Yeast Strains

As a widely used laboratory Saccharomyces cerevisiae strain, the S288C is selected for the system validation experiments. The S288C is designed by Robert Mortimer for biochemical studies, and it is non-flocculent with a minimal set of nutritional requirements. Also, since it is a haploid strain, the diameter of it is around 4 µm, which has a closer volume to the cubic particle in our simulation compared to other diploid strains like MDS130.
During the preparation process of the experiments, the yeast cells were inoculated in glass tubes containing YPDE medium (10 g/L yeast extract, 20 g/L bacteriological peptone, 20 g/L glucose and 5 g/L ethanol) at 30 °C with 200 rpm in a rotary shaker for 24 h. After which the medium was diluted to reach OD600 = 2 for measuring the signals of stationary phase cells.

2.4. Experiment Workflow and Image Acquisition

After the yeast cells were cultivated, the diluted medium with yeast cell samples were extracted into syringes and kept in room temperature (~20 °C) for 20 min. During which, the interferometric cytometry system was tuned normally to a S21 of below −60 dB at the desired frequency when the microfluidic channel was filled with deionized (DI) water. As well, since the permittivity extraction algorithm requires two calibration measurements, the system was measured when the channel is filled with DI water as calibration 1 (Cal1) and when the channel is empty (or filled with air) as calibration 2 (Cal2). Then, the yeast cell samples were pushed through microfluidic channel with the syringe, recording the data readout from VNA and capturing the images from inverted microscope with software (HCImageLive) on the computer.

3. Results

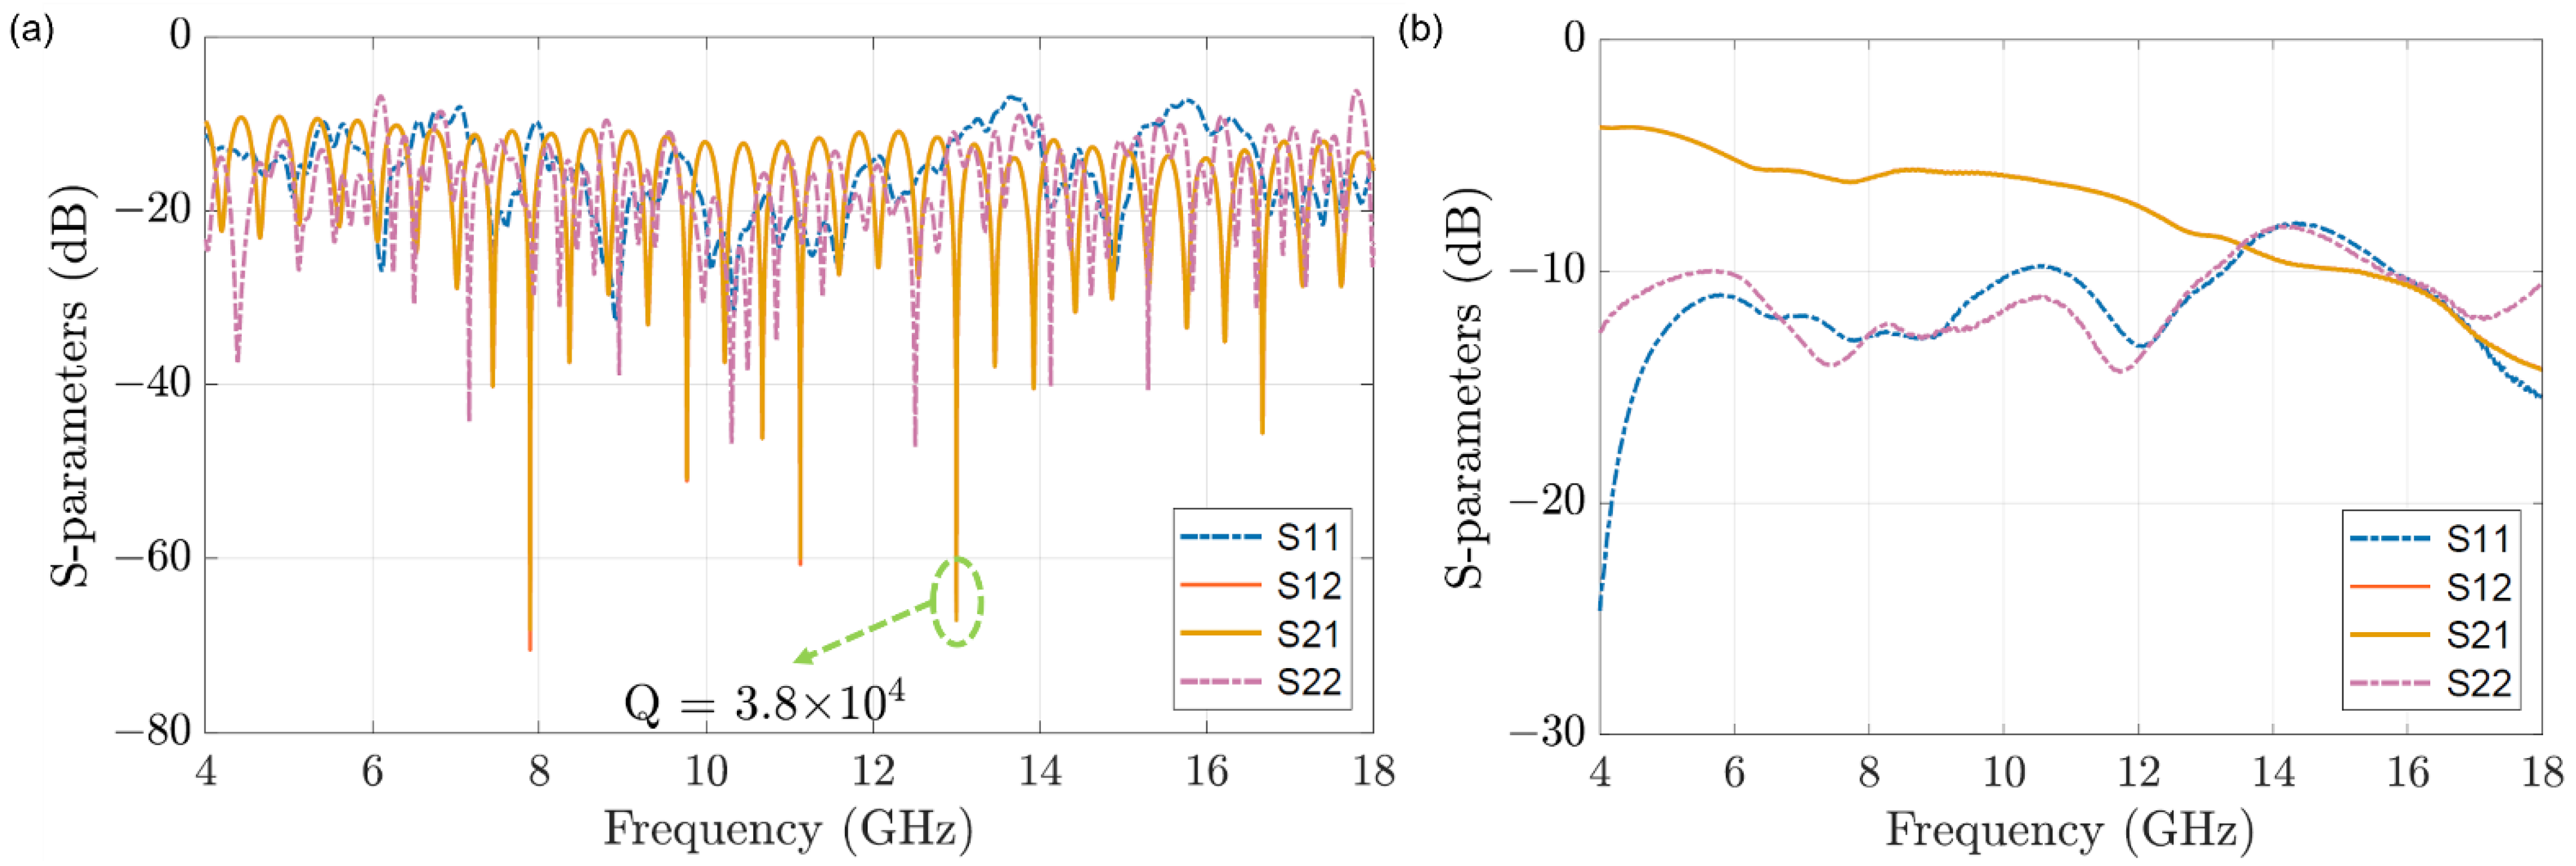
3.1. MUT Permittivity Extraction Algorithm

Similar to the permittivity extraction algorithm in [23], the measured S-parameters of MUT, Cal1, and Cal2, namely S11(MUT/Cal1/Cal2) and S21(MUT/Cal1/Cal2) are presented here
S 11 M U T S 11 C a l 1 S 11 C a l 2 S 11 C a l 1 = S 11 C P W ,       M U T S 11 C P W ,       C a l 1 S 11 C P W ,       C a l 2 S 11 C P W ,       C a l 1
S 21 M U T S 21 C a l 1 S 21 C a l 2 S 21 C a l 1 = S 21 C P W ,       M U T S 21 C P W ,       C a l 1 S 21 C P W ,       C a l 2 S 21 C P W ,       C a l 1
in which, S11(CPW, MUT/Cal1/Cal2) and S21(CPW, MUT/Cal1/Cal2) are conformal mapping results of the CPW in the sensing zone, taking the reflection effects caused by mismatch into consideration.
S 11 C P W , M U T / C a l 1 / C a l 2 = Z C P W 2 Z 0 2 sinh γ l 2 Z C P W Z 0 cosh γ l + Z C P W 2 + Z 0 2 sinh γ l
S 21 C P W , M U T / C a l 1 / C a l 2 = 2 Z C P W Z 0 2 Z C P W Z 0 cosh γ l + Z C P W 2 + Z 0 2 sinh γ l
And Z 0 is 50 Ω, l is the length of sensing CPW, while the characteristic impedance of the sensing CPW
Z   ( C P W ,   MUT / Cal 1 / Cal 2 = ε e f f ( MUT / Cal 1 / Cal 2 C t o t c
where C t o t is the superposition of all four partial capacitance from the conformal mapping, and ε e f f ( MUT / Cal 1 / Cal 2 is the effective permittivity of the sensing CPW with MUT, Cal1 or Cal2 filling the microfluidic channel.
Together with the propagation constant γ M U T / C a l 1 / C a l 2 = α c + α d + j β , which consists of the conductive ( α c ) and dielectric ( α d ) loss, and phase constant ( β ) of the sensing CPW, the complex permittivity of unknown MUT can be extracted based on their relation with the effective permittivity and the propagation constant for better interpretation of the detected single cell signals.

3.2. System Validation and Its Application of Yeast Strain—S288C Measurements

The validation of the microwave interferometric cytometry system is firstly carried out by detecting 3 µm polystyrene particles (PSS), verifying the system modeling and single-cell signal profiling. Then, the system is used to quantitatively measure the broadband permittivity changes of MUT caused by single yeast cells of S288C flowing through the CPW sensor in the microfluidic channel.
For system validation, the detection of the 3 µm PSSs, diluted in the DI water, was performed by pumping the PSSs solution through the microfluidic channel with a syringe when the system was tuned to around −69 dB at 11 GHz. The raw data of the system S21 in Figure 9a shows two particle detection signals with zoomed in views in the inset figures. The maximum S21 changes of the two detection signal peaks are around 2 and 1.5 dB in magnitudes, which is mainly due to the different heights of the PSSs above the sensor. As well, the detection signals have the profile of the “W” shape, which is the inversion of the “M” shape simulated in Section 2.1. Whether the decreasing of MUT effective permittivity caused by PSSs will result in the “M” shape or the “W” shape depends on the different tuning status of the system. It is the reason why the extraction of MUT permittivity is necessary for analyzing single-cell signals.
To further demonstrate the proposed system, a quantitative analysis of MUT permittivity is carried out with S288C yeast strain measurements. As described in Section 2.4, the system was firstly tuned to around −67 dB at 4 GHz with DI water filling the microfluidic channel, the system S21 was recorded as Cal1 at room temperature of 20 °C. Secondly, the diluted S288C solution with OD600 = 2 was pumped into the channel with a syringe, the detected signals were saved as MUT (Figure 9b). The concentration of the yeast cell solution is prepared as ~8 × 10⁷ cells/mL, which makes most of the detected signals represent a single cell passing through the sensor. As well, the flow rate of the cells is 1.5 mm/s on average. At last, the channel was emptied by pumping air into it, and the system S21 was noted as Cal2.
The detected signal of a single yeast cell is compared to that of 3 µm PSS and the simulated cubic particle in Figure 10a. Despite the inverted detection signals from the simulated results, the signal of S288C has a larger variation at the center signal line of the CPW sensor compared with the signal of 3 µm PSS. Because S288C in general has an average diameter of 4 µm, which is larger in volume than the PSS of 3 µm diameter. The volume of S288C is large enough to influence the electromagnetic fields on top of the signal line of the CPW sensor. Figure 10b illustrates the correspondence between the single cell detection of microwave interferometric cytometry and the optical microscope. Within the three seconds of detection, there are three cells passing through the sensor. They are captured by the microscope images as changes of overall intensity and recorded by the proposed system, which verifies the successful detection. The magnitude changes of the first two cells are larger compared to the third one, meaning that the third cell is most probably smaller than the first two. It is validated from the captured images during the experiment, since the third cell has a smaller intensity change as a result of fewer pixels on the images, meaning that it has a smaller size. In one measurement set of 14 s, there are 28 signal profiles detected by the proposed system, while 31 peaks were counted in the image intensity figure, resulting in a successful detection rate of around 90%.
The measurements of single yeast cells were conducted at different frequencies over the entire frequency range of the system. As well, their complex permittivities of MUT with the single yeast cells present at the gap, which causes the signal peaks, are extracted with the algorithm mentioned in Section 3.1. The examples of extracted data points at 4, 8, and 12 GHz are drawn in Figure 11a in comparison to the complex permittivity of DI water at 20 °C. The differences in the extracted complex permittivity at a certain frequency are mainly caused by the size variation of the S288C and the height difference when the cells pass through the sensor.
The extracted broadband complex permittivities from the measured signals, in the frequency range of 4–18 GHz and at the room temperature of 20 °C, are plotted in Figure 11b,c. The blue error bars with mean values show the variations of the detection signals. The orange lines are the third-order polynomial fitting of the mean values, and the black solid lines are the complex permittivity of DI water at 20 °C. The overall look of the extracted complex permittivity shows that the effective permittivity of MUT reduced when the cells pass through the sensor, since the heavily diluted medium of S288C has similar permittivity values compared to DI water. As well, the permittivity change in absolute value is larger in lower frequency for the real part, however, it is larger in higher frequency for the imaginary part.

4. Discussion

The detection of 3 µm PSSs has validated the functionality of system setup and applicability of the signal profiling technique based on system modeling and sensor simulation. The measurement and permittivity extraction of S288C yeast cells has demonstrated the system’s capability of quantitative analysis of single-cell signals. The extracted complex permittivity of S288C cells illustrated in Figure 11 shows an average decrease of 0.8–2 for the real part permittivity and 0.9–2.1 for the imaginary part permittivity, which are 3–4 times the permittivity change measured in [12]. The main reason is that despite the heights of the channel being the same, the width of the electrode in [12] is 10 µm, while it is 6 µm in this work. The smaller the electrode, the larger the volume ratio of the cell to the effective volume of the channel, causing larger permittivity changes. The comparison between the S21 signals of S288C cells, 3 µm PSSs, and the simulated cubic particle in Figure 10a shows the sensitivity of the detection signal to the size of the cells, which can possibly be analyzed in the future for size and height determination. Also, the toxicity of the adhesive material from the double-coated adhesive tape needs to be further tested. As well, more importantly, the sensitivities of the signal profile to the contrast of the dielectric properties between the cell and the medium, the size of the cell, the topology of the sensing electrodes, and the flow height of the cell should be analyzed in the next step.

Author Contributions

Conceptualization: M.Z., G.H. and T.M.; methodology: M.Z., G.H., J.B., T.M.; software: M.Z. and G.H.; validation: M.Z. and G.H.; formal analysis: M.Z. and T.M.; investigation: M.Z. and T.M.; resources, P.V.D., T.M. and B.N.; data curation: M.Z. and G.H.; writing—original draft preparation: M.Z., G.H. and T.M.; writing—review and editing: T.M.; visualization: M.Z. and G.H.; supervision: T.M., P.V.D. and B.N.; project administration: T.M.; funding acquisition: T.M., P.V.D. and B.N. All authors have read and agreed to the published version of the manuscript.

Funding

This work is sponsored by the Research Foundation Flanders (FWO) research project (G0A1220N).

Institutional Review Board Statement

Not applicable.

Informed Consent Statement

Not applicable.

Data Availability Statement

Not applicable.

Acknowledgments

The authors would like to thank Matko Martinic, Marie Mertens, and Maede Chavoshi for their help on chip fabrication and discussion, Johan M. Thevelein from the Laboratory of Molecular Cell Biology, Institute of Botany and Microbiology, KU Leuven for providing the measurement samples, the Nitto Belgium NV for providing the super thin double-coated adhesive tape samples, Donald Raddoux from MICAS, KU Leuven for wafer dicing and the Fablab Leuven for technical support.

Conflicts of Interest

The authors declare no conflict of interest.

References

  1. Markovic, T.; Liu, S.; Barmuta, P.; Ocket, I.; Cauwe, M.; Schreurs, D.; Nauwelaers, B. Microwave Heater at 20 GHz for Nanoliter Scale Digital Microfluidics. In Proceedings of the 2015 IEEE MTT-S International Microwave Symposium (IMS), Phoenix, AZ, USA, 17–22 May 2015. [Google Scholar]
  2. Markovic, T.; Ocket, I.; Jones, B.; Nauwelaers, B. Characterization of a Novel Microwave Heater for Continuous Flow Microfluidics Fabricated on High-Resistivity Silicon. In Proceedings of the 2016 IEEE MTT-S International Microwave Symposium (IMS), San Francisco, CA, USA, 22–27 May 2016. [Google Scholar]
  3. Shaw, K.J.; Docker, P.T.; Yelland, J.V.; Dyer, C.E.; Greenman, J.; Greenway, G.M.; Haswell, S.J. Rapid PCR amplification using a microfluidic device with integrated microwave heating and air impingement cooling. Lab A Chip 2010, 10, 1725–1728. [Google Scholar] [CrossRef] [PubMed]
  4. Afshar, S.; Salimi, E.; Braasch, K.; Butler, M.; Thomson, D.J.; Bridges, G.E. Multi-Frequency DEP Cytometer Employing a Microwave Sensor for Dielectric Analysis of Single Cells. IEEE Trans. Microw. Theory Tech. 2016, 64, 991–998. [Google Scholar] [CrossRef]
  5. Yang, Y.; Zhang, H.; Zhu, J.; Wang, G.; Tzeng, T.-R.; Xuan, X.; Huang, K.; Wang, P. Distinguishing the viability of a single yeast cell with an ultra-sensitive radio frequency sensor. Lab A Chip 2010, 10, 553–555. [Google Scholar] [CrossRef] [PubMed]
  6. Zhao, Y.; Zhao, X.; Chen, D.; Luo, Y.; Jiang, M.; Wei, C.; Long, R.; Yue, W.; Wang, J.; Chen, J. Tumor cell characterization and classification based on cellular specific membrane capacitance and cytoplasm conductivity. Biosens. Bioelectron. 2014, 57, 245–253. [Google Scholar] [CrossRef]
  7. Valero, A.; Braschler, T.; Renaud, P. A unified approach to dielectric single cell analysis: Impedance and dielectrophoretic force spectroscopy. Lab A Chip 2010, 10, 2216–2225. [Google Scholar] [CrossRef]
  8. Cheung, K.C.; Di Berardino, M.; Schade-Kampmann, G.; Hebeisen, M.; Pierzchalski, A.; Bocsi, J.; Mittag, A.; Tarnok, A. Microfluidic impedance-based flow cytometry. Cytom. Part A 2010, 77, 648–666. [Google Scholar] [CrossRef]
  9. Grenier, K.; Dubuc, D.; Chen, T.; Artis, F.; Chretiennot, T.; Poupot, M.; Fournie, J.-J. Recent Advances in Microwave-Based Dielectric Spectroscopy at the Cellular Level for Cancer Investigations. IEEE Trans. Microw. Theory Tech. 2013, 61, 2023–2030. [Google Scholar] [CrossRef] [Green Version]
  10. Leroy, J.; Dalmay, C.; Landoulsi, A.; Hjeij, F.; Mélin, C.; Bessette, B.; du Puch, C.B.M.; Giraud, S.; Lautrette, C.; Battu, S.; et al. Microfluidic biosensors for microwave dielectric spectroscopy. Sens. Actuators A Phys. 2015, 229, 172–181. [Google Scholar] [CrossRef]
  11. Martinic, M.; Markovic, T.; Baric, A.; Nauwelaers, B. A 4 × 4 Array of Complementary Split-Ring Resonators for Label-Free Dielectric Spectroscopy. Chemosensors 2021, 9, 348. [Google Scholar] [CrossRef]
  12. Osterberg, J.A.; Dahal, N.; Divan, R.; Miller, C.S.; Moline, D.; Caldwell, T.P.; Yu, X.; Harcum, S.W.; Wang, P. Microwave Sensing of Yeast Cell Species and Viability. IEEE Trans. Microw. Theory Tech. 2021, 69, 1875–1886. [Google Scholar] [CrossRef]
  13. Osterberg, J.A.; Milanes, J.; Morris, J.; Wang, P. Detection of Trypanosoma brucei by microwave cytometry. Sens. Actuators Rep. 2022, 4, 100074. [Google Scholar] [CrossRef]
  14. Ferrier, G.A.; Romanuik, S.F.; Thomson, D.J.; Bridges, G.E.; Freeman, M.R. A microwave interferometric system for simultaneous actuation and detection of single biological cells. Lab A Chip 2009, 9, 3406–3412. [Google Scholar] [CrossRef]
  15. Bridges, G.; Cabel, T.; Afshar, S.; Salimi, E.; Thomson, D.; Butler, M. Microwave Near-Field Detection of Single Biological Cells and Nanoparticles. In Proceedings of the 2018 18th International Symposium on Antenna Technology and Applied Electromagnetics (ANTEM), Waterloo, ON, Canada, 19–22 August 2018; pp. 1–2. [Google Scholar] [CrossRef]
  16. Cui, Y.; Kenworthy, A.; Edidin, M.; Divan, R.; Rosenmann, D.; Wang, P. Analyzing Single Giant Unilamellar Vesicles With a Slotline-Based RF Nanometer Sensor. IEEE Trans. Microw. Theory Tech. 2016, 64, 1339–1347. [Google Scholar] [CrossRef] [Green Version]
  17. Zhang, M.; El Ghannudi, H.; Marcaccioli, L.; Montori, S.; Bao, X.; Markovic, T.; Ocket, I.; Sorrentino, R.; Nauwelaers, B. High-Sensitivity Large-Throughput Broadband Tunable Microwave Wear Debris Sensing System. IEEE Sens. J. 2021, 22, 304–314. [Google Scholar] [CrossRef]
  18. Cui, Y.; Wang, P. Auto-Tuning and Self-Calibration of High-Sensitivity Radio Frequency Interferometers. IEEE Microw. Wirel. Compon. Lett. 2016, 26, 957–959. [Google Scholar] [CrossRef] [Green Version]
  19. Ye, D.; Cutter, G.; Caldwell, T.P.; Harcum, S.W.; Wang, P. A Systematic Method to Explore Radio-Frequency Non-Thermal Effect on the Growth of Saccharomyces cerevisiae. IEEE J. Electromagn. RF Microw. Med. Biol. 2021, 6, 52–60. [Google Scholar] [CrossRef]
  20. Brazey, B.; Cottet, J.; Bolopion, A.; Van Lintel, H.; Renaud, P.; Gauthier, M. Impedance-based real-time position sensor for lab-on-a-chip devices. Lab A Chip 2018, 18, 818–831. [Google Scholar] [CrossRef]
  21. Lefevre, A.; Gauthier, V.; Gauthier, M.; Bolopion, A. Closed-Loop Control of Particles Based on Dielectrophoretic Actuation. IEEE/ASME Trans. Mechatron. 2022, 1–10. [Google Scholar] [CrossRef]
  22. Bao, J.; Markovic, T.; Brancato, L.; Kil, D.; Ocket, I.; Puers, R.; Nauwelaers, B. Novel fabrication process for integration of microwave sensors in microfluidic channels. Micromachines 2020, 11, 320. [Google Scholar] [CrossRef] [Green Version]
  23. Zhang, M.; Bao, X.; Barmuta, P.; Bao, J.; Markovic, T.; Ocket, I.; Schreurs, D.; Nauwelaers, B. Fully Automated Electrically Controlled Tunable Broadband Interferometric Dielectric Spectroscopy for Aqueous Solutions. IEEE Trans. Microw. Theory Tech. 2021, 70, 532–541. [Google Scholar] [CrossRef]
  24. Sato, T.; Buchner, R. The cooperative dynamics of the H-bond system in 2-propanol/water mixtures: Steric hindrance effects of nonpolar head group. J. Chem. Phys. 2003, 119, 10789–10800. [Google Scholar] [CrossRef]
Figure 1. The schematic of the measurement system of the proposed microwave interferometric cytometry and the designed microfluidic sensor. (a) the schematic and (b) the picture of the measurement system setup, including the proposed microwave interferometric cytometry, VNA, microscope, and computer; (c) The designed co-planar waveguide (CPW) sensor with tapering structure and microfluidics on top (a straight channel with one inlet and one outlet); (d) The microscope image of two yeast cells (marked inside the green circles) approaching the CPW sensor (the bright CPW structure consisting of 3 parallel electrodes) in the microfluidic channel. The orange rectangular shows the region of interest (ROI) for microscope image intensity calculation.
Chemosensors 10 00318 g001
Figure 2. The S-parameters of (a) the measurement system of the proposed microwave interferometric cytometry and (b) the designed microfluidic sensor.
Chemosensors 10 00318 g002
Figure 3. The topology of the tapered CPW sensor structure with microfluidic channel on top and the zoomed-in sensing zone. Topology of the gold coated CPW sensor on quartz chip. The parameters of the sensing CPW lines are S(ignal) = 6 um, G(ap) = 6 um, and Gnd = 20 um, and dimensions of the PDMS liquid channel are L = 7 mm, W = 0.1 mm, and H = 10 um.
Chemosensors 10 00318 g003
Figure 4. The modeling of the interferometric cytometry system in ADS (a) without sensor simulation in CST; and (b) with sensor simulation in CST. QH stands for quadrature hybrid, the 90-degree coupler; TL stands for transmission line, which is the tapered CPW sensor; A1 is the 6 dB attenuator; A2 and PS are the tunable attenuator and phase shifter respectively.
Chemosensors 10 00318 g004
Figure 5. The S−parameter comparisons between the modeled system in ADS with measurement results for (a) the whole frequency range of 4−18 GHz, tuned at 11 GHz, in the frequency step of 5 MHz; and (b) the frequency range of 12−14 GHz, tuned at 13 GHz, in the frequency step of 50 kHz.
Chemosensors 10 00318 g005
Figure 6. The CST simulation model of the sensing CPW structure (Au) on quartz substrate with microfluidic channel (DI water) on top and covered with PDMS slab. The cubic particle (polystyrene) with a side length R of 3 µm is placed at a different position relative to the sensing CPW, with its center height of 2.5 µm. The liquid channel Hcst is 5 µm here in the model and the length T is 10 µm.
Chemosensors 10 00318 g006
Figure 7. The CST simulation results in the particle at different positions relative to the cross-section of the sensing CPW structure to mimic the process of particle passing through the sensor. (a) the magnitude and (b) the phase of transmission signal S21. The blue solid line and the orange ribbon around it are simulation results and their error range respectively. While the yellow solid line and blue ribbon around it are respectively the mirrored simulation results and their error range of the left half to demonstrate their symmetry with the right half of the simulation results.
Chemosensors 10 00318 g007
Figure 8. The overall simulation results for the particle signal profiling of the system responses, at different positions relative to the cross-section of the sensing CPW structure, to mimic the process of particle passing through the sensor. (a) the magnitude and (b) the phase of transmission signal S21.
Chemosensors 10 00318 g008
Figure 9. The raw data of system S21 when (a) the solution of 3 um PSSs and (b) the single yeast cell of S288C passing through the sensor in the microfluidic channel.
Chemosensors 10 00318 g009
Figure 10. (a) The comparison of system S21 signals between the single yeast cell of S288C, the solution of 3 um PSSs, and the simulated cubic particle in CST. (b) the optical correspondence with electrical detection using the intensity changes of the microscope images.
Chemosensors 10 00318 g010
Figure 11. (a) The extracted data points at 4, 8, and 12 GHz in comparison to the complex permittivity of DI water at 20 °C [24]. (b) real (ɛ′) and (c) imaginary (ɛ″) permittivity of the single S288C yeast cells in the frequency range of 4–18 GHz at the room temperature of 20 °C. The blue error bars with mean values show the variations of the detection signals. The orange lines are the third-order polynomial fitting of the mean values. The black solid lines are complex permittivity of DI water at 20 °C.
Chemosensors 10 00318 g011
Publisher’s Note: MDPI stays neutral with regard to jurisdictional claims in published maps and institutional affiliations.

