Article

Impact of Surface Area on Sensitivity in Autonomously Reporting Sensing Hydrogel Nanomaterials for the Detection of Bacterial Enzymes

by
Celestine Kathure Kinyua
1,2,†,
Ayub Omondi Owino
1,2,†,
Kawaljit Kaur
1,
Dipankar Das
1,3,
Nancy Wangechi Karuri
4,
Mareike Müller
1 and
Holger Schönherr
1,*
1
Physical Chemistry I & Research Center for Micro- and Nanochemistry and Bio(Technology) (Cμ), Department of Chemistry and Biology, School of Science and Technology, University of Siegen, 57076 Siegen, Germany
2
Department of Mechanical Engineering, Dedan Kimathi University of Technology, Nyeri-Mweiga Road, Nyeri 10143, Kenya
3
Department of Chemistry, SRM Institute of Science and Technology, SRM Nagar, Potheri, Kattankulathur 603203, Tamil Nadu, India
4
Department of Chemical Engineering, Dedan Kimathi University of Technology, Nyeri-Mweiga Road, Nyeri 10143, Kenya
*
Author to whom correspondence should be addressed.
These authors contributed equally to this work.
Chemosensors 2022, 10(8), 299; https://doi.org/10.3390/chemosensors10080299
Submission received: 21 June 2022 / Revised: 22 July 2022 / Accepted: 23 July 2022 / Published: 30 July 2022
(This article belongs to the Special Issue Progress of Nanomaterials for Colorimetric Sensing)

Abstract

:
The rapid and selective detection of bacterial contaminations and bacterial infections in a non-laboratory setting using advanced sensing materials holds the promise to enable robust point-of-care tests and rapid diagnostics for applications in the medical field as well as food safety. Among the various possible analytes, bacterial enzymes have been targeted successfully in various sensing formats. In this current work, we focus on the systematic investigation of the role of surface area on the sensitivity in micro- and nanostructured autonomously reporting sensing hydrogel materials for the detection of bacterial enzymes. The colorimetric sensing materials for the detection of β-glucuronidase (ß-GUS) from Escherichia coli (E. coli) were fabricated by template replication of crosslinked pullulan acetoacetate (PUAA) and by electrospinning chitosan/polyethylene oxide nanofibers (CS/PEO NFs), both equipped with the chromogenic substrate 5-bromo-4-chloro-3-indolyl-β-D-glucuronide. The investigation of the dependence of the initial reaction rates on surface area unveiled a linear relationship of rate and thereby time to observe a signal for a given concentration of bacterial enzyme. This knowledge was exploited in nanoscale sensing materials made of CS/PEO NFs with diameters of 295 ± 100 nm. Compared to bulk hydrogel slabs, the rate of hydrolysis was significantly enhanced in NFs when exposed to bacteria suspension cultures and thus ensuring a rapid detection of living E. coli that produces the enzyme β-GUS. The findings afford generalized design principles for the improvement of known and novel sensing materials towards rapid detection of bacteria by nanostructuring in medical and food related settings.

1. Introduction

The development of multiple resistances of bacteria to antibiotics and the consequence of this development impose a severe threat to mankind [1]. For example, in 2019 alone, Murray et al. [2] estimated that there were 4.95 million deaths associated with bacterial infections. Apart from widespread infections, an estimated 1.27 million deaths were caused by antimicrobial resistance [2]. Antibacterial drugs used to treat a certain bacterial infection are ineffective upon development of a certain antimicrobial resistance. It is fair to conclude that this development creates an increasingly severe burden on healthcare systems worldwide due to high treatment costs, longer treatment periods and hospital stays [3,4].
Over the last decades the rapid detection of various bacterial pathogens, the sensing of bacterial infections as well as the development of materials and approaches that aim at improved wound healing have become one focus area of biomaterials research. Both Gram positive and Gram negative bacteria contribute to bacterial infections in this context. Pathogenic bacteria and related infections are not only a major concern in a medical setting and in wound infections, but also for food processing as well as water supply and storage systems [5]. Escherichia coli (E. coli), which is an opportunistic human pathogen that lives as a commensal in the mammalian colon, is used as hygiene marker in drinking or industrial water, but can also cause severe medical problems, such as uropathogenic (EPEC) or enteropathogenic (EPEC) bacterium and in wound infections [6]. The target enzyme for E. coli detection is β-glucuronidase (β-GUS) that is produced by most E. coli strains [7].
The challenge has been identified as a key objective of the WHO and certainly mandates the development and investigation of new antimicrobial drugs or treatment modalities [8,9]. Likewise, there is a clear need for new diagnostic platforms and approaches for rapid and selective detection of bacterial pathogens to be able to limit the use of antibiotics and to prescribe antibiotics in a much more targeted manner. In this context nanostructured materials are considered to play a very important role. The nanoscale dimensions offer advantages for coating materials and in terms of times scales for mixing and diffusion, thus rapid response times.
In general, the detection and identification of bacteria, including the identification of antibiotic resistant strains, can be considered a routine task for adequately equipped microbiology and clinical laboratories. However, for appropriate monitoring and testing these tasks have to be fulfilled efficiently worldwide in various local settings without access to adequate laboratories or even electricity. In addition, tests have to be cost efficient to enable nationwide routine tests.
Traditional methods of bacteria detection including cultivation are considered too time consuming for rapid testing [10,11], while state of the art clinical methods require specialized equipment [12,13,14,15]. Therefore, to reduce the detection time and to develop much less expensive and simple point-of-care tests, novel sensing methods have been investigated in the past years. These methods and approaches include among others fluorescent labeling [16], the use of amperometric biosensors [17], piezoelectric biosensors [18], and polymerase chain reaction (PCR) [19].
Nanoscale materials chemistry approaches have also contributed significantly to this area, in particular as their improvements pave the way to routine point-of-care tests also in non-laboratory settings. Work in this area includes reporter liposomes for detection of bacterial infection in wound dressings [20,21], polymeric reporter nanocapsules [22,23] nanoparticles [24], nanofiber-enabled sensing approaches [5,25,26], and also autonomously reporting hydrogels [27,28].
These autonomously reporting sensing materials produce a readily discernible colorimetric signal, i.e., a marked change in color or fluorescence that can be detected visually, in response to the presence of bacteria or a critical colonization threshold, respectively. The colorimetric signal is a consequence of a physical process or chemical reaction that is triggered by molecular species, which are produced and secreted by the target bacteria. This can be e.g., the bacterial toxin-mediated opening of reporter dye filled liposomes [20,21] or the degradation of polymersome walls by bacterial enzymes resulting in the change of fluorescence of an encapsulated reporter dye [22,23]. In autonomously reporting hydrogel materials bacterial enzymes hydrolyze selectively the chemical bond between a sugar moiety and a reporter dye, enabling the rapid and selective detection and in some cases visual identification of bacteria [27,28]. This approach was also adapted to a lab-in-phone based point-of-care detection [29].
Early work on enzyme responsive hydrogels [30] has shown that the film thickness of reporter hydrogels on solid supports possesses virtually no effect on the initial reaction rate, and hence on the sensitivity of the sensor. Motivated by this observation, the enhanced sensor response in extruded nanoscale fibers was investigated and an enhanced sensitivity was demonstrated [31].
A similar increase in sensitivity and response time is also expected for nanofibers that are fabricated using electrospinning [25,26]. In general, electrospinning is a versatile technique to produce nanofibers with controllable diameters and morphologies and has been refined in the past decades to also find application for the actual production of commercially available materials. The beneficial properties of electrospun nanofibers include high porosity, large specific surface area, ease of functionalization and fabrication [32,33] and hence electrospun nanofibers have enabled prototypical applications in advanced drug delivery and environmental monitoring applications [34,35]. In addition, several studies also showed enhanced stability and functionality of the encapsulated bioactive compounds in electrospun nanofibers [36]. In biosensing, electrospun nanofibers have been used, e.g., in sensing glucose [37], urea [38] or DNA [39]. They enabled the fabrication of wearable sensors [40] and were used also for the detection of bacteria [41], SARS-Cov-2 [42], and breast cancer biomarkers [43]. Finally, they found application in advanced wound dressing applications, where the high surface to volume ratio is thought to beneficial for wound healing [44,45,46].
In this current study we focused on the systematic investigation of the dependence of the initial reaction rate on the surface area-to-volume ratio in autonomously reporting sensing hydrogels for the rapid detection of bacterial enzymes. This study aimed to unveil the design principles for achieving high sensitivity by analyzing enzymatic reactions for novel microscale templated reporter hydrogels with controllable surface area and expanded the findings to electrospun nanofiber-based sensing materials. On the basis of this study the performance of various already known, but also of novel reporter hydrogel materials can be enhanced based on the fundamental structure—property relationships reported herein.

2. Methodology

2.1. Materials

Poly (dimethylsiloxane) (PDMS) prepolymer and curing agent (Sylgard 184) was purchased from Dow Corning, Wiesbaden, Germany. Anhydrous dimethyl sulfoxide (DMSO, ≥99.9%), tert-butyl acetoacetate (t-BAA, 98%), trimethylamine (TEA, ≥99%), adipic acid dihydrazide (ADH), hydrochloric acid (HCl, 36.5−38%), chitosan (medium molar mass, 190–310 kDa, 75–85% deacetylated), polyethylene oxide, PEO (Mw > 5000 kg/mol), N-(3-dimethylaminopropyl)-N-ethylcarbodiimide hydrochloride (EDC. HCL, ≥99%), β-glucuronidase from E. coli (β-GUS, 694.3 units/mg, E.C. 3.2.1.31; type IX-A, lyophilized powder, 25,000 units/g protein), trichloro octadecyl silane (≥90%), phosphate saline buffer solution (PBS, pH 7.4), and N-hydroxy succinimide (NHS) were purchased from Sigma-Aldrich, Germany. Pullulan (PU, viscosity 15−180 mPa s, 10% H2O at 30 °C, J&K Scientific Ltd., Beijing, China), acetic acid (glacial, J.T. Baker, GroßGerau, Germany), Dulbecco’s phosphate saline buffer (DPBS, 10x, 95 mM (PO4) without Mg2+ and Ca2+, Lonza, Basel, Switzerland), 5-bromo-4-chloro-3-indolyl-ß-D-glucuronic acid (X-Gluc, 98% pure, Alfa Aesar, Kandel, Germany), ethanol absolute (≥99.8%, VWR, Germany, Vienna, Austria), sodium hydroxide (NaOH, >98.8%, ChemSolute), indigo (Roth), deuterated water (D2O, 99.8%, Alfa Aesar, Kandel Germany) disposable acrylic cuvettes (10 mm × 10 mm × 45 mm, Sarstedt, Numbrecht, Germany), Milli-Q water (Millipore Advantage A10 system, Schwalbach, with Millimark Express 40 Filter, Merck, Darmstadt, Germany), Lysogeny broth (LB) agar (yeast extract 5 g/L, tryptone 10 g/L, NaCl 5 g/L, Luria/Miller, Carl Roth, Karlsruhe Germany) and LB medium (Luria/Miller, Carl Roth, Karlsruhe, Germany) were purchased as stated. LB agar and LB medium were sterilized via autoclaving at 121 °C, 1.2 bar for 15 min. Nonpathogenic E. coli: Mach1 ™-T1 ® (Invitrogen, Carlsbad, CA, USA). TC Plate 96-well (transparent and black, Sarstedt, Numbrecht, Germany) were used as substrate support for bacteria experiments.

2.2. Methods

2.2.1. Preparation of Micro-Cuboid Structured (MS) Hydrogel Films

Preparation of Polydimethylsiloxane (PDMS) Mold

The prepolymer of PDMS silicone elastomer and the curing agent were mixed in a 10:1 ratio. After that, the mixture was degassed in a desiccator under vacuum at a pressure <10 mbar for 30 min. The mixture was poured onto a passivated patterned silicon master and heated at 60 °C on a hotplate for 2 h to cure the mixture [47]. To prevent PDMS from adhering to the surface, the silicon master was passivated by silanisation by chemical vapor deposition of trichloro (octadecyl) silane in a vacuum desiccator. The cured PDMS was peeled carefully from the master after cooling down to room temperature. Different patterned PDMS molds with 40 µm and 100 µm sized cuboid structures thus obtained were used for the fabrication of patterned hydrogel films.

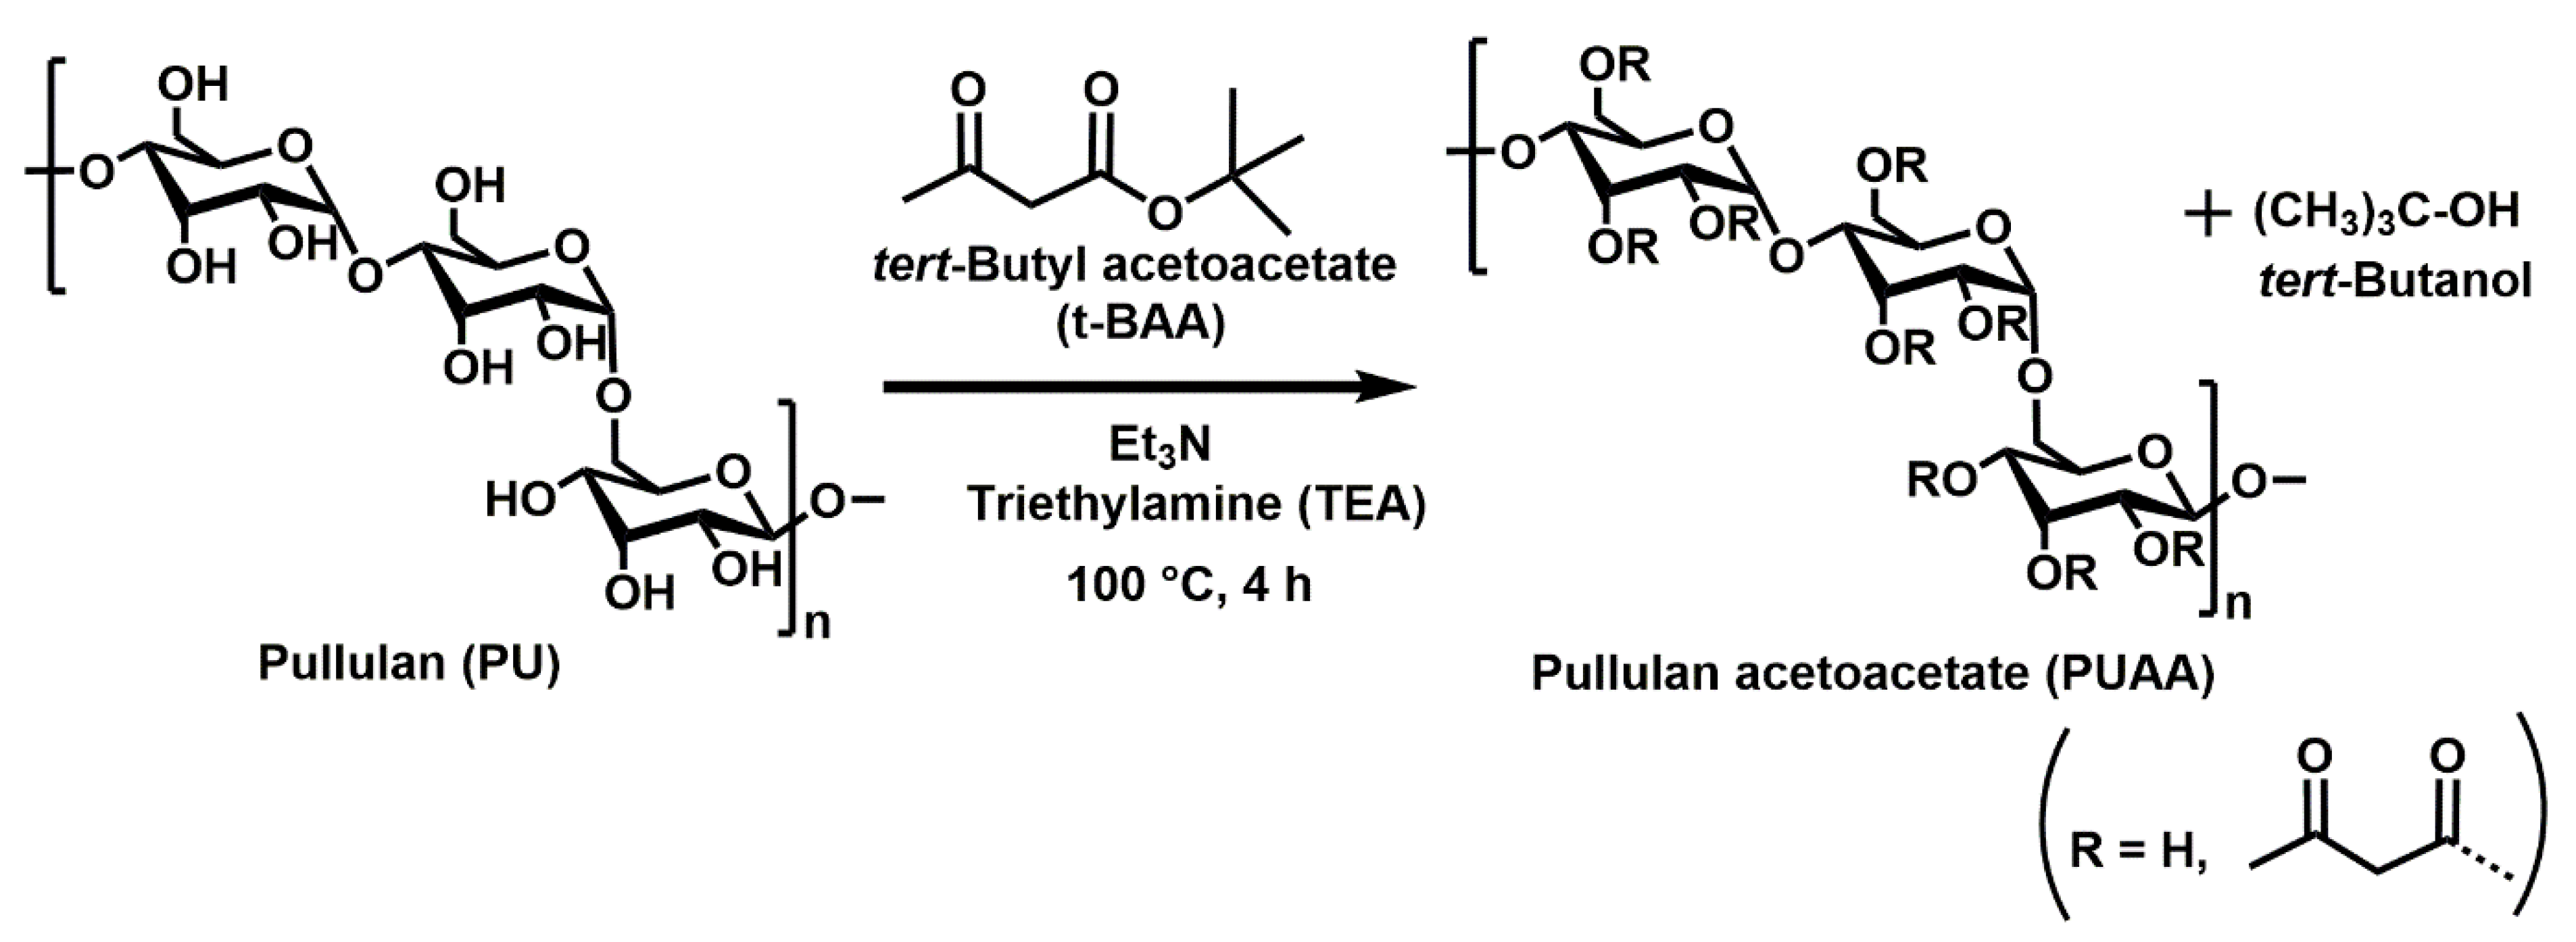
Synthesis of Gel Precursor and Fabrication of Hydrogel

The biopolymer-pullulan-based cross-linkable gel precursor, pullulan acetoacetate (PUAA) was synthesized following the protocol described in literature [31]. Pullulan was modified with tert-butyl acetoacetate (t-BAA) by a trimethylamine-catalyzed transesterification reaction. For this study, a molar ratio of 1:1.25 of pullulan to t-BAA was used to synthesize the PUAA precursor with adequate fractions of cross-linkable sites. The reaction was performed in anhydrous DMSO at 100 °C under an argon gas atmosphere for 4 h. The product was purified for 24 h through Soxhlet extraction using ethanol as a solvent and characterized by Fourier-transform infrared (FTIR) and nuclear magnetic resonance (NMR) spectroscopy. The schematic of the transesterification reaction is given below in Figure 1.

Fabrication of Micro-Cuboid Patterned Hydrogel Film

Before the fabrication of patterned hydrogel films using the PDMS molds, the gel formation ability of PUAA with adipic acid dihydrazide (ADH) was confirmed by the tube inversion method. In addition, the gelation time was determined. For this purpose, an aqueous solution of the PUAA gel precursor was mixed with an aqueous solution of the crosslinking agent ADH for 30 s through vortexing in an Eppendorf tube. By inverting the Eppendorf tube at different time intervals, the gelation time was obtained as the point, when the mixture no longer flows. The apparent gelation time for PUAA (1:1.25) was found to be 13 min under these conditions. To ensure a homogenous dispersion of the gel mixture on the surface, the wettability of the surface of the mold was improved through oxygen plasma treatment for 30 s. This treatment transformed the hydrophobic surface of the PDMS into a hydrophilic surface [48]. Afterwards, the mixture of PUAA and ADH was poured onto the surface of the PDMS mold, dried on a hot plate at 40 °C, and peeled off the mold to produce a micro cuboid-patterned hydrogel film (Figure S1). The dried film was characterized by FTIR spectroscopy and scanning electron microscopy (SEM) analyses.

2.2.2. Preparation of Chitosan/Polyethylene Oxide (CS/PEO) Nanofibers (NFs) and CS/PEO Hydrogels (HG)

The preparation of solutions for electrospinning was carried out with modification from literature [49]. Two solutions of 4 wt.% chitosan and 4 wt.% PEO were prepared by dissolving the required masses in 0.5 M acetic acid and by stirring the separate solutions moderately for two days. Then the two solutions were mixed in a ratio of 90% chitosan to 10% PEO by weight and stirred for 6 h. Thereafter the solution was used for electrospinning. Some fraction of the solution was also spread onto a glass petri dish and dried in a flow hood for 24 h, after which the film was peeled off from the petri dish to obtain a flat CS/PEO hydrogel.
Electrospinning was carried out using a homebuilt set-up [50]. This comprised of a syringe pump (Aladdin syringe pump, 941-371-1003, World precision instruments, Sarasota, FL, USA), high voltage supply (HCN 35-35000, FuG Elektronik GmbH, Schechen, Germany), a plastic board for mounting of the silicon wafer collectors (P/Boron type OKMETIC, Finland) and a 5 mL, 12.07 mm inner diameter plastic syringe and metallic needle that was used as a hopper for the CS/PEO polymer solution (see set-up assembly in Figure S2). The spinning process was performed in ambient conditions with voltages and flow rates varying from 17–30 kV and 10–30 µL/min, respectively. The tip-to-collector distance was varied from 10–25 cm.

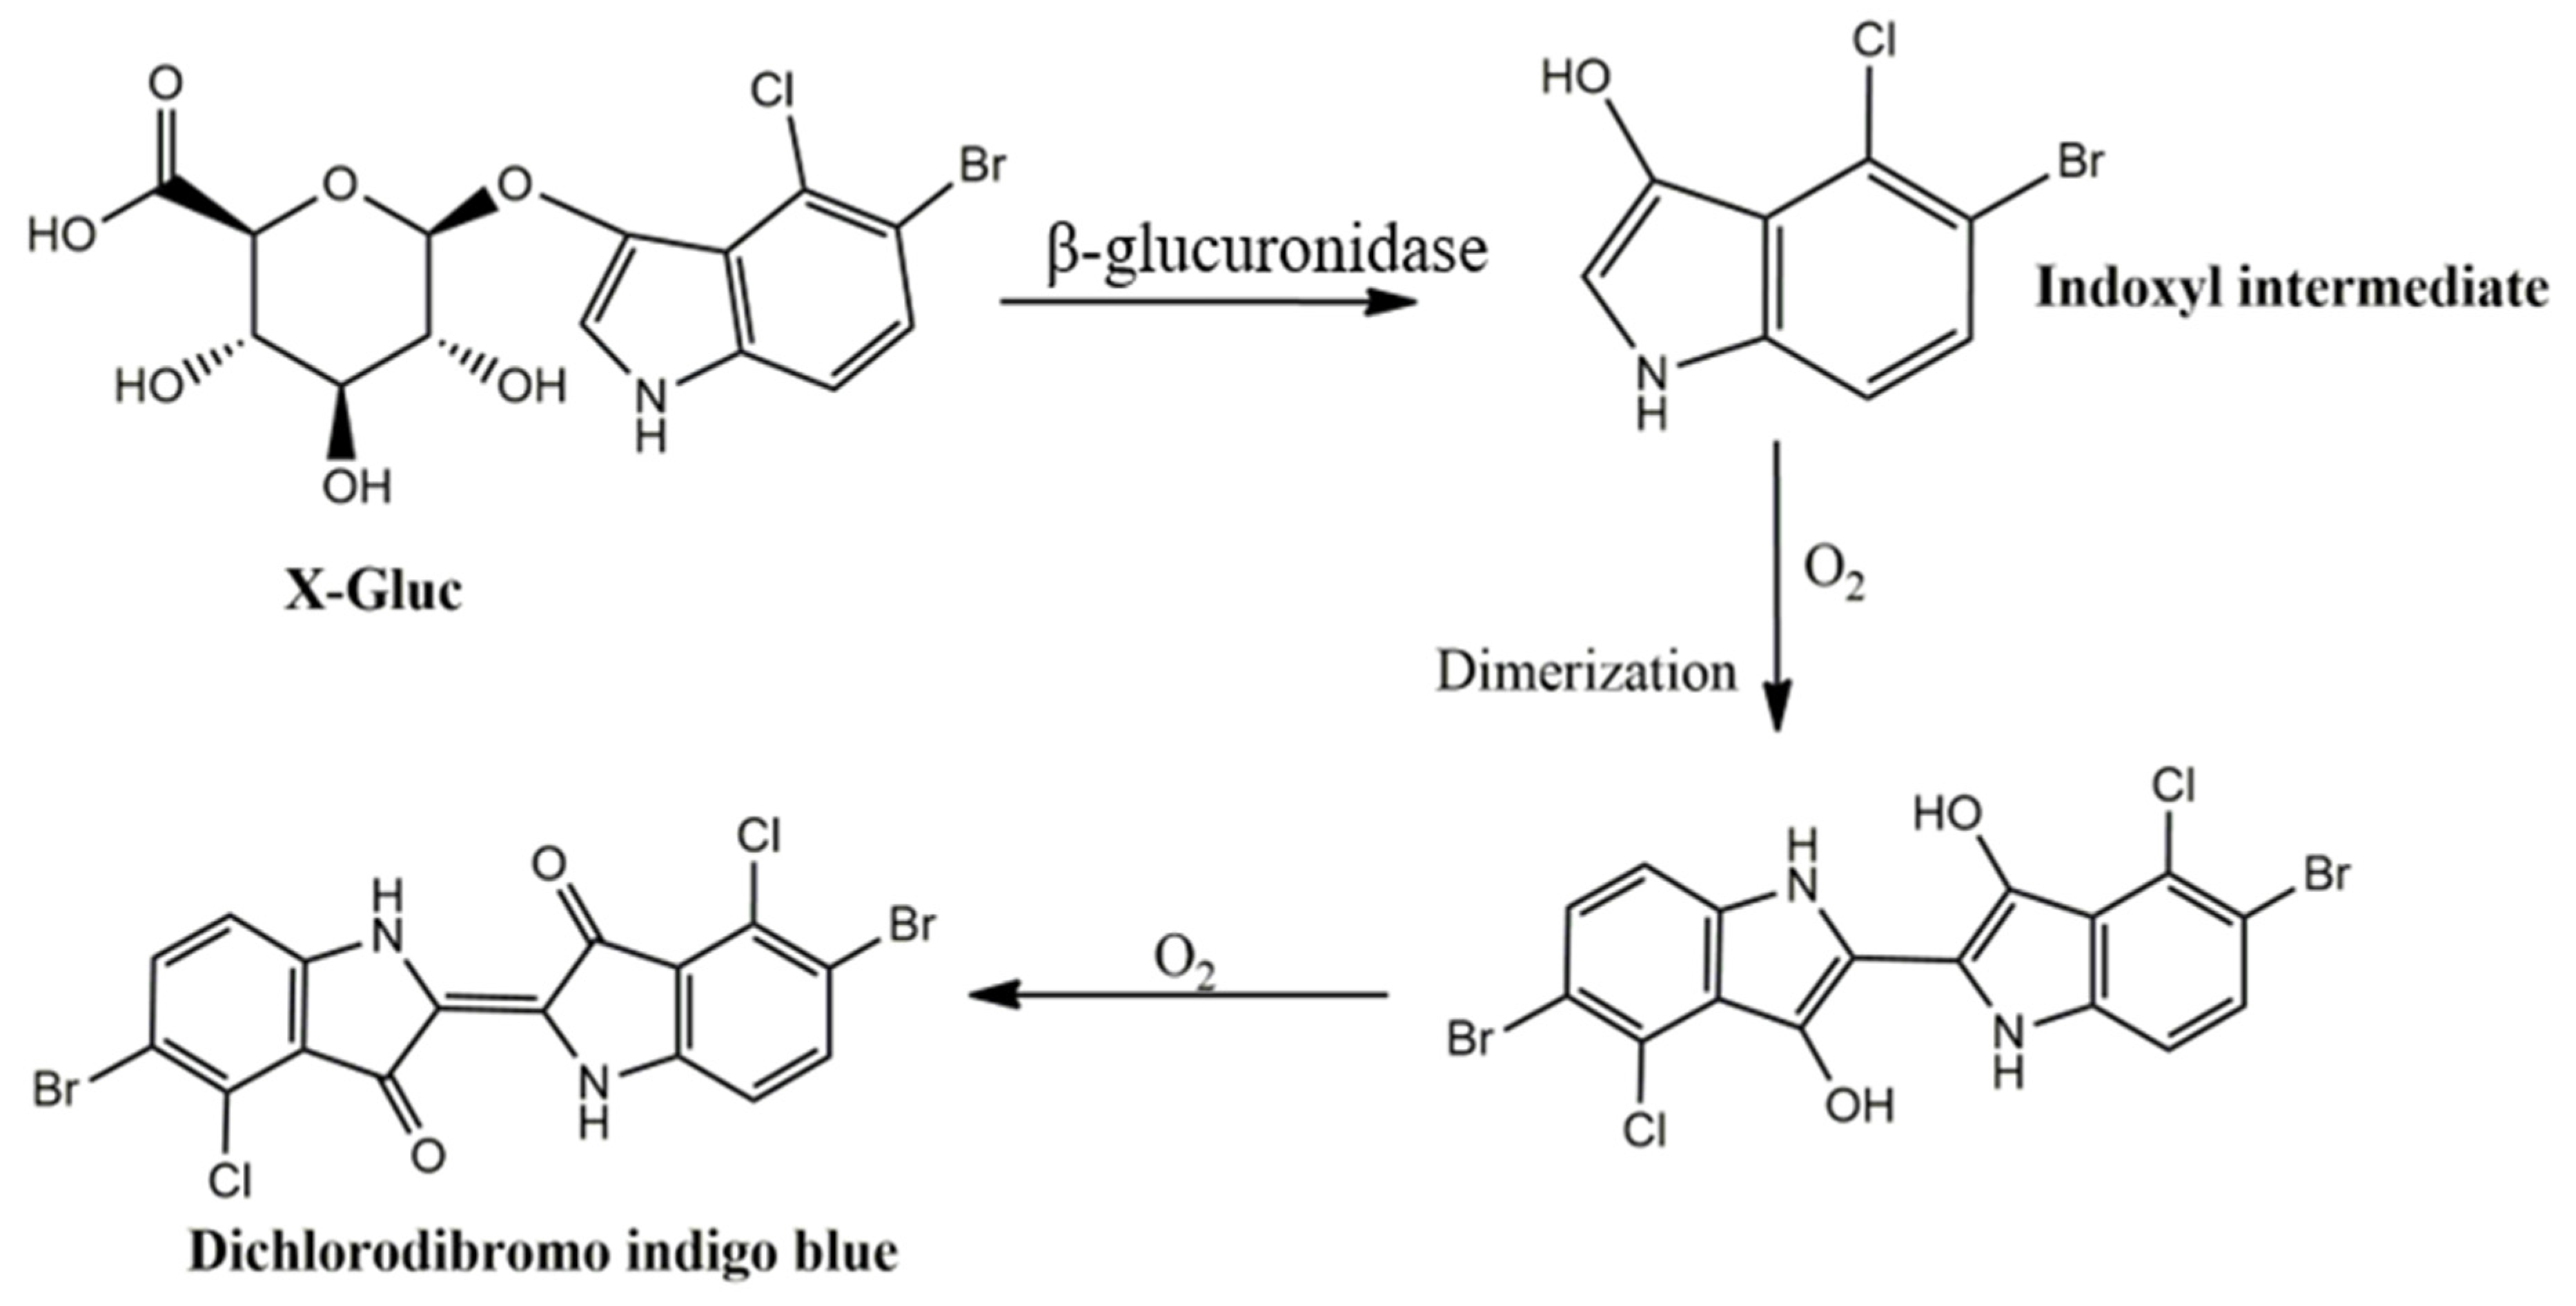
2.2.3. Surface Modification of Micropatterned Hydrogel Films and Nanofibers with the Chromogenic Substrate X-Gluc

Surface-Modification of PUAA-ADH Micro-Patterned Hydrogel Film with Chromogenic Substrate

The surface of micro-patterned hydrogel films was modified with the chromogenic substrate 5-bromo-4-chloro-3-indolyl β-D-glucuronide using EDC-NHS chemistry as described previously [31]. The corresponding solution (pH 7.4) was cast onto the films and the modification was carried out for 4 h. The chromogenic substrate was conjugated to the PUAA via amide bond formation between the carboxylic group of the substrate and the amine group in the PUAA-ADH films, as shown in Figure S3.
After modification, the film was washed with 10 mL of 70% ethanol/Milli-Q water solution, and the presence of unbound dye was confirmed using UV/vis spectroscopy (Varian Cary 50 Mulgrave, Victoria, Australia) in the 270–290 nm wavelength range after each washing step. The films were considered devoid of unbound substrate once the peak from the unbound dye was no longer detectable. After that, the film was dried in a desiccator under vacuum for 15 h. The dried film was characterized by FTIR spectroscopy (Tensor 27, Bruker Optik GmbH, Ettlingen, Germany) to confirm the modification and SEM (CS24, Applied Beams, Beaverton) analyses used to confirm the dimensions and morphology of micro-cuboids after modification, as is illustrated in the Supporting Information (Figure S4).

Modification of CS Nanofibers and Hydrogels with Enzyme Substrate

The CS/PEO NFs and CS/PEO HG were first passed through 0.1 M NaOH for 2 min to neutralize the acetic acid used in the sample preparation. The chromogenic substrate X-Gluc was grafted onto the chitosan nanofibers using the EDC-NHS chemistry, according to reported literature [28]. A 4 mM solution of X-Gluc in PBS was prepared through stirring. After 15 min, EDC and NHS were weighed and added to the X-Gluc solution and then left to stir for 1 h in the dark. The modification reaction (Figure S5) was carried out for 12 h under shaking at a rate of 60 Hz under ambient conditions. Afterwards, the solution was removed and the NFs were rinsed using PBS solution for 3 h. Within this time period, the PBS wash solution was replaced every 30 min. The removal of any physically bonded substrate was ensured by determining the absorbance spectra of the cleaning solution after each washing step (Figure S6). Finally, the chitosan nanofibers were dried in a laminar flow hood overnight. The samples were used directly for the enzymatic reactions and bacteria detection studies.

2.2.4. Enzymatic Hydrolysis Study of Dye Labeled PUAA-ADH Hydrogels and CS/PEO Nanofibers

The enzyme β-GUS was used for the enzymatic hydrolysis of X-Gluc. The enzyme concentration was varied and the release of the initially hydrogel bound chromogenic dye after enzymatic hydrolysis was determined by UV-Vis spectrophotometry. Enzymatic reactions were carried out using previously reported methods [27,30]. The samples were inserted into acrylic cuvettes (10 mm path length), after which a buffered enzyme solution with predetermined concentration was added. The cuvette was immediately inserted into the UV-Vis spectroscopy chamber for absorbance measurements. During the measurement intervals the solution was mixed for approximately 10 s to ensure its uniformity before taking the next measurement. The measurements were performed at a temperature of 25 °C, until the absorbance values became constant. The amount of released dye was quantified based on a standard curve.
The enzyme β-GUS catalyzes the hydrolytic cleavage of the chromogenic substrate X-Gluc. In the presence of the enzyme, the glycosidic linkage that connects the sugar moiety and the dye precursor gets hydrolyzed, leading to the release of an indoxyl derivative. This intermediate undergoes dimerization (Figure 2) in the presence of oxygen to form blue colored dichlorodibromo indigo dye [28]. The dye is non-reactive and precipitates into the NFs and hydrogels and a small fraction was also found in the enzyme solution. This dye has an absorbance maximum at a wavelength of 615 nm.

2.2.5. Enzymatic Hydrolysis in Bacterial Suspension Cultures

The enzymatic hydrolysis studies were performed in E. coli suspension cultures to ascertain the possible use of the hydrogel films as sensors for enzymes produced by living bacteria. Bacteria were streaked from glycerol stock on LB-Agar plate and incubated over night at 37 °C providing single colonies on the Agar plate. One colony was then transferred into a falcon tube containing 5 mL LB. The tube was then incubated at 37 °C, 200 rpm for 18 h in a shaking incubator. The optical density (OD) of the bacterial suspension was measured using a 1 cm path length cuvette at a wavelength of 600 nm with LB as a reference using a spectrophotometer. The OD of the overnight culture (ONC) was then adjusted to OD600 nm = 0.5 by diluting the ONC with fresh LB. To determine the concentration of living bacteria in the initial suspension, a serial dilution in PBS of the suspension was carried out and 50 μL of selected dilutions was plated on LB agar plates in duplicates and incubated for 24 h at 37 °C to determine the colony-forming unit (CFU) per mL.
For visual detection, 200 μL of the resulting suspension was added to each well of a flat bottom transparent, 96 well plate containing β-glucuronidase sensing microstructured (MS) films (4 mg) and NFs (3 mg). A 10-fold dilution of OD600 nm = 0.5 suspension was also added to 96 well plates containing 3 mg β-GUS sensing NFs. After 24 h photographs of the well plates were recorded using a Redmi note 8 in a Blackbox [29]. The final solutions from the wells with modified CS/PEO NFs were taken out centrifuged and absorbance measurements were performed.

2.2.6. Determination of Limit of Detection (LOD) and Limit of Quantification (LOQ) for β-Glucuronidase in CS/PEO NFs and PUAA-ADH MS Hydrogel Films

To assess the performance of the β-glucuronidase sensing NFs and MS hydrogel films, the LOD and LOQ of the β-glucuronidase enzyme in the sensor NFs and hydrogel were determined according to the literature [28]. Indigo solutions with predetermined concentrations (19 × 10−3–50 µM) were prepared in DMSO. Their absorbance at 615 nm was measured using a Varian Cary Eclipse spectrometer at 25 °C and the resulting absorbance values were plotted against the initial concentration. The y-intercept of the graph of a linear least-squares fit of absorbance against concentration of the data was considered background. The LOD and LOQ were calculated as the background added to three and ten times the standard deviation of the background value.
The kinetics of the enzymatic reaction in the sensor NFs and hydrogel were recorded using UV-Vis spectroscopy for a specified amount of time. An absorbance plot of the released product 5, 5′-dibromo-4, 4′-dichloro-indigo at a wavelength of 615 nm with respect to time was created for every reaction with varied enzyme concentration. The slope of linear least-squares fit for the first 30 min of the enzymatic reaction was considered in this case as the initial apparent rate of the reaction.

2.3. Characterization of PUAA-ADH Hydrogel Films and CS/PEO Nanofibers

2.3.1. Scanning Electron Microscopy (SEM)

Scanning electron microscope (CS24, Applied Beams, Beaverton) analysis was carried out to determine the surface topography of the PUAA structured hydrogel films and CS/PEO nanofibers. Prior to imaging, the NF and MS films were placed onto sample holders with a conductive carbon tape and then coated with ~10 nm gold through sputter coating. The images were acquired using the CS24 electron microscope with a working distance ranging from 25–37 mm, acceleration voltage of 23 kV and imaging current of 2.33 A. ImageJ software was used to calculate the average micro-cuboid dimensions and average fiber diameter of the NFs.

2.3.2. Determination of the Swelling Ratio of Dried Hydrogel Film

The swelling of the synthesized and dried PUAA-ADH film was determined in Milli-Q water at 23 °C. The films (2 mg) were immersed in Milli-Q water for 1 h, then removed from the solution. Surface water was carefully removed by blotting with Kimtech precision wipes and then reweighed. Each measurement was repeated three times and arithmetic mean ± standard deviation was reported. The weighing process was carried out for 5 h.
The swelling ratio of the dried CS/PEO hydrogels and NFs was determined using PBS (pH 7.4) at room temperature (23 °C). Ten milligrams of each sample were immersed in 5 mL of PBS. After a specified time, interval (5 min for the first 30 min and 30 min onwards until 5 h), the NFs and hydrogels were removed from the solution carefully dried with Kimtech precision wipes to remove excess solution, weighed recorded and returned back to the solution. The studies were performed in triplicate.
The swelling ratio of hydrogel film was determined gravimetrically using the following equation [28]:
S w e l l i n g   r a t i o = W s W i W i
where Wi, Ws, represents the weight of dried sample, the weight of sample at a specific time interval after swelling, respectively.

2.3.3. Nuclear Magnetic Resonance (NMR) Spectroscopy

The degree of functionalization of the acetoacetate group on the pullulan derivative was determined using a nuclear magnetic resonance (NMR) spectrometer (Bruker Avance 400 and Jeol ECZ-500, University of Siegen) using D2O as a solvent. The 1 H and 13 C NMR spectra of the compounds were recorded for quantification of the purity of the sample. The NMR samples were prepared by dissolving 50 mg sample in 550 µL D2O solvent. Using the 1 H NMR spectrum, the signal with a chemical shift of 4.98 ppm (α-1,6-glucosidic linkage) was considered the base peak and the degree of substitution in -OH groups per repeating units of pullulan (DS) was determined as described from previous literature [31,51] by:
D S = I M e 27 × 100
where IMe is an integral area of methyl protons and Ian is an integral area of the anomeric protons of the α-1,4-glucosidic linkages.

2.3.4. Fourier Transform Infrared (FTIR) Spectroscopy

Attenuated total internal reflectance Fourier transform infrared (ATR-FTIR) spectra of all compounds (i.e., PUAA-ADH, PUAA 1:1.25, PUAA-ADH-X-Gluc hydrogel films, CS/PEO nanofibers, chitosan, CS/PEO-X-Gluc nanofibers) were recorded on a Fourier transform infrared spectrometer (Tensor 27, Bruker Optik GmbH, Ettlingen, Germany) with 600−4000 cm−1 wavenumber range for the spectra and a spectral resolution of 4 cm−1.

2.3.5. UV-Vis Spectroscopy

A VARIAN Cary 50 UV-Vis spectrophotometer was used to follow the enzymatic hydrolysis of X-Gluc at various wavelengths. Absorbance measurements of micro-cuboid hydrogel films (2 mg, 4 mg, 8 mg) and CS/PEO NFs (2 mg, 3 mg, 4 mg) in presence of β-glucuronidase at 25 °C were carried out. A peak in the wavelength range from 600 nm to 650 nm is expected in the UV-vis spectrum due to the release of dimerized indigo derivatives [28]. The measurements were carried out using acrylic cuvettes (Sarstedt AG & Co. KG, Nümbrecht, Germany) at an interval of every minute for the first 30 min and 10 min interval thereafter.

3. Results and Discussion

3.1. Fabrication and Characterization of PUAA-ADH MS and CS/PEO NFs

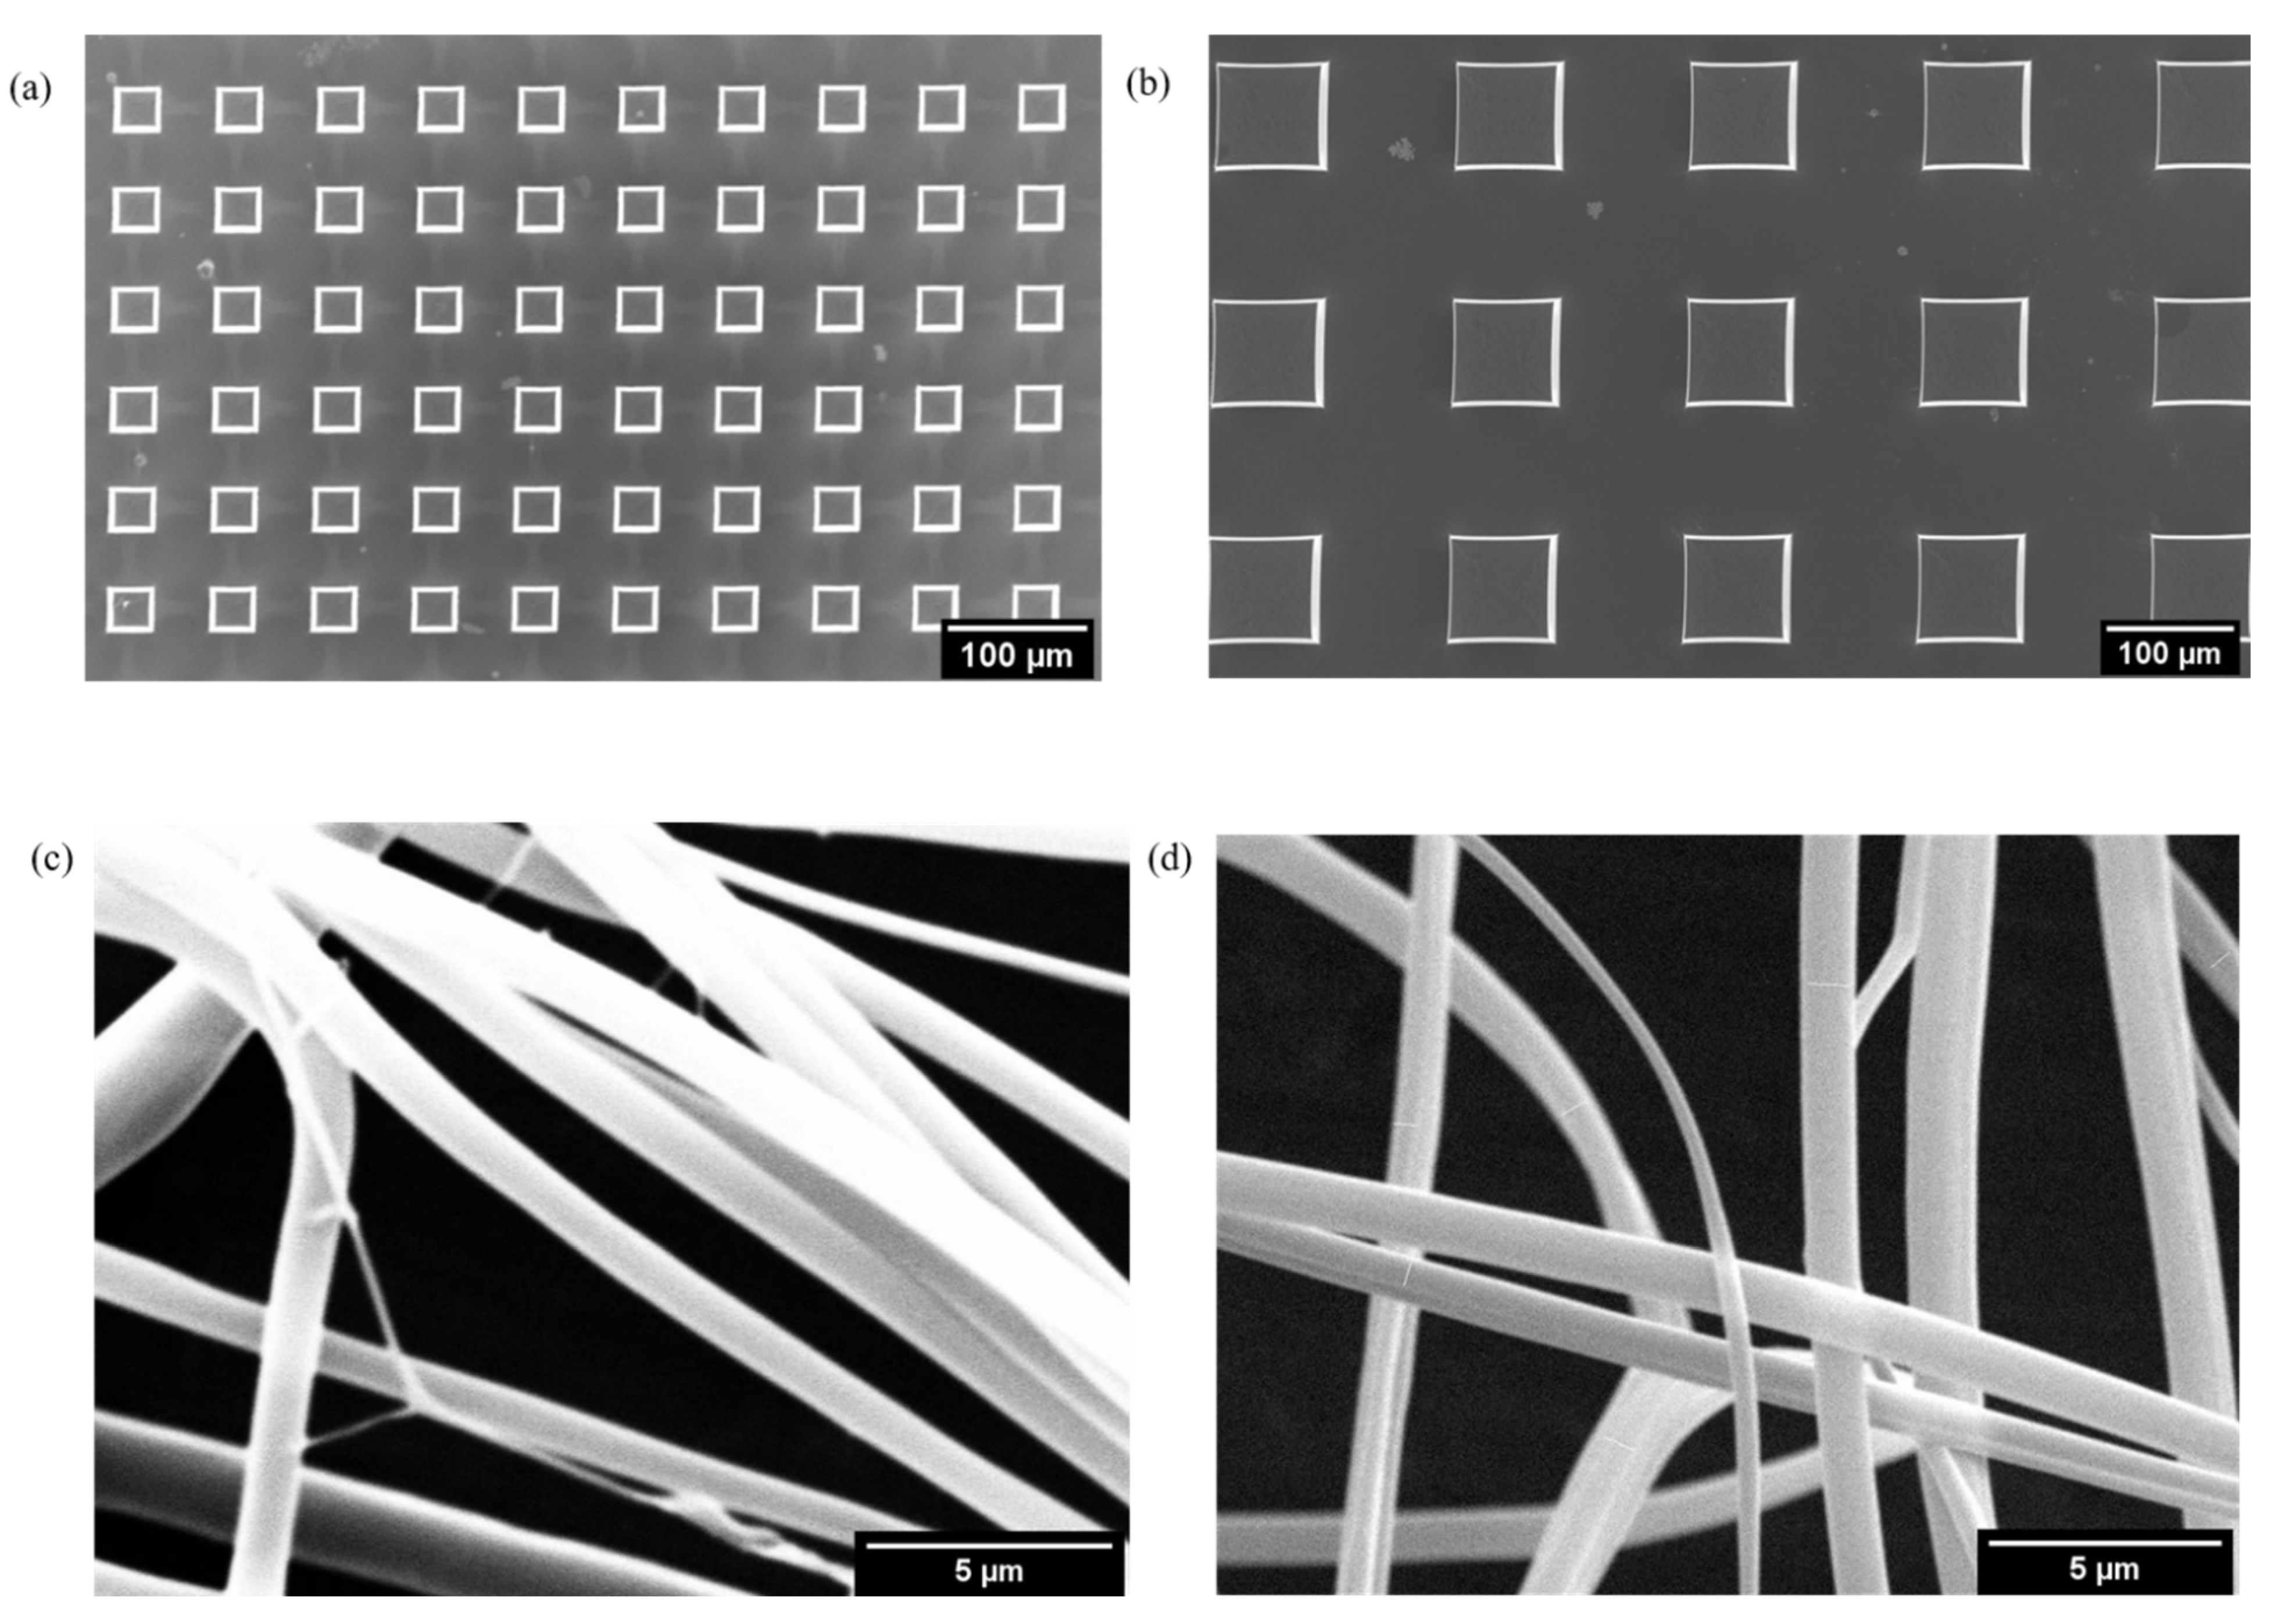
3.1.1. Scanning Electron Microscopy

Scanning electron microscopy was used to analyze the morphology as well as the dimensions of the PUAA-ADH micro-cuboid structured hydrogel films and the CS/PEO nanofibers, as shown in Figure 3. Gold-coated specimens were analyzed in a high vacuum; hence the dimensions are characteristic for the dried hydrogel samples.
From the SEM images we observe regular square-shaped cuboids on the surface of the PUAA-ADH hydrogels. CS/PEO nanofiber mats were also observed for electrospun chitosan/PEO mixtures. The average dimensions of the cuboids were determined by image analysis and a distribution curve was plotted, as shown in the Supporting Information (Figure S7). The average length of the cuboids was found to be 33.4 ± 1.5 µm and 85.3 ± 3.7 µm for the 40 µm and 100 µm templates, respectively, while the average height was found to be 22.9 ± 1.2 µm and 19.7 ± 1.0 µm. The depth of the mold was nominally 30.0 ± 2.4 µm. Using the average dimensions, the average surface area of 1 cm2 sample area covered with 40 µm and 100 µm cuboids was estimated to be 1.48 ± 0.37 cm2 and 1.18 ± 0.33 cm2, respectively.
The diameters of CS/PEO nanofibers fabricated through electrospinning were analyzed for 40 to 60 fibers per spinning condition. From the corresponding distributions the mean values of the diameter were fitted to a normal or log-normal distribution, the box and whisker plots were used to represent the mean values and the observed trends (Figures S8 and S9). The thinnest fiber diameters of 290 ± 100 nm were observed for nanofibers spun using 20 kV acceleration voltage, 15 µL/min flow rate and 15 cm syringe—collector distance. In the subsequent studies, bead-free fibers from this batch were used.

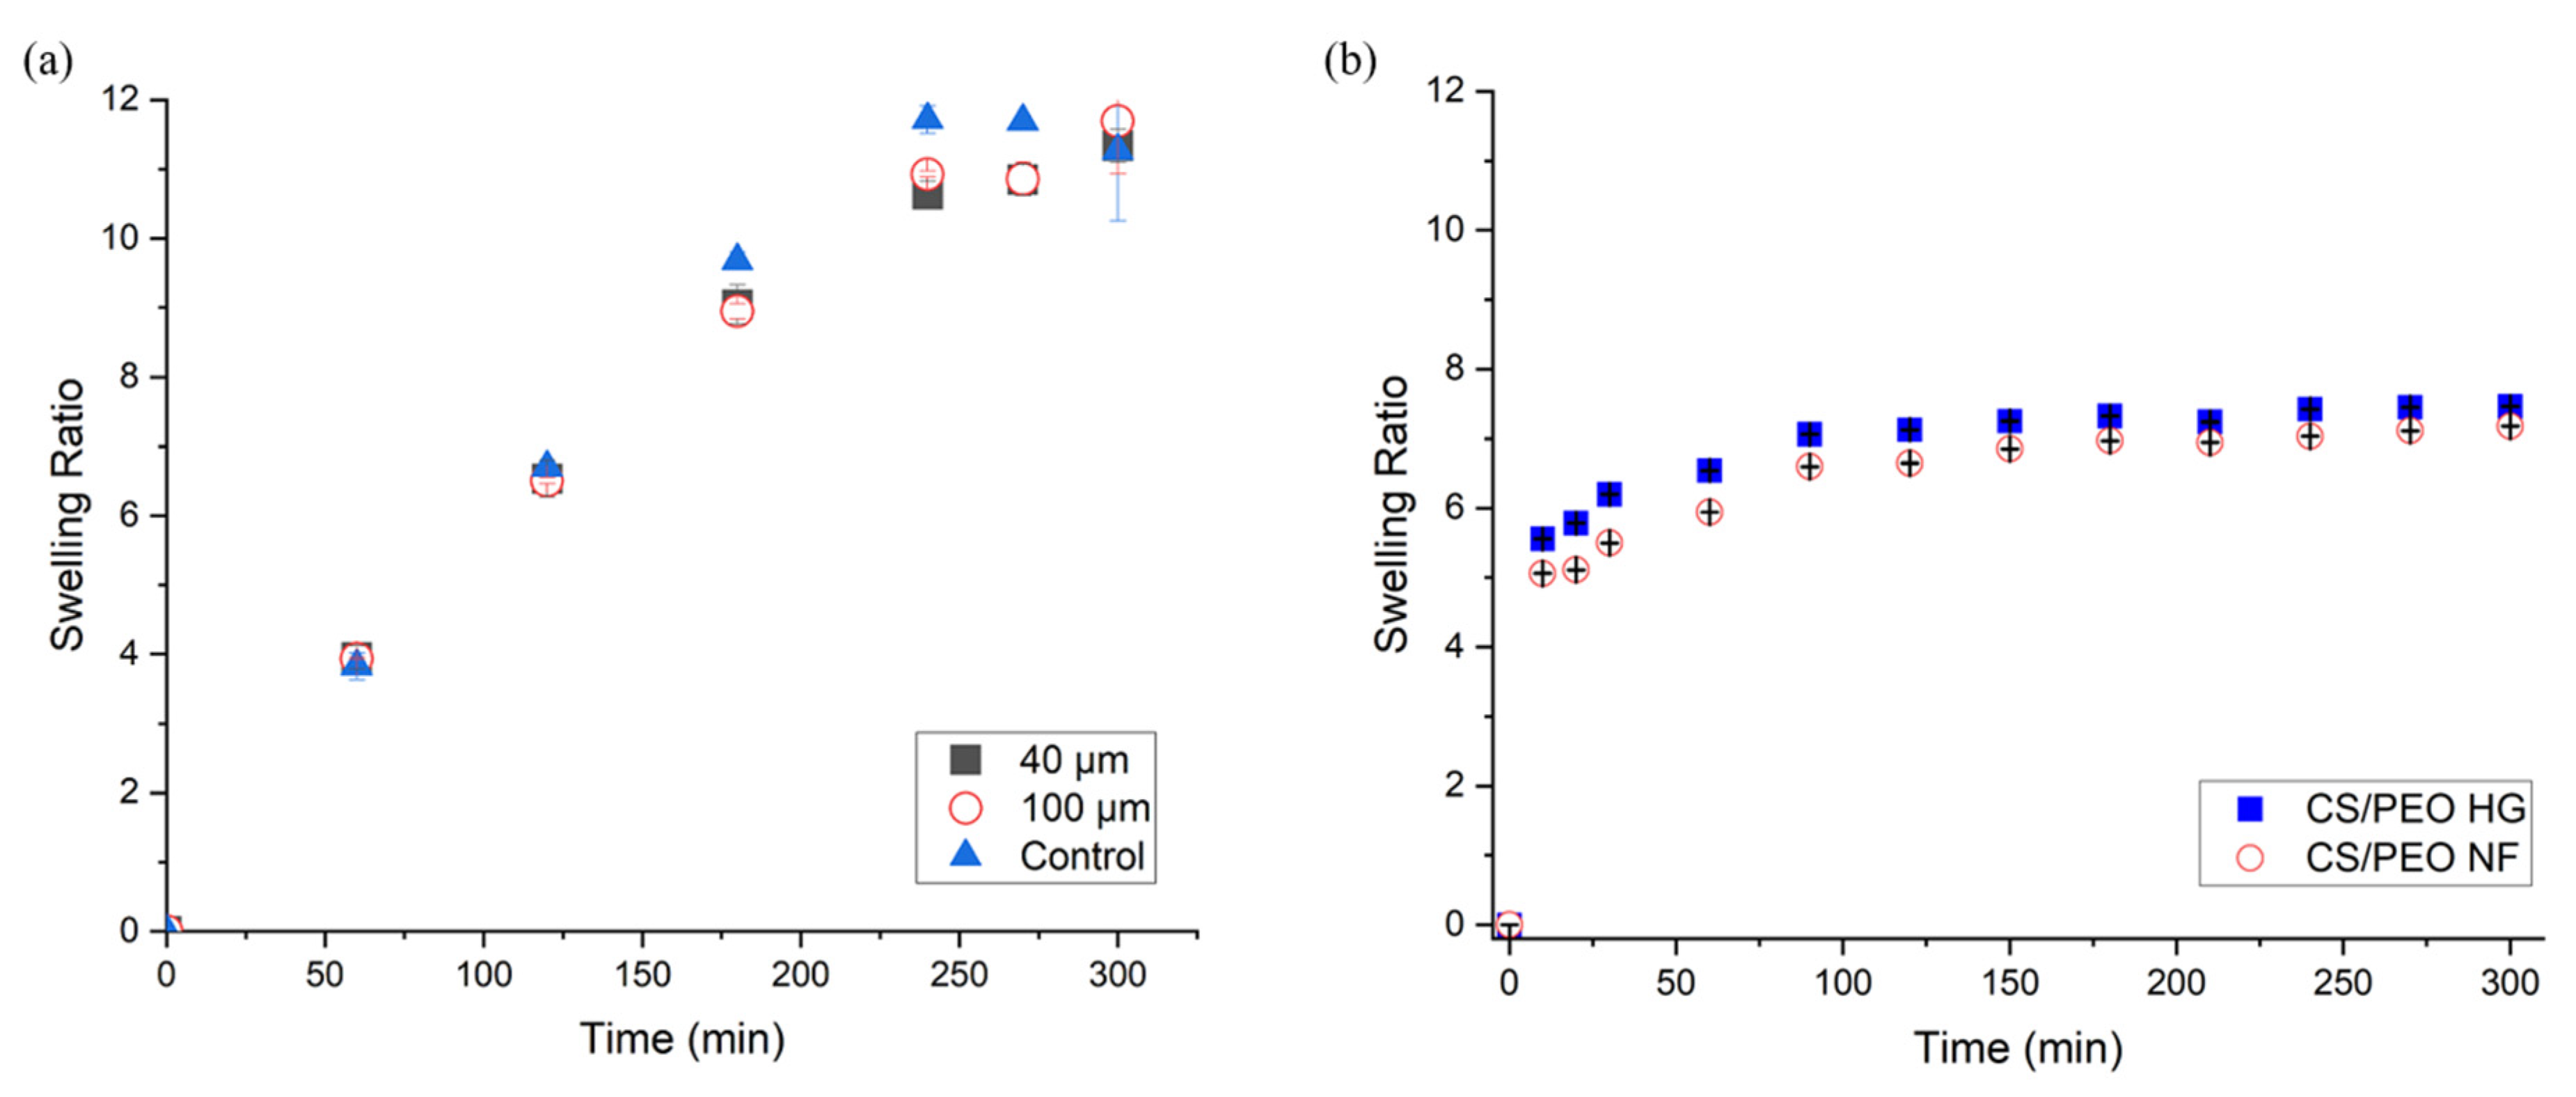
3.1.2. Swelling Ratio

The degree of crosslinking influences the water uptake capacity of the hydrogels. The swelling ratios for the PUAA-ADH hydrogel films were estimated using Equation (1). The afforded mean equilibrium swelling ratios in Milli-Q water were 10.9 ± 0.4, 11.2 ± 0.5, and 11.6 ± 0.3 for the 40 μm, 100 μm micro-cuboids and control film samples, respectively. As can be seen in Figure 4a there was a steady increase in the swelling of all PUAA-ADH samples for the first 3 h. The mean equilibrium swelling for these hydrogels was achieved after approximately 5 h. This observation is consistent with the chemical crosslinking and gel formation ability of the PUAA in presence of ADH crosslinker and in particular with a consistent constant crosslink density for all samples, irrespectively whether they were micro structured or not.
On the other hand, the swelling ratio of the CS/PEO NFs and the corresponding hydrogel in PBS increased from starting time point up to 90 min, after which it remained constant (Figure 4b). The mean equilibrium swelling ratio for CS/PEO hydrogel and NFs was 6.50 ± 0.36 and 6.12 ± 0.16, respectively. Under similar conditions, Rohindra et al. reported a swelling ratio of 6.02 for hydrogel films [52]. The slight increase may be due to the presence of PEO, which has been reported to increase the swelling ratio of chitosan and CS/PEO hydrogels [53]. Haryanto et al. on the other hand reported a swelling ratio of 8.00 for PEO hydrogels [54], while Mizraei et al. reported 8.50 for CS/PEO blends [55].
Upon exposure of PUAA-ADH hydrogel films to Milli-Q water, the swelling was not constrained on the micro-cuboids. As observed in Figure S4, there was a three-dimensional increase in dimension. This was in agreement with previous literature [56], where they stated that for unconstrained gels, the equilibrium state corresponds to homogenous swelling.

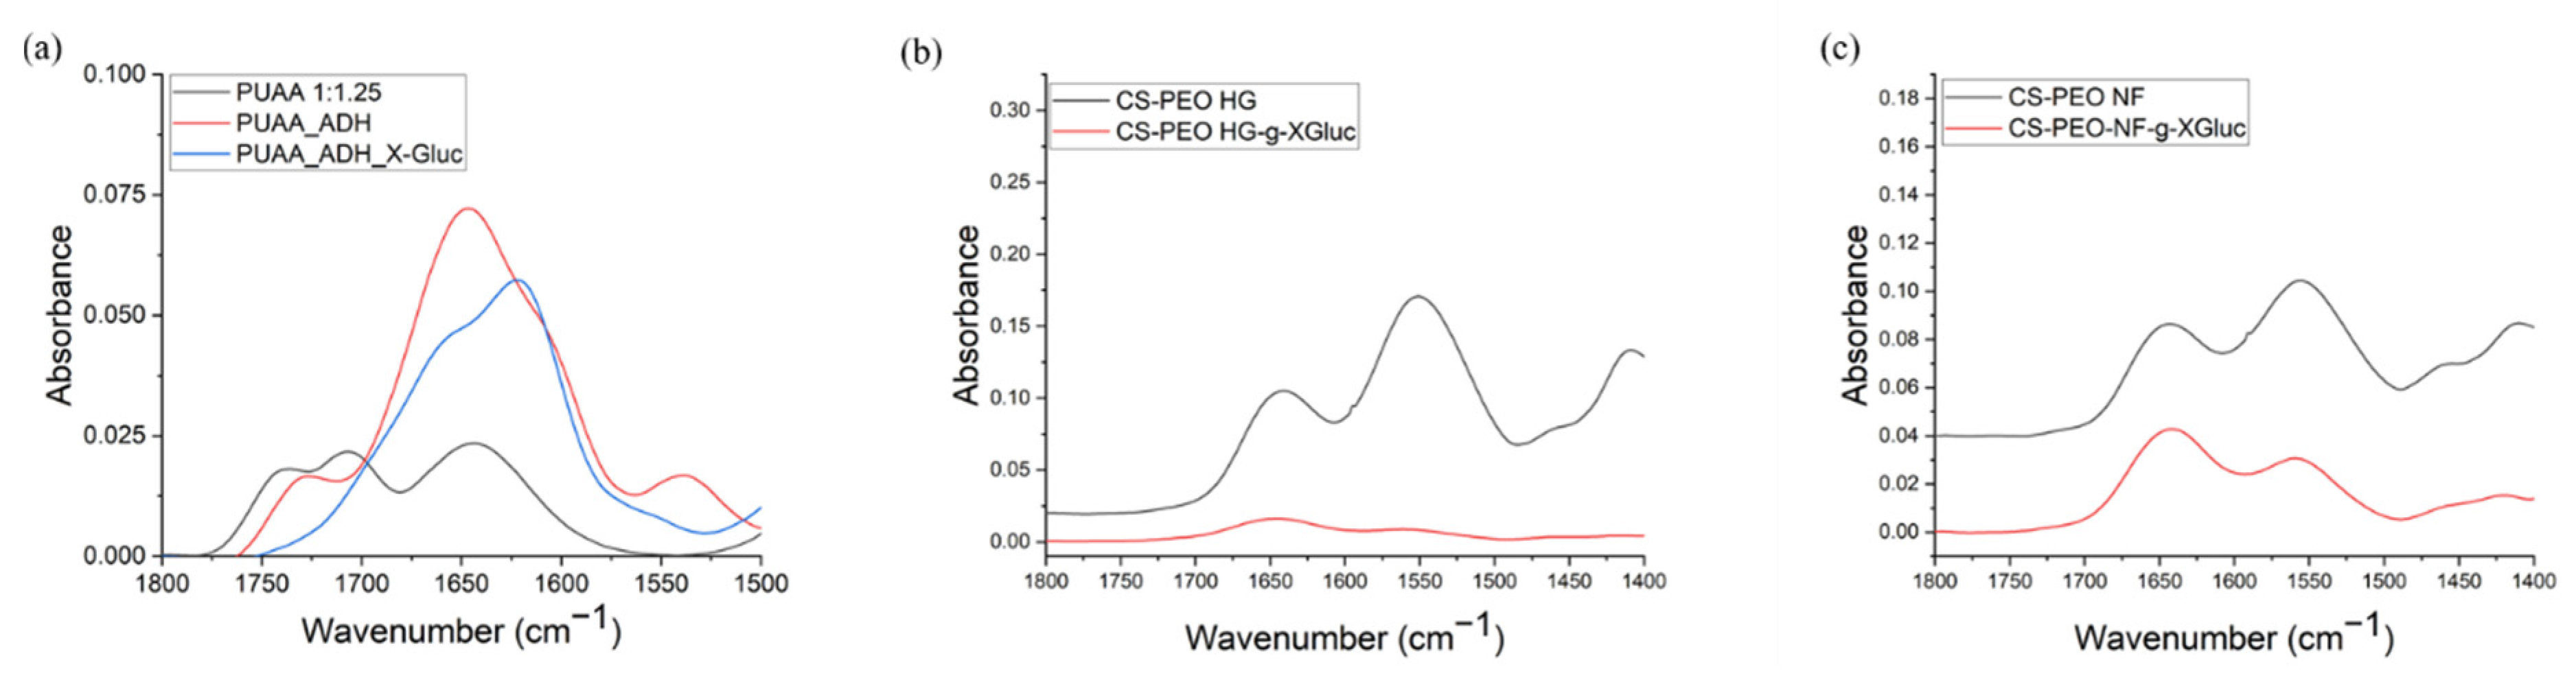
3.1.3. FTIR Spectroscopic Analysis of Modified PUAA-ADH MS Films and CS/PEO NFs

In order to implement a sensing moiety into the various hydrogel samples, the chromogenic substrate X-Gluc was covalently coupled. The successful grafting of the chromogenic substrate X-Gluc to the PUAA-ADH hydrogel films and CS/PEO NFs was assessed by identifying the characteristic bands in ATR-FTIR spectra and in particular by attributing the observed IR bands to either the chromogenic substrate or the amide bonds generated as a consequence of the covalent conjugation (Figure 5).
In the FTIR spectra of X-Gluc grafted PUAA-ADH films (Figure 5a), the intense band that appeared at 1620 cm−1 could be due to vibrations from the amide I bond of ADH as well as amide I bond formed from the coupling of the -NH2 group of the ADH crosslinker and the -COOH group of the chromogenic substrate. The presence of the band confirmed the formation of the amide adduct after the conjugation of the chromogenic-substrate to the PUAA-ADH film. We also observe the appearance of the two bands at 1706 cm−1 and 1743 cm−1, which is consistent with the ketone and ester bonds formation in the PUAA. This supports the successful synthesis of pullulan acetoacetate during the transesterification process. The absence of band at 1706 cm−1 and appearance bands at 1643 cm−1 and 1541 cm−1 in PUAA_ADH spectrum are attributed to the absence of ketone groups in PUAA, and amide I and amide II vibrations of ADH. This absence also indicates the successful crosslinking between the -NH2 group of ADH and the ketone group of PUAA through hydrazone bond formation. The full spectra for PUAA-ADH hydrogel films are shown in Figure S10a. The broad band in the 3300 cm−1 range may arise from the overlap of the vibration bands of amine and hydroxyl groups.
ß-glucuronidase sensing CS/PEO NFs and hydrogels were obtained by grafting the chromogenic substrate X-Gluc to chitosan through the formation of amide bonds between the carboxyl group of the chromogenic substrate and the primary amine group of the glucosamine group in chitosan. In the spectra shown in Figure 5b,c, three relevant bands of interest can be discerned; the primary amine group, the amide I and amide II bands, which are centered around 1591 cm−1, 1649 cm−1 and 1558 cm−1, respectively for NFs and at 1593 cm−1, 1643 cm−1 and 1548 cm−1 for the hydrogels. The absence of -NH2 peaks at 1591 cm−1 and 1593 cm−1 in the modified NFs and hydrogels, respectively, with the observed decrease in intensities of amide I and II bands indicate the participation of the amino groups in the reaction (see full spectra in Figure S10b).
The assignment to other bands of interest is summarized in Table S1 in the Supporting Information. The shifts in the band positions from the expected range of values for the amine and hydroxyl groups may be a result of hydrogen bonding between amino groups in chitosan and the polyether oxygen in PEO, as reported in [57].

3.1.4. Quantification of Pullulan Acetoacetate Functional Groups Using NMR Analysis

To determine the degree of functionalization of PUAA 1:1.25, NMR analysis was carried out. The 1 H NMR and 13 C spectra are shown in Figures S11 and S12 in the Supporting Information. The appearance of a new signal with a chemical shift δ = 2.35 − 2.37 ppm can be attributed to methyl protons in the acetyl group, which confirm the successful synthesis of pullulan acetoacetate. In this study, signal with a chemical shift of 5.38–5.43 ppm was considered for anomeric protons of the α-1, 4-glucosidic linkages. The DS was calculated to be 2.98% according to Equation (2) in the Methods. The new signals with chemical shifts of 206.1, 169.1 and 30.1 ppm in the 13 C NMR spectrum (Figure S12) signify the presence of carbonyl carbons of acetyl groups, carbon of methyl groups and carbonyl carbons of ester groups, respectively, which further ascertained successful conversion of PUAA from PU.

3.2. Enzymatic Reaction in ß-Glucuronidase Sensing PUAA-ADH Hydrogels

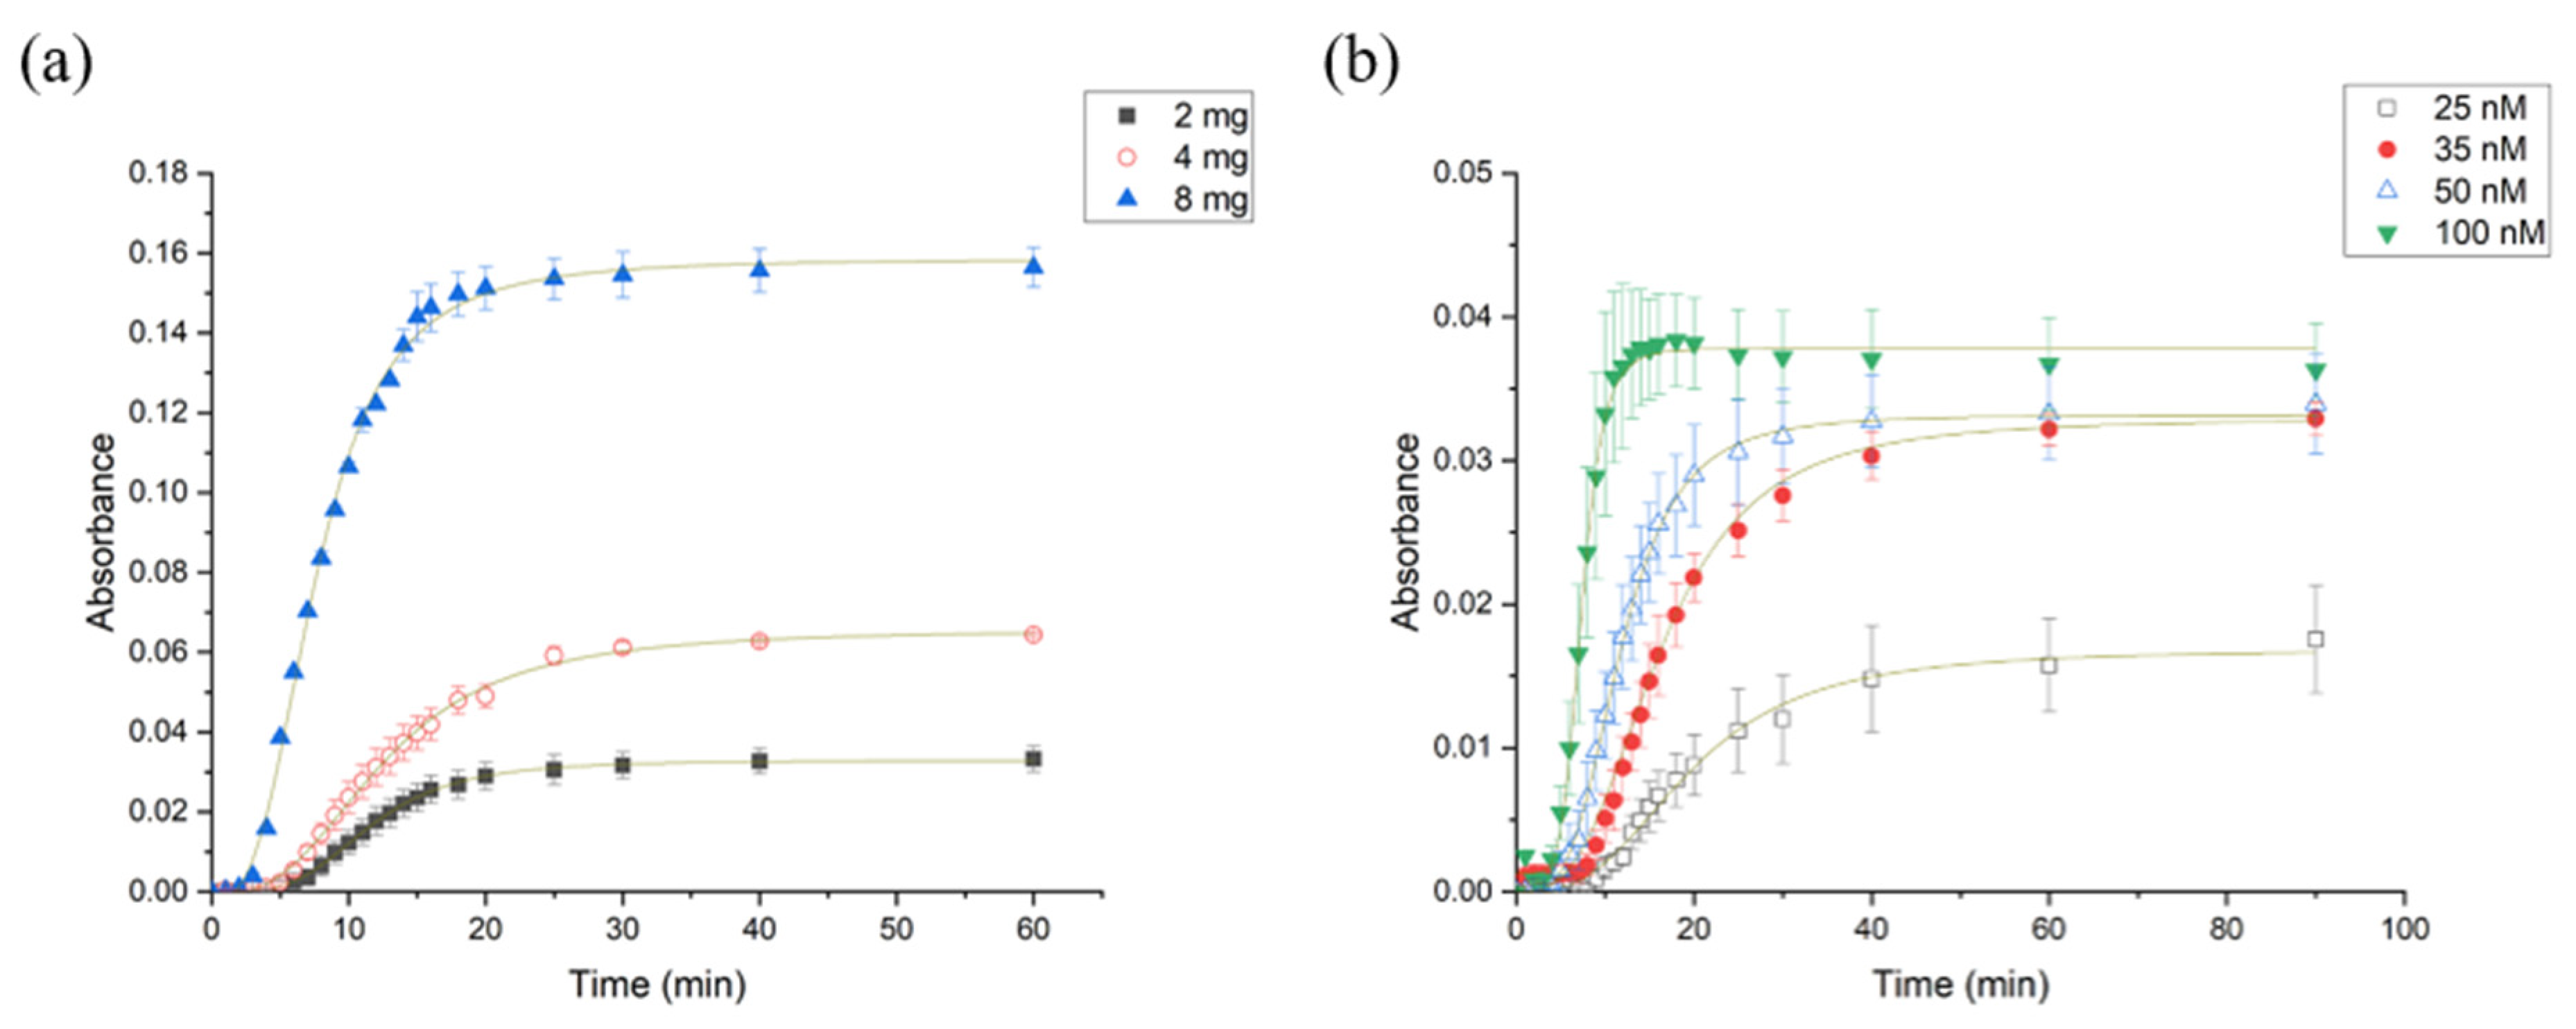
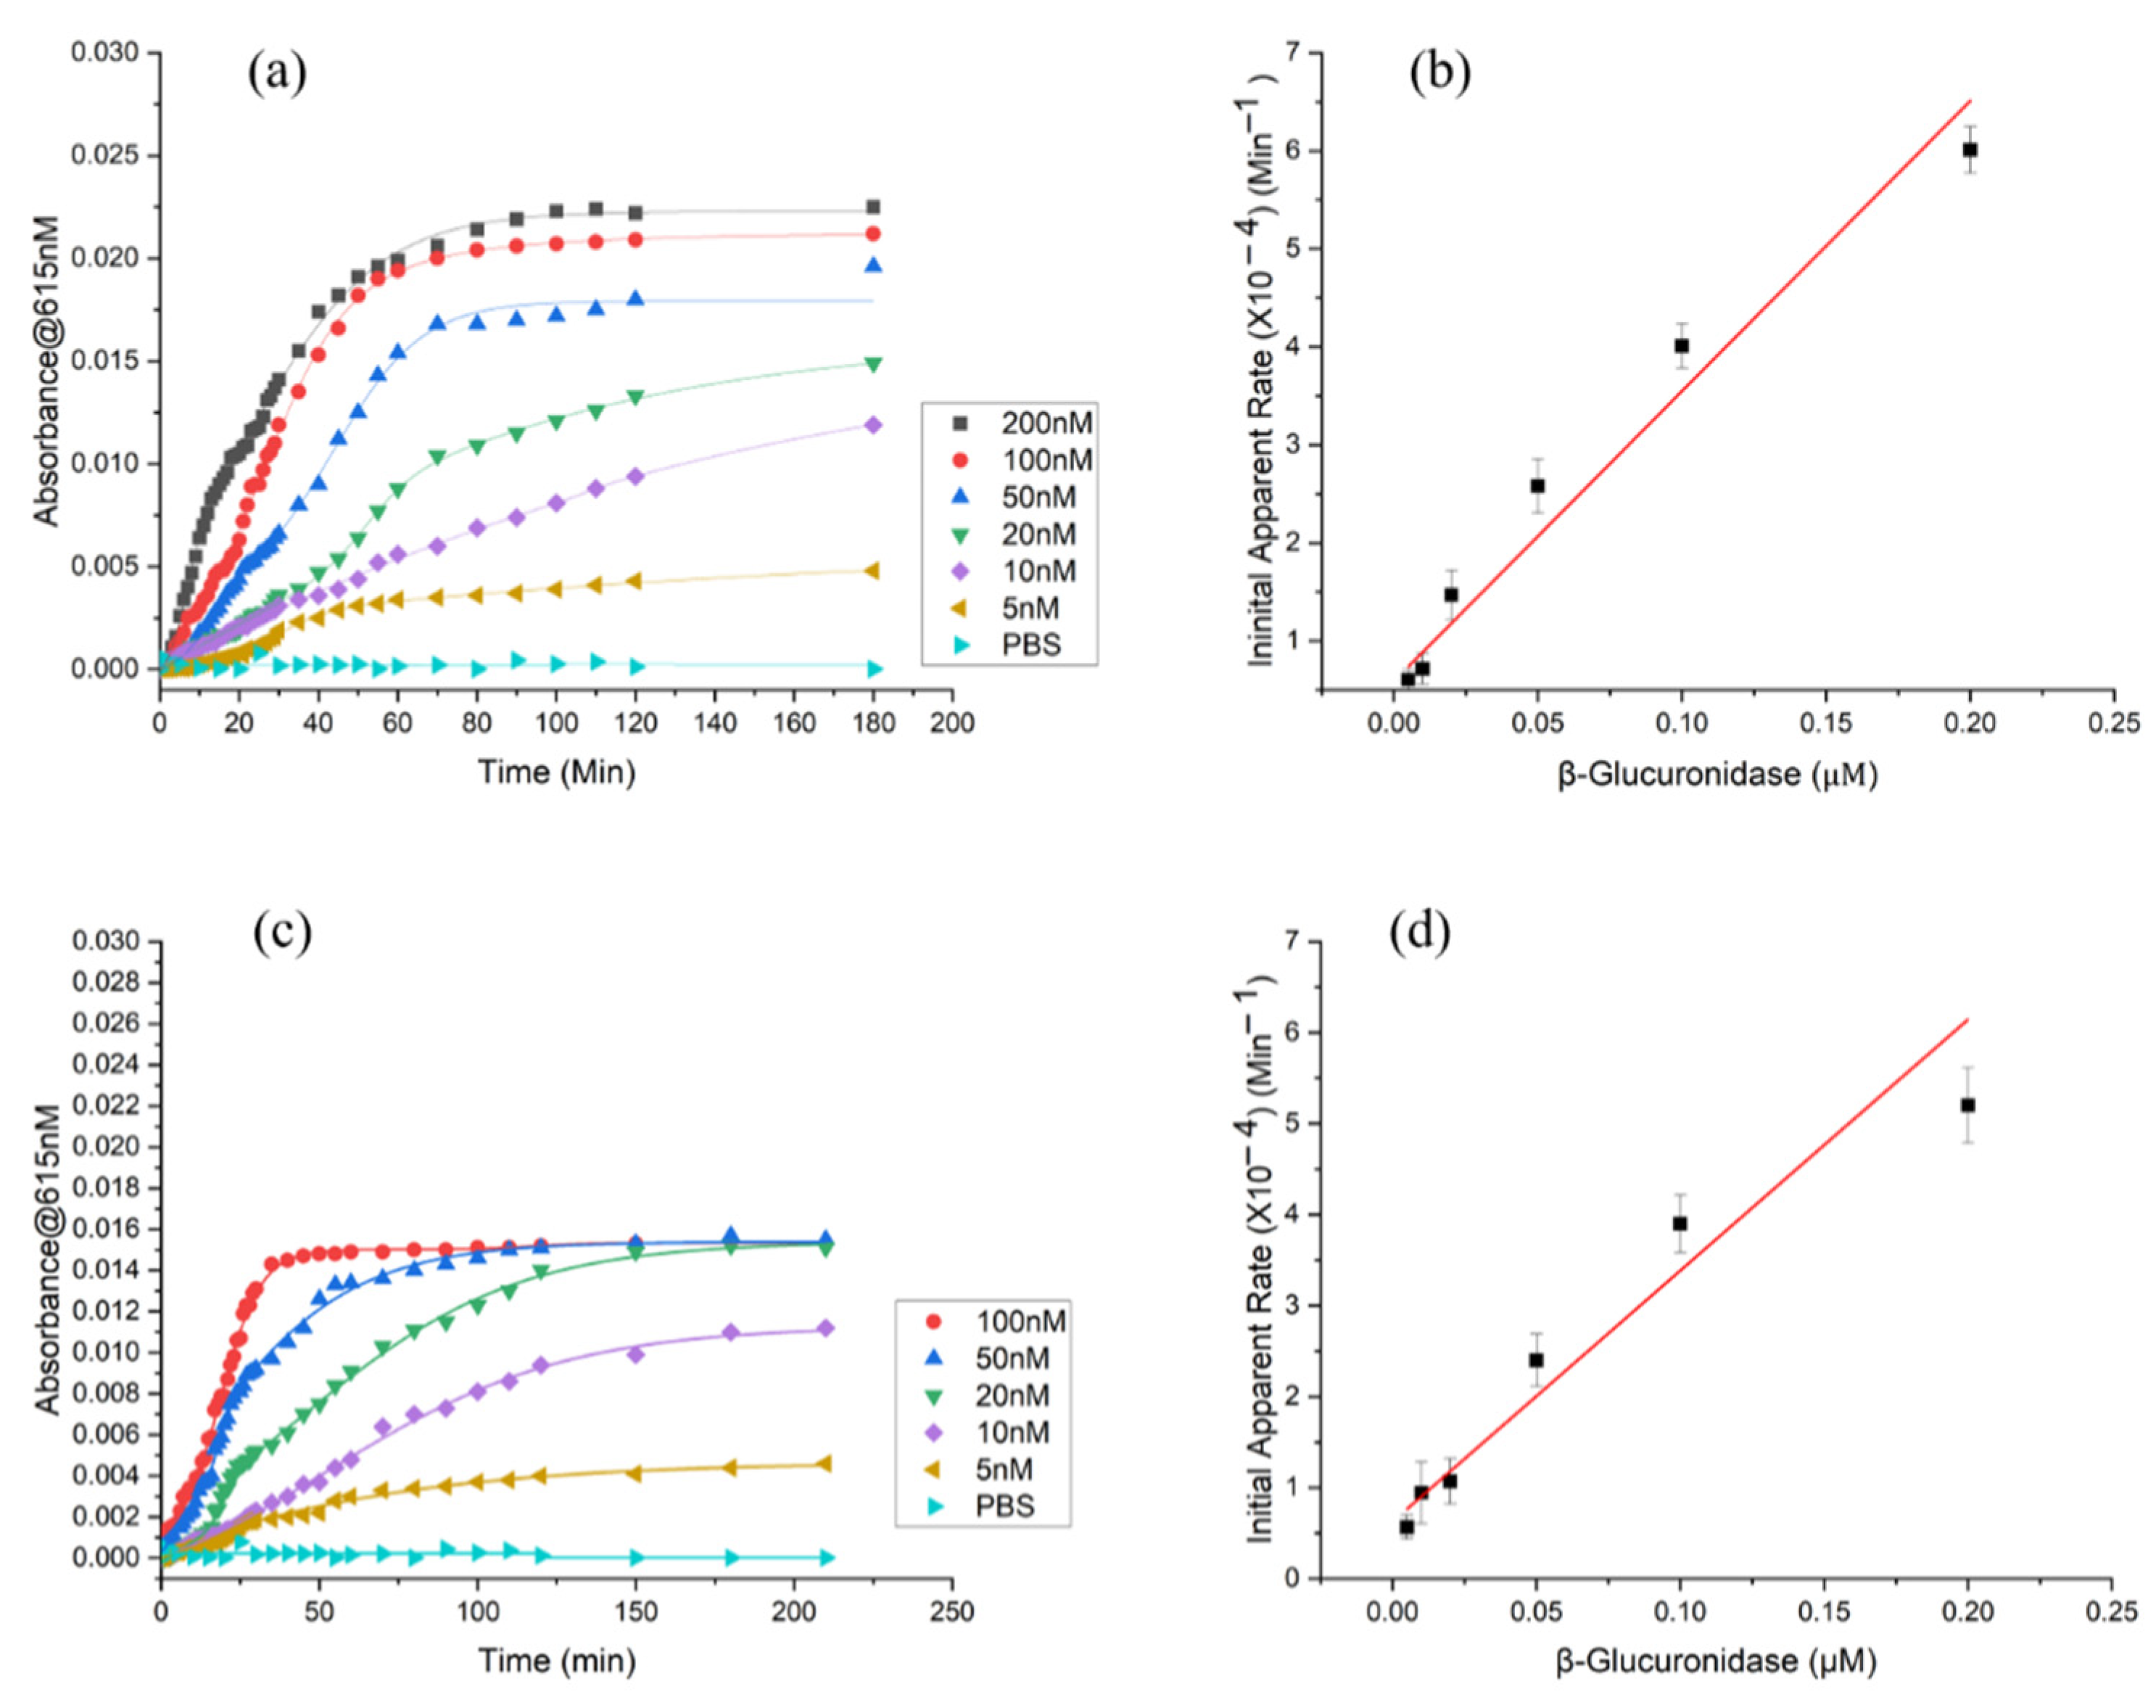
3.2.1. Impact of Varying Substrate and Enzyme Concentration on the Rate of Enzymatic Hydrolysis of X-Gluc Grafted PUAA-ADH

To investigate the enzymatic reaction of ß-GUS and X-Gluc grafted PUAA-ADH, the effect of the substrate concentration on the reaction rate was investigated first for a fixed enzyme concentration of 50 nM. The substrate concentration was varied by using different masses of hydrogel for a constant volume of enzyme solution, i.e., 2 mg, 4 mg, and 8 mg of the 40 µm cuboid hydrogel films. The absorbance spectra (Figure S13) and kinetics of the enzymatic reactions on the hydrogel at λmax = 615 nm were recorded using a UV-vis spectrometer at 25 °C, as illustrated in Figure 6. As can be observed, increasing substrate concentration also increased the rate of hydrolysis reaction and the concentration of product formed after the reaction kinetics reaches plateau. By contrast, the initial induction period decreased with increasing enzyme concentration. From the Michaelis Menten formalism it is possible to determine how fast a reaction increases with substrate concentration as well as the substrate concentration at which the rate is halfway to the maximum velocity. Figure S14 and Table S2 shows the initial reaction rates determined for varying substrate concentration.
To investigate the influence of initial enzyme concentration on the rate of the enzymatic reaction, X-Gluc-grafted PUAA-ADH films (2 mg–40 µm) were prepared. The absorbance spectra (Figure S15) and kinetics of the enzymatic reactions on the hydrogel at λmax = 615 nm were recorded using a UV-vis spectrometer at 25 °C for varying enzyme concentrations (i.e., 25 nM, 35 nM, 50 nM, 100 nM). Plots of the observed kinetics of absorbance versus time are shown in Figure 6b.
The sigmoidal-shaped kinetic curves of the liberation of dye as a function of time were observed with the induction period shortened with an increase in the enzyme concentration. The initial apparent reaction rates for the varying enzyme concentration were considered the slope from the linear least-squares fit of the kinetics plot [30] and excluding the induction period [58]. As the enzyme concentration increases the number of active sites for the reaction increases which speed up the conversion of substrate into product. However, this is true as long as the enzyme concentration is the limiting factor for the reaction. During the initial stages of the reaction, there is enough substrate to bind to the enzymes’ active sites, but as the reaction progresses, the substrate is used up and a further increase in the enzyme concentration does not warrant an increase in the initial reaction rate.
The observed kinetics is consistent with the classic Michaelis Menten kinetics [59]. The rate of substrate conversion to product is proportional to the enzyme concentration and the maximum reaction rate (maximum velocity) is unique for a given enzyme at a particular concentration. The maximum velocity (Vmax) of the enzymatic hydrolysis was 20.9 μM/min (50 nM enzyme concentration), while the substrate concentration required to reach half of the maximum velocity was obtained as 258.2 μM, for 40 µm MS hydrogel films as shown in Figure S16.

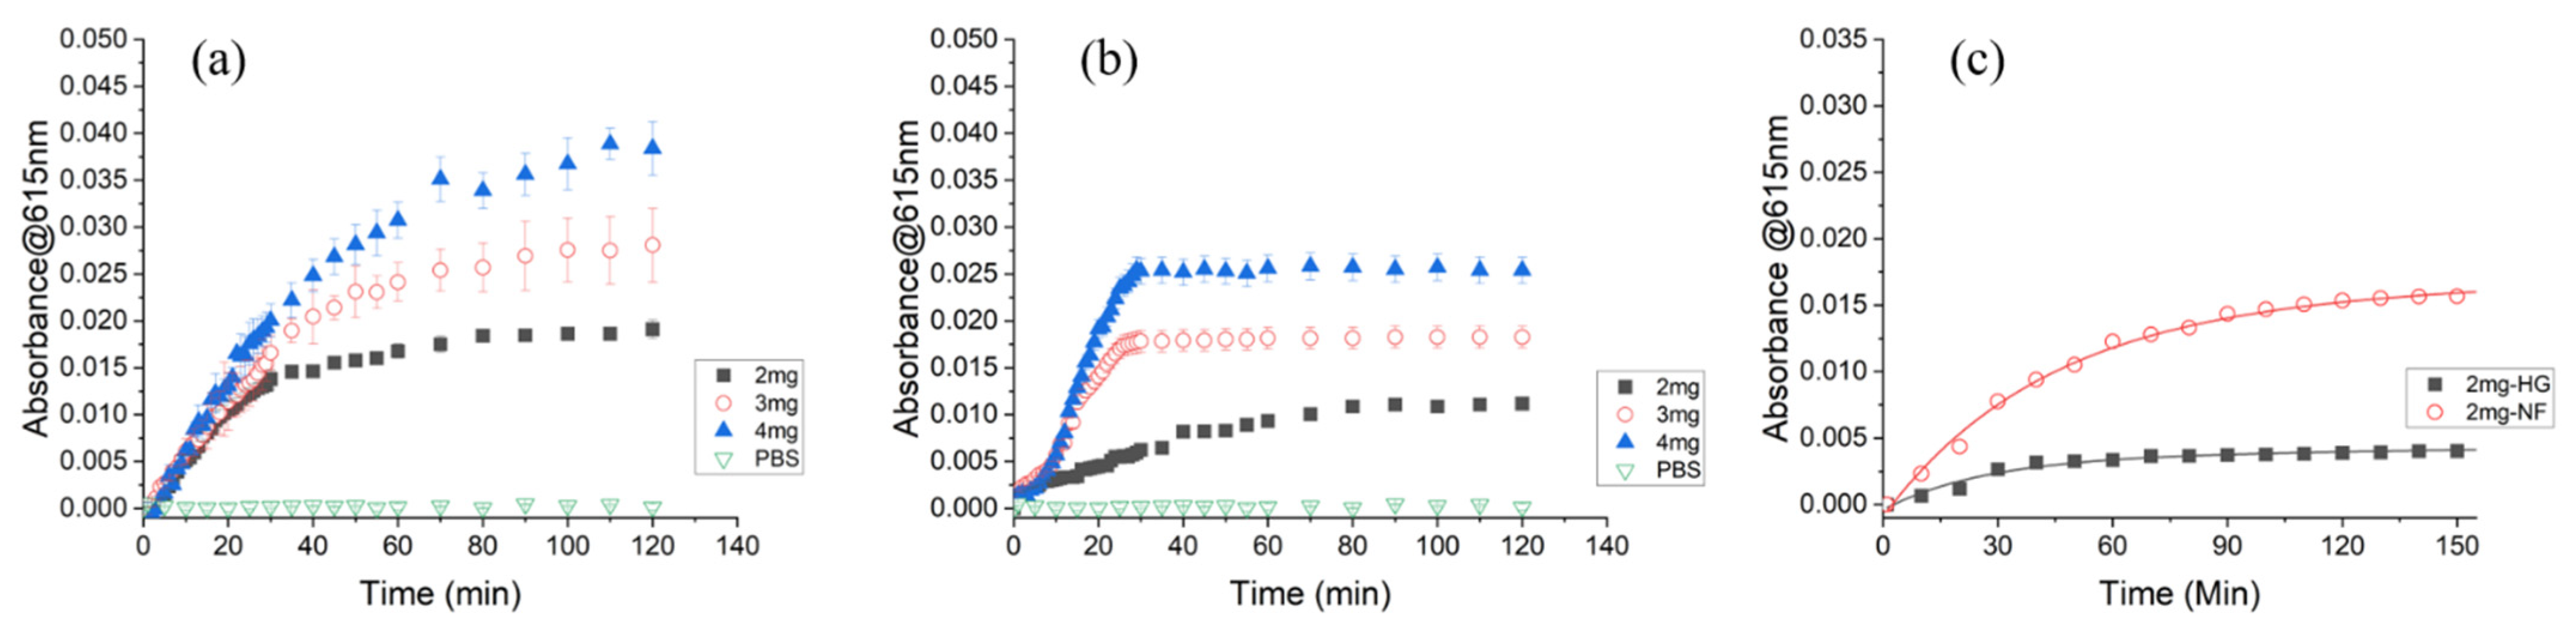
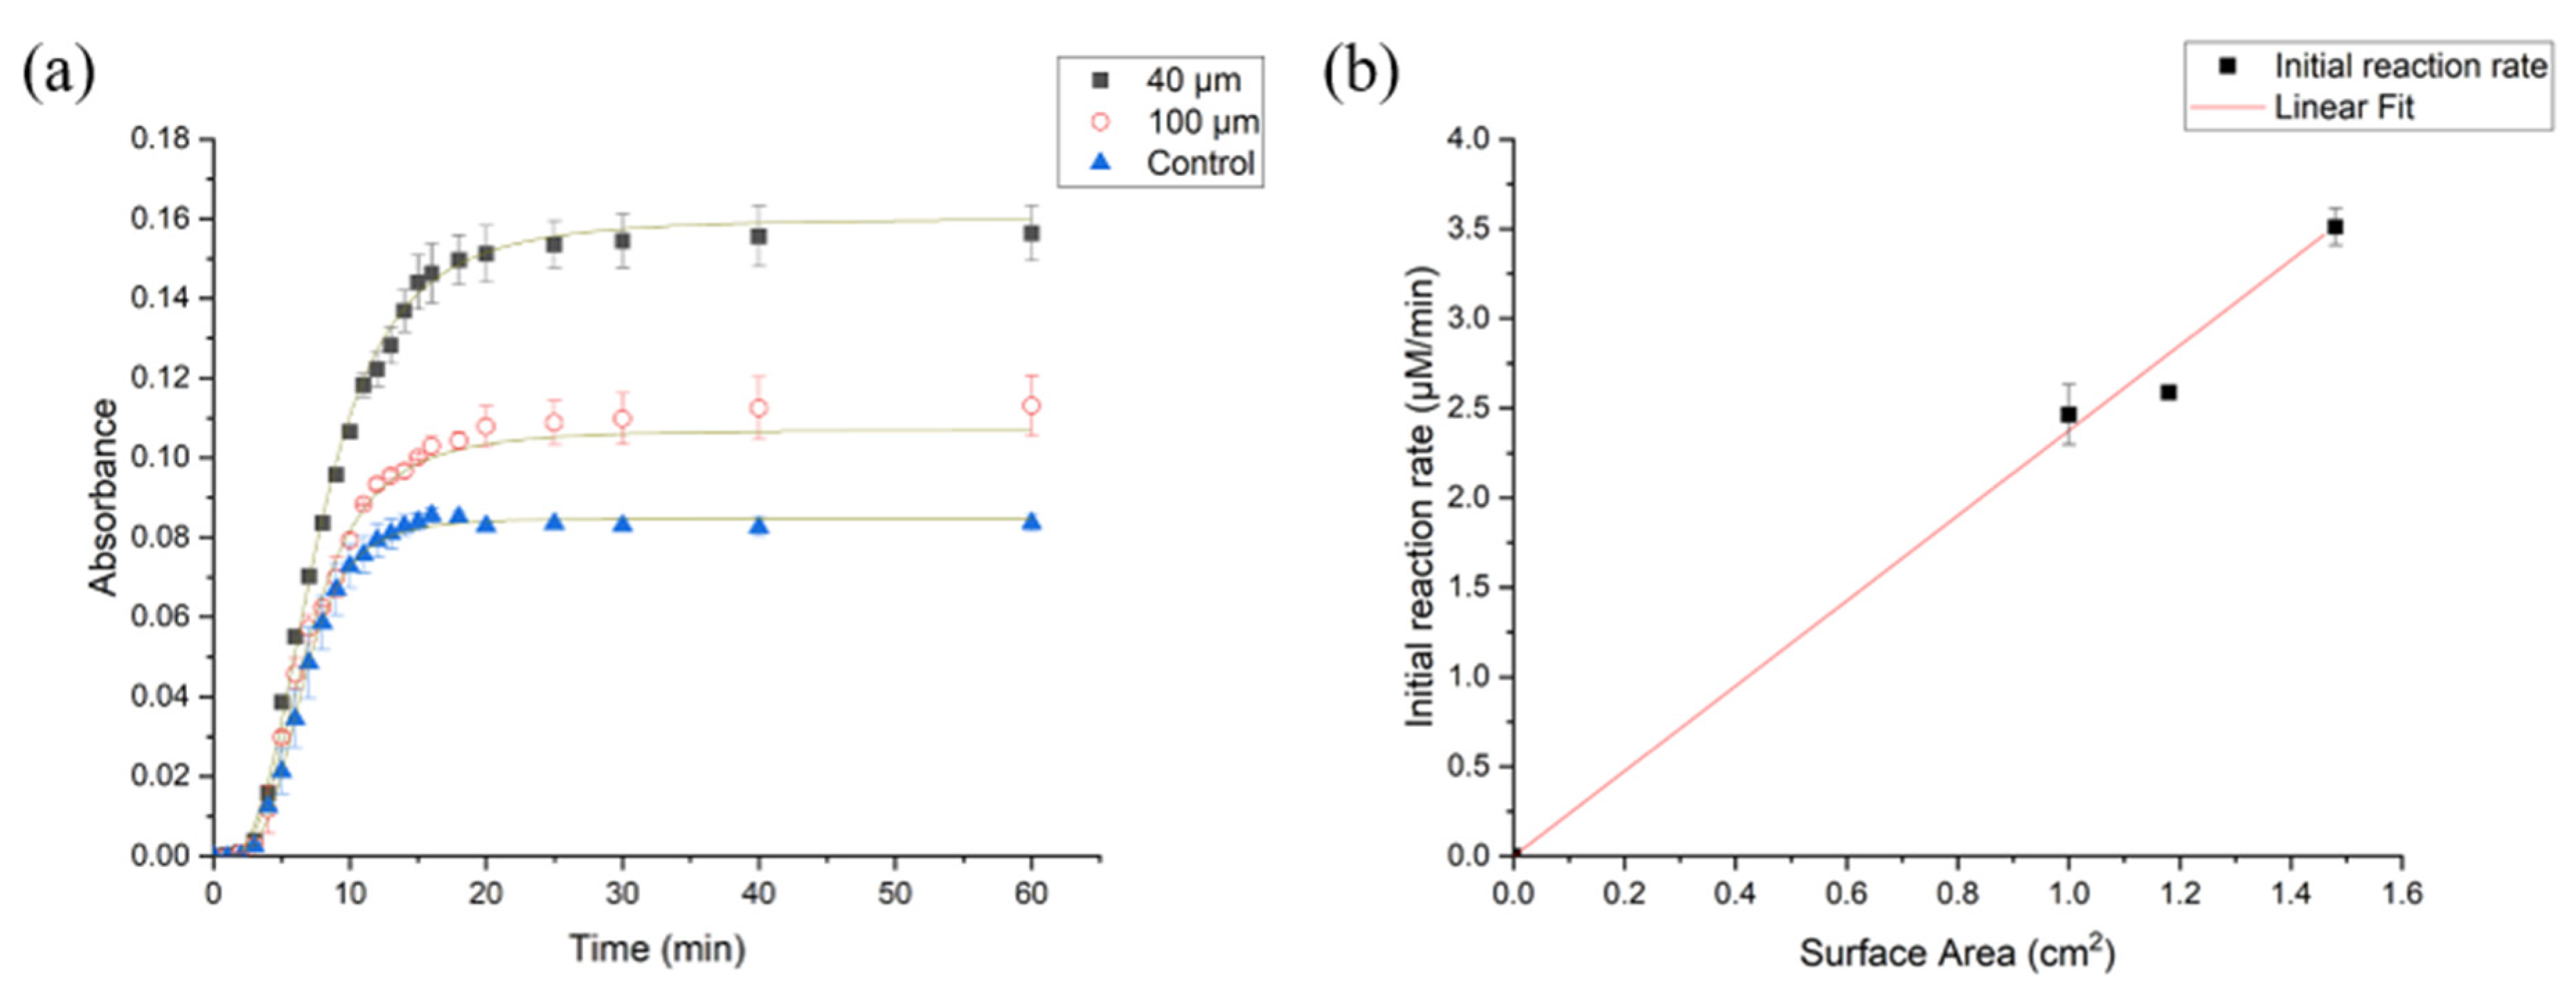
3.2.2. Impact of Varying Surface Area on the Rate of Enzyme Hydrolysis

Key for ultrasensitive sensing materials is an optimized response, which encompasses fast kinetics under given conditions. To assess and quantify the impact of increased specific surface area on the rate of sensor dye release, the enzymatic hydrolysis of 40 μm and 100 μm micro-cuboid patterned hydrogel films was compared to that of a flat featureless bulk PUAA-ADH film.
Figure 7a shows the corresponding kinetics of the enzymatic reaction captured by UV-vis spectroscopy during the reaction in 50 nM β-GUS in PBS at 25 °C for 1 h. For all films there was an increase in the absorbance in the visible region due to the released indigo dye, which became constant with time. The absorbance spectra for enzymatic reaction of films with various surface areas are shown in Figure S17.
Using the calibration curve (Figure S18), the concentration of released X-Gluc was determined and used to obtain the initial apparent reaction rates for 40 μm and 100 μm cuboids as well as the hydrogel control films. The initial apparent reaction rate for all films was obtained from the slope between the concentrations of released X-Gluc versus time, excluding the initial induction time. The corresponding initial apparent reaction rates were 3.51 ± 0.15 μM/min, 2.59 ± 0.18 μM/min and 2.46 ± 0.09 μM/min for 40 μm, 100 μm cuboid films and control films, respectively. These rates scale with the surface areas determined above. This dependence is very pronounced, as can be seen from an extrapolated plot of the initial apparent reaction rates and the surface area (Figure 7b). From the figure we observe a linear trend between the initial reaction rate and the surface area. A similar relationship was visualized between the absorbance and the surface area as in the Supporting Information (Figure S19).
The higher reaction rate observed for the 40 μm cuboid films can be attributed to the increased surface area, as the modification of the samples was carried out under the same conditions and hence leads to the same degree of functionalization with the chromogenic substrate. Owing to the size of the hydrogel structures, which are many orders of magnitude large compared to the relevant length scales of molecules (chromogenic substrate as well as enzyme) and segment length between crosslinks of the PUAA-ADH network, the hydrogel can be considered chemically and structurally homogeneous.
Similar findings have been reported by Das et al. [31] who reported enhanced reaction rates and sensitivity in nanofibers in comparison to bulk hydrogels. Hence, as long as the degree of functionalization and crosslinking is homogeneous and unaltered in micro- and also nanostructured hydrogels, one may extrapolate the initial reaction rates to sensing materials with significantly enhanced surface to volume ratio. As the surface area to volume ratio increases, more substrate molecules per unit mass of hydrogel are exposed to the enzymes, leading to increased initial reaction rates and hence more rapid sensor response. This interpretation requires that the relation of reaction rates and substrate concentration is similar to the one described in the Michaelis-Menten kinetics for not too high substrate concentrations. The reaction studied here is consistent with the Michaelis-Menten kinetics, since the initial rate depends linearly on enzyme concentration (see above and Figure S14d).
We can conclude that the sensitivity of the films to the enzyme β-GUS increases with surface area and that increasing the specific surface area is a promising strategy to enhance the sensor response. Certainly, the replication method employed above is not very practical for fabricating nanoscale sensing materials. Hence the influence of an increasing surface area on reaction rate was further explored by moving from the microscale to the nanoscale through fabrication of CS/PEO NFs by electrospinning. The performance of CS/PEO NFs was evaluated in a similar manner, as is discussed in Section 3.3.

3.3. Enzymatic Reaction in ß-Glucuronidase Sensing CS/PEO NFs

The enzymatic reaction in the CS/PEO NFs and hydrogels was investigated in buffered enzyme solutions (PBS, pH 7.4, under ambient conditions). In this reaction, ß-GUS cleaves the dye precursor of the chromogenic substrate that is attached to the chitosan in the CS/PEO NFs and hydrogels. The kinetics of the reaction was recorded using UV-Vis spectroscopy. Figure S20 shows the enzymatic hydrolysis of nanofiber and hydrogel samples at varied sample amounts. The spectra show an increase in the absorbance around the wavelength range of 550 nm to 750 nm. This increase is due to the increase in the concentration of the indigo derivative.
A plot of absorbance against time in Figure 8 at λmax = 615 nm shows an increase of absorbance with time to a maximum value and thereafter absorbance is constant with time. An increase in the substrate amount led to a subsequent increase in the rate of reaction and the amount of dye released for both the CS/PEO NFs and CS/PEO HG (Figure 8a,b). This increase may be interpreted as a result of the increase in the number of active sites for larger amounts of sample. The initial apparent rate of the reaction was obtained from a linear fit for the first 30 min of the reaction, when the reaction is steep before plateauing (Table S3).
A comparison was also performed for the reaction rate and performance among CS/PEO NFs and CS/PEO HG by placing the same amount of NFs and HG in 500 nM β-glucuronidase solution. As can be seen in Figure 8c, the reaction rates are much higher for the NFs as compared to the HG for the same amount of substrate and the same enzyme concentration. The apparent initial rates were found to be 0.71 µM/min for 2 mg CS/PEO NFs and 0.25 µM/min for 2 mg CS/PEO hydrogels, respectively. Additionally, the amount of dye released is higher in NFs as opposed to HG.
The difference in reaction was more pronounced for small amount of hydrogel sample, which can be understood by considering that the active enzyme sites responsible for breaking down the substrate are present at a constant concentration and are increasingly occupied. To evaluate the effect of varying enzyme concentration, 3 mg of CS/PEO NFs and 3 mg CS/PEO HG were used. The enzyme concentration was varied from 5 nM, 10 nM, 20 nM, 50 nM, 100 nM and 200 nM. The reaction rates were observed to increase with increasing enzyme concentration (Figure S21) for both the NFs and HG. Since the amount of substrate used was equal, the final concentration and plateau were approximately equal.

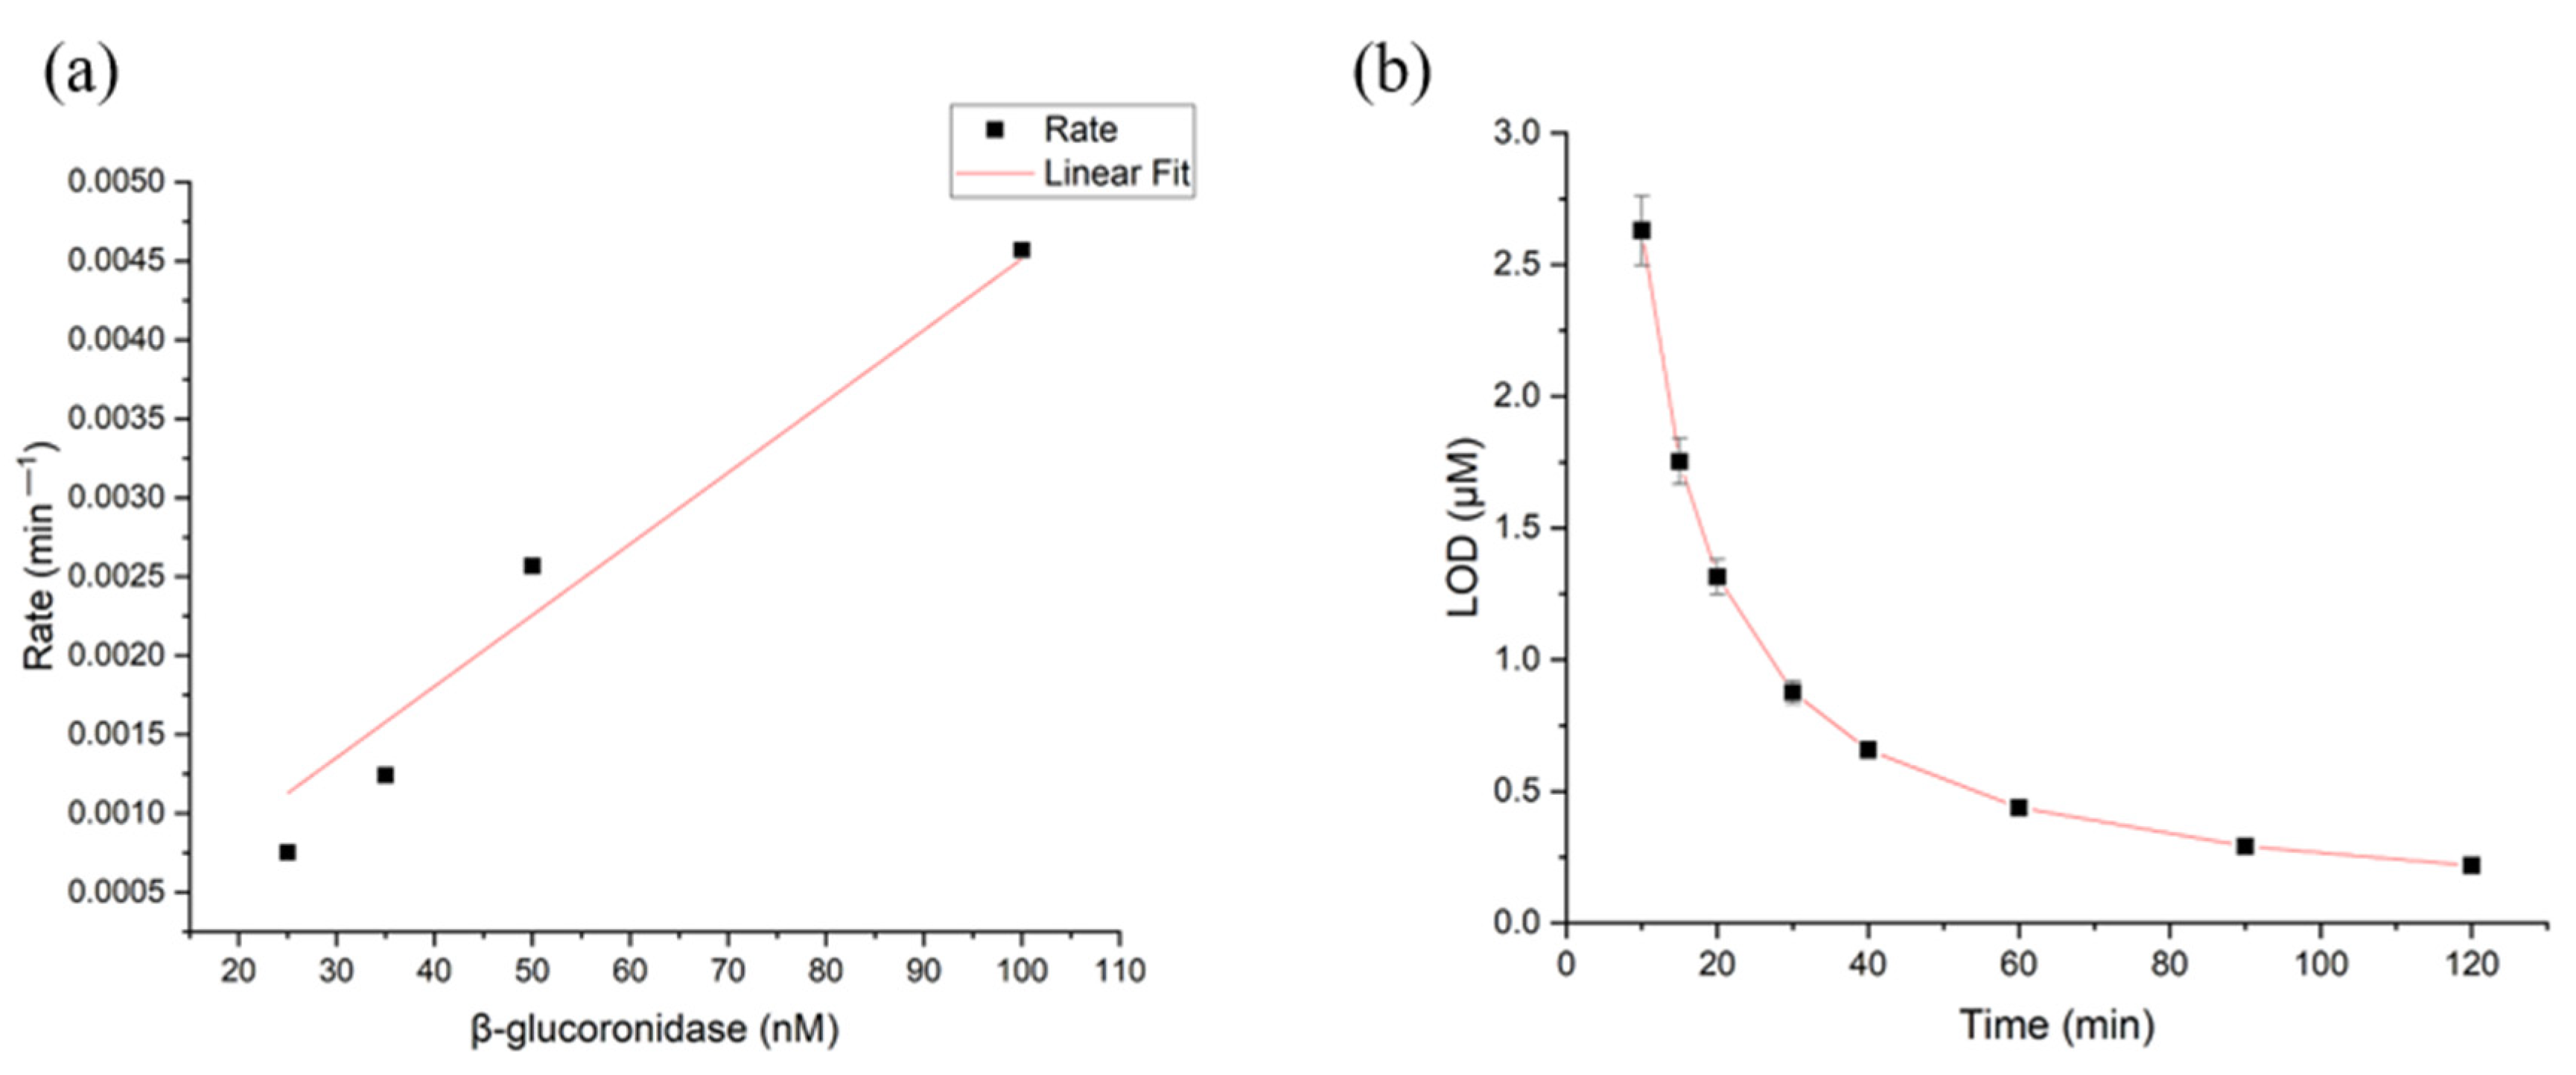
3.4. Limit of Detection (LOD) and Limit of Quantification (LOQ) for β-Glucuronidase in CS/PEO NFs and PUAA-ADH MS Hydrogel Films

From the plots in Figure 9, it is evident that there is an increase in the rate of reaction coupled with a subsequent increase in the concentration of the enzyme for both NFs and hydrogel, which goes hand in hand with Michaelis-Menten kinetics hypothesis [59].
In order to determine the LOD and LOQ of β-glucuronidase, first the LOD and LOQ of the indigo dye that is released during the reaction were determined from the calibration curve of indigo. The LOD and LOQ of the released indigo derivative were found to be 0.26 µM and 0.80 µM respectively (Figure S18). To reach these LOD and LOQ values in an enzyme reaction depends on the reaction rates, which then means it takes a different amount of time depending on the amount of enzyme. Therefore, for a randomly chosen time, t, the LOD and LOQ for the enzyme will be different, as is illustrated in Figure 10.
Similarly, the LOD of β-glucuronidase for PUAA micro-cuboid structured films was determined. The initial apparent rates of reaction were plotted against the initial concentrations of the enzyme. The initial apparent rate of reaction was found to be 4.5 ± 2.9 min−1 nM−1 and depended linearly on the initial enzyme concentration. The rate constant was obtained from the slope in Figure 11a and observation time was chosen arbitrarily.
From Figure 10 and Figure 11, it is evident that the minimum detectable signal corresponding to the LOD of the dye was dependent on the enzyme concentration and the reaction time as previously discussed by [28]. The observed LOD for β-glucuronidase enzyme reduced exponentially with respect to time for bulk hydrogel, micro-cuboid structured hydrogels and nanofibers. When subjected to a one-hour observation time, the LOD for the micro-cuboid hydrogels was found to be 440 nM. CS/PEO NFs LOD was 13 nM and 25 nM was reported as the LOD for CS/PEO HG-based sensors. For a similar observation time, the LOQ for the enzyme was found to be 45 nM for CS/PEO NFs and 60 nM for the CS/PEO HGs.
The two systems posted much better performances compared to the bulk hydrogel systems. While the NFs exhibited a lower LOD compared to the micro-cuboid structured hydrogels, the two systems are both an improvement to the bulk hydrogel systems. PUAA MS increased rate of hydrolysis by >25% while CS/PEO NFs increased by >50%. This offers room for improvement of bacteria sensors and in rapid detection.

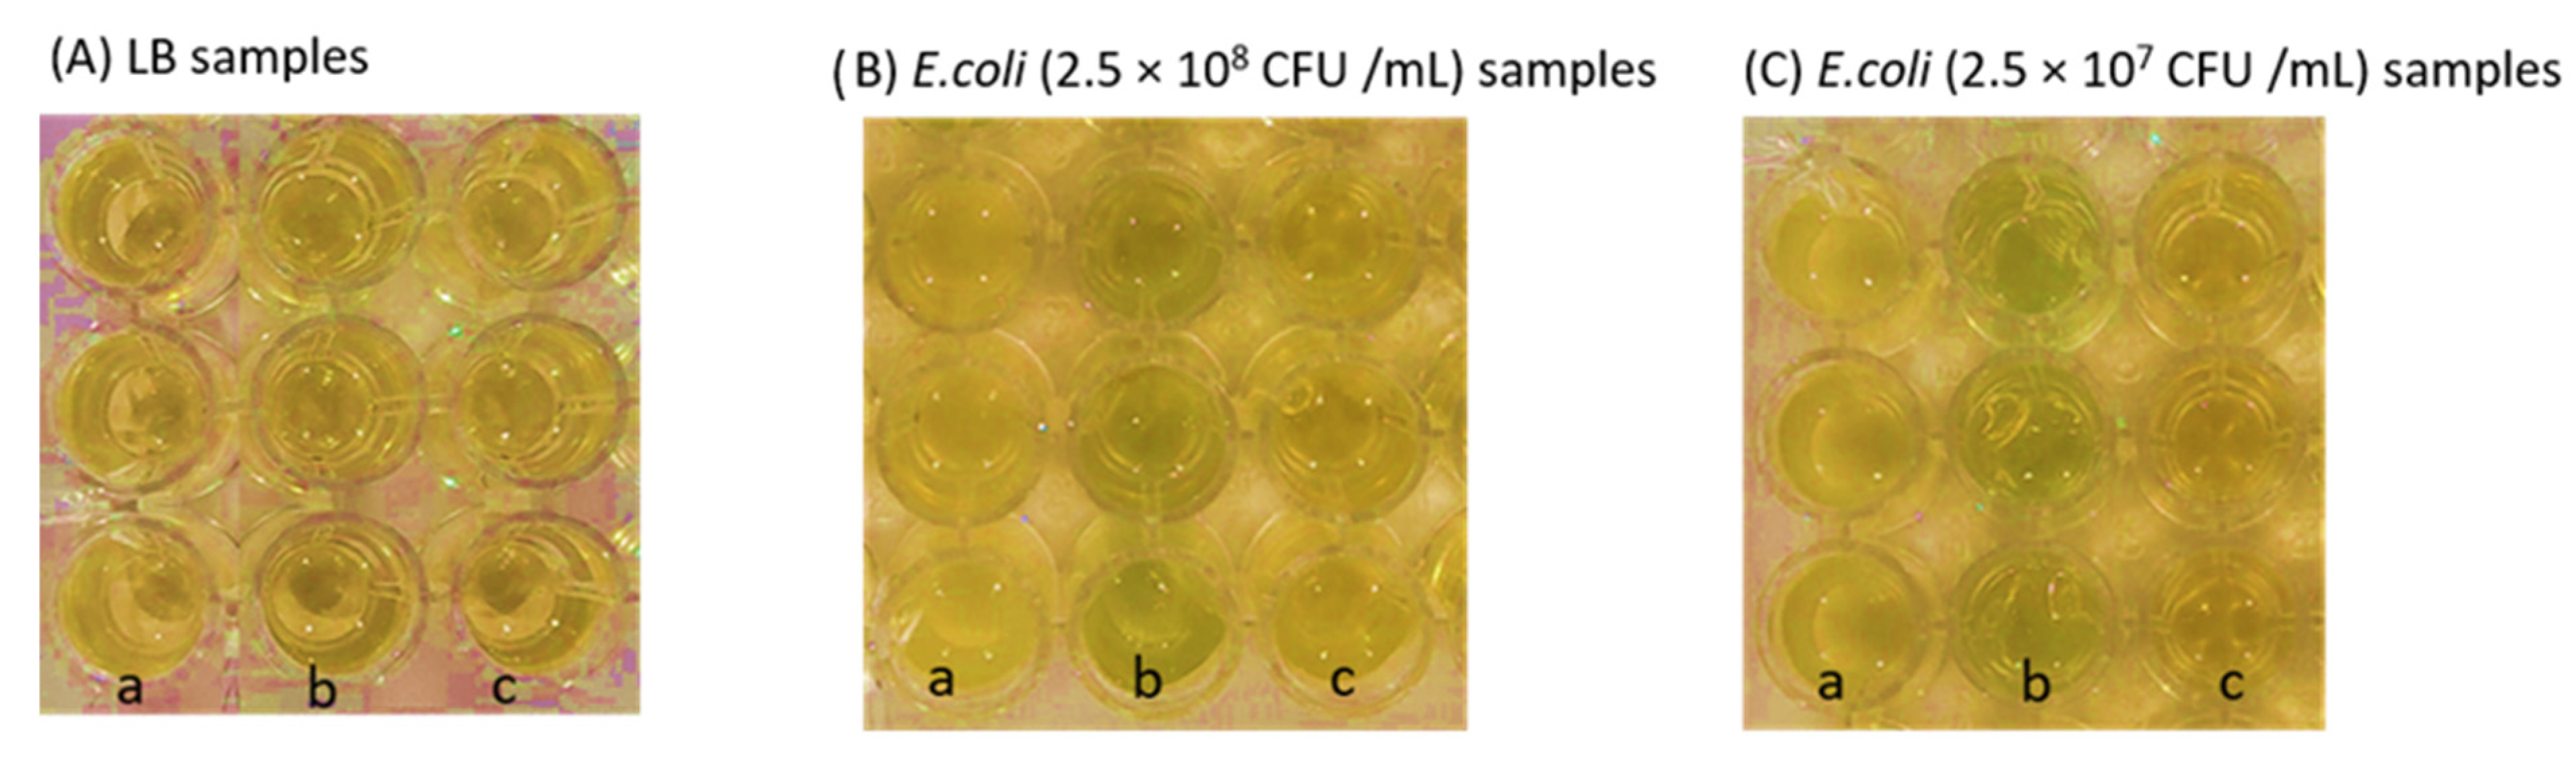
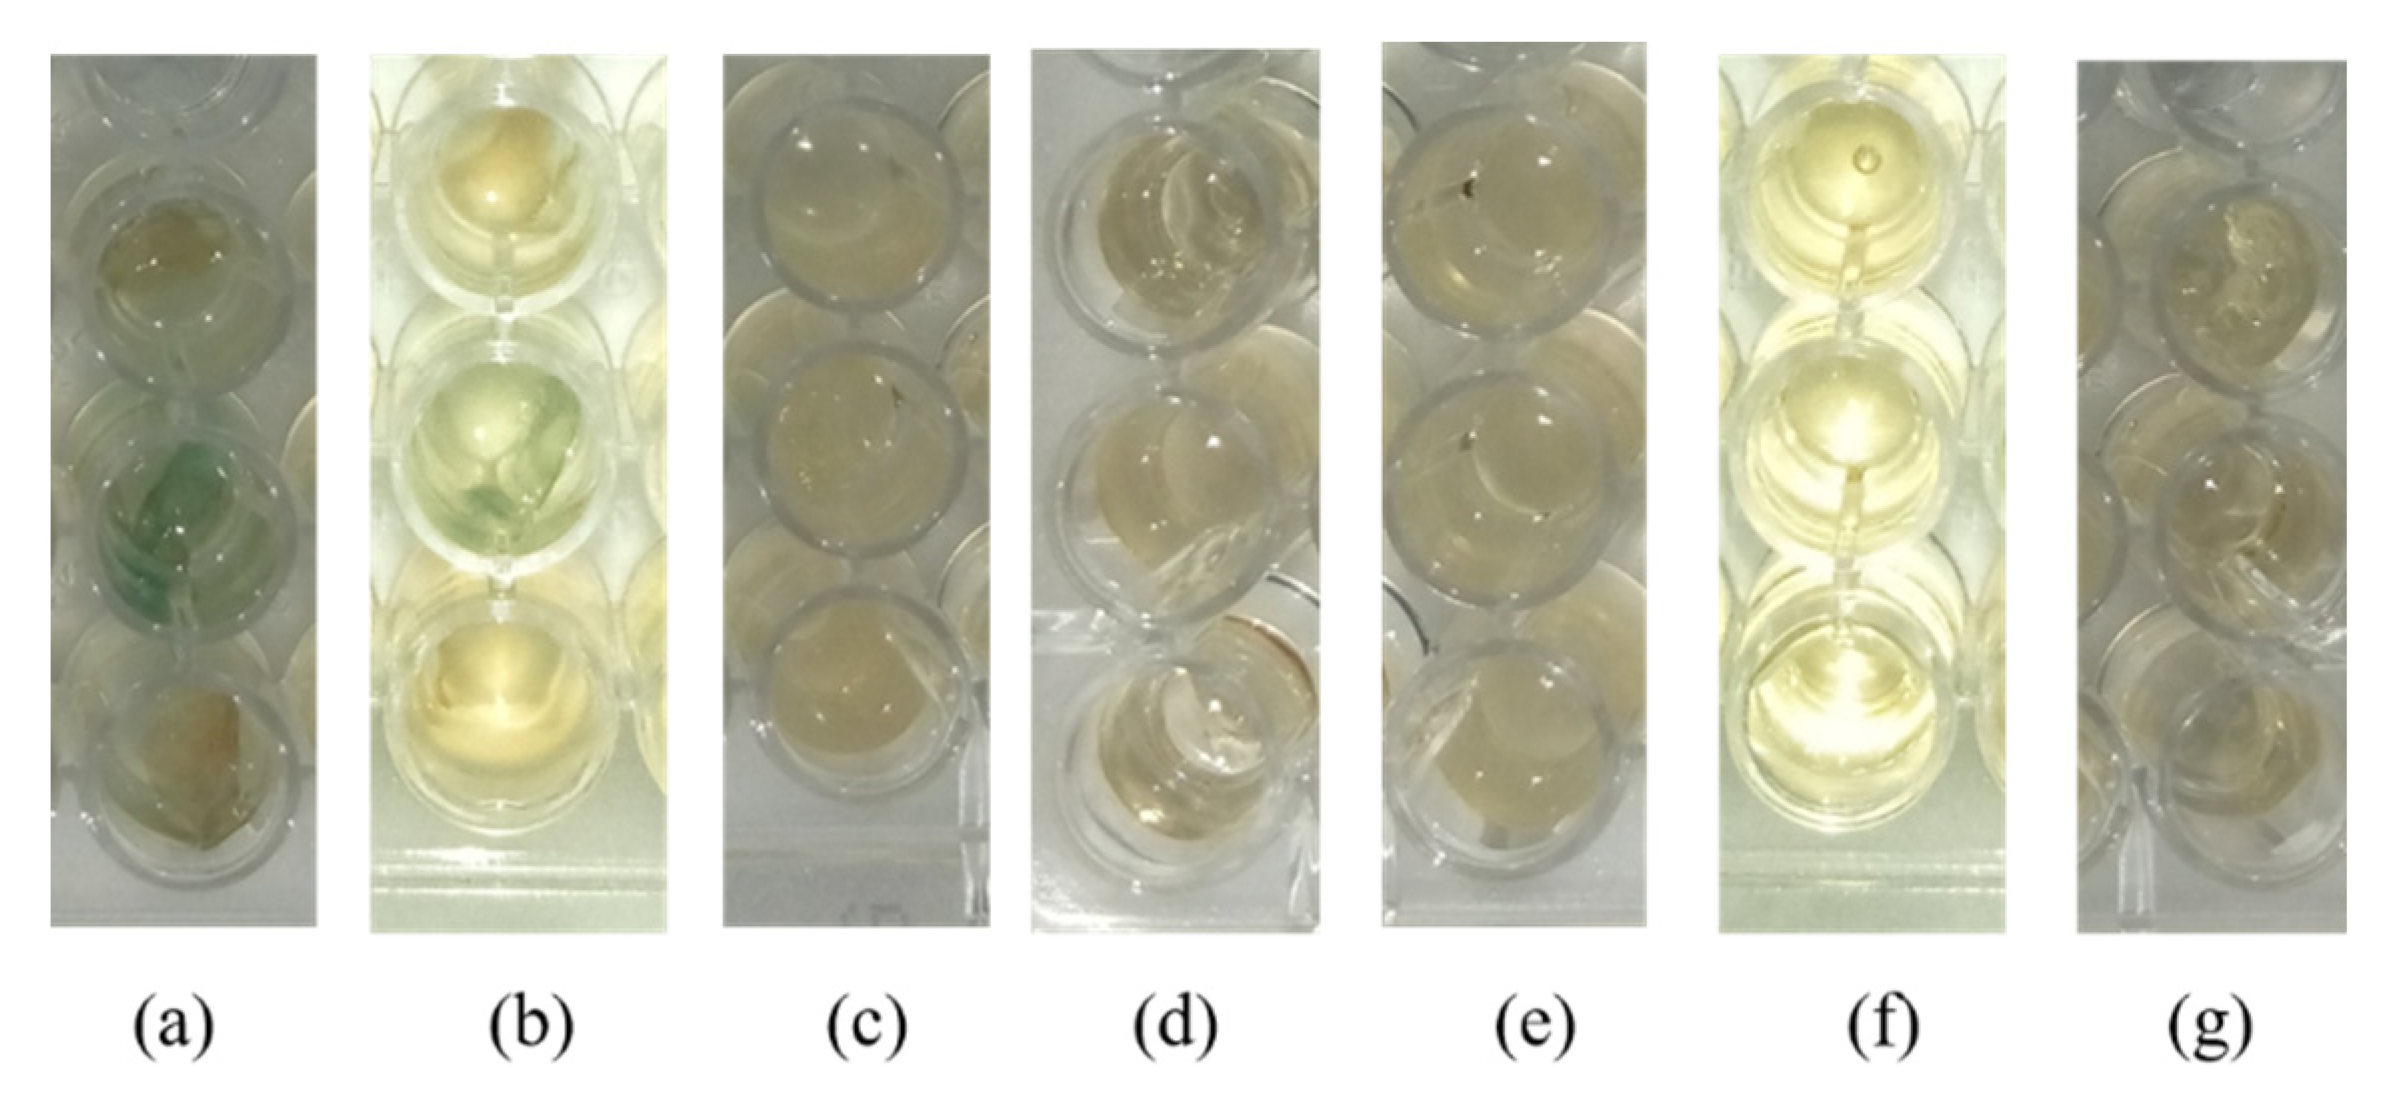
3.5. Detection Performance of PUAA-ADH_X-Gluc Films and CS/PEO Nanofibers with Bacterial Cultures

It is established that most E. coli strains can be selectively detected using the X-Gluc substrate because they produce the enzyme β-GUS [7]. Visible color changes by dye released from PUAA-ADH MS films, bacteria cultures with 2.5 × 10⁸ ± 1.4 × 10⁷ CFU/mL, and 2.5 × 10⁷ ± 1.4 × 10⁷ CFU/mL bacteria suspensions was investigated. Depending on the concentration of bacteria present absorbance values were affected by the level of turbidity of bacteria suspension and hence showed scattering. So, the presence of indigo in the final solution after kinetics was confirmed through centrifugation. To confirm that the absorbance was due to released dye, the supernatants from the well plates were centrifuged at 4 °C for 10 min at 7500 rpm to separate the bacteria from LB. Absorbance at 615 nm were recorded using microplate reader before and after centrifugation (Figure S22).
It was observed from Figure 12 that the wells with the dye modified hydrogel films developed a visible greenish-blue color as a consequence of the enzymatic reaction. The greenish-blue color observed is attributed to the overall color resulting from the presence of the blue dimerized dye released and the yellow color of the LB.
The observations support the catalytic hydrolysis of the β-glycosidic linkage in the PUAA-ADH_X-Gluc hydrogel films by the β-GUS enzyme produced by E. coli.
Related studies were carried out using 3 mg of CS/PEO NF sensing material placed in 96-well plates. 200 µL of the original bacteria suspension cultures (OD600 = 0.5; corresponding to 2.36 ± 0.01778 × 10⁷ CFU/mL and pH 7.4 were added as well as a 10-fold dilution in LB medium. The blue indole derivative released from breakdown of X-Gluc was visually observed only in wells with modified CS/PEO NFs. Figure 13 shows the presence of blue and greenish-blue color in wells with the β-glucuronidase sensing NFs. The visible color change after 24 h confirms that also the CS/PEO NFs are β-glucuronidase sensitive and can be used to detect living E. coli.
In order to ensure that the biosensor can actually detect bacteria without having a significant effect on their viability, the colony forming units (CFU) per mL were determined before and after the detection experiment with living bacteria for wells with polymer biosensors. The outcome for concentration of living bacteria in wells with polymer biosensor was compared to the concentration in wells without the sensing polymer as shown in Figure S23. From the CFU counts, it was found that the CFU/mL was on average lower in CS/PEO NFs as compared to wells with E. Coli cultures only. Compared to concentration before kinetics at 0 h, there was a 53.8% and 52.5% increase in the number of viable bacteria in wells with E. coli only and modified CS/PEO NFs respectively (not shown). Taking into account the CFU/mL after 24 h in the respective wells, there were 99.2%, 93.5% and 96.1% of viable bacteria in modified CS/PEO NFs in E. coli 2.36 × 10⁷ CFU/mL and 2.36 × 10⁶ CFU/mL and unmodified CS/PEO NFs 1.73 × 10⁶, respectively. On average, 96.3% of bacteria were still viable on CS/PEO NF samples after 24 h compared to controls. From this it is concluded that both modified and unmodified CS/PEO NFs have a minimal, but not significant inhibitory effect on bacteria growth and/or viability and thus can be used for bacteria-related applications and mainly bacteria detection.
Possible bacteria growth inhibition by PUAA hydrogels was also investigated as shown in the Figure S23b. According to the CFU analysis in Figure S23, a 44% and 7% difference in the bacteria concentration in PUAA-ADH and PUAA-ADH-X-Gluc hydrogel films with respect to E. coli bacteria (2.5 × 10⁸ CFU/mL) after 20 h incubation was observed. Similarly, 91% and 2% difference was observed in the bacteria concentration in PUAA-ADH and PUAA-ADH_X-Gluc hydrogel films with respect to E. coli bacteria (2.5 × 10⁷ CFU/mL). It is clear that bacteria growth was inhibited in the PUAA hydrogel films due to a possible antimicrobial effect. The results further demonstrate the good performance of the prepared PUAA-ADH hydrogel films despite its antimicrobial effect. These observations point out a possible dual functional property of this material that may be applicable as sensors for β-glucuronidase to detect E. coli and as antimicrobial wound dressing material due to its bacteria growth inhibiting properties.

4. Conclusions

Micro- and nanostructured autonomously reporting sensing hydrogel materials for the detection of ß-glucuronidase from E. coli were obtained by template replication and covalently crosslinking PUAA with adipic acid dihydrazide as well as by electrospinning CS/PEO nanofibers, followed by conjugation with the chromogenic substrate X-Gluc. An increase in surface area was shown to significantly enhance the sensitivity and thus the performance of the sensing materials. The reaction rate of the films with 40 µm cuboids was 26% higher than for 100 µm cuboids. CS/PEO NFs were on average 70% faster than the corresponding hydrogels. The NFs showed improved reaction rates and limits of detection, which were 137% faster and a factor of 33 lower than for the microcubes. The materials enabled the visual color detection of E. coli MACH1 cultures. The findings afford generalized design principles for the improvement of known and novel sensing materials towards rapid detection of bacteria and bacterial infections by nano-structuring.

Supplementary Materials

The following supporting information can be downloaded at: https://www.mdpi.com/article/10.3390/chemosensors10080299/s1. All supplementary material has been provided alongside the manuscript. Refs. [60,61] are cited in supplementary materials.

Author Contributions

Conceptualization: H.S., M.M., N.W.K.; methodology: K.K., D.D. and M.M. (microbiology), investigation: C.K.K. and A.O.O.; writing–original draft preparation: C.K.K. and A.O.O.; writing–review & editing: H.S., M.M., N.W.K., K.K. and D.D.; supervision: H.S., M.M. and N.W.K. All authors have read and agreed to the published version of the manuscript.

Funding

This work was supported by an ERASMUS+ program Kenia KA107 (Erasmus + Key Action 107, Partners: DeKuT and the University of Siegen), the Alexander von Humboldt Foundation (postdoctoral fellowship for DD), the Federal Ministry of Education and Research (BMBF) (FKZ 01DG21034 and FKZ 01KI2136), and the University of Siegen.

Institutional Review Board Statement

Not applicable.

Informed Consent Statement

Not applicable.

Data Availability Statement

The data presented in this study are available on request from the corresponding author. The data are not publicly available as they are part of an on-going study.

Acknowledgments

The authors thank Sergey I. Druzhinin for stimulating discussions and Gregor Schulte for excellent technical support and the University of Siegen workshop for the construction of the documentation systems.

Conflicts of Interest

Authors declare no conflict of interest.

References

  1. Blair, J.M.A.; Webber, M.A.; Baylay, A.J.; Ogbolu, D.O.; Piddock, L.J.V. Molecular Mechanisms of Antibiotic Resistance. Nat. Rev. Microbiol. 2015, 13, 42–51. [Google Scholar] [CrossRef] [PubMed]
  2. Murray, C.J.; Ikuta, K.S.; Sharara, F.; Swetschinski, L.; Aguilar, G.R.; Gray, A.; Han, C.; Bisignano, C.; Rao, P.; Wool, E.; et al. Global Burden of Bacterial Antimicrobial Resistance in 2019: A Systematic Analysis. Lancet 2022, 399, 629–655. [Google Scholar] [CrossRef]
  3. Aliabadi, S.; Anyanwu, P.; Beech, E.; Jauneikaite, E.; Wilson, P.; Hope, R.; Majeed, A.; Muller-Pebody, B.; Costelloe, C. Effect of Antibiotic Stewardship Interventions in Primary Care on Antimicrobial Resistance of Escherichia coli bacteraemia in England (2013–18): A Quasi-experimental, Ecological, Data Linkage Study. Lancet Infect. Dis. 2021, 21, 1689–1700. [Google Scholar] [CrossRef]
  4. Firoozeh, F.; Zibaei, M.; Badmasti, F.; Khaledi, A. Virulence Factors, Antimicrobial Resistance and the Relationship Between these Characteristics in Uropathogenic Escherichia coli. Gene Rep. 2022, 27, 101622. [Google Scholar] [CrossRef]
  5. Shaibani, P.M.; Etayash, H.; Jiang, K.; Sohrabi, A.; Hassanpourfard, M.; Naicker, S.; Sadrzadeh, M.; Thundat, T. Portable Nanofiber-light Addressable Potentiometric Sensor for Rapid Escherichia coli Detection in Orange Juice. ACS Sens. 2018, 3, 815–822. [Google Scholar] [CrossRef] [PubMed]
  6. Jang, J.; Hur, H.-G.; Sadowsky, M.J.; Byappanahalli, M.N.; Yan, T.; Ishii, S. Environmental Escherichia coli: Ecology and public health implications—A review. J. Appl. Microbiol. 2017, 123, 570–581. [Google Scholar] [CrossRef] [PubMed] [Green Version]
  7. Orenga, S.; James, A.L.; Manafi, M.; Perry, J.D.; Pincus, D.H. Enzymatic Substrates in Microbiology. J. Microbiol. Methods 2009, 79, 139–155. [Google Scholar] [CrossRef]
  8. Culp, E.J.; Waglechner, N.; Wang, W.; Fiebig-Comyn, A.A.; Hsu, Y.P.; Koteva, K.; Sychantha, D.; Coombes, B.K.; Van Nieuwenhze, M.S.; Brun, Y.V.; et al. Evolution-Guided Discovery of Antibiotics that Inhibit Peptidoglycan Remodelling. Nature 2020, 578, 582–587. [Google Scholar] [CrossRef]
  9. Gall, T.L.; Lemercier, G.; Chevreux, S.; Tücking, K.S.; Ravel, J.; Thetiot, F.; Jonas, U.; Schönherr, H.; Montier, T. Ruthenium(II) Polypyridyl Complexes as Photosensitizers for Antibacterial Photodynamic Therapy: A Structure-Activity Study on Clinical Bacterial Strains. Chem. Med. Chem. 2018, 13, 2229–2239. [Google Scholar] [CrossRef]
  10. Zhao, X.; Lin, C.W.; Wang, J.; Oh, D.H. Advances in Rapid Detection Methods for Foodborne Pathogens. J. Microbiol. Biotechnol. 2014, 24, 297–312. [Google Scholar] [CrossRef] [Green Version]
  11. Deusenbery, C.; Wang, Y.; Shukla, A. Recent Innovations in Bacterial Infection Detection and Treatment. ACS Infect. Dis. 2021, 7, 695–720. [Google Scholar] [CrossRef] [PubMed]
  12. Kampfer, P.; Nienhuser, A.; Packroff, G.; Wernicke, F.; Mehling, A.; Nixdorf, K.; Fiedler, S.; Kolauch, C.; Esser, M. Molecular Identification of Coliform Bacteria Isolated from Drinking Water Reservoirs with Traditional Methods and the Colilert-18 System. Int. J. Hyg. Environ. Health 2007, 211, 374–384. [Google Scholar] [CrossRef] [PubMed]
  13. Haller, L.; Hutton, G.; Bartram, J. Estimating the Costs and Health Benefits of Water and Sanitation Improvements at Global Level. J. Water Health 2007, 5, 467–480. [Google Scholar] [CrossRef] [PubMed] [Green Version]
  14. Singh, R.; Mukherjee, M.D.; Sumana, G.; Gupta, R.K.; Sood, S.; Malhotra, B.D. Biosensors for Pathogen Detection: A Smart Approach Towards Clinical Diagnosis. Sens. Actuators B 2014, 197, 385–404. [Google Scholar] [CrossRef]
  15. Cui, C.; Shu, W.; Li, P. Fluorescence In Situ Hybridization: Cell-Based Genetic Diagnostic and Research Applications. Front. Cell Dev. Biol. 2016, 4, 89. [Google Scholar] [CrossRef] [Green Version]
  16. Guo, Y.; Zhou, Y.; Fu, J.; Fang, H.; Li, Y.; Huang, X.; Xiong, Y. A Self-luminous Bifunctional Bacteria Directed Fluorescent Immunosensor for the Simultaneous Detection and Quantification of Three Pathogens in Milk. Sens. Actuators B Chem. 2021, 338, 129757–129764. [Google Scholar] [CrossRef]
  17. Sylvia, S.V.; Salomi, R.J.; Rajendran, L.; Lyons, M.E.G. Amperometric Biosensors and Coupled Enzyme Nonlinear Reactions Processes: A Complete Theoretical and Numerical Approach. Electrochim. Acta 2022, 415, 140236. [Google Scholar] [CrossRef]
  18. Radke, S.M.; Alocilja, E.C. A High Density Microelectrode Array Biosensor for Detection of E. coli O157:H7. Biosens. Bioelectron. 2005, 20, 1662–1667. [Google Scholar] [CrossRef] [PubMed]
  19. Choi, Y.; Lee, S.; Lee, H.; Lee, S.; Kim, S.; Lee, J.; Ha, J.; Oh, H.; Lee, Y.; Kim, Y.; et al. Rapid Detection of Escherichia coli in Fresh Foods Using a Combination of Enrichment and PCR Analysis. Korean J. Food Sci. Anim. Resour. 2018, 38, 829–834. [Google Scholar]
  20. Zhou, J.; Loftus, A.L.; Mulley, G.; Jenkins, A.T.A. A Thin Film Detection/Response System for Pathogenic Bacteria. J. Am. Chem. Soc. 2010, 132, 6566–6570. [Google Scholar] [CrossRef]
  21. Marshall, S.E.; Hong, S.-H.; Thet, N.T.; Jenkins, A.T.A. Effect of Lipid and Fatty Acid Composition of Phospholipid Vesicles on Long-Term Stability and Their Response to Staphylococcus Aureus and Pseudomonas aeruginosa Supernatants. Langmuir 2013, 29, 6989–6995. [Google Scholar] [CrossRef] [PubMed]
  22. Haas, S.; Hain, N.; Raoufi, M.; Handschuh-Wang, S.; Wang, T.; Jiang, X.; Schönherr, H. Enzyme Degradable Polymersomes from Hyaluronic Acid-block-Poly(ε-Caprolactone) Copolymers for the Detection of Enzymes of Pathogenic Bacteria. Biomacromolecules 2015, 16, 832–841. [Google Scholar] [CrossRef] [PubMed]
  23. Tücking, K.S.; Grützner, V.; Unger, R.E.; Schönherr, H. Dual Enzyme-Responsive Capsules of Hyaluronic Acid-block-Poly(lactic acid) for Sensing Bacterial Enzymes. Macromol. Rapid Comm. 2015, 36, 1248–1254. [Google Scholar] [CrossRef] [PubMed]
  24. Miranda, O.R.; Li, X.; Garcia-Gonzalez, L.; Zhu, Z.J.; Yan, B.; Bunz, U.H.F.; Rotello, V.M. Colorimetric Bacteria Sensing Using a Supramolecular Enzyme-Nanoparticle Biosensor. J. Am. Chem. Soc. 2011, 133, 9650–9653. [Google Scholar] [CrossRef] [Green Version]
  25. Horne, J.; McLoughlin, L.; Bridgers, B.; Wujcik, E.K. Recent Developments in Nanofiber-Based Sensors for Disease Detection, Immunosensing, and Monitoring. Sens. Act. Rep. 2020, 2, 100005–100013. [Google Scholar] [CrossRef]
  26. Aliheidari, N.; Aliahmad, N.; Agarwal, M.; Dalir, H. Electrospun Nanofibers for Label-Free Sensor Applications. Sensors 2019, 19, 3587. [Google Scholar] [CrossRef] [Green Version]
  27. Ebrahimi, M.M.S.; Laabei, M.; Jenkins, A.T.A.; Schönherr, H. Autonomously Sensing Hydrogels for the Rapid and Selective Detection of Pathogenic Bacteria. Macromol. Rapid Commun. 2015, 36, 2123–2128. [Google Scholar] [CrossRef]
  28. Jia, Z.; Sukker, I.; Müller, M.; Schönherr, H. Selective Determination of Key Enzymes of Pathogenic and Nonpathogenic Bacteria on Autonomously Reporting Shape-Encoded Hydrogel Patterns. ACS Appl. Mater. Interfaces 2018, 10, 5175–5184. [Google Scholar] [CrossRef]
  29. Kaur, K.; Chelangat, W.; Druzhinin, S.I.; Karuri, N.W.; Müller, M.; Schönherr, H. Quantitative E. coli Enzyme Detection in Reporter Hydrogel-Coated Paper Using a Smartphone Camera. Biosensors 2021, 11, 25. [Google Scholar] [CrossRef]
  30. Ebrahimi, M.M.S.; Schönherr, H. Enzyme-Sensing Chitosan Hydrogels. Langmuir 2014, 30, 7842–7850. [Google Scholar] [CrossRef]
  31. Das, D.; Alhusaini, Q.F.M.; Kaur, K.; Raoufi, M.; Schönherr, H. Enzyme-Responsive Biopolymeric Nanogel Fibers by Extrusion: Engineering of High-Surface-Area Hydrogels and Application in Bacterial Enzyme Detection. ACS Appl. Mater. Interfaces 2021, 13, 12928–12940. [Google Scholar] [CrossRef]
  32. Halicka, K.; Cabaj, J. Electrospun Nanofibers for Sensing and Biosensing Applications—A Review. Int. J. Mol. Sci. 2021, 22, 6357. [Google Scholar] [CrossRef]
  33. Kang, S.; Zhao, K.; Yu, D.G.; Zheng, X.; Huang, C. Advances in Biosensing and Environmental Monitoring Based on Electrospun Nanofibers. Adv. Fiber Mater. 2022, 4, 404–435. [Google Scholar] [CrossRef]
  34. Liao, Y.; Loh, C.H.; Tian, M.; Wang, R.; Fane, A.G. Progress in Electrospun Polymeric Nanofibrous Membranes for Water Treatment: Fabrication, Modification and Applications. Prog. Polym. Sci. 2018, 77, 69–94. [Google Scholar] [CrossRef]
  35. Zhou, K.; Wang, M.; Zhou, Y.; Sun, M.; Xie, Y.; Yu, D.G. Comparisons of Antibacterial Performances Between Electrospun Polymer@Drug Nanohybrids with Drug-Polymer Nanocomposites. Adv. Compos. Hybrid. Mater. 2022, 5, 907–919. [Google Scholar] [CrossRef]
  36. Wen, P.; Wen, Y.; Zong, M.H.; Linhardt, R.J.; Wu, H. Encapsulation of Bioactive Compound in Electrospun Fibers and Its Potential Application. J. Agric. Food Chem. 2017, 65, 9161–9179. [Google Scholar] [CrossRef] [PubMed]
  37. Zhang, Y.; Wang, Y.; Jia, J.; Wang, J. Nonenzymatic Glucose Sensor Based on Graphene Oxide and Electrospun NiO Nanofibers. Sens. Actuators B 2012, 171, 580–587. [Google Scholar] [CrossRef]
  38. Migliorini, F.L.; Sanfelice, R.C.; Mercante, L.A.; Andre, R.S.; Mattoso, L.H.C.; Correa, D.S. Urea Impedimetric Biosensing Using Electrospun Nanofibers Modified with Zinc Oxide Nanoparticles. Appl. Surf. Sci. 2018, 443, 18–23. [Google Scholar] [CrossRef]
  39. Tripathy, S.; Bhandari, V.; Sharma, P.; Vanjari, S.R.K.; Singh, S.G. Chemiresistive DNA Hybridization Sensor with Electrospun Nanofibers: A Method to Minimize Inter-Device Variability. Biosens. Bioelectron. 2019, 133, 24–31. [Google Scholar] [CrossRef] [PubMed]
  40. Wang, Z.; Zhang, L.; Liu, J.; Li, C. A Flexible Bimodal Sensor Based on an Electrospun Nanofibrous Structure for Simultaneous Pressure-Temperature Detection. Nanoscale 2019, 11, 14242–14249. [Google Scholar] [CrossRef] [PubMed]
  41. Thiha, A.; Ibrahim, F.; Muniandy, S.; Dinshaw, I.J.; The, S.J.; Thong, K.L.; Leo, B.F.; Madou, M. All-Carbon Suspended Nanowire Sensors as a Rapid Highly-Sensitive Label-Free Chemiresistive Biosensing Platform. Biosens. Bioelectron. 2018, 107, 145–152. [Google Scholar] [CrossRef] [PubMed]
  42. McCarthy, A.; Saldana, L.; Ackerman, D.N.; Su, Y.; John, J.V.; Chen, S.; Weihs, S.; Reid, S.P.; Satrapi, J.-L.; Carlson, M.A.; et al. Ultra-Absorptive Nanofiber Swabs for Improved Collection and Test Sensitivity of SARS-CoV-2 and other Biological Specimens. Nano Lett. 2021, 21, 1508–1516. [Google Scholar] [CrossRef] [PubMed]
  43. Adabi, M.; Esnaashari, S.S.; Adabi, M. An Electrochemical Immunosensor Based on Electrospun Carbon Nanofiber Mat Decorated with Gold Nanoparticles and Carbon Nanotubes for the Detection of Breast Cancer. J. Porous Mater. 2021, 28, 415–421. [Google Scholar] [CrossRef]
  44. Truskewycz, A.; Truong, V.K.; Ball, A.S.; Houshyar, S.; Nassar, N.; Yin, H.; Murdoch, B.J.; Cole, I. Fluorescent Magnesium Hydroxide Nanosheet Bandages with Tailored Properties for Biocompatible Antimicrobial Wound Dressings and pH Monitoring. ACS Appl. Mater. Inter. 2021, 13, 27904–27919. [Google Scholar] [CrossRef] [PubMed]
  45. Chagas, P.A.M.; Schneider, R.; Santos, D.M.; Otuka, A.J.G.; Mendonca, C.R.; Correa, D.S. Bilayered Electrospun Members Composed of Poly(lactic-acid)/Natural Rubber: A Strategy Against Curcumin Photodegradation for Wound Dressing Application. React. Funct. Polym. 2021, 163, 104889–104899. [Google Scholar] [CrossRef]
  46. Atashgah, R.; Ghasemi, A.; Raoufi, M.; Abdollahifar, M.; Zanganeh, S.; Nejadnik, H.; Abdollahi, A.; Sharifi, S.; Lea, B.; Cuerva, M.; et al. Restoring Endogenous Repair Mechanisms to Heal Chronic Wounds with a Multi-Functional Wound Dressing. Mol. Pharm. 2021, 18, 3171–3180. [Google Scholar] [CrossRef]
  47. Song, Q.; Steuber, M.; Druzhinin, S.I.; Schönherr, H. Tailored Combinatorial Microcompartments through the Self-Organization of Microobjects: Assembly, Characterization, and Cell Studies. Angew. Chem. 2019, 131, 5300–5304. [Google Scholar] [CrossRef]
  48. Hillborg, H.; Tomczak, N.; Olàh, A.; Schönherr, H.; Vancso, J.G. Nanoscale Hydrophobic Recovery: A Chemical Force Microscopy Study of UV/Ozone—Treated Crosslinked Poly(dimethylsiloxane). Langmuir 2004, 20, 785–794. [Google Scholar] [CrossRef] [PubMed]
  49. Lemma, S.M.; Bossard, F.; Rinaudo, M. Preparation of Pure and Stable Chitosan Nanofibers by Electrospinning in the Presence of Poly(ethylene oxide). Int. J. Mol. Sci. 2016, 17, 1790–1805. [Google Scholar] [CrossRef] [PubMed] [Green Version]
  50. Goonoo, N.; Khanbabaee, B.; Steuber, M.; Bhaw-Luximon, A.; Jonas, U.; Pietsch, U.; Jhurry, D.; Schonherr, H. κ-Carrageenan Enhances the Biomineralization and Osteogenic Differentiation of Electrospun Polyhydroxybutyrate and Polyhydroxybutyrate Valerate Fibers. Biomacromolecules 2017, 18, 1563–1573. [Google Scholar] [CrossRef]
  51. Chen, S.; Xu, X.L.; Zhou, B.; Tian, J.; Luo, B.M.; Zhang, L.M. Acidic pH-Activated Gas-Generating Nanoparticles with Pullulan Decorating for Hepatoma-Targeted Ultrasound Imaging. ACS Appl. Mater. Interfaces 2019, 11, 22194–22205. [Google Scholar] [CrossRef]
  52. Rohindra, D.R.; Nand, A.V.; Khurma, J.R. Swelling Properties of Chitosan Hydrogels. South Pacific J. Nat. Appl. Sci. 2004, 22, 32–35. [Google Scholar] [CrossRef]
  53. Jin, J.; Song, M. Chitosan and Chitosan-PEO Blend Membranes Crosslinked by Genipin for Drug Release. J. Appl. Polym. Sci. 2006, 102, 436–444. [Google Scholar] [CrossRef]
  54. Mahardian, A. Biocompatible Hydrogel Film of Polyethylene Oxide-Polyethylene Glycol Dimetacrylate for Wound Dressing Application. IOP Conf. Ser.: Mater. Sci. Eng. 2018, 288, 012076. [Google Scholar]
  55. Mirzaei, E.; Sarkar, S.; Rezayat, S.M.; Faridi-Majidi, R. Herbal Extract Loaded Chitosan-Based Nanofibers as a Potential Wound-Dressing. J. Adv. Med. Sci. Appl. Technol. 2016, 2, 141–150. [Google Scholar] [CrossRef] [Green Version]
  56. Dupont, S.J.; Cates, R.S.; Stroot, P.G.; Toomey, R. Swelling-Induced Instabilities in Microscale, Surface-Confined Poly(N-isopropylacryamide) Hydrogels. Soft Matter 2010, 6, 3876–3882. [Google Scholar] [CrossRef]
  57. Pakravan, M.; Heuzey, M.C.; Ajji, A. A Fundamental Study of Chitosan/PEO Electrospinning. Polymer 2011, 52, 4813–4824. [Google Scholar] [CrossRef]
  58. Otero, T.F.; Martinez, J.G. Structural and Biomimetic Chemical Kinetics: Kinetic Magnitudes Include Structural Information. Adv. Funct. Mater. 2013, 23, 404–416. [Google Scholar] [CrossRef]
  59. Tzafriri, A.R. Michaelis-Menten Kinetics at High Enzyme Concentrations. Bull. Math. Biol. 2003, 65, 1111–1129. [Google Scholar] [CrossRef]
  60. Ebrahimi, M.M.S.; Voss, Y.; Schönherr, H. Rapid Detection of Escherichia coli via Enzymatically Triggered Reactions in Self-Reporting Chitosan Hydrogels. ACS Appl. Mater. Interfaces 2015, 7, 20190–20199. [Google Scholar]
  61. Kasaai, M.R. A Review of Several Reported Procedures to Determine the Degree of N-Acetylation for Chitin and Chitosan Using Infrared Spectroscopy. Carbohydr. Polym. 2008, 71, 497–508. [Google Scholar]
Figure 1. Schematic of synthesis of PUAA.
Chemosensors 10 00299 g001
Figure 2. Dimerization of the indoxyl derivative from hydrolysis of X-Gluc to yield the blue indigo reporter dye derivative.
Chemosensors 10 00299 g002
Figure 3. (a,b) Top view SEM images of the micro-cuboid structured PUAA-ADH films obtained with a square shaped mold of (a) 40 µm size and of (b) 100 µm size and (c,d) SEM images of CS/PEO nanofibers produced using (c) 20 µL/min, 20 kV & 15 cm and (d) 20 µL/min, 25 kV & 15 cm.
Chemosensors 10 00299 g003
Figure 4. Swelling ratio of (a) PUAA hydrogel films (a flat bulk unstructured hydrogel film was used as the control) and (b) CS/PEO based hydrogels and nanofibers.
Chemosensors 10 00299 g004
Figure 5. ATR-FTIR spectra of (a) PUAA-ADH hydrogel films (b) CS/PEO hydrogels and (c) CS/PEO NFs.
Chemosensors 10 00299 g005
Figure 6. Kinetics of the reaction of X-Gluc grafted PUAA-ADH with ß-GUS followed at a wavelength of 615 nm, (a) varying the substrate concentrations (using 2 mg, 4 mg, 8 mg of the 40 µm cuboid hydrogel films, 50 nM ß-GUS); (b) varying the β-GUS concentration (25 nM, 35 nM, 50 nM and 100 nM for a 40 µm cuboid hydrogel film (error bars: standard error of the mean, n = 3).
Chemosensors 10 00299 g006
Figure 7. Kinetics of the reaction of X-Gluc grafted PUAA-ADH with ß-GUS followed at a wavelength of 615 nm, (a) varying the surface area of the films (using 8 mg of sample with 40 µm cuboids, 100 µm cuboids and a bulk non-structured film as the control); (b) Linearly fitted graph (forced through the origin) between initial apparent reaction rate and surface area of PUAA-ADH_X-Gluc hydrogel films.
Chemosensors 10 00299 g007
Figure 8. Enzyme reaction kinetics for varied amounts of (a) CS/PEO NFs, (b) CS/PEO HGs and (c) comparison of reaction kinetics for 2 mg samples.
Chemosensors 10 00299 g008
Figure 9. Kinetics recorded as absorbance at λmax = 615 nm for the β-glucuronidase sensing using (a) NFs and (c) hydrogel and estimated initial apparent rate of reaction for the first minutes from linear least-squares fit for (b) NFs and (d) hydrogel (error bars: standard error of mean for n = 2, R2 = 0.969 for NFs and 0.940 for CS/PEO HG).
Chemosensors 10 00299 g009
Figure 10. The limit of detection (LOD) for β-glucuronidase sensing CS/PEO NFs (a) and CS/PEO HG’s (b) and the limit of quantification (LOQ) for CS/PEO NFs (c) and CS/PEO HG’s (d).
Chemosensors 10 00299 g010
Figure 11. (a) Initial apparent rates of reaction plotted against the initial concentrations of the enzyme for PUAA MS hydrogel films (error bars: standard error mean, n = 3) (b) LOD for β-GUS enzyme for different observation times using 40 µm hydrogel films.
Chemosensors 10 00299 g011
Figure 12. Visual detection of E. coli in suspension (2.5 × 10⁸ CFU/mL, and 2.5 × 10⁷ CFU/mL) after incubation at 24 °C for 20 h. Photographs of the following samples in triplicates (vertical arranged wells are identical) are displayed: (a) no hydrogel (b) PUAA-ADH_X-Gluc films, (c) PUAA-ADH films. All samples were exposed to (A) LB, (B) E. coli (2.5 ×10⁸ CFU/mL) and (C) E. coli (2.5 × 10⁷ CFU/mL), respectively.
Chemosensors 10 00299 g012
Figure 13. Photographs taken after 24 h for: (a) X-Gluc modified CS/PEO NFs in E. coli (OD600 = 0.5, 2.36 × 10⁷ CFU/mL) (b) X-Gluc modified CS/PEO NFs in E. coli cultures (2.36 × 10⁶ CFU/mL), (c) unmodified CS/PEO NFs in E. coli cultures (d) pure LB, (e) E. coli cultures in LB, (f) unmodified CS/PEO NFs in LB medium and (g) modified CS/PEO NFs in LB (horizontal arranged wells are identical).
Chemosensors 10 00299 g013
Publisher’s Note: MDPI stays neutral with regard to jurisdictional claims in published maps and institutional affiliations.

