Article

The Impact of the Functional Layer Composition of Glucose Test-Strips on the Stability of Electrochemical Response

by
Ekaterina V. Zolotukhina
1,*,†,
Ekaterina V. Gerasimova
1,
Vladislav V. Sorokin
1,
Maria G. Levchenko
1,
Alisa S. Freiman
1 and
Yuliya E. Silina
2,*,†
1
Institute of Problems of Chemical Physics of Russian Academy of Sciences, 142432 Chernogolovka, Russia
2
Institute of Biochemistry, University of Saarland, Campus B 2.2, 66123 Saarbrücken, Germany
*
Authors to whom correspondence should be addressed.
These authors contributed equally to this work.
Chemosensors 2022, 10(8), 298; https://doi.org/10.3390/chemosensors10080298
Submission received: 13 June 2022 / Revised: 11 July 2022 / Accepted: 27 July 2022 / Published: 30 July 2022
(This article belongs to the Section (Bio)chemical Sensing)

Abstract

:
Herein, the impact of the chemical stability of RedOx mediator ferricyanide, K3[Fe(CN)6] (FC), a type of buffer solution used for bioreceptor preparation, gel composition (carboxymethylcellulose, CMC, Aerosile, AS, and alginate, ALG) on the long term stability of glucose test-strips and their analytical performance was examined. By simple addition of ALG to the functional gel aiming to improve its viscosity, we managed to enhance the sensitivity of conventional CMC-containing amperometric glucose test-strips from 3.3 µA/mM to 3.9 µA/mM and extend their shelf life from 8 months to 1.7 years. Moreover, during the course of investigations, it was revealed that the activity of enzyme in dependence with the used buffer did not linearly correlate with its activity in a dried functional layer, and the entire long-term electrochemical signal of glucose test-strips was determined by RedOx mediator FC chemical stability. The most stable and sensitive test-strips were obtained by the screen-printing approach from a gel containing 24 mg/mL GOx prepared in citrate buffer with pH 6, 200 mg/mL of FC and 10 mg/mL of CMC supplemented with 25 mg/mL of ALG.

1. Introduction

A wide spectrum of amperometric glucose biosensors with different designs and analytical merit was introduced during the last three decades [1,2,3]. However, most of them are very complex in design and may contain from 3 to 10 functional compounds [4]. Taking into account different solubility of individual active substances used for formation of sensing layers, their different mixing ratio and concentrations, it is highly unlikely that all of these glucose biosensors can be standardized and commercialized in the future. Moreover, the use of nanomaterials (electrocatalytic layer) of various nature produced by numerous and complex approaches to retain functional sensing layers on the electrode surface (viz. encapsulation in porous templates, electrochemical immobilization, drop coating, layer by layer, etc.) [5,6,7,8] only complicates the issue. Thus, nano-effects are hard to control and, therefore, glucose biosensors based on these materials are not present on the market. In fact, only biosensors and glucose test-strips of the first (1st) and second (2nd) generations are available today.
The 2nd generation of the test-strips based on stable RedOx couples of ferrocene and its derivatives, ferricyanide, quinones, transition metal complexes, phenothiazine, phenoxazine and synthetic azo dyes have been proposed [9,10,11,12,13]. Apart from enhanced electron transfer exchange, the requirements for RedOx mediators can be summarized as follows: low RedOx potential; high reversibility of the electron transfer; fast RedOx reaction with a cofactor in the presence of dissolved oxygen; steric compatibility with enzymatic RedOx center; and absence of the inhibitory impact on bioreceptors. The listed requirements affect not only the direct functioning of glucose test-strips, but also costs, toxicity to humans, and environmental aspects of their production [14].
Another important functional component of the 2nd generation of glucose test-strips is a polymeric matrix used to enhance their physical and electrochemical properties [15]. The usage of gel matrices allows one to: (i) diminish the structural transformations during drying, (ii) achieve more uniform distribution of individual components in the functional sensing layer, (iii) enhance electrochemical response and (iv) affect the long term stability of glucose test-strips. As examples of successful polymeric matrix implementation, silica gel, polyvinylimidazole, polyaniline, carboxymethylcellulose, poly-L-lysine, etc. [16,17,18,19,20,21,22,23] can be mentioned. Recently, a biocompatible alginate matrix was also employed in the development of miniaturized amperometric electrodes [24].
However, regardless of the matrix type, the long term stability of the functional layer during shelf time of electrodes is an actual issue discussed in many works [19,21,25,26]. A direct comparison of the results for various gel matrices to find the best composition of the functional sensing layer which could guarantee its stability appears to be almost impossible due to different test conditions and used buffer systems. We believe this is because the current trend in glucose biosensors development relies on the principle “if it works it is good and novel electrode designs are very welcome”. In this pursuit of glucose biosensor research, the question related to optimization of already existing and integrated production strategies remains unsolved. In contrast to research laboratories in academia, industrial laboratories dealing with biosensors and glucose test-strips often do not need yet another biosensor design. However, by looking more closely at the composition and design of conventional biosensors and through analysis, comparison and systematization of basic parameters affecting the response of existing commercialized test-strips, it would be much simpler to achieve their advanced analytical characteristics (viz. sensitivity) than to develop and validate new ones.
Hitherto, to the best of our knowledge, only a few attempts have been made to study the impact of external parameters (humidity, temperature) during the preparation route of conventional amperometric glucose biosensors and test-strips on their performance [27,28,29]. At the same time, insufficient storage stability and degradation of individual components in the functional sensing layer will affect the entire response of the electrodes. Taking into account the minimum required storage time of 1–1.5 years [30] for amperometric test-strips under ambient conditions, the analysis of both factors, viz. (i) electrochemical response stability during this period and (ii) an impact of layer composition on storage time, appears to be important.
Herein, we show how, by maintaining the constant design and tuning the buffer type and nature of the gel filler agent, that it is possible to alter the analytical performance, stability and shelf life of 2nd generation amperometric glucose test-strips.

2. Materials and Methods

Glucose oxidase (GOx) from Aspergillus niger (EC 1.1.3.4), ≥200 KU, Sorachim SA, Swiss, carboxymethyl cellulose sodium salt (CMC), extra pure (LobaChemie Pvt. Ltd., Mumbai, India), alginic acid sodium salt (ALG) (powder, Sigma Aldrich, Burlington, MA, USA), Aerosil 380 (AS) (MCM Master, Russia), K3[Fe(CN)6], ≥99% (Acros organics, Moscow, Russia), 1,10-Phenanthroline-5,6-dione, 98% (Acros organics, St. Petersburg, Russia) were used for preparation of the functional gel layer. KCl, >98%, NaCl, >98%, KH2PO4, >98%, citric acid, >98%, NaOH, >98%, CaCl2, NaHCO3, >96%, and acetic acid, >98% used for buffer solution preparation were received from Chimmed (Moscow, Russia). D-Glucose, extra pure (DiaM, Moscow, Russia) was employed for preparation of test solutions in modeled synthetic plasma.
The synthetic plasma solution containing 0.18 g/L KH2PO4, 1.5 g/L NaHCO3, 0.25 g/L KCl, 5.65 g/L NaCl, 0.28 g/L CaCl2 was validated via titration with NaHCO3 to achieve pH 7.4 at 36 °C.
Two-electrode miniaturized systems printed on an inert polyethylene terephthalate polymer (screen-printed electrodes, SPE, ELTA Ltd., Zelenograd, Russia) with a graphite indicator (working) and counter electrodes (graphite paste Gwent C2130814D2, Sun Chemical, UK) were used for electrochemical experiments. The SPE dimensions are shown in Supplementary Materials Figure S1a.

2.1. Formation of the Functional Sensing Layer

Test-strips were produced by a screen-printing technique [19]. Briefly, 50–200 mg/mL of FC, 2–24 mg/mL of GOx solution in phosphate buffer and 10–20 mg/mL of CMC were mixed in different ratios in a mixer TR-300 (HT Machinery, Ota, Japan). In accordance with the declared specification, the activity of GOx in buffered solutions could be varied from 500 (for 2 mg/mL) to 6000 (for 24 mg/mL) Units/mL. The functional gel/paste was immobilized on the surface of SPE utilizing a stencil based on titanium foil with thicknesses of 25, 60 and 100 µm and an open area of 2.3 m × 4.2 m. The thickness of the formed functional layer dependent on the used stencil was measured on a PS50 Profilometer (NANOVEA, Ink., Irvine, CA, USA).
To be applied for screen-printing deposition, the viscosity of a gel should be high enough (i.e., about 1000 cps or more) to avoid the spreading effect. To achieve the required value and avoid bubble formation in highly concentrated CMC solutions, the gel composition was modified as follows: an aliquot of GOx dissolved in phosphate buffer was mixed with an aliquot of ferricyanide (FC). Afterwards, CMC with sodium alginate (ALG) or Aerosil 380 (AS) used as filler agents were preliminarily ground and mixed with the mixture of enzyme and FC. The functional sensing layers formed on SPE by screen printing were dried in a thermostat at 25 °C for 3 h. The obtained glucose test-strips were stored at room temperature in zip-lock bags. The viscosity of the formed gels was measured on a viscosimeter (SV-10A, A&D, Tokyo, Japan). The viscosity of conventional CMC/FC/GOx gels was 900 cps versus 5500 cps and 1100 cps found for CMC/FC/GOx/ALG and CMC/FC/GOx/AS, respectively. The typical view and dimensions of functional layers are presented in Figure S1b–d, ESI.
The same preparation procedure for gels was repeated in case of acetate and citrate buffer usage. The composition of buffers is summarized in Table S1, ESI.
We also examined how a capillary cap influences the preparation of test-strips. The experiments conducted for the test-strips with and without usage of capillary caps showed a negligible effect from their usage. Hence, to simplify the preparation stage of test-strips, the capillary caps were excluded from further experiments.

2.2. Thermal Stress-Test Applied to Study Electrochemical Stability of the Functional Layer during Storage of Glucose Test-Strips

To model “accelerated aging” for glucose test-strips, a specialized stress-test on a Binder cooling incubator (Binder KT53, Binder GmbH, Tuttlingen, Germany) was carried out. The experiment was performed in thermostatic conditions at 55 °C for 1 month (30 days). This approach allowed us to increase the rates of physical changes and chemical degradation within the functional sensing layer. The results of this test would help to predict the long-term stability of the conventional and modified glucose test-strips during their storage. Notably, in accordance with the Arrhenius equation (used for accelerated storage tests based on ISO 23640:2015 (in vitro diagnostic medical devices—evaluation of stability of in vitro diagnostic reagents) the storage of test-strips at 55 °C for 1 month corresponded to their storage at 20 °C for 24 months or 15 months at 25 °C.
To conduct this model experiment, freshly prepared test-strips were placed in a thermostat. Every 2 days, 3–5 strips from the same batch were tested, and their electrochemical response at 36 °C in 2, 5 and 30 mM glucose solutions dissolved in the synthetic plasma (pH 7.4) was evaluated.

2.3. Electrochemical Measurements

Electrochemical measurements were carried out on an Autolab PGSTAT 101 (Metrohm-Autolab, Utrecht, The Netherlands) in amperometric mode at the applied stationary voltage of 0.3 V. The analytical signal/current was recorded at 5 s after the start of measurements. All measurements were repeated at least in triplicate. For electrochemical tests, 5 µL of glucose solution was spotted onto SPE surface modified by functional sensing layer/gel, and the polarization procedure was started immediately.

2.4. UV-Vis Measurements

UV-visible measurements of FC-containing solutions were carried out on a spectrophotometer Lightwave II (Biochrom Ltd., Cambridge, UK) utilizing conventional spectroscopic quartz cuvettes (Hellma GmbH & Co. KG, Müllheim, Germany) with the optical length of 0.1 mm and 10 mm.

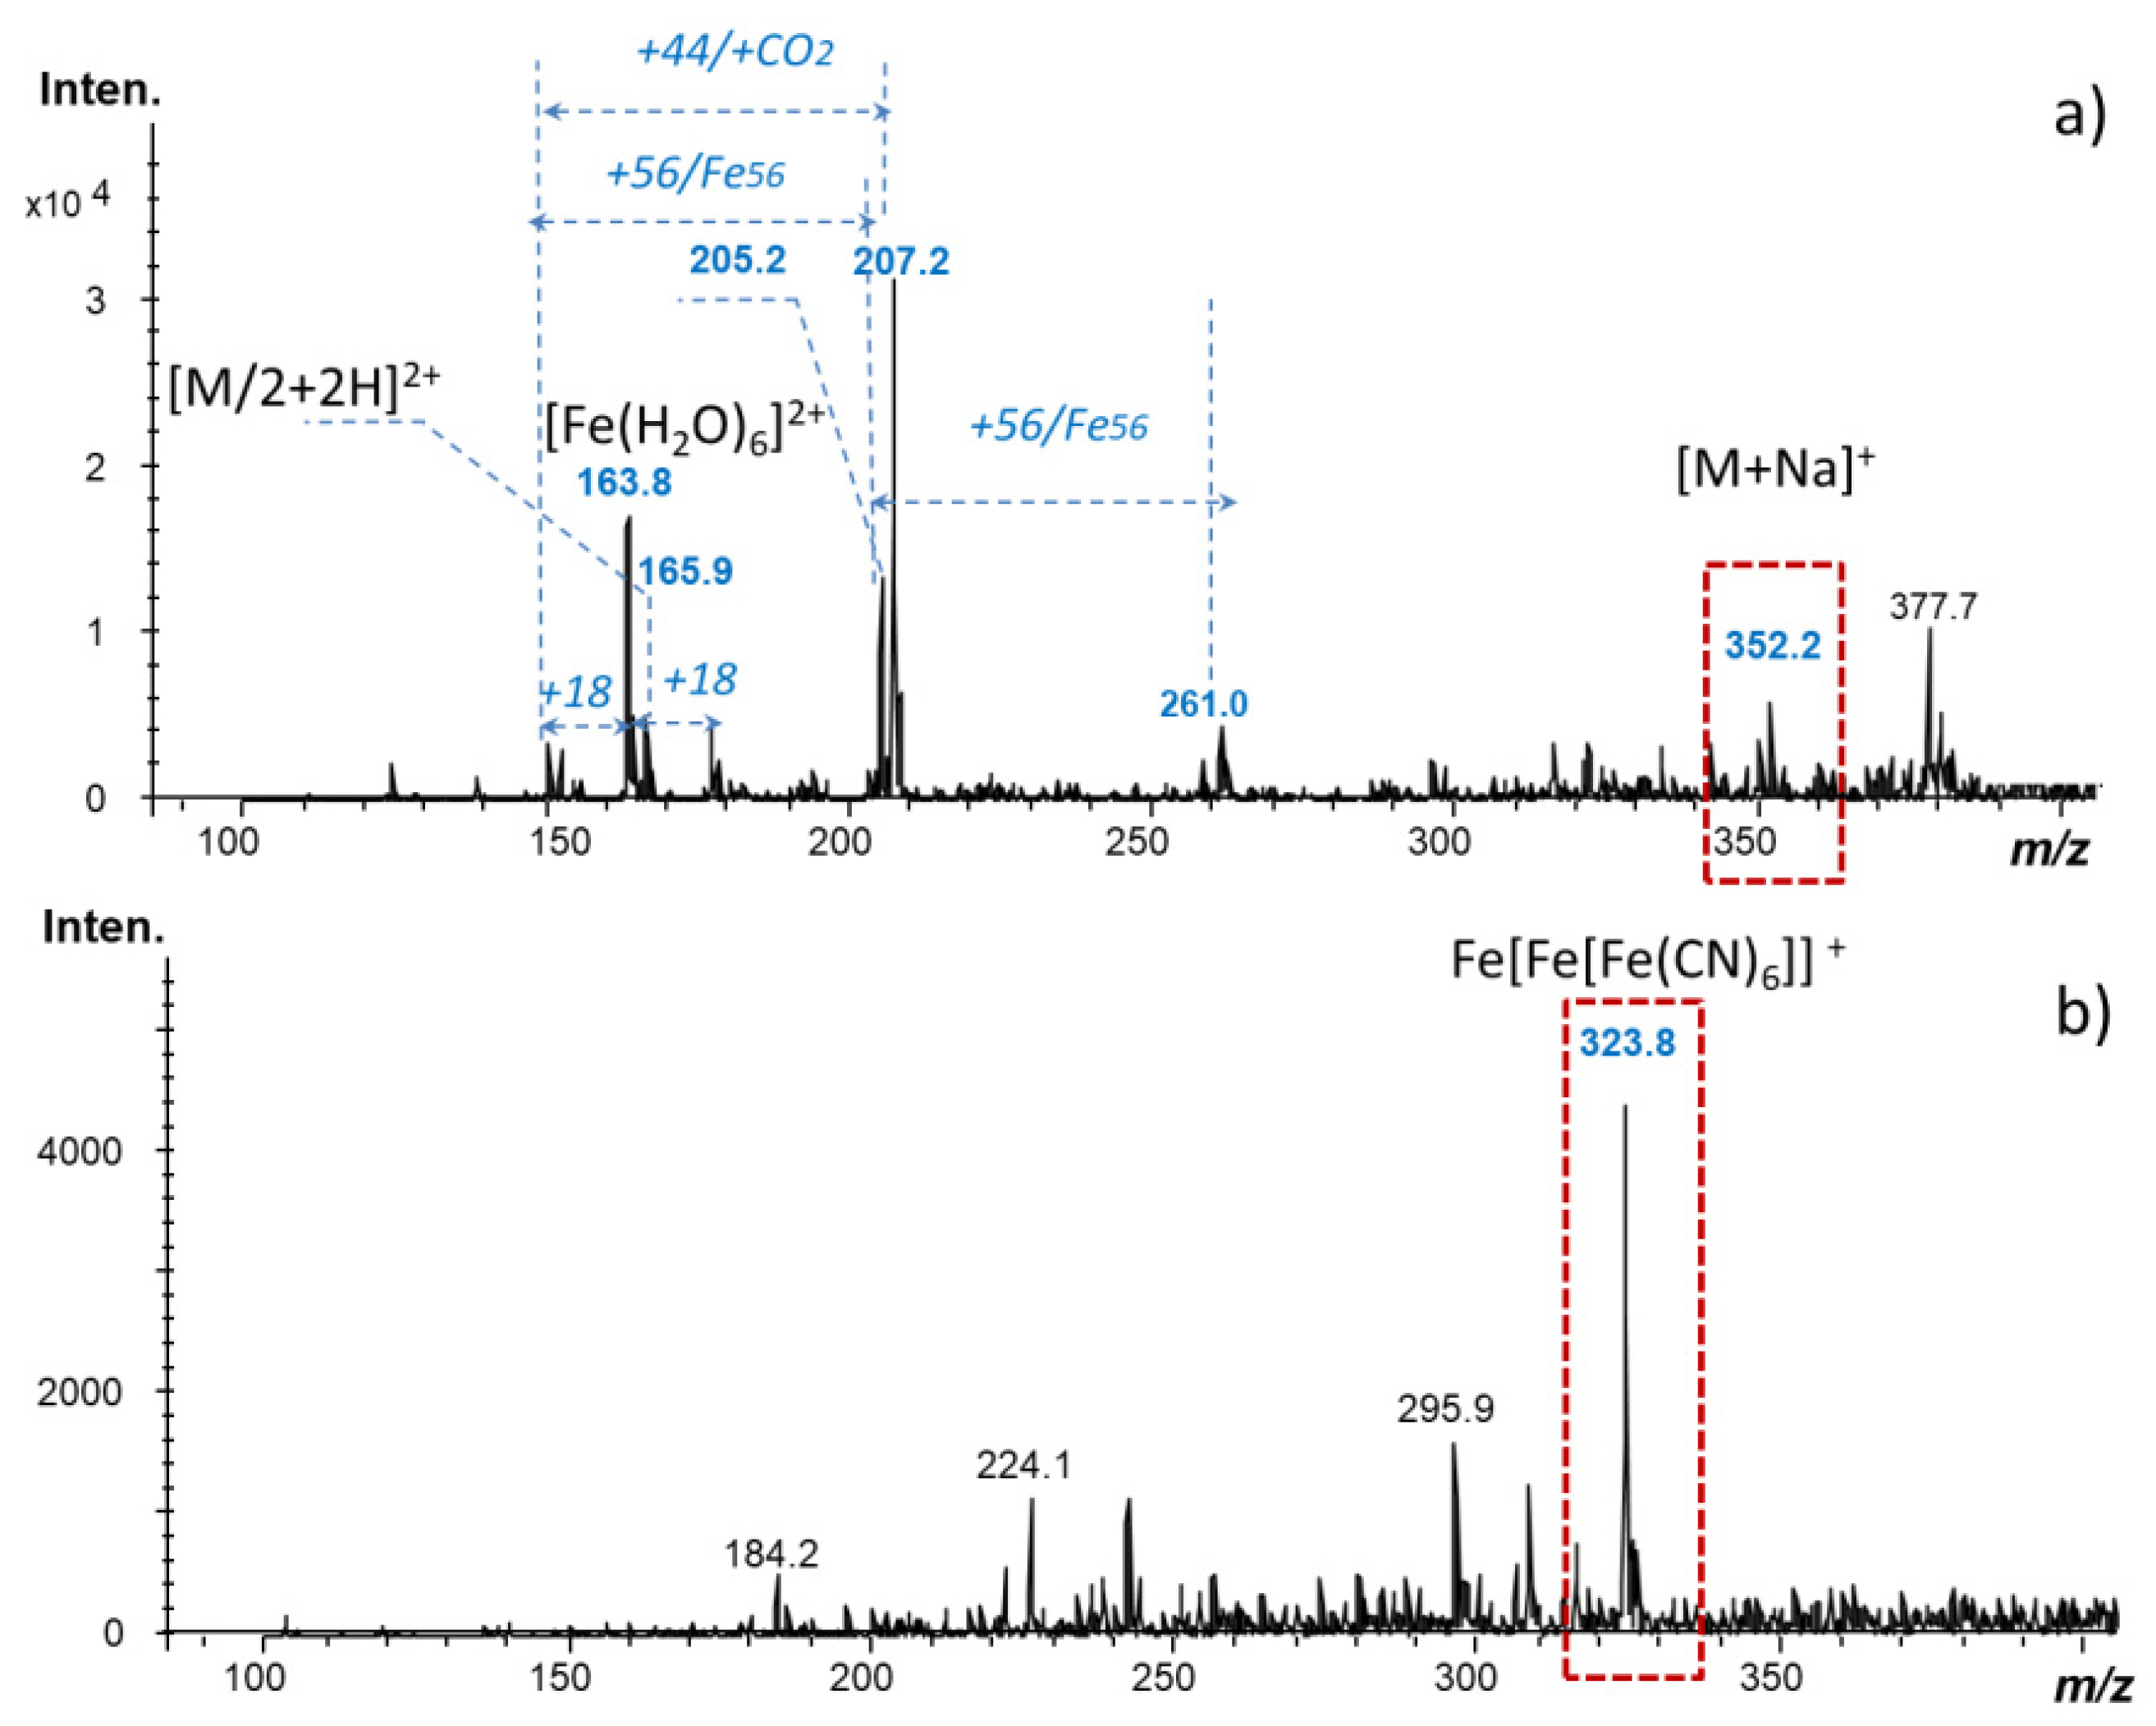
2.5. Laser Desorption Ionization Mass Spectrometry (LDI-MS)

LDI-MS studies from the surface of SPE modified by functional sensing gels were carried out on a Bruker Esquire 3000+ESI-ion trap MS (Bruker Daltonics, Bremen, Germany) equipped with atmospheric pressure AP-MALDI ion source and Nd: YAG solid-state laser (355 nm). Data acquisition was conducted by a Bruker esquire control utilizing 5.3 version of the software. To verify the layer homogeneity of the functional gels, total ion chromatograms (TICs) and mass spectra were recorded in positive detection mode in the range of m/z 100–1000. To compare the degree of homogeneity between the conventional gels and gels modified by filler agents (AS or ALG), full-scan TICs (all ions) were recorded from the surface of SPE covered by corresponding functional layers via screen printing approach. Laser was set in a spiral mode and laser power was maintained on the same level during the study regardless of the gel composition. TICs from SPEs covered by conventional and modified gels were recorded for 5 min to make a possible difference in their chemical profiles more pronounced. The appearance of spikes on TICs at certain time scales can refer to a high concentration of compounds of functional gel ionized at this point of the layer. Minimizing the amount of spikes on TICs as well as a decrease in the difference between maximal and minimal MS signal intensities obtained from the profile indicates improvements in layer homogeneity.

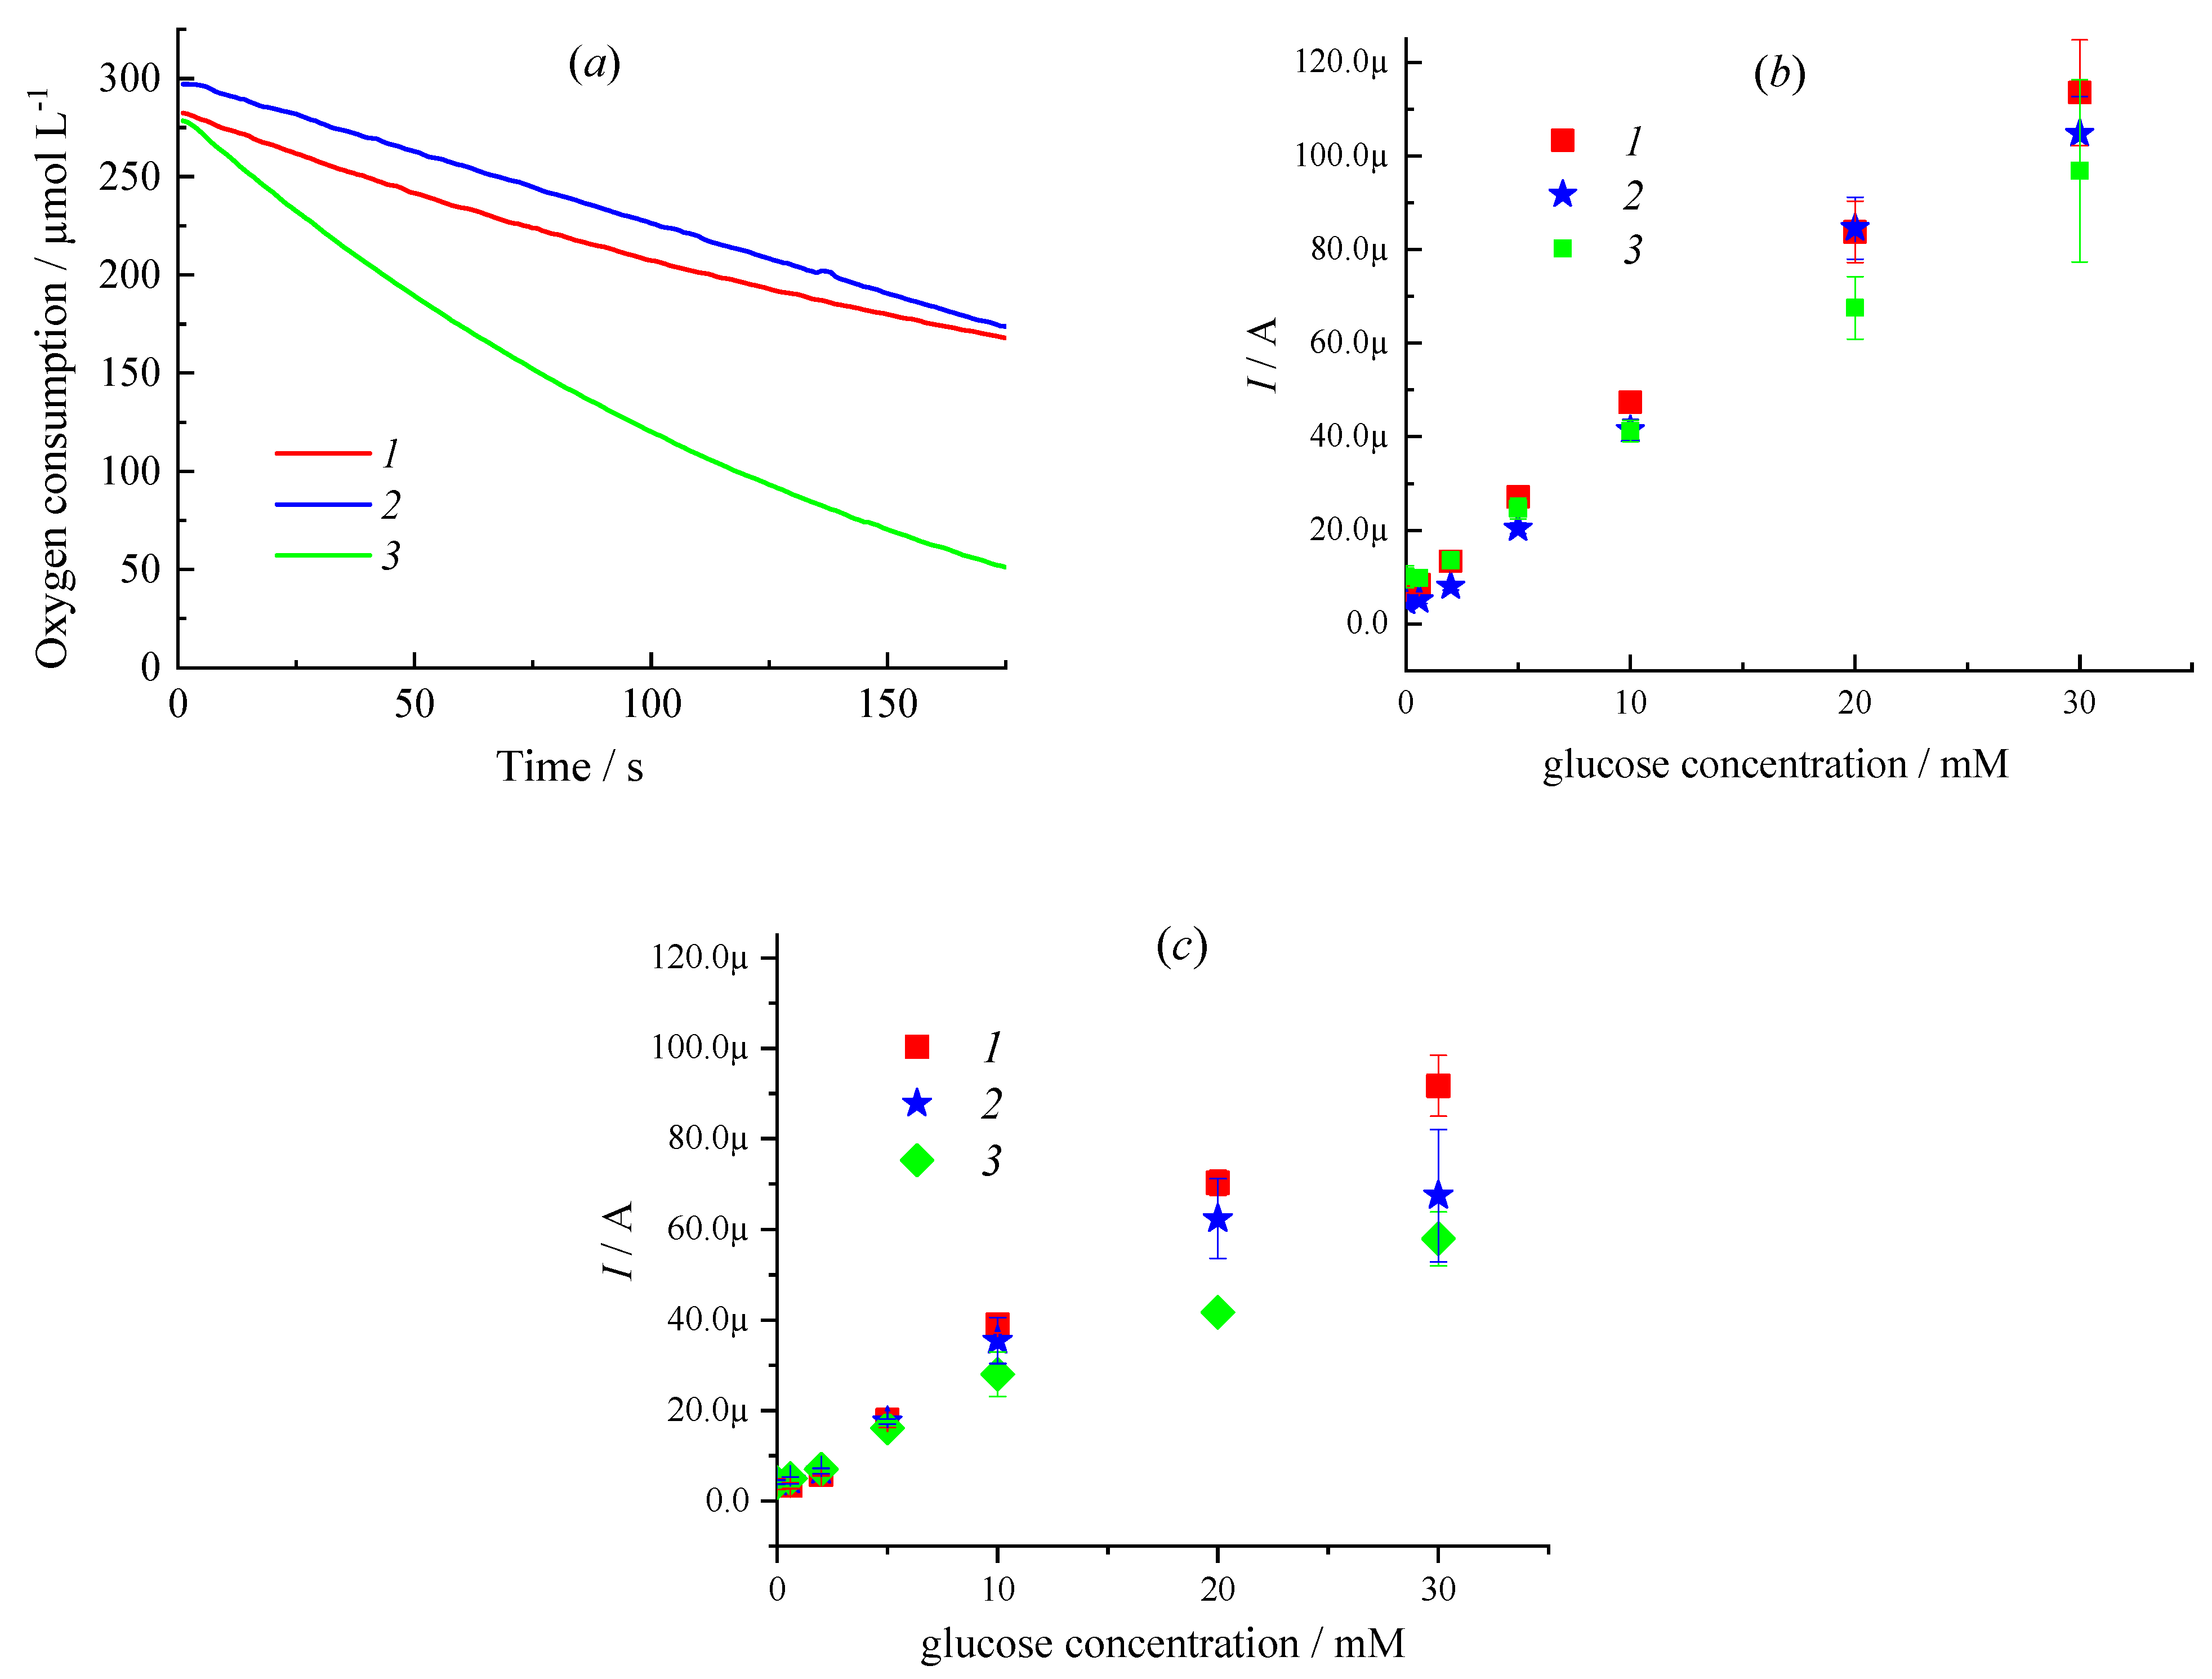
2.6. Oxygen Minisensor Studies

To verify the enzyme activity in different buffer systems, an OXR430 retractable needle-type fiber-optic oxygen minisensor (Pyro Science GmbH, Aachen, Germany) was used. The response of the optical minisensor was recorded in the oxygen consumption mode (µmol/L) based on the following sequences:
Glucose + GOx/FAD → GOx/FADH2 + Glucolactane
GOx/FADH2 + O2 → GOx/FAD + H2O2
The activity (units/mL, U/mL) of GOx in solutions was evaluated according to [31].

3. Results

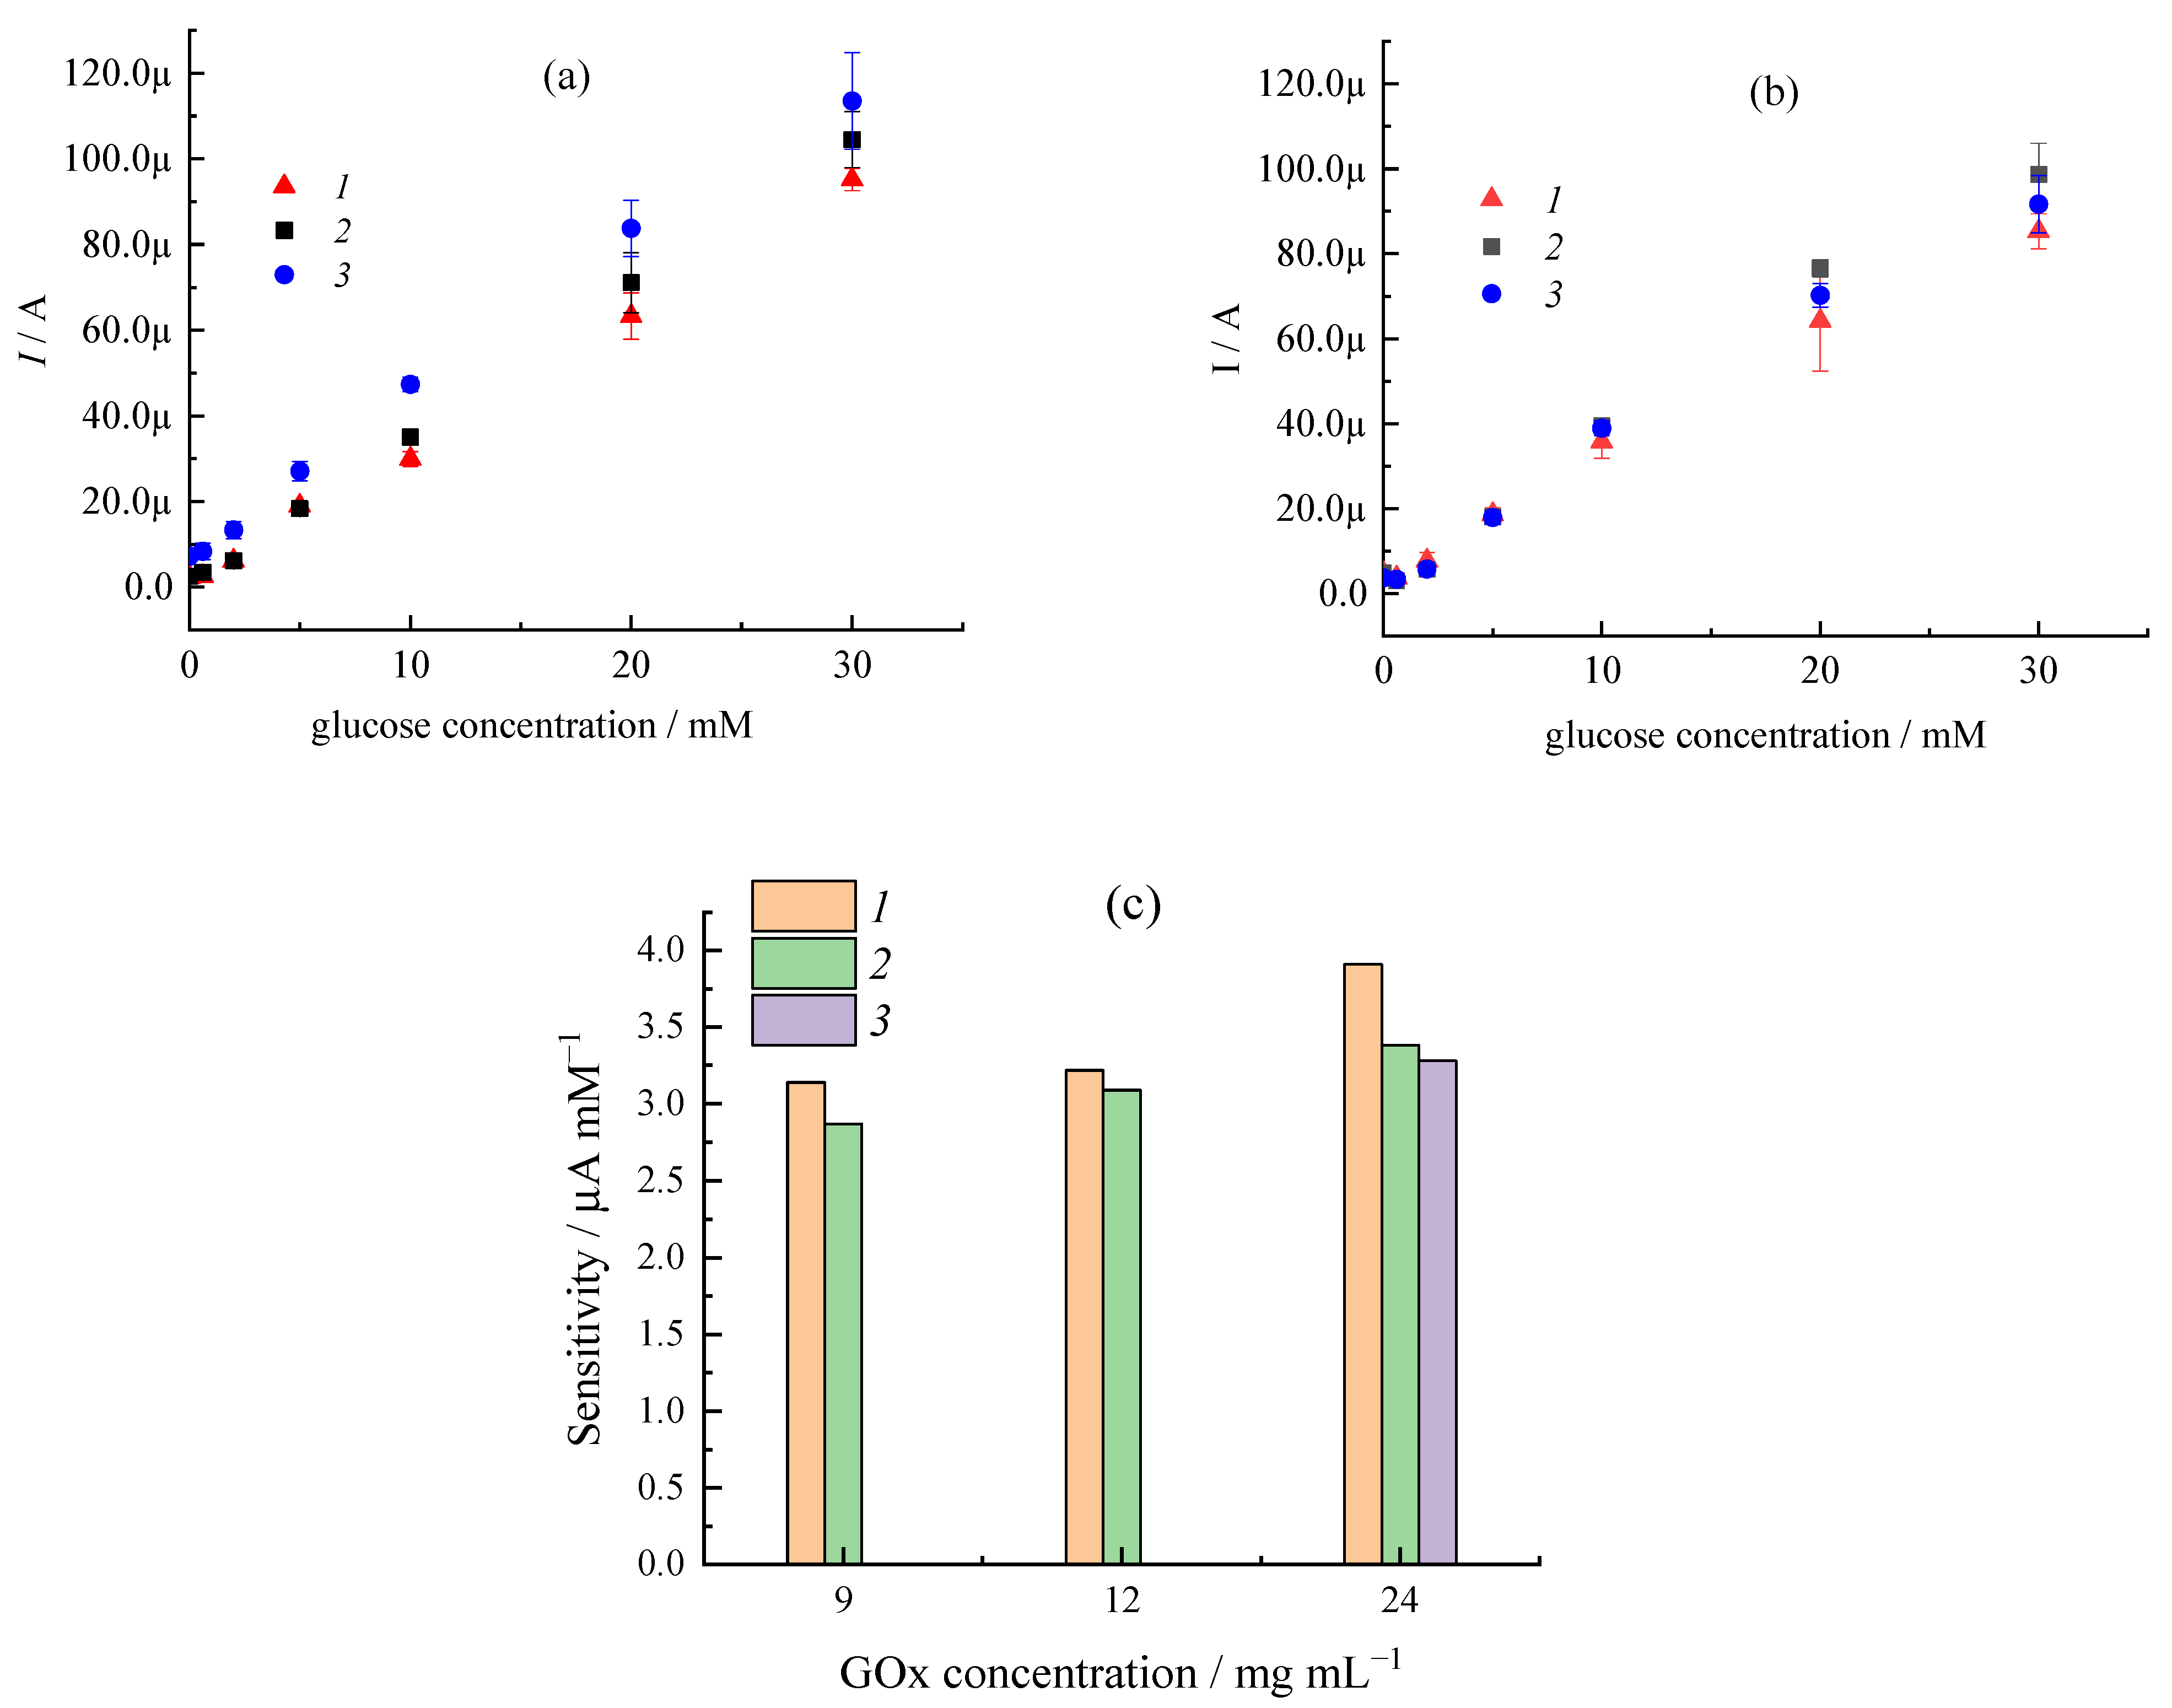
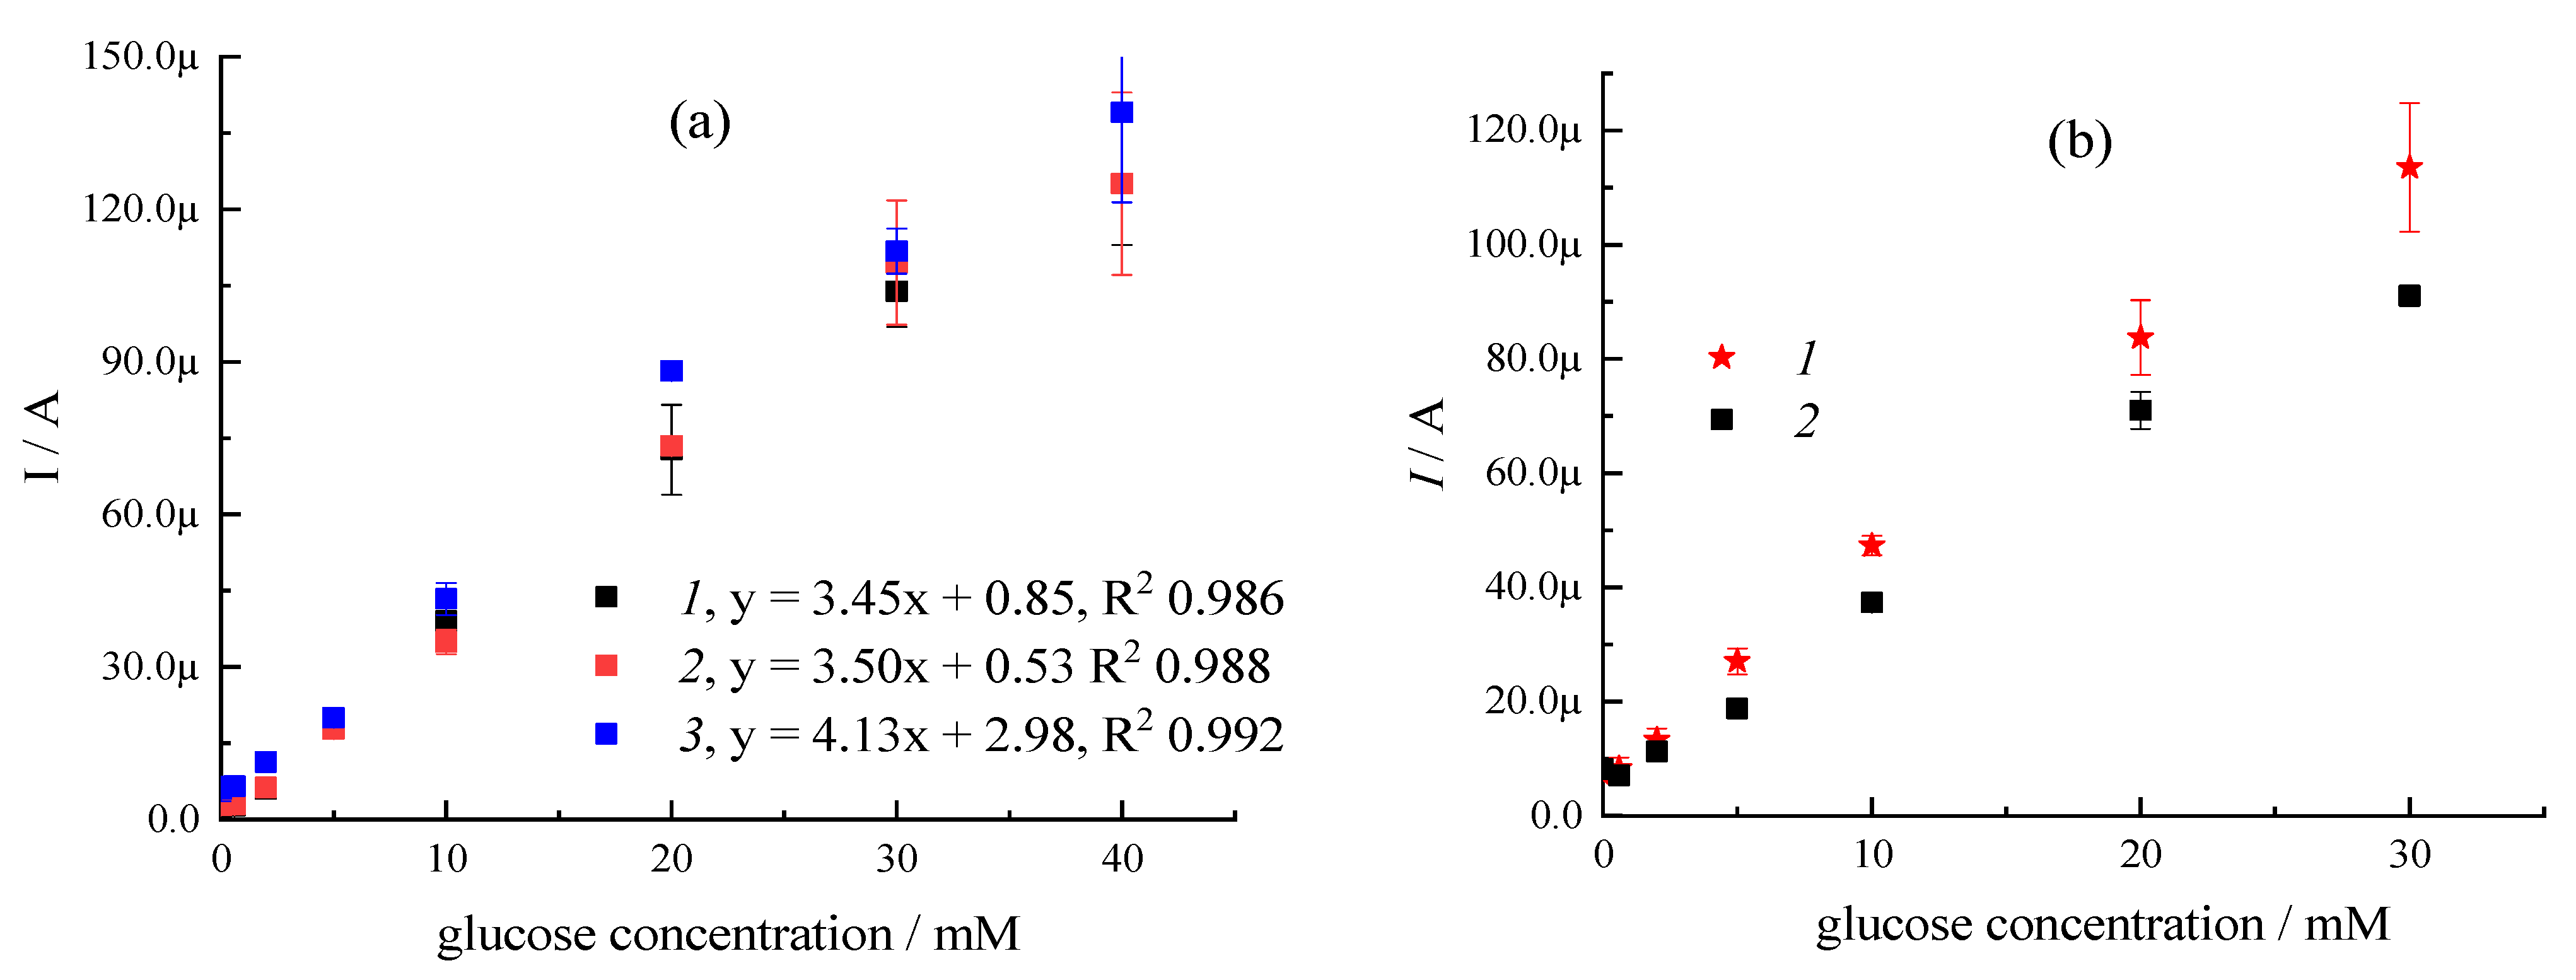
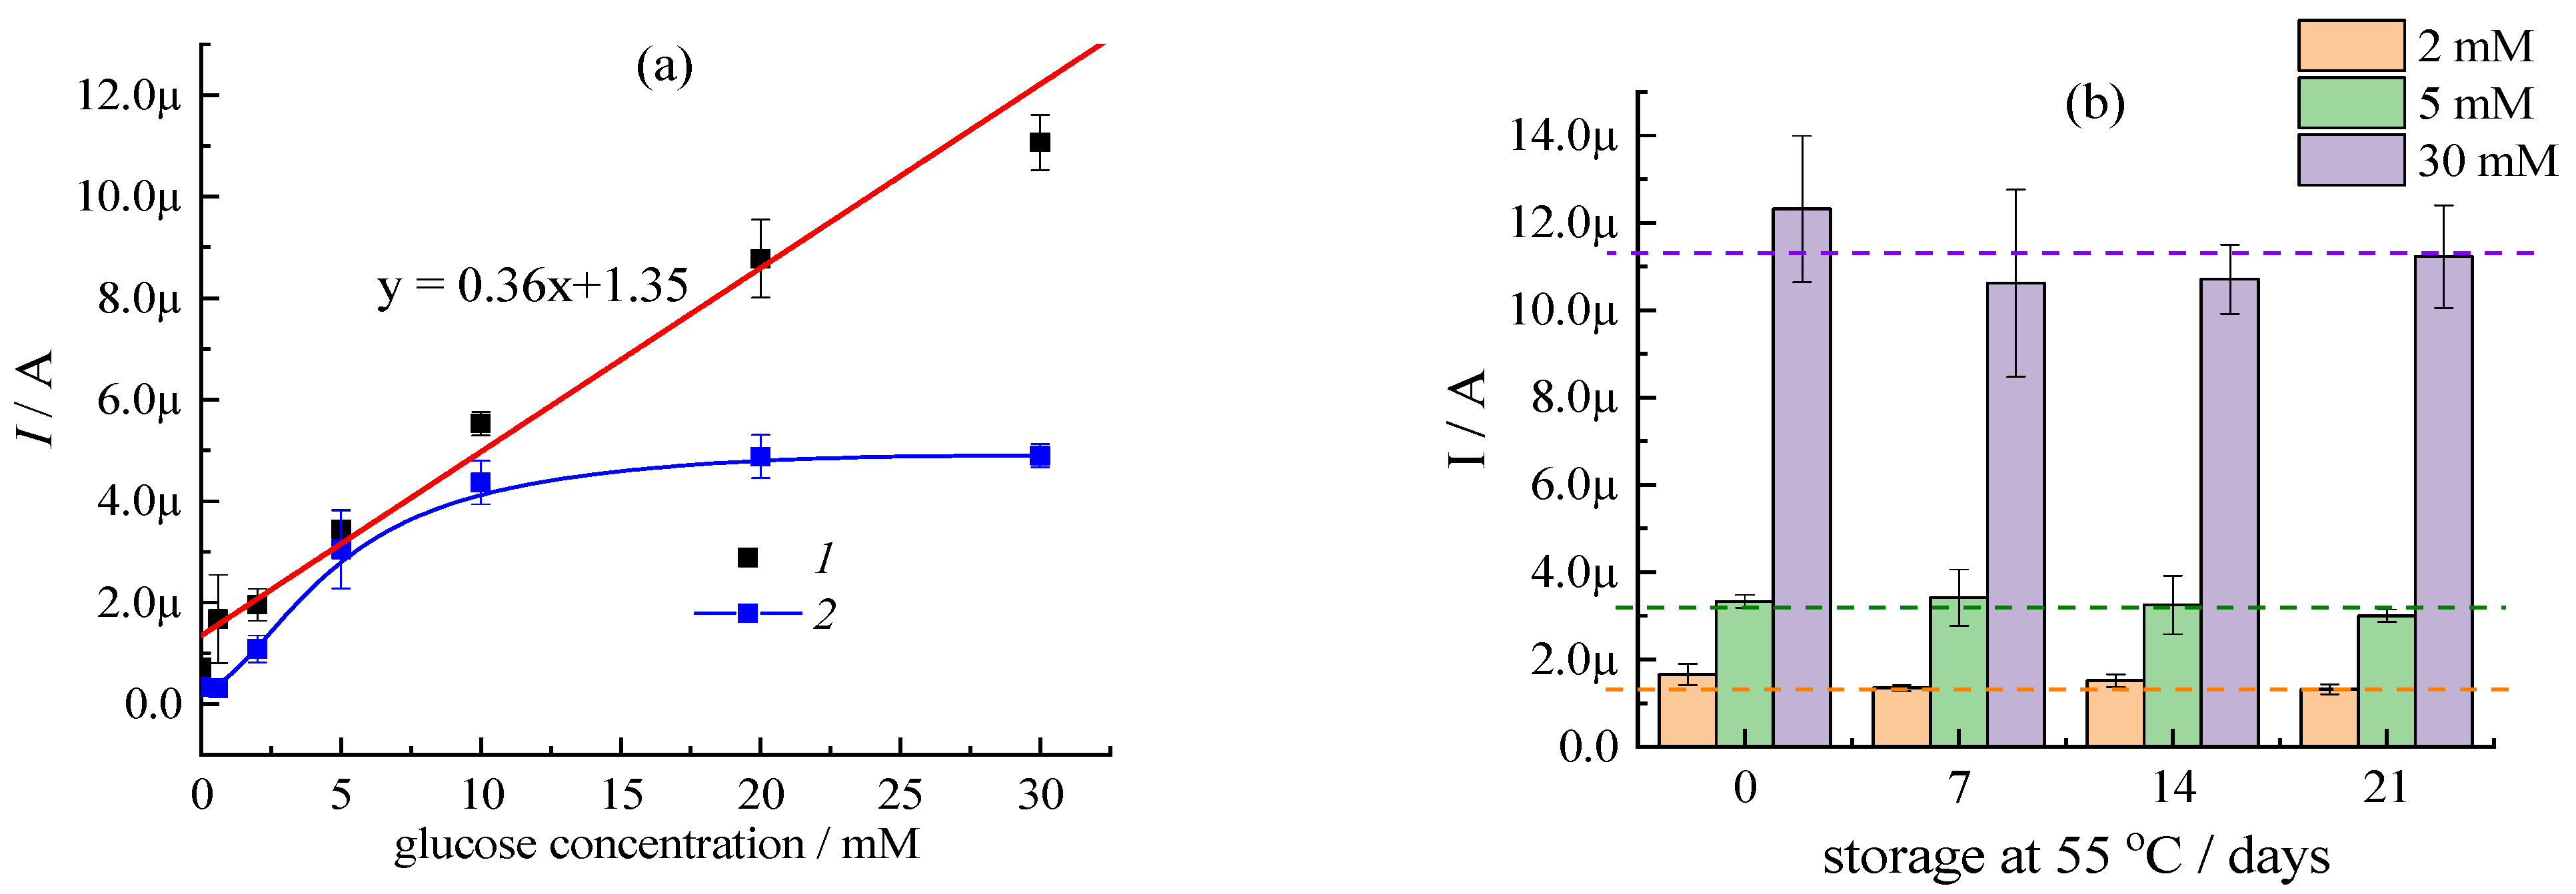
3.1. Tuning of Analytical Performance of Glucose Test-Strips by Type of Filler Agent at a Constant Ratio of Enzyme and Mediator

In the first set of experiments, the analytical performance of glucose tests-strips with conventional gel composition in dependence with GOx and FC amounts was compared. As expected, the increase in FC and GOx concentrations in the gel significantly affected the sensitivity and linear dynamic range (LDR) during glucose detection (Table 1). Thus, increasing the GOx concentration from 2 mg/mL to 24 mg/mL and FC content from 50 mg/mL to 200 mg/mL allowed us to extend the LDR at least two-fold. In addition, as a result of GOx and FC deficits at the level of glucose concentration between 20–40 mM, a high deviation from linearity was observed in several compositions of the functional layers (ESI, Figure S2). In particular, the low content of GOx and FC in the gel led to an S-type curve shape (see ESI, Figure S2c).
The addition of filler agents used to modify gel viscosity, i.e., ALG in the amount of 15–25 mg/mL or AS in the concentration of 50–75 mg/mL (see Section 2.1 for the details concerning gel preparation) also impacted LDR and glucose sensitivity (Table 1). Thus, the use of AS in the gel led to a decrease in LDR during glucose detection. In this case, no improvement in sensitivity of the test-strips was observed. At the same time, at a constant amount of ALG or AS, a variation between FC and GOx ratio allowed us to enhance the sensitivity of glucose test-strips and LDR. Moreover, at a constant ratio of FC and GOx (200:9), the addition of ALG to the gel only in the amount of 15–25 mg/mL led to positive alteration of LDR and enhancement of glucose sensitivity regardless of CMC content (see Table 1).
The optimal analytical characteristics of glucose test-strips were achieved with the following gels: 10 mg/mL CMC, 25 mg/mL ALG, 200 mg/mL FC, and 24 mg/mL GOx. The observed positive effect can be explained by impact of the filler agents on retained water molecules in the dried functional gel on the one side and improved distribution of the components in the layer on the other side. The impact of water retained in the enzyme can correlate with its biocatalytic activity and determine the environmental stability of the sensing layer [32,33]. The impact of ALG on the distribution of chemical compounds in the functional layer was verified by LDI-MS studies (Figure S3). The chemical profile of the gel obtained by addition of ALG (modified gel) was superior in terms of homogeneity as compared to the conventional CMC/FC/GOx analogue.
It should be mentioned that the electrochemical response of glucose test strips depends not only on the composition of the functional layer, but also on its geometric parameters, i.e., the thickness. At the same time, the thickness of the sensing layer depends on the foil thickness used for screen-printing (see Section 2.2). Figure S4 shows that the thickness of the sensing layer at the constant design and ratio of the used functional components significantly affects the sensitivity of glucose test-strips. Better sensitivity was recorded for the gel with the layer thickness of 8 ± 1 µm obtained by the use of 60 µm foil. In the case of thinner stencil usage (25 µm), the sensitivity to glucose was lower, more likely due to low content of reagents. Loss of sensitivity in thicker films (stencil 100 µm) could be explained by mass transfer limitations.
Next, at the film thickness of 8 ± 1 µm and constant ratio of CMC (10 mg/mL), ALG (25 mg/mL) or AS (50 mg/mL) and FC (200 mg/mL), the impact of GOx content in such modified gels on current responses was systemized. From Figure 1a,b, it is seen that in the presence of additional filler agents, the increase in GOx from 9 to 24 mg/mL did not significantly impact the LDR of glucose test-strips, while their sensitivity increased noticeably (about 20% from 9 to 24 mg/mL) with increased GOx concentration. Moreover, at the minimal GOx concentration and constant film thickness, the ratio of mediator and CMC by the use of ALG or AS supplement, it was possible to achieve a good analytical merit for the modified glucose test-strips (Figure 1c). An estimation of the accuracy of glucose detection by test-strips with 10CMC/25ALG/200FC/24GOx layer (as a case study) was conducted in accordance with ISO 15197:2013 protocol (“In vitro diagnostic test systems-Requirements for blood-glucose monitoring systems for self-testing in managing diabetes mellitus”). At low glucose concentrations (<5.5 mM), the standard deviation did not exceed the level of ±0.5 mM. At high glucose concentrations (≥5.5 mM), the variation coefficient was not above 11%. Hence, it may be concluded that the obtained glucose test-strips modified by ALG demonstrated improved accuracy.
It should be highlighted that the employment of ALG as a filler agent was superior as compared to AS. From the literature, it is known that AS keeps water mostly on the surface [34] via surface adsorption of water molecules from the gel. In contrast, ALG can absorb water on its functional groups in the entire volume due to the formation of multiple hydrogen bonds [35]. Therefore, the observed effect in the case of ALG vs. AS could only be explained in terms of different water content in the modified gels.

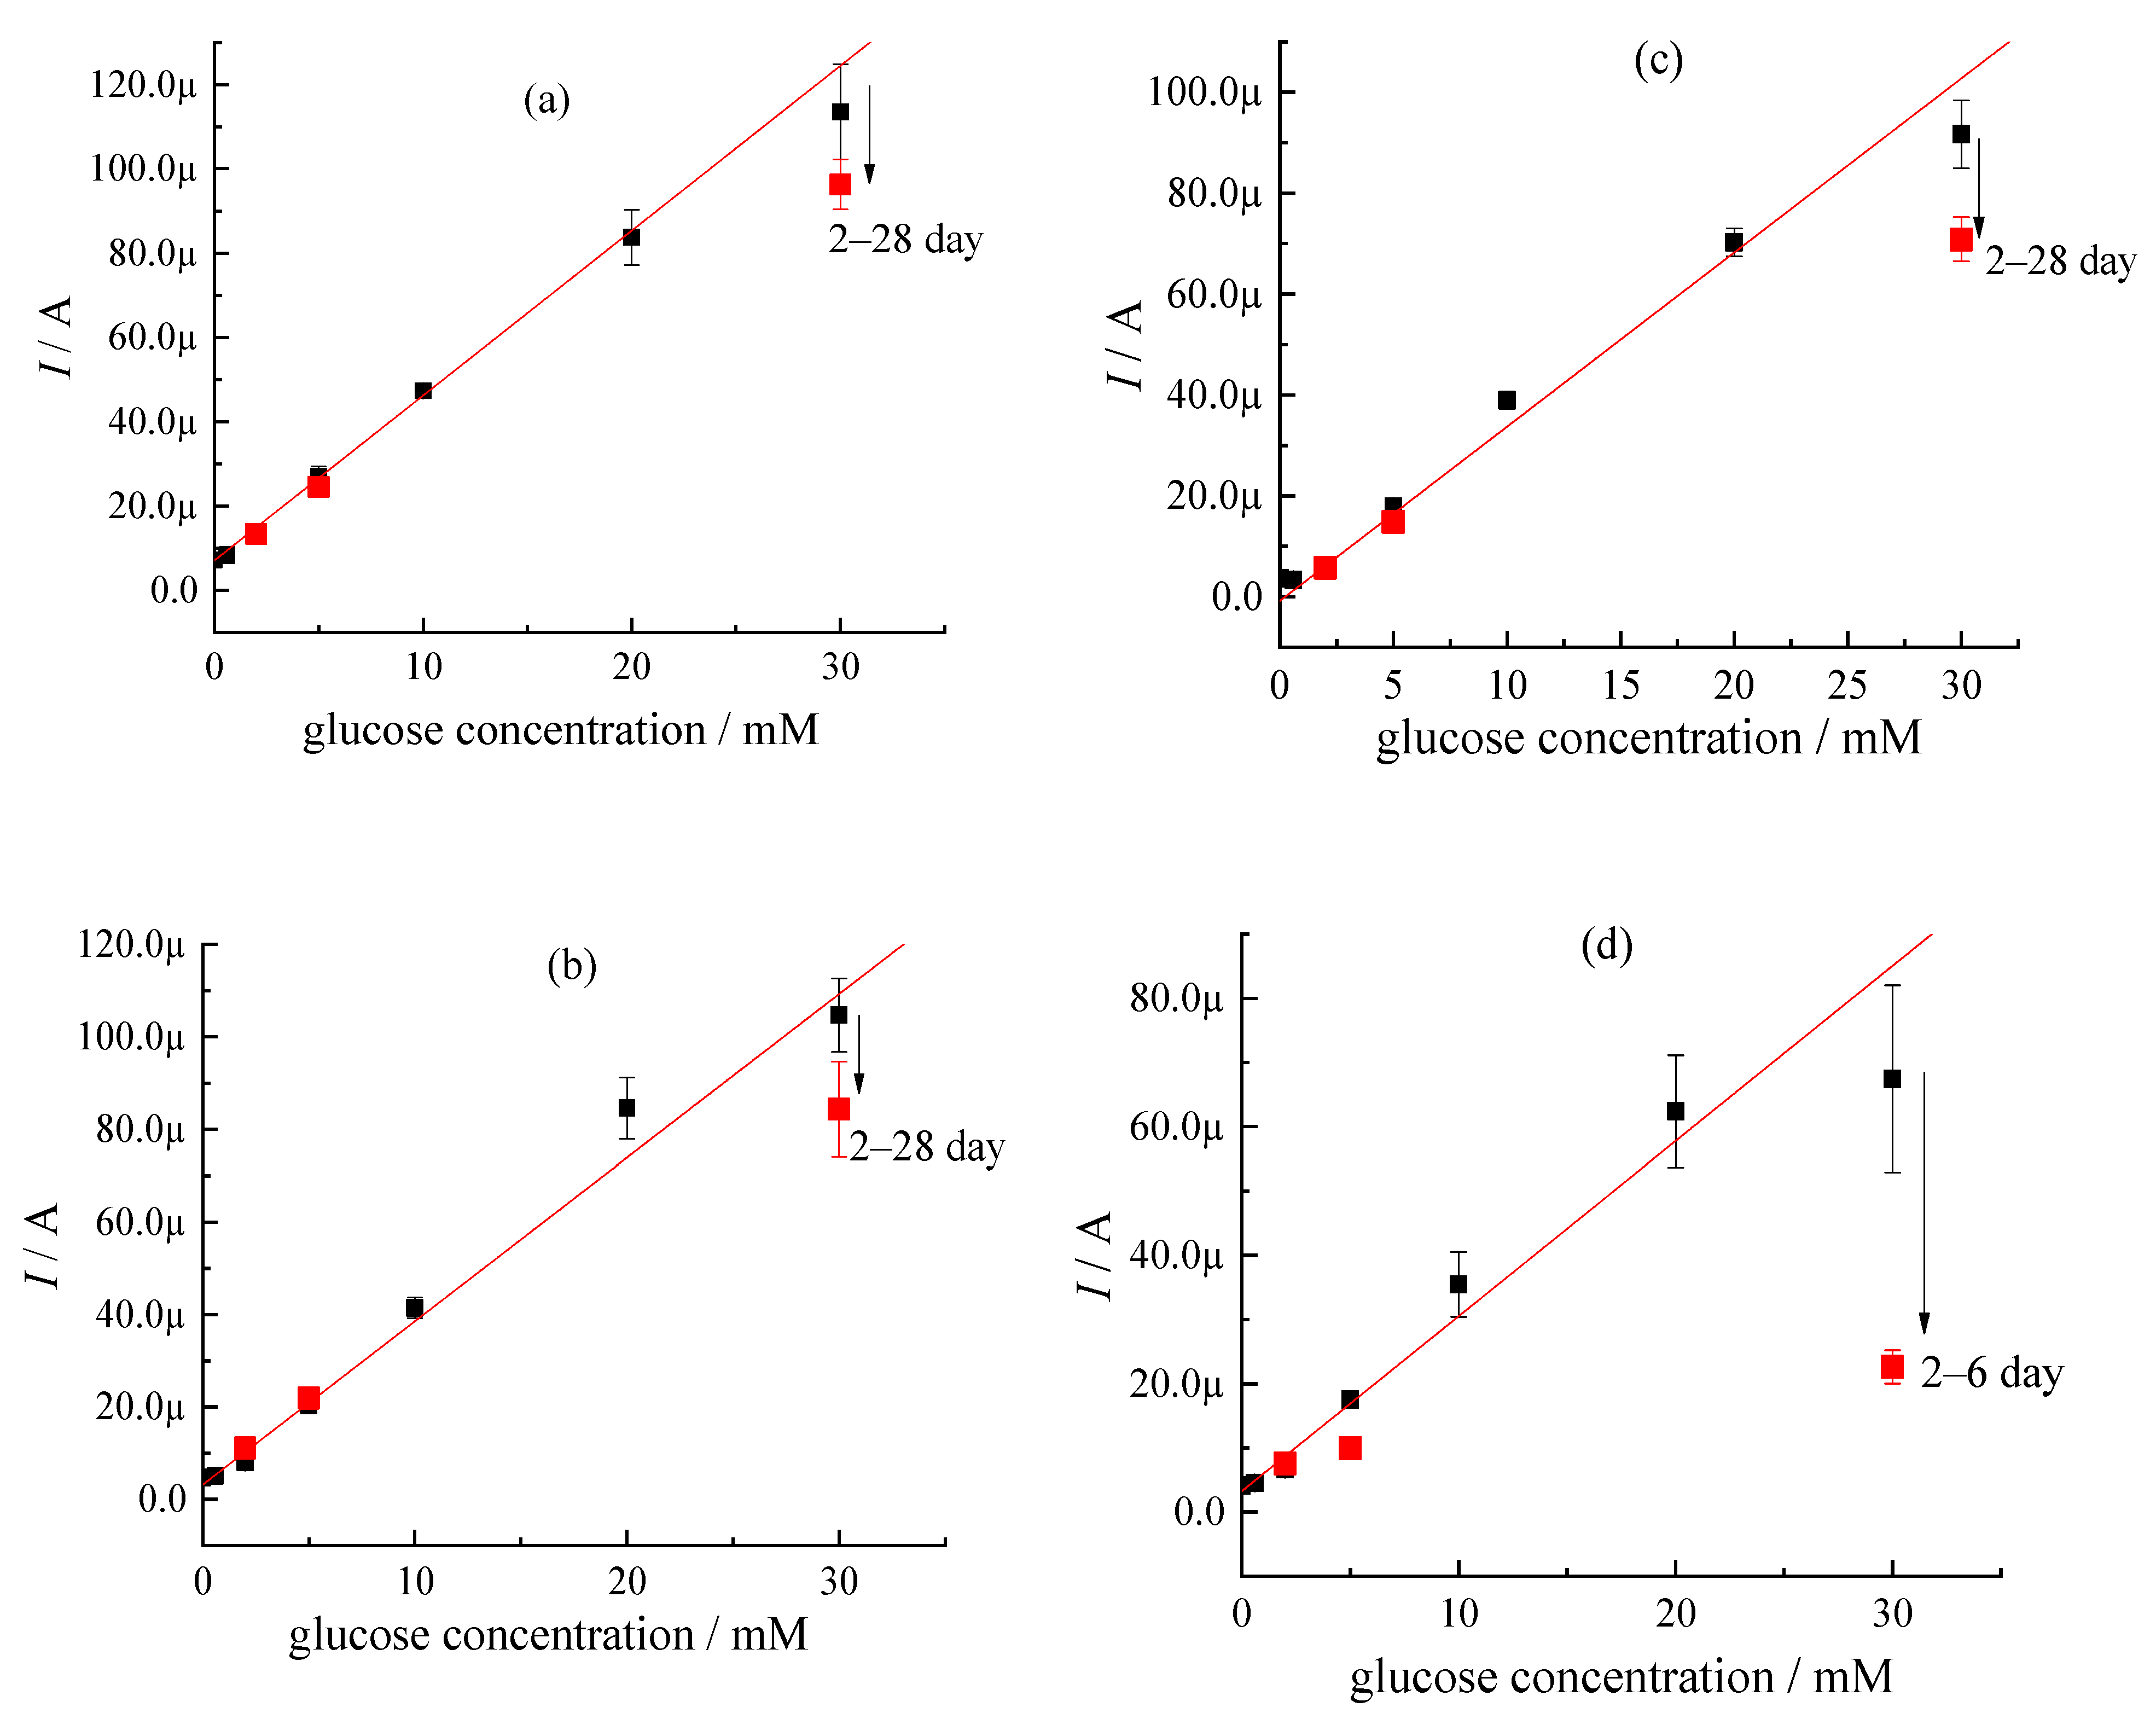
3.2. Impact of Buffer Type on Electrochemical Response of Amperometric Glucose Test-Strips and Their Storage Time

Interactions occurring in the multiple buffered solutions between components of sensing gel can significantly impact the efficiency of enzymatic reaction as well all electrochemical properties of the synthesized glucose test-strips. For example, GOx has been reported to be active across a wide range of pH (4–8.5) regardless of the used buffer solution [36]. The optimal pH supports the desirable active conformational state of GOx in solution. However, the activity of enzyme in solution and in the gel after drying of the functional layer (at the maintained constant pH in solution) can be very different. Thus, the activity of 250 KU of GOx in solution was the highest in acetate (13.25 ± 1.23 U/mL) as compared to phosphate (5.38 ± 0.98 U/mL) and citrate (6.8 ± 1.25 U/mL) buffers (Figure 2a). In contrast, the highest sensitivity to glucose test-strips with the dried sensing layer was obtained with the gel prepared in citrate buffer (Figure 2b,c).
The observed difference in enzyme activity could be explained in terms of different interaction rates between oxygen and reduced cofactor FAD/FADH2 of GOx in solution (see Reactions (1) and (2) and the same reactions in the presence of RedOx mediator in the gels [37]):
GOx/FADH2 + M(ox) → M(red) + GOx/FAD + 2H+
Electrode surface: M(red) → M(ox) + e
Thus, the rates of Reactions (1) and (2) (see Experimental part) are probably higher in solution than the rates of the same reactions in the gels if Reactions (3) and (4) take place.
The change of buffer solution can impact not only GOx activity but also influence different water retention properties in the modified sensing gels, i.e., different swelling of CMC in the presence of ALG or AS. Comparison of Figure 2b,c indicates that the gels with AS used as a filler agent were more sensitive to the change of buffer system.
At the high glucose concentration, the use of PPBI buffer with pH 7.4 and AcB with pH 5.5 led to a significant current decrease, especially for AS containing gels. The reason for this effect could be RedOx mediator (FC) degradation in the mixed multiple solution used for the sensing gel preparation (see the next section).
In the next step, the alteration of the entire electrochemical response in terms of both enzymatic-driven (GOx) and mediator-associated (FC) degradation of the test-strips prepared in the different buffer solutions was tested. After 1 day of stress-testing, the sensitivity of all glucose test-strips decreased independently of their composition. For the conventional test-strips without usage of any filler agents, i.e., 20CMC/200FC/24GOx, the degradation of sensitivity reached 25% after 10 days of the stress test at 55 °C (corresponding to approx. 240 days of storage at 20 °C) and reached 36% by the 30th day (≥700 days of storage) (Table 2). The reasons for such an extensive degradation were the multidirectional changes in the current responses occurring across the whole range of glucose concentrations; thus, at the low glucose concentration, the current increased, and at the high concentration, it decreased. In contrast, for the ALG-based test-strips containing 24 mg/mL GOx in CitB, pH 6.0 (10CMC/25ALG/200FC/24GOx), after the initial diminution of sensitivity of 20% within the consequent 28 days (corresponding to approx. 620 days of storage at 20 °C), the sensitivity was practically the same, i.e., 3.1 ± 0.2 µA/mM, with a current variation of only 7.7%. The diminution of GOx content in the layer or replacement of citrate buffer by PPBI at pH 7.4 did not change this tendency for the ALG-based gels. The reason for the deviation from linearity seen at the high glucose concentration for the ALG-containing gels was the diminution of current response (Figure 3a,b). At the same time, the degree of degradation in the sensitivity of the AS-containing test-strips as well as deviation from linearity were much higher, and the current diminution occurred already for an analytically significant level of glucose, i.e., 0–5 mM (Figure 3c,d). Moreover, for the AS-containing gels, the degree of degradation strongly depended on the buffer type. In citrate buffer, the degree of degradation in sensitivity for the gels based on AS with 24 mg/mL GOx was about 30%, and 55% for the gels with 12 mg/mL of GOx. In PPBI at pH 7.4, the diminution in sensitivity reached the level of ~80% (Table 2).
Remarkably, in acetate buffer at pH 5.5 (where GOx was the most active in solution), AS-based test-strips fully lost their sensitivity across a wide glucose concentration range (0–30 mM) after the first two days of their storage (data not shown).
The current degradation occurring during the stress test discussed above could be a result of two processes: (I) the mediator loss/change and/or (II) protein activity lost, i.e., due to water loss. It should be mentioned that the loss of enzyme activity in the majority leads to complete and fast signal degradation (loss of activity happens immediately after heating) across the whole concentration range, or to the gradual decrease in electrochemical response [38,39].
To verify the separate roles of process (I) and (II) in the dependencies shown in Figure 3 and to show the impact of the biochemical reaction caused by change in enzyme activity at the high glucose concentration level, apart from a parallel mediator degradation of the electrochemical response, next, GOx was deactivated by heating of test-strips at 120 °C for 30 s. In this case, the loss of sensitivity during the consequent stress-test was visible across the whole tested concentration range (ESI, Figure S5). In other words, the degradation of enzyme (process II) was responsible for the lost in sensitivity of the glucose test-strips. The comparison of results shown in Figure 3 and Figure S5 indicates that the reason for the current degradation at high glucose concentration during heating at 55 °C (corresponding to 24 months at 20 °C) most likely was caused by instability of the RedOx (process I) mediator (i.e., FC) rather than by degradation of the bioreceptor (GOx).
To sum up, the use of citrate buffer and ALG as a filler agent allowed us to achieve the linear dependency of current especially at the high glucose concentration. Moreover, the data obtained during the stress-test for the ALG-based test-strips indicated their slower degradation as compared to the conventional glucose test-strips. AS-containing test-strips did not provide such a high stabilization effect.

3.3. Impact of Mediator Chemical Stability on Electrochemical Response of Glucose Test-Strips

As shown above (see Section 3.2), the reason for signal degradation at the high glucose concentration level was more likely related to instability of the RedOx mediator. It should be mentioned that the current degradation during accelerated aging tests could not be explained only by the change in water content in the gels, but more likely happened due to altered chemical stability of all components in the functional sensing layer.
Figure 4a shows how UV-irradiation impacted degradation of the electrochemical signal of glucose test-strips. The current responses obtained from the test-strips with the fresh gel and gel kept for 2 h in dark were almost the same. At the same time, the current responses recorded from the test-strips with the gel treated for 2 h by UV irradiation (at 19 W) increased 20% across the whole glucose concentration range as compared to the intact untreated gel. Simultaneously, the basic line of the test-strips after controlled heating became practically 3 times higher. That means that UV light triggered a number of unpredictable chemical reactions in the sensing layer/gel. This trend became more pronounced with the increase in reagent concentration and reaction temperature [40] and could be attributed either to alteration of the bioreceptor distribution in multiple layers caused by different location of its RedOx center to the electrode, or to change in its conformational state. Alternatively, unpredictable physical-chemical transformations could occur in the mediator layer.
Notably, the replacement of 2 mg/mL of RedOx mediator FC in the fresh 10CMC/25ALG/200FC/24GOX (CitB) gel by only 2 mg/mL of ferrocyanide led to a pronounced current decrease (Figure 4b). This experiment illustrates how the degradation of RedOx mediator in the functional sensing layer can immediately affect the overall system response. In this regard, the stability of the RedOx mediator in the sensing gels is a crucial point.
The ferricyanide (FC) was reported to be an unstable complex in acidic solutions, particularly under UV irradiation [41]. FC degradation with a formation of FeIII[FeIII(CN)6] or Fe4[Fe(CN)6]3 species (i.e., Prussian blue, PB) can occur readily in solution. At the same time, the formation and accumulation in the sensing layer of FeIII[FeIII(CN)6] can induce the oxidation of organic compounds (enzyme, ALG, CMC) originally present in the gel. Another mechanism triggering the degradation of FC can be associated with complexation of Fe(III) ions with citrate or acetate ions, followed by multi-stage hydrolysis of the formed salts. Under heating and UV irradiation, Fe(III) in iron citrate might be reduced to Fe(II) with the oxidation of the carboxylic group [42,43]:
2Fe3+ + R2-C(OH)-COO → 2Fe2+ + R2-C = O + H+ + CO2
where -R corresponds to -CH2COO.
This reaction facilitates the decomposition of FC with the formation of iron citrate complex [44]. Fe(II) can also react with ferricyanide, resulting in the appearance of Prussian blue. Moreover, Prussian white and Prussian green [45] might also be created during chemical reactions in the gels induced by heating. In contrast, in buffer solutions with low acidity (phosphate buffer), the formation of iron (III) hydroxides and oxides facilitated by heating can be expected.
All mentioned processes will lead to a leaching of water-soluble mediator from the functional sensing layer/gel. Thus, after heating at 55 °C of gels prepared by screen-printing technique, brown coloration of the gels was observed. The color of the FC solution (as an individual component) in various buffer systems changed to brown after several days of storage at 55 °C in dark. Although UV-vis spectrums of the fresh 200 mg/mL FC solutions were typical regardless of the used buffer (Figure 5a), after 4 days of storage at 55 °C, the appearance of a new peak at ~500–600 nm indicating the formation of as-product compound was observed (Figure 5b). This effect was even more pronounced in the case of AcB buffer. In accordance with data reported in [46], this absorbance corresponds to the iron oxide colloids/nanoparticles or Fe(II) complexes [47].
Remarkably, all of these data were obtained for pure FC solutions. The presence of organic components will only accelerate the color changes in the gel caused by chemical instability of FC and multiple interactions. Thus, the degradation of FC in the 10CMC/20ALG/200FC/9GOx gel prepared in CitB was also confirmed by LDI-MS studies. The formation of Fe(H2O)2+ species in mass spectra was detected at m/z 164 for the fresh FC-based gel (see Figure 6a). At the same time, FC in the intact form at m/z 165.9 corresponding to [M/2+2H]2+ and its [M+Na]+ adduct at m/z 352 were seen in the spectrum. More importantly, the repeatable clusters of 18 Da were observed in spectra, highlighting the retained water molecules in the fresh gel based on CMC and ALG fillers.
However, after storage of glucose test-strips modified by this gel under UV light, a new peak corresponding to Fe[Fe(CN)6]Fe+ was recorded (Figure 6b). This fact confirms that the degradation of FC in CitB more likely occurs in accordance with the complexation route of Fe(III), see Reaction (5). Hence, the degradation of current responses recorded at 55 °C and described in Section 3.2 (Figure 3) can be a result of the same process. The transfer of FC into alternative iron-based complexes (i.e., Fe(II)) is also responsible for the opposite trend, viz. current increase under controlled UV irradiation for 2 h seen in Figure 3a (line 3). In other words, the observed short-term positive effect in sensitivity in this case was not caused by biochemical transformations in accordance with Reactions (1)–(3), but more likely was a result of RedOx mediator chemical alteration (see Reaction (4)).
Notably, the degradation route of FC in PPBI differed from its degradation in CitB (Figure S6). Thus, no Fe[Fe(CN)6]Fe+ corresponding species were recorded in mass spectra for FC in PPBI. However, the appearance of the same new peak in UV-Vis spectra at ~500–550 nm (Figure 5) in PPBI buffer, similar to that observed in AcB and CitB, allows us to assume the formation of FexOy in this solution had the same absorbance as Fe(II) ions [47].
To verify the exclusive impact of RedOx mediator chemical stability on the entire electrochemical signal, FC in the design of glucose test-strips was replaced by water-insoluble mediator 1,10-phenanthroline-5,6-dione, PD. To this end, 10 mg/mL of CMC, 25 mg/mL of ALG, and 25 mg/mL or 24 mg/mL of GOx in CitB at pH 6 were mixed with 25 mg/mL of PD. The dependencies of current responses obtained from the gels prepared in CitB and AcB buffers on glucose concentration in the modelled plasma solutions are shown in Figure 7a. Despite the excellent chemical stability of PD (Figure 7b) for 600 days regardless of glucose concentration, these modified test-strips showed much worse sensitivity (by an order of magnitude) as compared to the conventional glucose test-strips based on FC, see Figure 4 for comparison. It is also interesting, that the replacement of citrate buffer by acetate buffer, pH 5.5 for the gels with PD used as a redox-agent led to visible saturation of current responses at the high concentrations of glucose (curve 2 in Figure 7a). This trend was in line with results obtained for FC-based test-strips in dependence with buffer type, Figure 2b,c.
This experiment highlights the importance of both RedOx mediator nature and its chemical stability to the entire electrochemical signal of glucose test-strips at the constant nature and amount of enzyme and filler agent (CMC+ALG). In other words, the initial degradation of RedOx mediator will trigger the diminution of sensitivity of glucose test-strips.
To summarize, the use of FC allows one to achieve high sensitivity of glucose test-strips; however, its instability in most conventional buffers and intensive degradation significantly limits its overall analytical merit. The stabilization of both RedOx mediator FC and bioreceptor component (GOx) can be managed by addition of ALG into the sensing gel. This procedure allows one to stabilize the electrochemical response and prolong the shelf life of glucose test-strips stored at 20 °C up to 642 days.

4. Conclusions

In this study, the analytical performance of glucose test-strips with the functional layer composed of carboxymethylcellulose (CMC), ferricyanide (FC) as a RedOx mediator, and glucose oxidase prepared by screen-printing methodology was systemized under ambient and stress conditions at 55 °C. The permanent degradation in sensitivity of test-strips during storage for 30 days at 55 °C (corresponding to ≥700 days at 20 °C) was recorded regardless of RedOx mediator and enzyme content. However, the addition of sodium alginate (ALG) used as a filler agent to modify the viscosity of the functional gels allowed us to stabilize the electroanalytical signal of glucose test-strips by at least 1.8 times and improve their sensitivity from 3.3 to 3.9 µA/mM.
Furthermore, the impact of buffer type used for the functional gel preparation on glucose test-strips sensitivity was investigated. Unexpectedly, the use of acetate buffer with pH 5.5 where GOx was the most active in solution did not provide the highest sensitivity of glucose test-strips after drying of the functional sensing layer. The highest sensitivity and signal stability were achieved in citrate buffer. During the investigations, it was revealed that the type of buffer affects the intensity and degradation pathways of RedOx FC mediator.
The knowledge obtained on factors impacting the analytical performance of conventional glucose test-strips will facilitate optimization of their production and storage strategies in the future.

Supplementary Materials

The following supporting information can be downloaded at: https://www.mdpi.com/article/10.3390/chemosensors10080298/s1, Figure S1: (a) The typical view and dimensions of SPE test-strips used in this study with and without a capillary gap. (b–d) Optical microscope images obtained from the dried functional layer deposited on the surface of SPE by screen-printing technique utilizing 60 µm foil. The gel composition: (b) 10 mg/mL CMC, 25 mg/mL ALG, 200 mg/mL FC, 12 mg/mL GOx (in CitB, pH 6); (c) 10 mg/mL CMC, 50 mg/mL AS, 200 mg/mL FC, 12 mg/mL GOx (in CitB, pH 6); (d) 10 mg/mL CMC, 25 mg/mL AS, 25 mg/mL 9,10-Phenantroline-5,6-dione, 24 mg/mL GOx (in CitB, pH 6); Table S1—Buffer systems abbreviation and composition; Figure S2: Selected glucose calibration curves illustrating the influence of the gel content on the shape of the curves (current was recorded at 5 s): (a)—shown for the gels with and without addition of sodium alginate, (b)—shown for the gels with addition of Aerosil 380; (c)—shown the S-type calibration for low content of FC or GOx; Figure S3: LDI-MS full scan TIC-chromatograms (all ions) obtained from SPE covered by conventional and modified gels via screen printing approach; Figure S4: Impact of the thickness of functional layer on sensitivity of glucose test-strips based on 10CMC/25ALG/200FC/9GOx (1) and 10CMC/50AS/200FC/9GOx (2) gels; Figure S5: Current degradation recorded from glucose test-strips with the functional 10CMC/25ALG/200FC/24GOx (CitB, pH 6.0) layer after a short stress-heating test at 120 °C for 30 s (black curve) and consequent storage at 55 oC for 1–4 weeks (other colours). Figure S6: LDI-MS spectra obtained from SPE modified by FC in PPBI after storage for 3 days in the access of light at 55 °C.

Author Contributions

E.V.Z.: conceptualization, data analysis and validation, project administration; writing, review and editing of the manuscript. E.V.G.: samples, preparation strategy, analysis, data visualization. M.G.L.: sample preparations, analysis, data visualization. V.V.S.: sample preparation, analysis and characterization. A.S.F.: analysis, data visualization and validation. Y.E.S.: conceptualization, validation, writing, review and editing of the manuscript. All authors have read and agreed to the published version of the manuscript.

Funding

The work of Y.E.S. was funded by the Deutsche Forschungsgemeinschaft (DFG, project number 427949628).

Institutional Review Board Statement

Not applicable.

Informed Consent Statement

Not applicable.

Data Availability Statement

Not applicable.

Acknowledgments

E.V.Z., E.V.G., V.V.S., M.G.L. and A.S.F. acknowledge the support of Institute of Problems of Chemical Physics RAS, Moscow region, Russia, State task number AAAA-A19-119061890019-5.

Conflicts of Interest

The authors declare no conflict of interest.

References

  1. Chen, C.; Xie, Q.; Yang, D.; Xiao, H.; Fu, Y.; Tan, Y.; Yao, S. Recent advances in electrochemical glucose biosensors: A review. RSC Adv. 2013, 3, 4473–4491. [Google Scholar] [CrossRef]
  2. Teymourian, H.; Barfidokht, A.; Wang, J. Electrochemical glucose sensors in diabetes management: An updated review (2010–2020). Chem. Soc. Rev. 2020, 49, 7671–7709. [Google Scholar] [CrossRef]
  3. Juska, V.B.; Pemble, M.E. A Critical Review of Electrochemical Glucose Sensing: Evolution of Biosensor Platforms Based on Advanced Nanosystems. Sensors 2020, 20, 6013. [Google Scholar] [CrossRef] [PubMed]
  4. Mano, N. Engineering glucose oxidase for bioelectrochemical applications. Bioelectrochemistry 2019, 128, 218–240. [Google Scholar] [CrossRef]
  5. Graça, J.S.; de Oliveira, R.F.; de Moraes, M.L.; Ferreira, M. Amperometric glucose biosensor based on layer-by-layer films of microperoxidase-11 and liposome-encapsulated glucose oxidase. Bioelectrochemistry 2014, 96, 37–42. [Google Scholar] [CrossRef] [PubMed]
  6. Trau, D.; Renneberg, R. Encapsulation of glucose oxidase microparticles within a nanoscale layer-by-layer film: Immobilization and biosensor applications. Biosens. Bioelectron. 2003, 18, 1491–1499. [Google Scholar] [CrossRef]
  7. Zhao, W.; Xu, J.-J.; Shi, C.-G.; Chen, H.-Y. Multilayer Membranes via Layer-by-Layer Deposition of Organic Polymer Protected Prussian Blue Nanoparticles and Glucose Oxidase for Glucose Biosensing. Langmuir 2005, 21, 9630–9634. [Google Scholar] [CrossRef]
  8. Semenova, D.; Gernaey, K.V.; Morgan, B.; Silina, Y.E. Towards one-step design of tailored enzymatic nanobiosensors. Analyst 2020, 145, 1014–1024. [Google Scholar] [CrossRef]
  9. Ghica, M.E.; Brett, C.M.A. A glucose biosensor using methyl viologen redox mediator on carbon film electrodes. Anal. Chim. Acta 2005, 532, 145–151. [Google Scholar] [CrossRef] [Green Version]
  10. Dong, S.; Wang, B.; Liu, B. Amperometric glucose sensor with ferrocene as an electron transfer mediator. Biosens. Bioelectron. 1992, 7, 215–222. [Google Scholar] [CrossRef]
  11. Loew, N.; Tsugawa, W.; Nagae, D.; Kojima, K.; Sode, K. Mediator Preference of Two Different FAD-Dependent Glucose Dehydrogenases Employed in Disposable Enzyme Glucose Sensors. Sensors 2017, 17, 2636. [Google Scholar] [CrossRef] [Green Version]
  12. Kang, S.; Chung, Y.; Hyun, K.; Yoo, K.S.; Kwon, Y. Performance improvement of the glucose oxidation reactions using methyl red mediator. Int. J. Hydrogen Energy 2020, 45, 4821–4828. [Google Scholar] [CrossRef]
  13. Wang, J. Glucose biosensors: 40 Years of advances and challenges. Electroanalysis 2001, 13, 983–988. [Google Scholar] [CrossRef]
  14. Hilditch, P.I.; Green, M.J. Disposable electrochemical biosensors. Analyst 1991, 116, 1217–1220. [Google Scholar] [CrossRef] [PubMed]
  15. Hale, P.D.; Inagaki, T.; Karan, H.I.; Okamoto, Y.; Skotheim, T.A. A new class of amperometric biosensor incorporating a polymeric electron-transfer mediator. J. Am. Chem. Soc. 1989, 111, 3482–3484. [Google Scholar] [CrossRef]
  16. Ohara, T.J.; Rajagopalan, R.; Heller, A. Glucose electrodes based on cross-linked [Os(bpy)2Cl]+/2+ complexed poly(1-vinylimidazole) films. Anal. Chem. 1993, 65, 3512–3517. [Google Scholar] [CrossRef] [PubMed]
  17. Gregg, B.A.; Heller, A. Cross-linked redox gels containing glucose oxidase for amperometric biosensor applications. Anal. Chem. 1990, 62, 258–263. [Google Scholar] [CrossRef] [PubMed]
  18. Mano, N.; Yoo, J.E.; Tarver, J.; Loo, Y.-L.; Heller, A. An Electron-Conducting Cross-Linked Polyaniline-Based Redox Hydrogel, Formed in One Step at pH 7.2, Wires Glucose Oxidase. J. Am. Chem. Soc. 2007, 129, 7006–7007. [Google Scholar] [CrossRef] [PubMed]
  19. Chen, Z.; Fang, C.; Wang, H.; He, J. Disposable glucose test strip for whole blood with integrated sensing/diffusion-limiting layer. Electrochim. Acta 2009, 55, 544–550. [Google Scholar] [CrossRef]
  20. Cheng, Y.; Feng, B.; Yang, X.; Yang, P.; Ding, Y.; Chen, Y.; Fei, J. Electrochemical biosensing platform based on carboxymethyl cellulose functionalized reduced graphene oxide and hemoglobin hybrid nanocomposite film. Sens. Actuators B Chem. 2013, 182, 288–293. [Google Scholar] [CrossRef]
  21. Lin, M.-J.; Wu, C.-C.; Chang, K.-S. Effect of Poly-l-Lysine Polycation on the Glucose Oxidase/Ferricyanide Composite-Based Second-Generation Blood Glucose Sensors. Sensors 2019, 19, 1448. [Google Scholar] [CrossRef] [PubMed] [Green Version]
  22. Kojima, S.; Nagata, F.; Inagaki, M.; Kugimiya, S.; Kato, K. Enzyme immobilisation on poly-l-lysine-containing calcium phosphate particles for highly sensitive glucose detection. RSC Adv. 2019, 9, 10832–10841. [Google Scholar] [CrossRef] [PubMed] [Green Version]
  23. Suye, S.; Kumon, Y.; Ishigaki, A. Immobilization of glucose oxidase on poly-(l-lysine)-modified polycarbonate membrane. Biotechnol. Appl. Biochem. 1998, 27, 245–248. [Google Scholar] [CrossRef]
  24. Zolotukhina, E.V.; Katsen-Globa, A.; Koch, M.; Fink-Straube, C.; Sukmann, T.; Levchenko, M.G.; Silina, Y.E. The development of alginate-based amperometric nanoreactors for biochemical profiling of living yeast cells. Bioelectrochemistry 2022, 145, 108082. [Google Scholar] [CrossRef]
  25. Christwardana, M.; Frattini, D. Electrochemical Study of Enzymatic Glucose Sensors Biocatalyst: Thermal Degradation after Long-Term Storage. Chemosensors 2018, 6, 53. [Google Scholar] [CrossRef] [Green Version]
  26. Hsu, C.-T.; Hsiao, H.-C.; Fang, M.-Y.; Zen, J.-M. Superior long-term stability of a glucose biosensor based on inserted barrel plating gold electrodes. Biosens. Bioelectron. 2009, 25, 383–387. [Google Scholar] [CrossRef]
  27. Haller, M.J.; Shuster, J.J.; Schatz, D.; Melker, R.J. Adverse Impact of Temperature and Humidity on Blood Glucose Monitoring Reliability: A Pilot Study. Diabetes Technol. Ther. 2007, 9, 1–9. [Google Scholar] [CrossRef]
  28. Puggioni, G.; Calia, G.; Arrigo, P.; Bacciu, A.; Bazzu, G.; Migheli, R.; Fancello, S.; Serra, P.A.; Rocchitta, G. Low-Temperature Storage Improves the Over-Time Stability of Implantable Glucose and Lactate Biosensors. Sensors 2019, 19, 422. [Google Scholar] [CrossRef] [Green Version]
  29. Zafar, H.; Channa, A.; Jeoti, V.; Stojanović, G.M. Comprehensive Review on Wearable Sweat-Glucose Sensors for Continuous Glucose Monitoring. Sensors 2022, 22, 638. [Google Scholar] [CrossRef]
  30. Glucose Meter. Available online: https://eltaltd.ru/en/catalog/?preferred_lang=en (accessed on 26 July 2022).
  31. Semenova, D. Sensors for biosensors: A novel tandem monitoring in a droplet towards e ffi cient screening of robust design and optimal operating conditions. Analyst 2019, 144, 2511–2522. [Google Scholar] [CrossRef] [PubMed]
  32. Sedlák, E.; Sedláková, D.; Marek, J.; Hančár, J.; Garajová, K.; Žoldák, G. Ion-Specific Protein/Water Interface Determines the Hofmeister Effect on the Kinetic Stability of Glucose Oxidase. J. Phys. Chem. B 2019, 123, 7965–7973. [Google Scholar] [CrossRef] [PubMed]
  33. Klibanov, A. Why are enzymes less active in organic solvents than in water? Trends Biotechnol. 1997, 15, 97–101. [Google Scholar] [CrossRef]
  34. Mathias, J.; Wannemacher, G. Basic characteristics and applications of aerosil: 30. The chemistry and physics of the aerosil Surface. J. Colloid Interface Sci. 1988, 125, 61–68. [Google Scholar] [CrossRef]
  35. Vreeker, R.; Li, L.; Fang, Y.; Appelqvist, I.; Mendes, E. Drying and Rehydration of Calcium Alginate Gels. Food Biophys. 2008, 3, 361–369. [Google Scholar] [CrossRef] [Green Version]
  36. Dumitraşcu, L.; Stănciuc, N.; Bahrim, G.E.; Ciumac, A.; Aprodu, I. pH and heat-dependent behaviour of glucose oxidase down to single molecule level by combined fluorescence spectroscopy and molecular modelling. J. Sci. Food Agric. 2016, 96, 1906–1914. [Google Scholar] [CrossRef]
  37. Gindt, Y.M.; Connolly, G.; Vonder Haar, A.L.; Kikhwa, M.; Schelvis, J.P.M. Investigation of the pH-dependence of the oxidation of FAD in VcCRY-1, a member of the cryptochrome-DASH family. Photochem. Photobiol. Sci. 2021, 20, 831–841. [Google Scholar] [CrossRef] [PubMed]
  38. Zhang, Y.; Rochefort, D. Activity, conformation and thermal stability of laccase and glucose oxidase in poly(ethyleneimine) microcapsules for immobilization in paper. Process Biochem. 2011, 46, 993–1000. [Google Scholar] [CrossRef]
  39. Padilla-Martínez, S.G.; Martínez-Jothar, L.; Sampedro, J.G.; Tristan, F.; Pérez, E. Enhanced thermal stability and pH behavior of glucose oxidase on electrostatic interaction with polyethylenimine. Int. J. Biol. Macromol. 2015, 75, 453–459. [Google Scholar] [CrossRef]
  40. Hammes, G.G. Principles of chemical kinetics. Methods Biochem. Anal. 2007, 50, 75–96. [Google Scholar] [CrossRef] [Green Version]
  41. Koncki, R.; Wolfbeis, O.S. Composite Films of Prussian Blue and N-Substituted Polypyrroles:  Fabrication and Application to Optical Determination of pH. Anal. Chem. 1998, 70, 2544–2550. [Google Scholar] [CrossRef]
  42. Gracheva, M.; Homonnay, Z.; Singh, A.; Fodor, F.; Marosi, V.B.; Solti, Á. New aspects of the photodegradation of iron(III) citrate: Spectroscopic studies and plant-related factors. Photochem. Photobiol. Sci. 2022, 21, 983–996. [Google Scholar] [CrossRef] [PubMed]
  43. Abrahamson, H.B.; Rezvani, A.B.; Brushmiller, J.G. Photochemical and spectroscopic studies of complexes, of iron(III) with citric acid and other carboxylic acids. Inorg. Chim. Acta 1994, 226, 117–127. [Google Scholar] [CrossRef]
  44. Peng, F.; Li, G.; Liu, X.; Wu, S.; Tong, Z. Redox-Responsive Gel−Sol/Sol−Gel Transition in Poly(acrylic acid) Aqueous Solution Containing Fe(III) Ions Switched by Light. J. Am. Chem. Soc. 2008, 130, 16166–16167. [Google Scholar] [CrossRef]
  45. Itaya, K.; Akahoshi, H.; Toshima, S. Electrochemistry of Prussian Blue Modified Electrodes: An Electrochemical Preparation Method. J. Electrochem. Soc. 1982, 129, 1498–1500. [Google Scholar] [CrossRef]
  46. Azizi, A. Green Synthesis of Fe3O4 Nanoparticles and Its Application in Preparation of Fe3O4/Cellulose Magnetic Nanocomposite: A Suitable Proposal for Drug Delivery Systems. J. Inorg. Organomet. Polym. Mater. 2020, 30, 3552–3561. [Google Scholar] [CrossRef]
  47. Basha, F.Z.; Maqsood, Z.T.; Wasim, A.A. Fe(II) and Co(II) Complexes of (4-(4-bromophenyl)-[2,2′-bipyridine]-6-carboxylic acid) Synthesis, Characterization and Electrochromic studies. J. Chem. Soc. Pak. 2017, 39, 35–42. [Google Scholar]
Figure 1. (a,b) Calibration curves obtained from SPE modified by 10CMC/25ALG/200FC (a) and 10CMC/50AS/200FC (b) gels with GOx concentration of 1–9 mg/mL, 2–12 mg/mL, 3–24 mg/mL. (c) Sensitivity of glucose test-strips based on ALG (1) and AS (2) gels in comparison with the conventional gel based on CMC (3) evaluated in LDR 0–40 mM. Note: Glucose solutions were prepared in the synthetic plasma at 36 °C and pH 7.4.
Chemosensors 10 00298 g001
Figure 2. (a)—The response of the optical oxygen microsensor expressed as the number of moles (µmol/L) of the dissolved oxygen present in 100 mM glucose solution and 100 µL of 0.1 mg/mL GOx; (b,c)—calibration curves obtained from 10CMC/25ALG/200FC/24GOx (b) and 10CMC/50AS/200FC/24GOx (c) test-strips in different buffer solutions. Note: 1—citrate buffer (CitB, pH = 6); 2—phosphate buffer (PPBI, pH = 7.1); 3—acetate buffer (AcB, pH = 5.5).
Chemosensors 10 00298 g002
Figure 3. Results of current degradation during storage of selected glucose test strips with various compositions of the functional layer at 55 °C: (a)—10CMC/25ALG/200FC/24GOx in CitB pH 6.0, (b)—10CMC/25ALG/200FC/24GOx in PPBI pH 7.4, (c)—10CMC/50AS/200FC/24GOx in CitB pH 6.0, (d)—10CMC/50AS/200FC/24GOx in PPBI pH 7.4.
Chemosensors 10 00298 g003
Figure 4. Calibration curves obtained from glucose test-strips modified by (a) fresh 10CMC/25ALG/200FC/12GOx gel in citrate buffer, pH 6 (1), the same gel after 2 h of storage in dark (2) and after 2 h of controlled UV irradiation at 19 W (3); (b) fresh 10CMC/25ALG/200FC/24GOx gel in citrate buffer, pH 6 (1), and the gel with the same content of bioorganic compounds (10CMC/25ALG/24GOx) but different ratio and nature of RedOx mediator, i.e., 198 mg/mL of ferricyanide (FC) and 2 mg/mL of ferrocyanide (2).
Chemosensors 10 00298 g004
Figure 5. (a) UV-vis spectra of 200 mg/mL of as-prepared individual FC in various buffer solutions. (b) UV-vis spectra of 200 mg/mL of FC after heating of buffer solutions at 55 °C for 4 days (modeling of storage at 20 °C for 96 days). Note: 1—citrate buffer, pH 6, 2—phosphate buffer, pH 7.4, 3—acetate buffer, pH 5.5.
Chemosensors 10 00298 g005
Figure 6. LDI-MS spectra obtained from glucose test-strips modified by as-prepared 10CMC/200FC/20ALG/9GOx gel in CitB (a) and after its storage for 3 days in the light access (b).
Chemosensors 10 00298 g006
Figure 7. (a)—Calibration curves obtained from glucose test-strips modified by 10 mg/mL of CMC, 25 mg/mL of ALG, 25 mg/mL of PD and 1 mg/mL of GOx in CitB, pH 6 (1) and in AcB, pH 5.5 (2) (b)—Storage stability of test-strips with 10CMC/25ALG/25PD/24GOx in CitB, pH 6.
Chemosensors 10 00298 g007
Table 1. Comparison of analytical merit of glucose test strips in dependence on the gel composition used for the functional layer preparation in 0.1 M citrate buffer, pH 6.
SampleCMC a,
mg/mL
Additional Filler
Agent,
mg/mL
FC b,
mg/mL
Gox c,
mg/mL
LDR d,
R2
Sensitivity,
µA mM−1
Intercept,
µA
No additional filler agent was used
20CMC/50FC/2GOx20-5020.6–20,
0.9866
0.080.47
20CMC/50FC/9GOx20-5090.6–10,
0.9892
1.463.31
20CMC/200FC/12GOx20-200122–20,
0.9979
3.71−2.66
20CMC/200FC/24GOx20-200240–40,
0.9787
3.290.01
Sodium alginate
10CMC/15ALG/200FC/2GOx101520022–30,
0.9953
2.420.06
10CMC/15ALG/200FC/9GOx101520090.6–30,
0.9980
3.132.70
10CMC/25ALG/200FC/9GOx102520090–40,
0.9779
3.146.94
10CMC/25ALG/100FC/4GOx102510040–40,
0.9717
1.701.04
10CMC/25ALG/200FC/12GOx1025200120–40,
0.9854
3.212.02
10CMC/25ALG/200FC/24GOx1025200240–30,
0.9967
3.917.08
Aerosil 380
20CMC/75AS/100FC/9GOx207510092–30
0.9889
1.75−0.78
20CMC/75AS/150FC/9GOx207515092–20
0.9904
2.091.53
10CMC/50AS/150FC/9GOx105015090–20,
0.9712
1.893.25
10CMC/50AS/200FC/9GOx105020090–40,
0.9879
2.822.55
10CMC/50AS/200FC/12GOx1050200120–30,
0.9895
3.092.69
10CMC/50AS/200FC/24GOx1050200240–30,
0.9587
3.38−0.68
a—carboxymethylcellulose; b—ferricyanide; c—glucose oxidase; d—linear dynamic range (LDR) and regression coefficient (R2).
Table 2. The degradation of sensitivity of glucose test-strips during stress-test at 55 °C.
SampleBuffer SystemSensitivity, µA mM−1 *Degradation
Degree, %
Fresh Test-StripsTest-Strips
after Stress-Test
20CMC/200FC/24GOxCitB, pH 6.03.32.1 ± 0.4 **36
10CMC/25ALG/200FC/24GOxCitB, pH 6.03.93.1 ± 0.220
PPBI, 7.43.52.9 ± 0.217
10CMC/25ALG/200FC/12GOxCitB, pH 6.03.22.6 ± 0.219
10CMC/50AS/200FC/24GOxCitB, pH 6.03.42.2 ± 0.131
PPBI, 7.42.70.6 ± 0.179
10CMC/50AS/200FC/12GOxCitB, pH 6.03.11.4 ± 0.255
* Sensitivity was evaluated in the range of 0–30 mM; ** Permanent decrease in sensitivity during the whole storage period (30 days at 55 °C).
Publisher’s Note: MDPI stays neutral with regard to jurisdictional claims in published maps and institutional affiliations.

