Article

An Enzyme-Free Photoelectrochemical Sensor Platform for Ascorbic Acid Detection in Human Urine

1
Guangzhou Key Laboratory of Sensing Materials & Devices, Center for Advanced Analytical Science, School of Chemistry and Chemical Engineering, Guangzhou University, Guangzhou 510006, China
2
Guangdong Provincial Key Laboratory of Psychoactive Substances Monitoring and Safety, Anti-Drug Technology Center of Guangdong Province, Guangzhou 510230, China
*
Author to whom correspondence should be addressed.
These authors contributed equally to this work.
Chemosensors 2022, 10(7), 268; https://doi.org/10.3390/chemosensors10070268
Submission received: 14 June 2022 / Revised: 29 June 2022 / Accepted: 8 July 2022 / Published: 11 July 2022

Abstract

:
A novel enzyme-free photoelectrochemical (PEC) potential measurement system based on Dy-OSCN was designed for ascorbic acid (AA) detection. The separation and transmission of internal carriers were accelerated and the chemical properties became more stable under light excitation due to the regular microstructure of the prepared Dy-OSCN monocrystal. More importantly, the PEC potential method (OCPT, open circuit potential-time) used in this work was conducive to the reduction of photoelectric corrosion and less interference introduced during the detection process, which effectively ensured the repeatability and stability of the electrode. Under optimal conditions, the monocrystal successfully served as a matrix for the detection of AA, and the prepared PEC sensor exhibited a wide linear range from 7.94 × 10⁻⁶ mol/L to 1.113 × 10⁻² mol/L and a sensitive detection limit of 3.35 μM. Practical human urine sample analysis further revealed the accuracy and feasibility of the Dy-OSCN-based PEC platform. It is expected that such a PEC sensor would provide a new way for rapid and non-invasive AA level assessment in human body constitution monitoring and lays a foundation for the further development of practical products.

1. Introduction

Ascorbic acid (AA), also known as vitamin C [1], has long been considered an important antioxidant [2,3,4], which can effectively protect organisms from oxidative stress-related damage [5,6] and plays an important role in maintaining normal physiological functions of the body [7]. As an essential nutrient, AA is widely involved in human metabolisms, such as effectively promoting the synthesis of collagen and mucopolysaccharides as well as enhancing the strength of blood vessels [8]. AA is of great biomedical value among many important molecules in clinical medicine [9]. Diseases such as scurvy, schizophrenia, and Parkinson’s disease may be associated with abnormal AA levels [10,11]. Thus, simple and timely detection of AA is of great significance in physiology, drug research, and disease diagnosis. Taking blood multiple times to test the level of AA in the blood is very unfriendly to humans, which may also increase the risk of infection during the testing process [12]. Fortunately, AA exists not only in human blood, but also widely in extracellular fluid and urine [8]. It points out a new direction for the non-invasive determination of AA content in the human body by detecting the concentration of AA in human urine [13]. Through the collection of human urine, the determination of AA content in vitro can effectively feedback the level of AA in human blood, so as to achieve the purpose of monitoring the health index of AA content in the human body without repeated blood collection [14]. Based on the above reasons, achieving the AA content in human urine with fast, low cost, accurate analysis was of great importance.
Various kinds technology, such as high performance liquid chromatography (HPLC) [15], capillary electrophoresis [16,17], colorimetric analysis [18], electrochemical [19,20], voltammetric [21] and fluorescence [22] have been developed for AA detection. In general, some of those technologies have at least one disadvantage, such as requiring expensive and complex equipment, tedious preparation steps or lack of portability. For commonly enzyme sensors, it can quickly and efficiently detect the concentration of AA [23,24], while the consumption of biological enzymes often brings higher costs, which are unstable under room temperature and the harsh storage conditions, so enzyme modification electrochemical methods have not been used widely [25,26,27]. So far, there have been few reports of research on enzyme-free electrochemistry. Those methods often need the support of large equipment, complex testing process, low efficiency, and high testing costs. Due to the inherent characteristics of the electrochemical sensor [28,29,30], it provides a promising detection mode for the rapid determination of the concentration of AA, which also provides the possibility of product conversion [31,32]. However, achieving high sensitivity and wide detection range is the major challenge for the electrochemical sensor in practical applications [13]. In general, the electrochemical measurement of AA is mainly based on the redox reaction of AA on the electrode surface. Direct electrochemical oxidation of AA on conventional electrodes is an irreversible reaction requiring high over potential, which will lead to electrode contamination and catalysis of other oxidizing substances [33], thus interfering with detection. In order to improve the selectivity of AA and reduce the overpotential of catalytic oxidation, the exposed electrode surface is usually modified by electronic media, conductive or selective polymer membranes, and ascorbate oxidase [33,34]. Such electrode modification requires long and tedious preparation steps, and the introduction of a peripheral polymer film leads to an extremely complex electron transfer process [35]. Therefore, the development of a fast, simple, enzyme-free PEC method to determine the concentration of AA possesses a promising development prospect.
As a novel sensing method, photoelectrochemical (PEC) sensing demonstrates good performance compared to traditional electrochemical and optical sensors due to the entire isolation of the electrochemical signals and optical sources. Owing to the advantages of simple devices, low cost, fast analysis time, high sensitivity, and low background signal, the design and synthesis of semiconductor materials with excellent photoelectric chemical properties have attracted the attention of many researchers [36]. Although many functional nanomaterials were applied for photoelectrochemical sensing to improve the sensitivity and selectivity, the detection is still affected by the redox reaction that happens in the system. As a new detection method, the PEC potential method had almost no current flow on the electrode surface and preventing REDOX reactions between AA and other molecules on the interface. No new species entering the system meant the entire system was not compromised during testing. As an active substance, AA is prone to REDOX reaction in the detection system, and the PEC potential method provides an appropriate method for the detection of AA. Supported by the PEC potential method, an enzyme-free AA photoelectrochemical (PEC) potential detection system based on a Dy-OSCN monocrystal semiconductor was developed. The regular structure of Dy-OSCN [37,38,39] is favorable for the separation and transmission of carriers in the semiconductor under light excitation. Meanwhile, when Dy6-SCN was modified on the electrode surface and calcined in the tube furnace to generate Dy-OSCN, it would possess the advantage of stable chemical properties and light corrosion-resistant, which greatly improves the stability and repeatability of detection. Moreover, the prepared sensor achieved a good RSD (relative standard deviation) in the actual detection of human urine. In summary, this study establishes a novel PEC potential system and uses it for the detection of AA for the first time. The use of Dy-OSCN achieves a low-cost, rapid and accurate determination of AA that can provide a new idea for the molecular detection of human vital substances.

2. Materials and Methods

2.1. Chemical Reagents and Materials

All reagents were commercially available as analytical reagent grade and used as received unless otherwise stated. AA, glucose (GC), uric acid (UA), citric acid (CA), L-Proline (L-Pro), L-Threonine (L-Thr), L-histidine (L-His), L-lysine (L-Lys) and glutathione (GSH) were offered by Sigma-Aldrich Chemical Co. (St. Louis, MO, USA). Methanol, acetonitrile, urea, triethylamine, acidity, Na2HPO4, NaH2PO4, KCl, CaCl2∙2H2O, NaCl, MgCl2 and ethanol were bought from InnoChem Science & Technology Co., Ltd. Beijing, China, 4, 6-dihydrazine pyrimidine, o-vanillin and dysprosium thiocyanate were the self-manufactured semi-finished product.

2.2. Apparatuses

In this work, the structure information was collected by the Ultima IV X-ray diffractometer (Cu Kα ray, λ = 0.15405 nm, Bright Industrial (Shanghai, China) Co., LTD.). X-ray photoelectron spectroscopy (XPS) was used to characterize the surface chemical valence states of the materials with Thermo ScientificTM K-AlphaTM+ spectrometer (Thermo Fisher Scientific, Waltham, MA, USA). A scanning electron microscope (SEM, SU8220, Hitachi, Japan) was used to observe the morphology characteristics of the samples. Characterization of the high-power transmission electron microscope (TEM and HRTEM, JSM-2100F, JEOL, Japan) was performed at an accelerating voltage of 200 kV. UV−vis diffuse reflectance spectra of the samples were measured on a UV-vis spectrophotometer (U-3900, Hitachi, Japan). The Fourier transform infrared spectra were recorded with a TENSOR II Series FTIR Spectrometer (Bruker Co., Berlin, Germany). All electrochemical experiments were carried out on the electrochemical workstation (CHI760E, CH Instruments, Shanghai, China) with two electrodes: a surface modified F-doped indium tin oxide (FTO) electrode as the working electrode and saturated calomel (3 mol∙L−1 KCl) as reference electrode, respectively. The electrolyte was 0.1 mol∙L−1 PBS buffer solution with pH = 7.4. A PLS-LED100 LED lamp equipped with a 10 W cut-off filter was used as the irradiation source (Beijing Perfectlight Technology Co., Ltd.). All PEC experiments were carried out at room temperature.

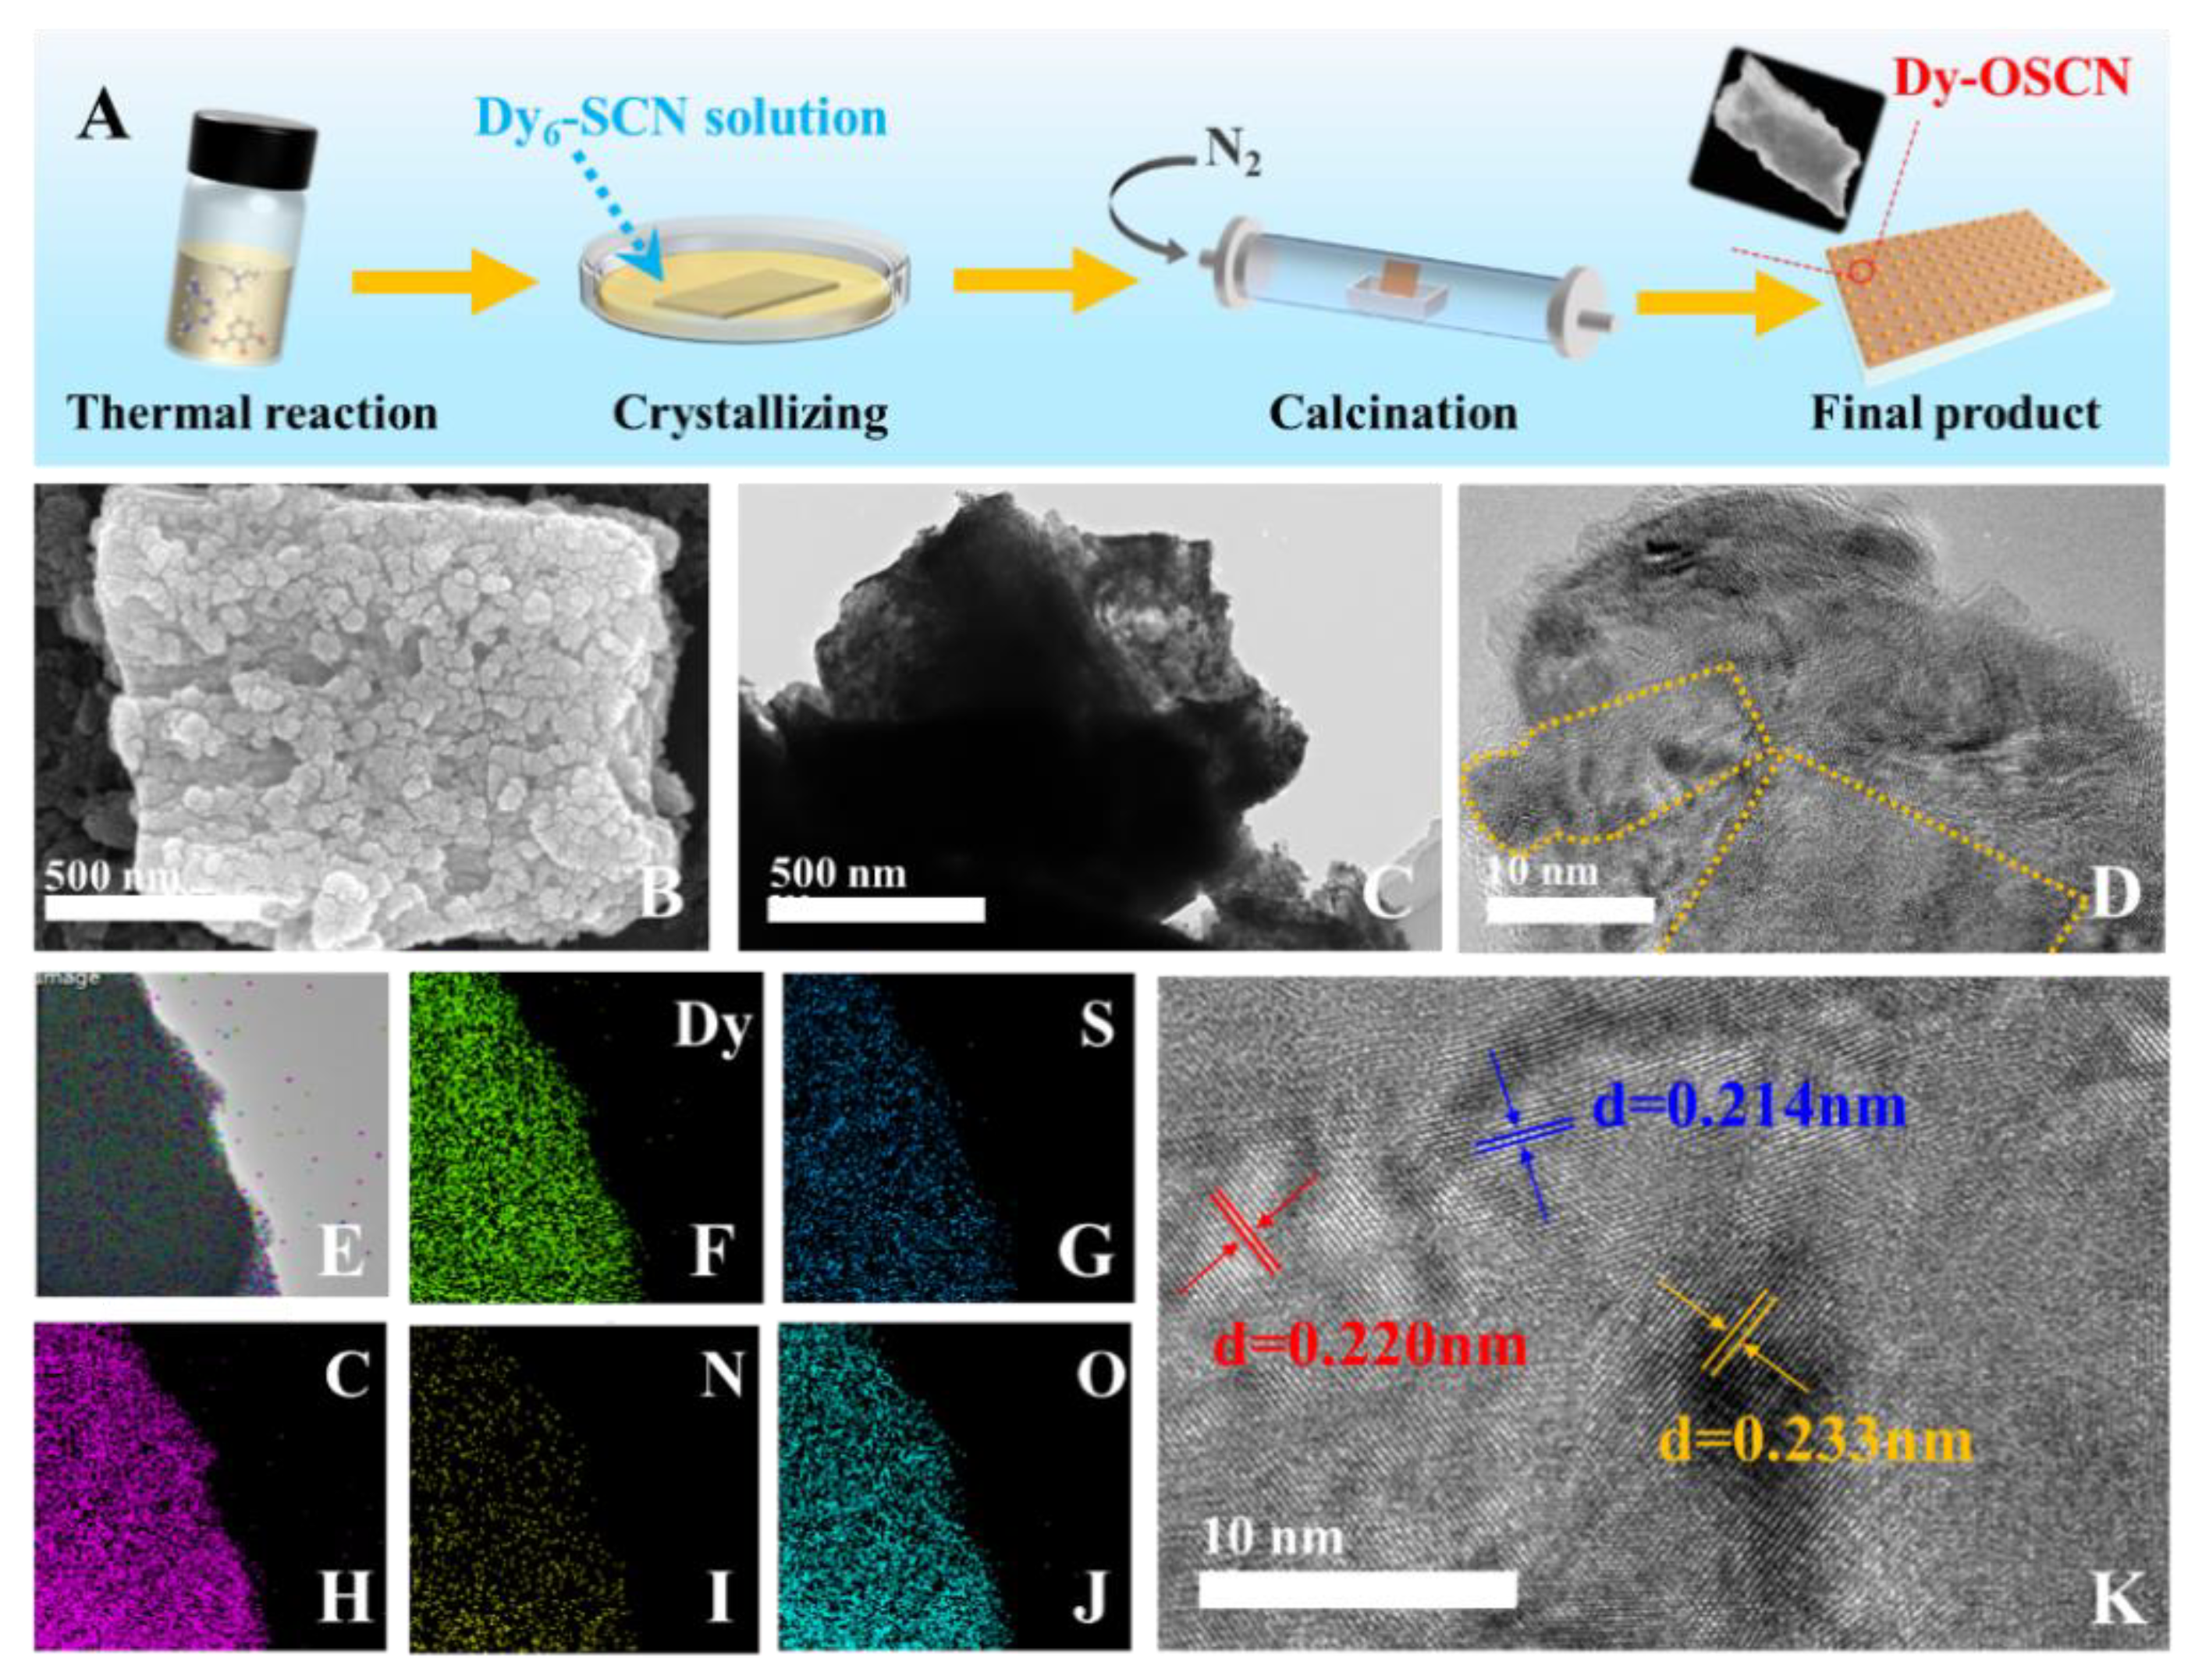
2.3. Synthesis of Dy6-SCN

The [Dy6L23-OH)42-OH)2(SCN)8(H2O)4]·6CH3CN·2CH3OH·H2O (Dy6-SCN monocrystal, Figure S5, see the Supplementary Materials) was prepared based on previous reports [39]. The 0.1 mmol 4,6-dihydrazine pyrimidine, 0.2 mmol Dy(SCN)3·6H2O, 0.2 mmol o-vanillin and 0.3 mmol triethylamine were dissolved in a mixture of 5 mL methanol and 10 mL acetonitrile, following by ultrasonic for at least 10 minutes to form a yellow and homogeneous solution. The yellow solution was then transferred into the 25 mL sample bottle and heated for 4 h under the temperature of 80 °C. After cooling to room temperature, the suspension was filtered and a clear dispersion of Dy6-SCN was obtained.

2.4. Fabrication of Dy-OSCN/FTO PEC Sensor

As shown in Figure 1A, 11 pieces of cleaned FTO (1.5 × 2.5 cm2, with their conductive side facing up) were placed in a surface dish with φ = 90 mm, and then added with 10 mL Dy6-SCN monocrystal solution. The lid on the surface dish was covered and followed by placing on a stable horizontal desktop until all the solvent dried naturally. The obtained electrodes were then placed in a tubular furnace and heated to 400 °C for 2 h under the N2 atmosphere. Cooling to room temperature, the Dy-OSCN/FTO electrodes were finally prepared.

2.5. Detection of AA

Under the optimal conditions, the performance of the same Dy-OSCN/FTO electrode was measured. The Dy-OSCN/FTO electrode was placed into a self-made PEC detection cell containing 2.5 mL 0.1 M PBS solution and used as the working electrode, together with a saturated calomel electrode (SCE) used as a reference electrode to form a two-electrode detection system. The PEC detections proceeded with the CHI760E electrochemical workstation and the data were recorded with the technique type of open circuit potential-time (OCPT). A 10 W cut-off filter was continuously powered on the LED lamp (λ = 465 nm) from one side at a fixed distance as the irradiation source. After the potential signal was stabilized, a certain concentration of AA was successively added to the testing cell for detection (two times of 0.02 mL 1 mM AA, two times of 0.03 mL 1 mM AA, two times of 0.05 mL, 1 mM AA, 0.1 mL 1 mM AA, 0.02 mL 10 mM AA, 0.03 mL 10 mM AA, 0.05 mL 10 mM AA, 0.1 mL 10 mM AA, three times of 0.02 mL 100 mM AA, three times of 0.03 mL 100 mM AA, and six times of 0.05 mL 100 mM AA).

2.6. Conditions’ Optimization

After preparing AA standard solutions at concentrations of 1 mM, 10 mM, and 100 mM, the process of optimizing the preparation conditions of electrodes was proceeding. In order to explore the effect of calcination temperature and select the optimal wavelength of light on the performance of the electrode, the Dy6-SCN/FTO electrodes were calcinated at the temperature of 300 °C, 400 °C, and 500 °C, respectively. The calcined electrode was put into the PEC detection cell and then detected 0.05 mL 1 mM AA, 0.05 mL 1 mM AA, 0.1 mL 1 mM AA, 0.05 mL 10 mM AA, 0.05 mL 10 mM AA, and 0.1 mL 10 mM AA standard solution in sequence after the potential signal was stabilized. At the same time, in order to select the optimal wavelength of light, LED lamps of different wavelengths (420 nm, 465 nm, 535 nm, and 630 nm) were used to irradiate the calcined electrodes. The results were recorded in Tables S2 and S3.

3. Results

3.1. Surface Morphology Analysis for As-Prepared Photocatalysts

The morphology of the Dy-OSCN monocrystal was characterized by SEM and TEM images. As shown in Figure 1B,C, Dy-OSCN grew evenly in the shape of petals and formed a dense block structure. The high-resolution transmission electron microscopy (HRTEM) in Figure 1D was further used to ensure the structure of Dy-OSCN. The thickness of the active layer on the surface of the electrode was 2.28 μm (Figure S7). The Dy crystal was embedded in the substrate material and demonstrated a regular lattice gap structure with obvious lattice diffraction patterns. The HR-TEM images, as well as the XRD pattern (Figure 2A), can both demonstrate the well-crystallized materials. Figure 1K demonstrated that the lattice spacing of Dy-OSCN was 0.214 nm, 0.220 nm, and 0.233nm, which corresponded to the result of XRD in Figure 3. Observing the SEM and TEM morphology of Dy-OSCN confirmed that the monocrystal material had been successfully fabricated. Furthermore, the elemental mapping images (Figure 1E–J) demonstrated that O, C, N, Dy, and S elements were evenly distributed in the Dy-OSCN monocrystal. The detailed content of elements was shown in Table S1, which indicated that the stoichiometric formula of Dy-OSCN (400 °C) could be determined by the ratio of element content of DyO3.59S0.48C9.35N7.21.

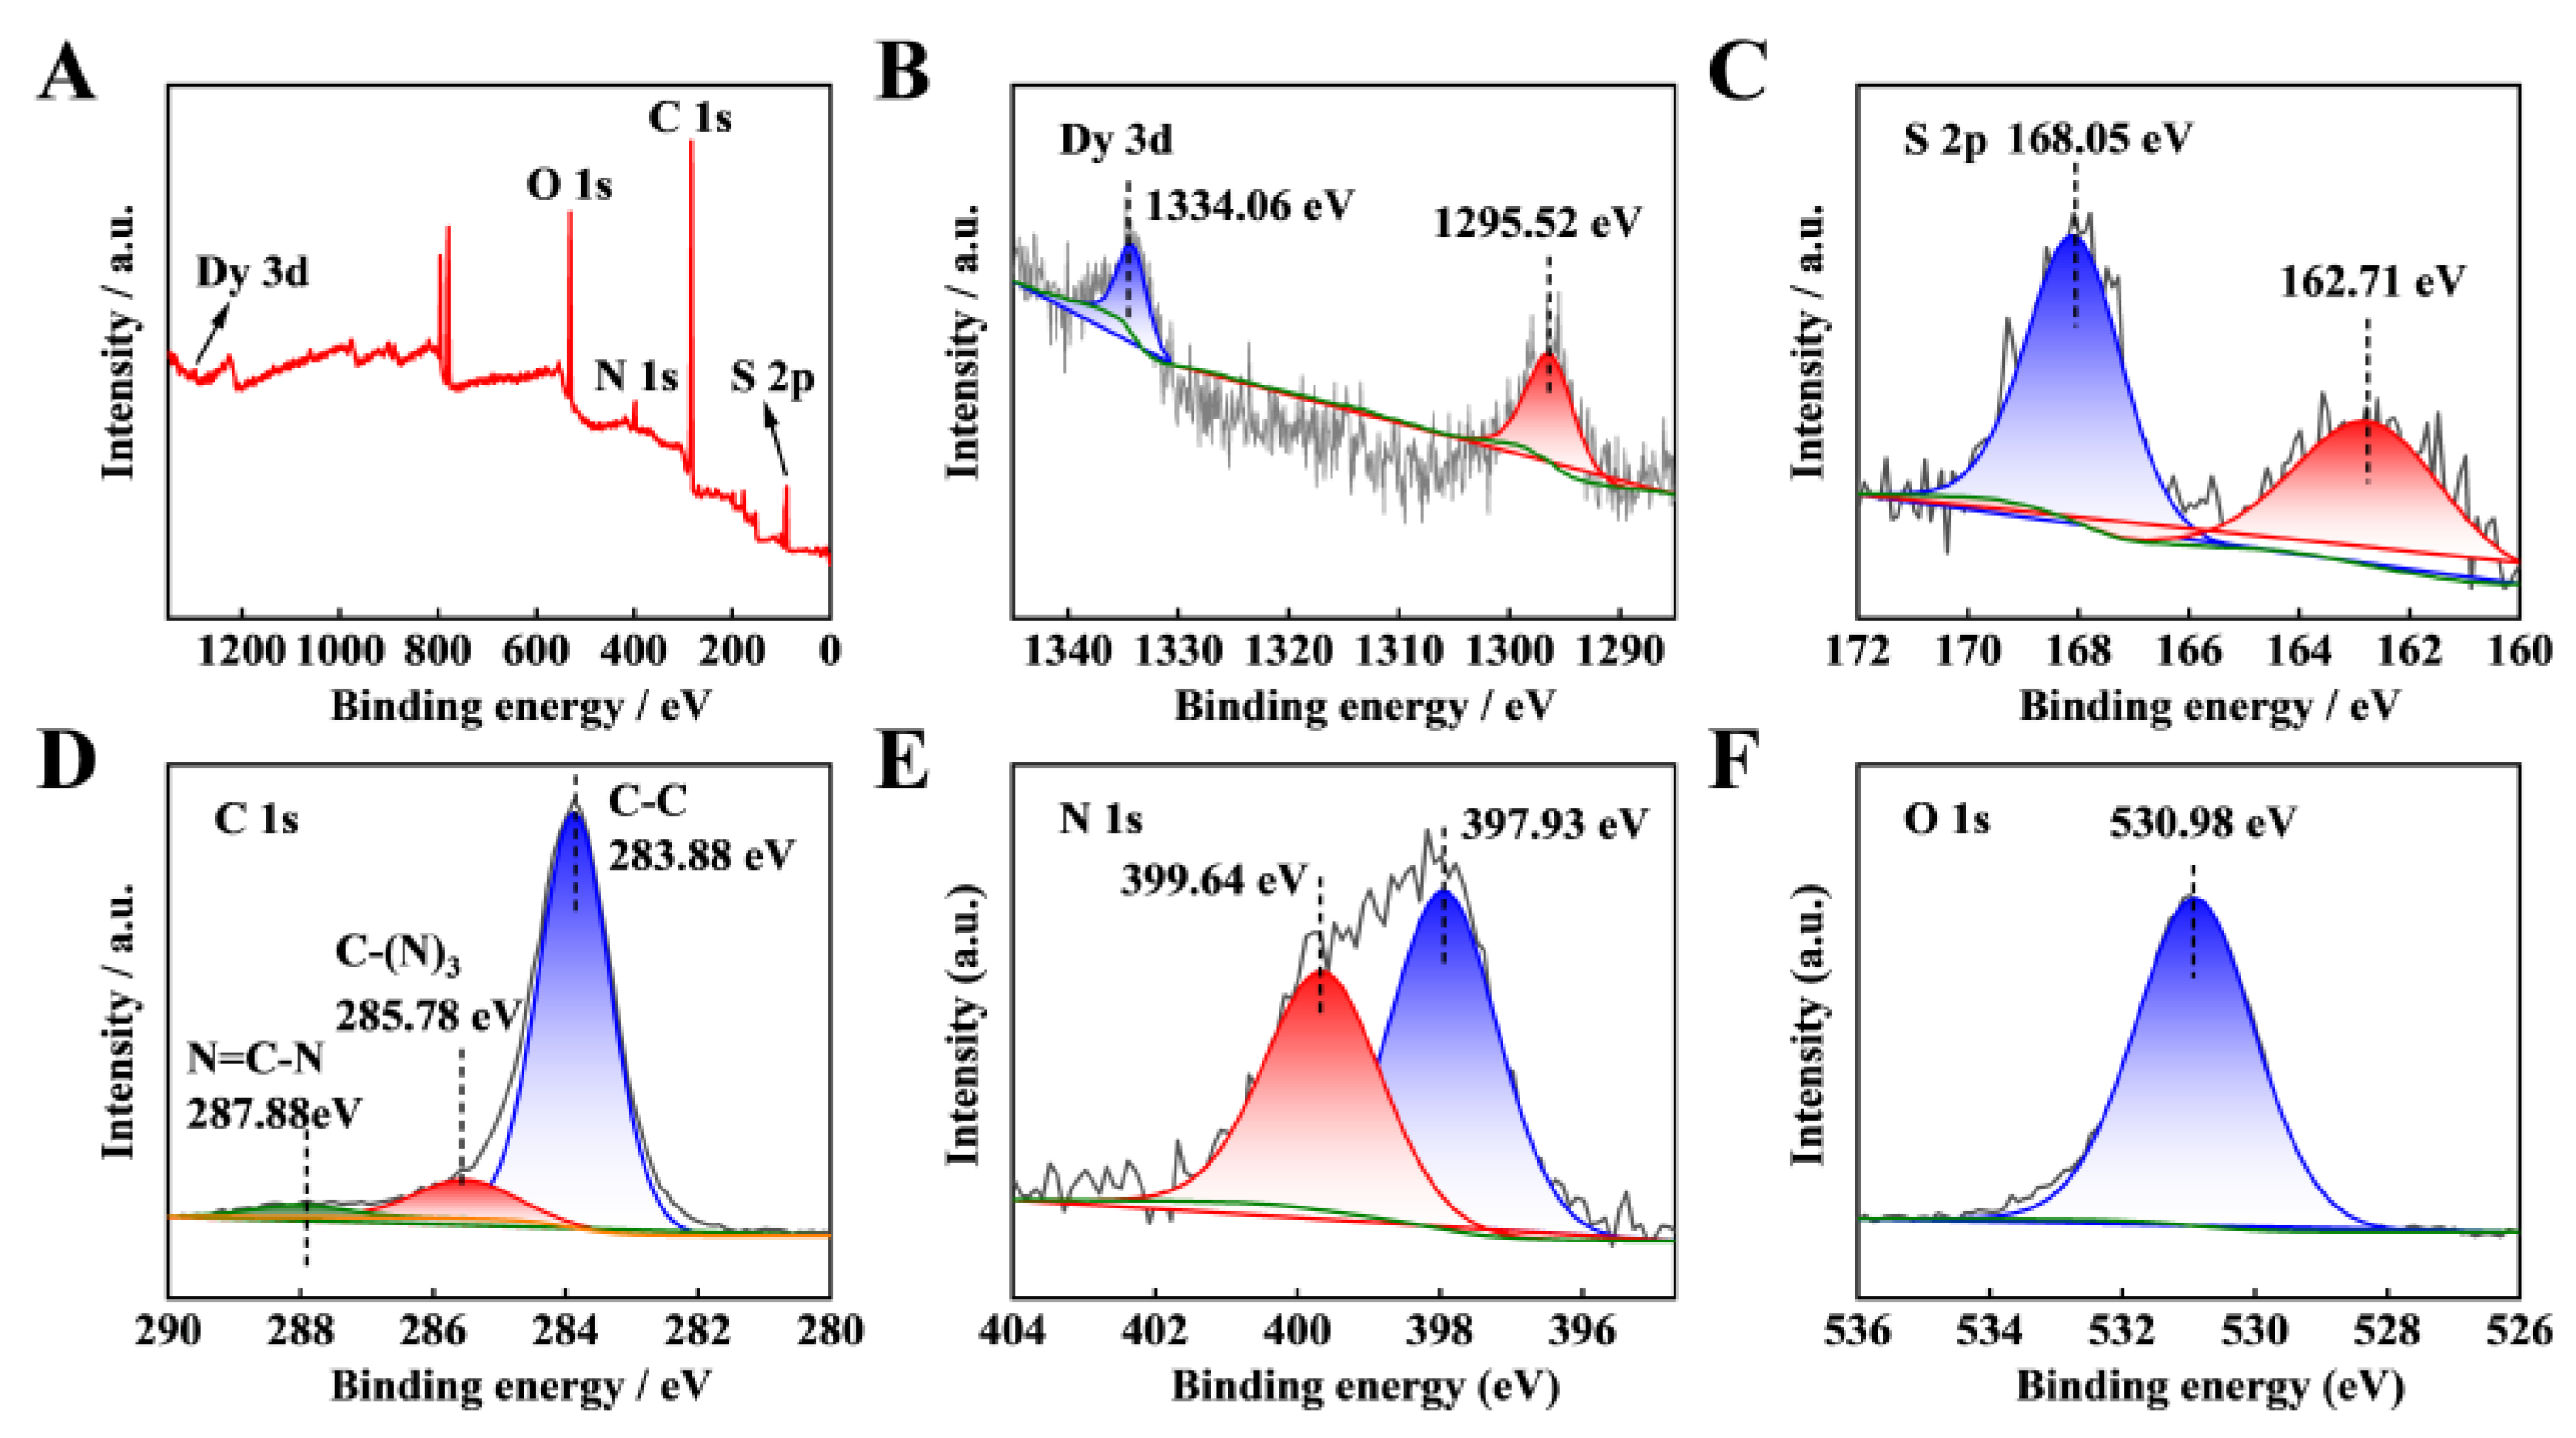
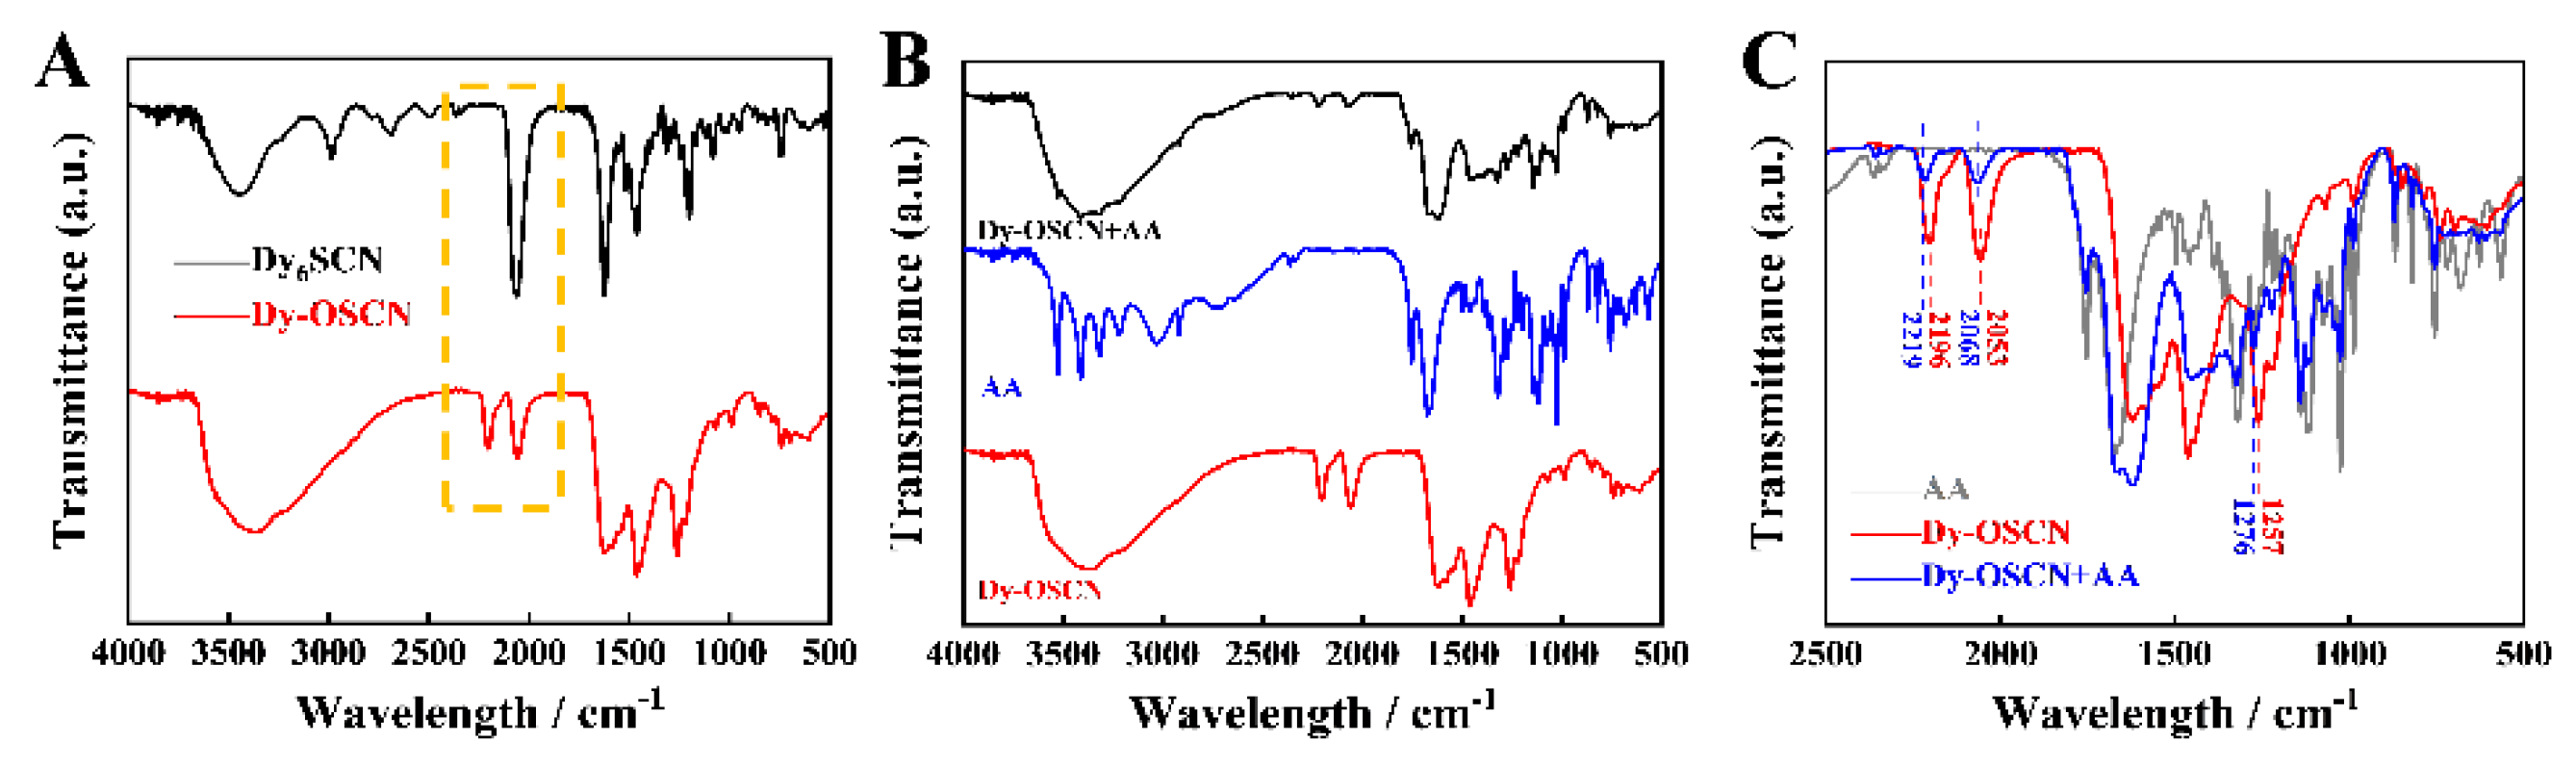
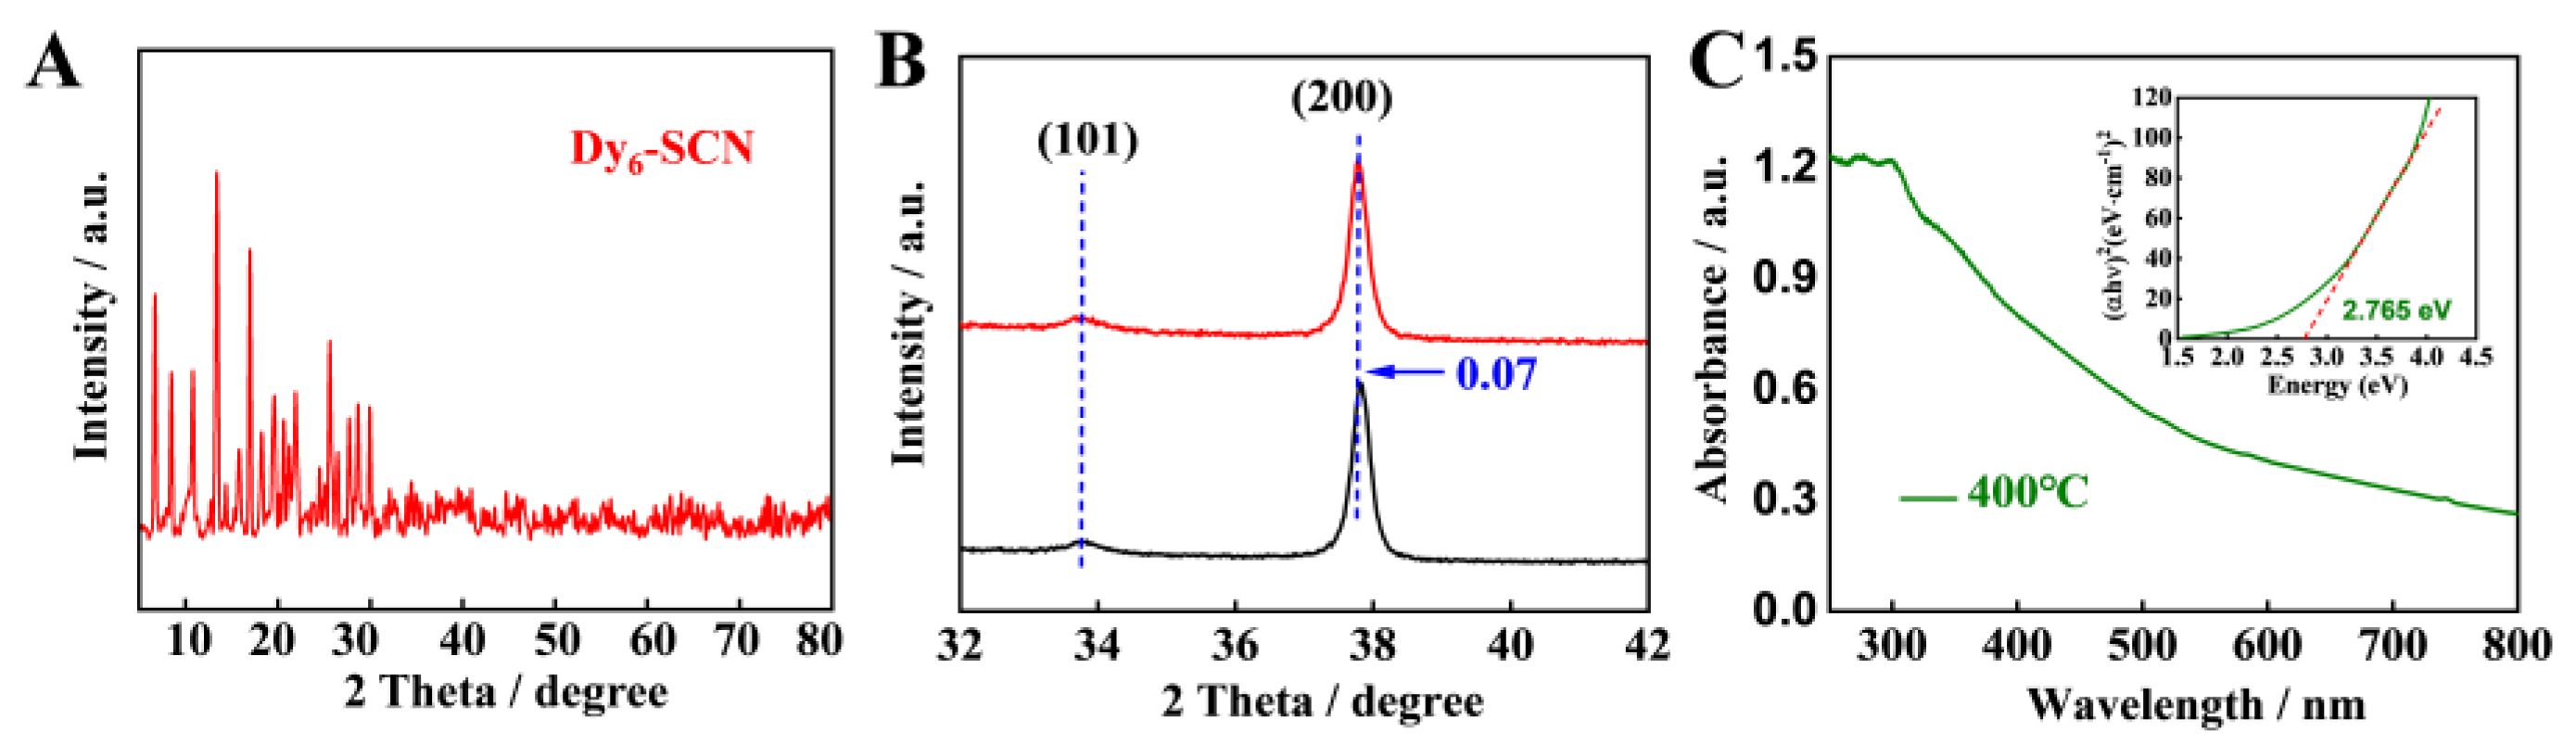
3.2. Characterization of the Synthesized Materials

The chemical components and valence of the Dy-OSCN monocrystal were further analyzed by X-ray photoelectron spectroscopy (XPS), and the results are shown in Figure 2A. Two binding energies centered at 1334.06 eV and 1295.52 eV (Figure 2B) could be ascribed to 3d3/2 and 3d5/2 [40], respectively. The two typical symmetrical peaks of 168.05 eV and 162.71 eV corresponded to S 2p (Figure 2C). The characteristic peaks of C 1s are shown in Figure 2D, the peaks located at 283.88, 285.78, and 287.88 eV belonged to the adventitious carbon sp2 bonded (C=C) or (C-C) [41], sp2 C atoms bonded to N in (N-C=N) aromatic rings [42] and sp3 hybridized C atom C-(N)3 [43], respectively. Two typical peaks of N 1s (Figure 2E) appeared at 399.64 eV and 397.93 eV [44], and the O 1s peak was located at 530.98 eV (Figure 2F) [45]. These results were consistent with those of the HRTEM-EDS analysis.
X-ray diffraction (XRD) patterns of crystal grown from a Dy6-SCN solution were measured to verify that the Dy6-SCN monocrystal had been successfully synthesized (Figure 3A). After the Dy6-SCN solution was modified on the surface of FTO and calcined at 400 °C for 2 h in the N2 atmosphere to form Dy-OSCN/FTO, the characteristic peak of the as-prepared electrode was not obvious and may have been submerged in the characteristic peak of FTO (Figure S1, see the Supplementary Materials). However, in the high resolution XRD pattern (Figure 3B), it was found that the diffraction peak angle of Dy-OSCN/FTO and FTO was offset to a certain extent, indicating that Dy-OSCN was successfully fabricated on the surface of FTO and formed a new crystal plane [37].
The optical absorption could be studied in the UV-Vis diffuse reflectance spectra spectrum of the Dy-OSCN/FTO electrode in Figure 3C. The result demonstrated that the Dy-OSCN/FTO electrode calcined at 400 °C had a strong absorption peak at a wavelength of 300 nm. More importantly, the monocrystal also demonstrated ideal absorption in the whole visible region and part of the near-infrared region, which provided suitable feasibility for using another wavelength to excite semiconductors and realized the analysis of other objects. Based on the UV-vis DRS spectrum, the Kubelka Munk function curve [46] of the Dy-OSCN/FTO electrode was drawn, and the direct bandgap of the Dy-OSCN monocrystal was calculated as 2.765 eV.

3.3. Conditional Optimization

After screening the calcinated temperature of the electrode and the wavelength of the light source, the results were shown in Tables S2 and S3 and Figure S2 (see the Supplementary Materials). The calcinated temperature of 400 °C with a 465 nm excitation light source showed the best linearity (R2 = 0.98) and the strongest potential signals compared to the other conditions.
The optical absorption could be studied in the UV-Vis DRS spectrum of Figure S3A showing that all prepared Dy-OSCN/FTO electrodes calcinated at different temperatures could absorb visible light. The Kubelka–Munk curve (Figure S3B) showed that the widest semiconductor bandgap was reached when the calcinated temperature of 400 °C. At the same time, it can satisfy the excitation conditions of the 465 nm light source. Generally, regarding the continuous excitation to generate carriers, the higher the bending degree of the band in the semiconductor, the more conducive to PEC detection.

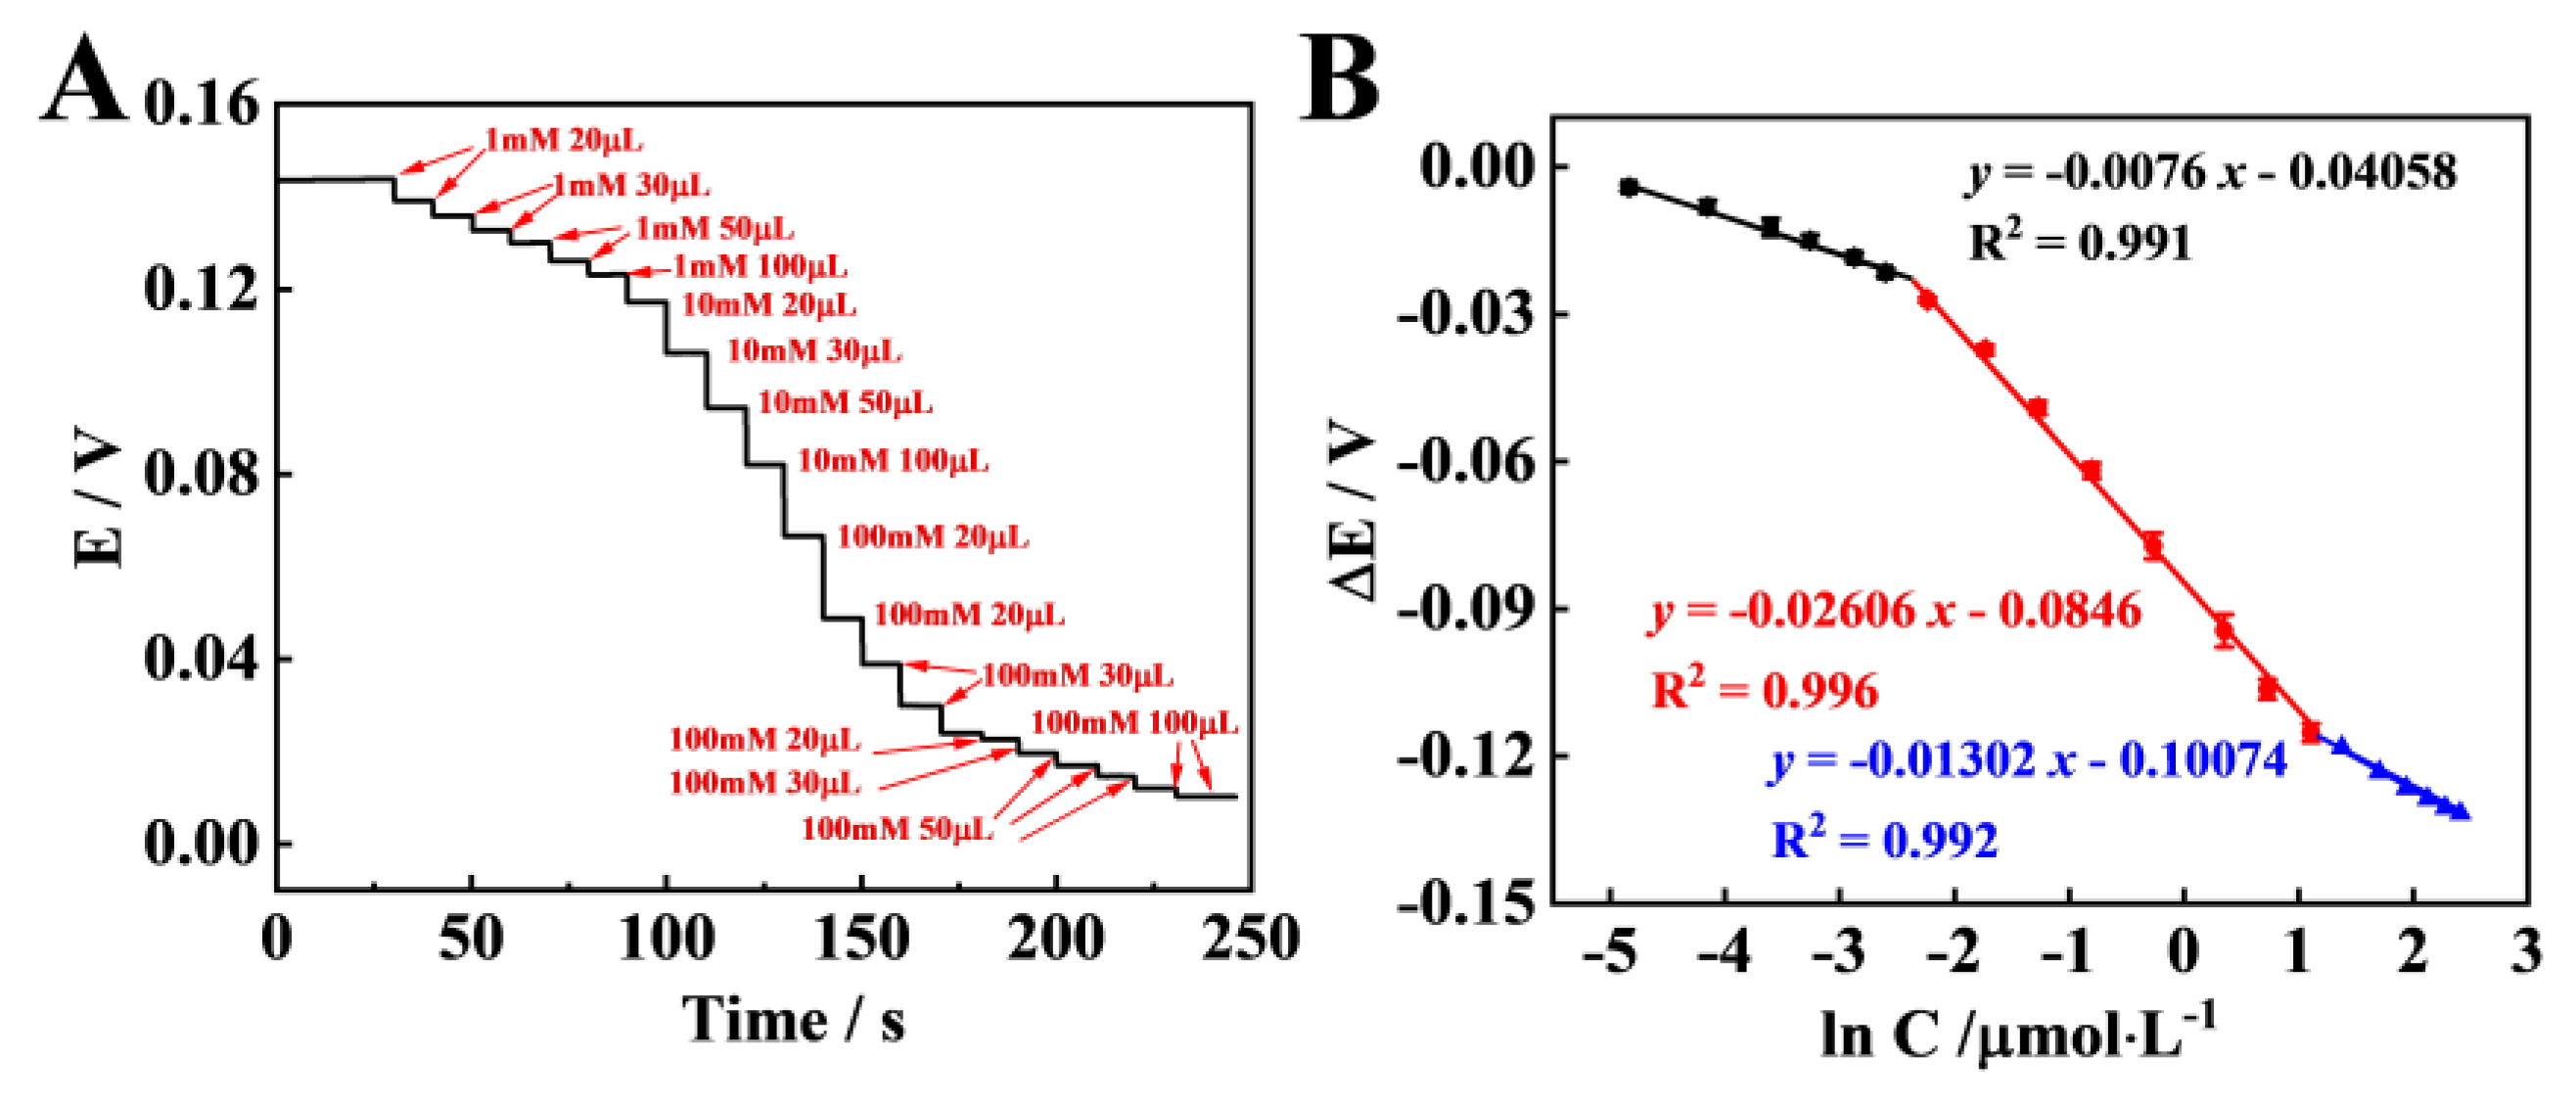
3.4. Analytical Performance of the PEC Sensor

Based on the optimum experimental conditions, the property of the Dy-OSCN/FTO electrode was measured. The potential signals were decreased with the increase in the target concentration in the range of 7.94 μM to 11.13 mM (Figure 4A). In order to verify the response of the electrode to AA, the linear regression equation was calculated (Figure 4B), and there was a good three-step linear relationship between the potential responses and the target concentrations (R2 = 0.991, R2 = 0.996, R2 = 0.992). The concentrations range from 7.94 × 10⁻⁶ mol/L to 7.407 × 10⁻⁵ mol/L, and the linear regression equation was shown as ΔE(V) = −0.0076 C(mM)—0.04058, R2 = 0.991.The concentrations range from 7.407 × 10⁻⁵ mol/L to 3.029 × 10⁻³ mol/L, and the linear regression equation was shown as ΔE(V) = −0.02606 C(mM)—0.0846, R2 = 0.996.The concentrations range from 3.029 × 10⁻³ mol/L to 1.113 × 10⁻² mol/L, and the linear regression equation was shown as ΔE(V) = −0.01302 C(mM)—0.10074, R2 = 0.992.
The detection limit (LOD) could be estimated to be 3.35 μM. The results indicated that the constructed Dy-OSCN/FTO electrode showed good PEC performance and high sensitivity.
To investigate the stability of the Dy-OSCN/FTO electrode, the same Dy-OSCN/FTO electrode was used to detect AA samples with the same concentration 3 times, with the interval between each measurement being 5 days. The result displayed in Figure S4 (see the Supplementary Materials) demonstrated that the signal changed slightly and the RSD was 1.65%, indicating that the electrode had good stability. The thermal analysis data for Dy6-SCN and Dy-OSCN complex also proceeded to verify the stability (Figure S6, see the Supplementary Materials).
To evaluate the selectivity of the PEC aptasensor, an interference study was needed. The most common co-existing biomolecules (glucose (GC), fructose (FC), urea, uric acid (UA), citric acid (CA), L-Proline (L-Pro), L-Threonine (L-Thr), L-Histidine (L-His), L-Lysine (L-Lys), glutathione (GSH)), and inorganic ions (KCl, CaCl2, NaCl, MgCl2, and Na2SO4) in human urine were used as interference factors. As shown in Figure 5A, after the potential signal was stable, the species (GC, FC, KCl, Na2SO4, NaCl) concentrations of 40 mM and the species (urea, UA, CA, L-Pro, L-Thr, L-His, L-Lys, GSH, CaCl2 and MgCl2) concentrations of 4 mM were added to the PEC detection cell in sequence. The potential changes before and after the addition of interferers were recorded and the experiment was repeated three times in each group. According to the recorded data, the chances of detection potential were all less than 15% of the AA standard solution signal, which meant that they had little influence on AA recognition and analysis on the Dy-OSCN/FTO electrode, indicating that the constructed PEC sensor had good specificity.

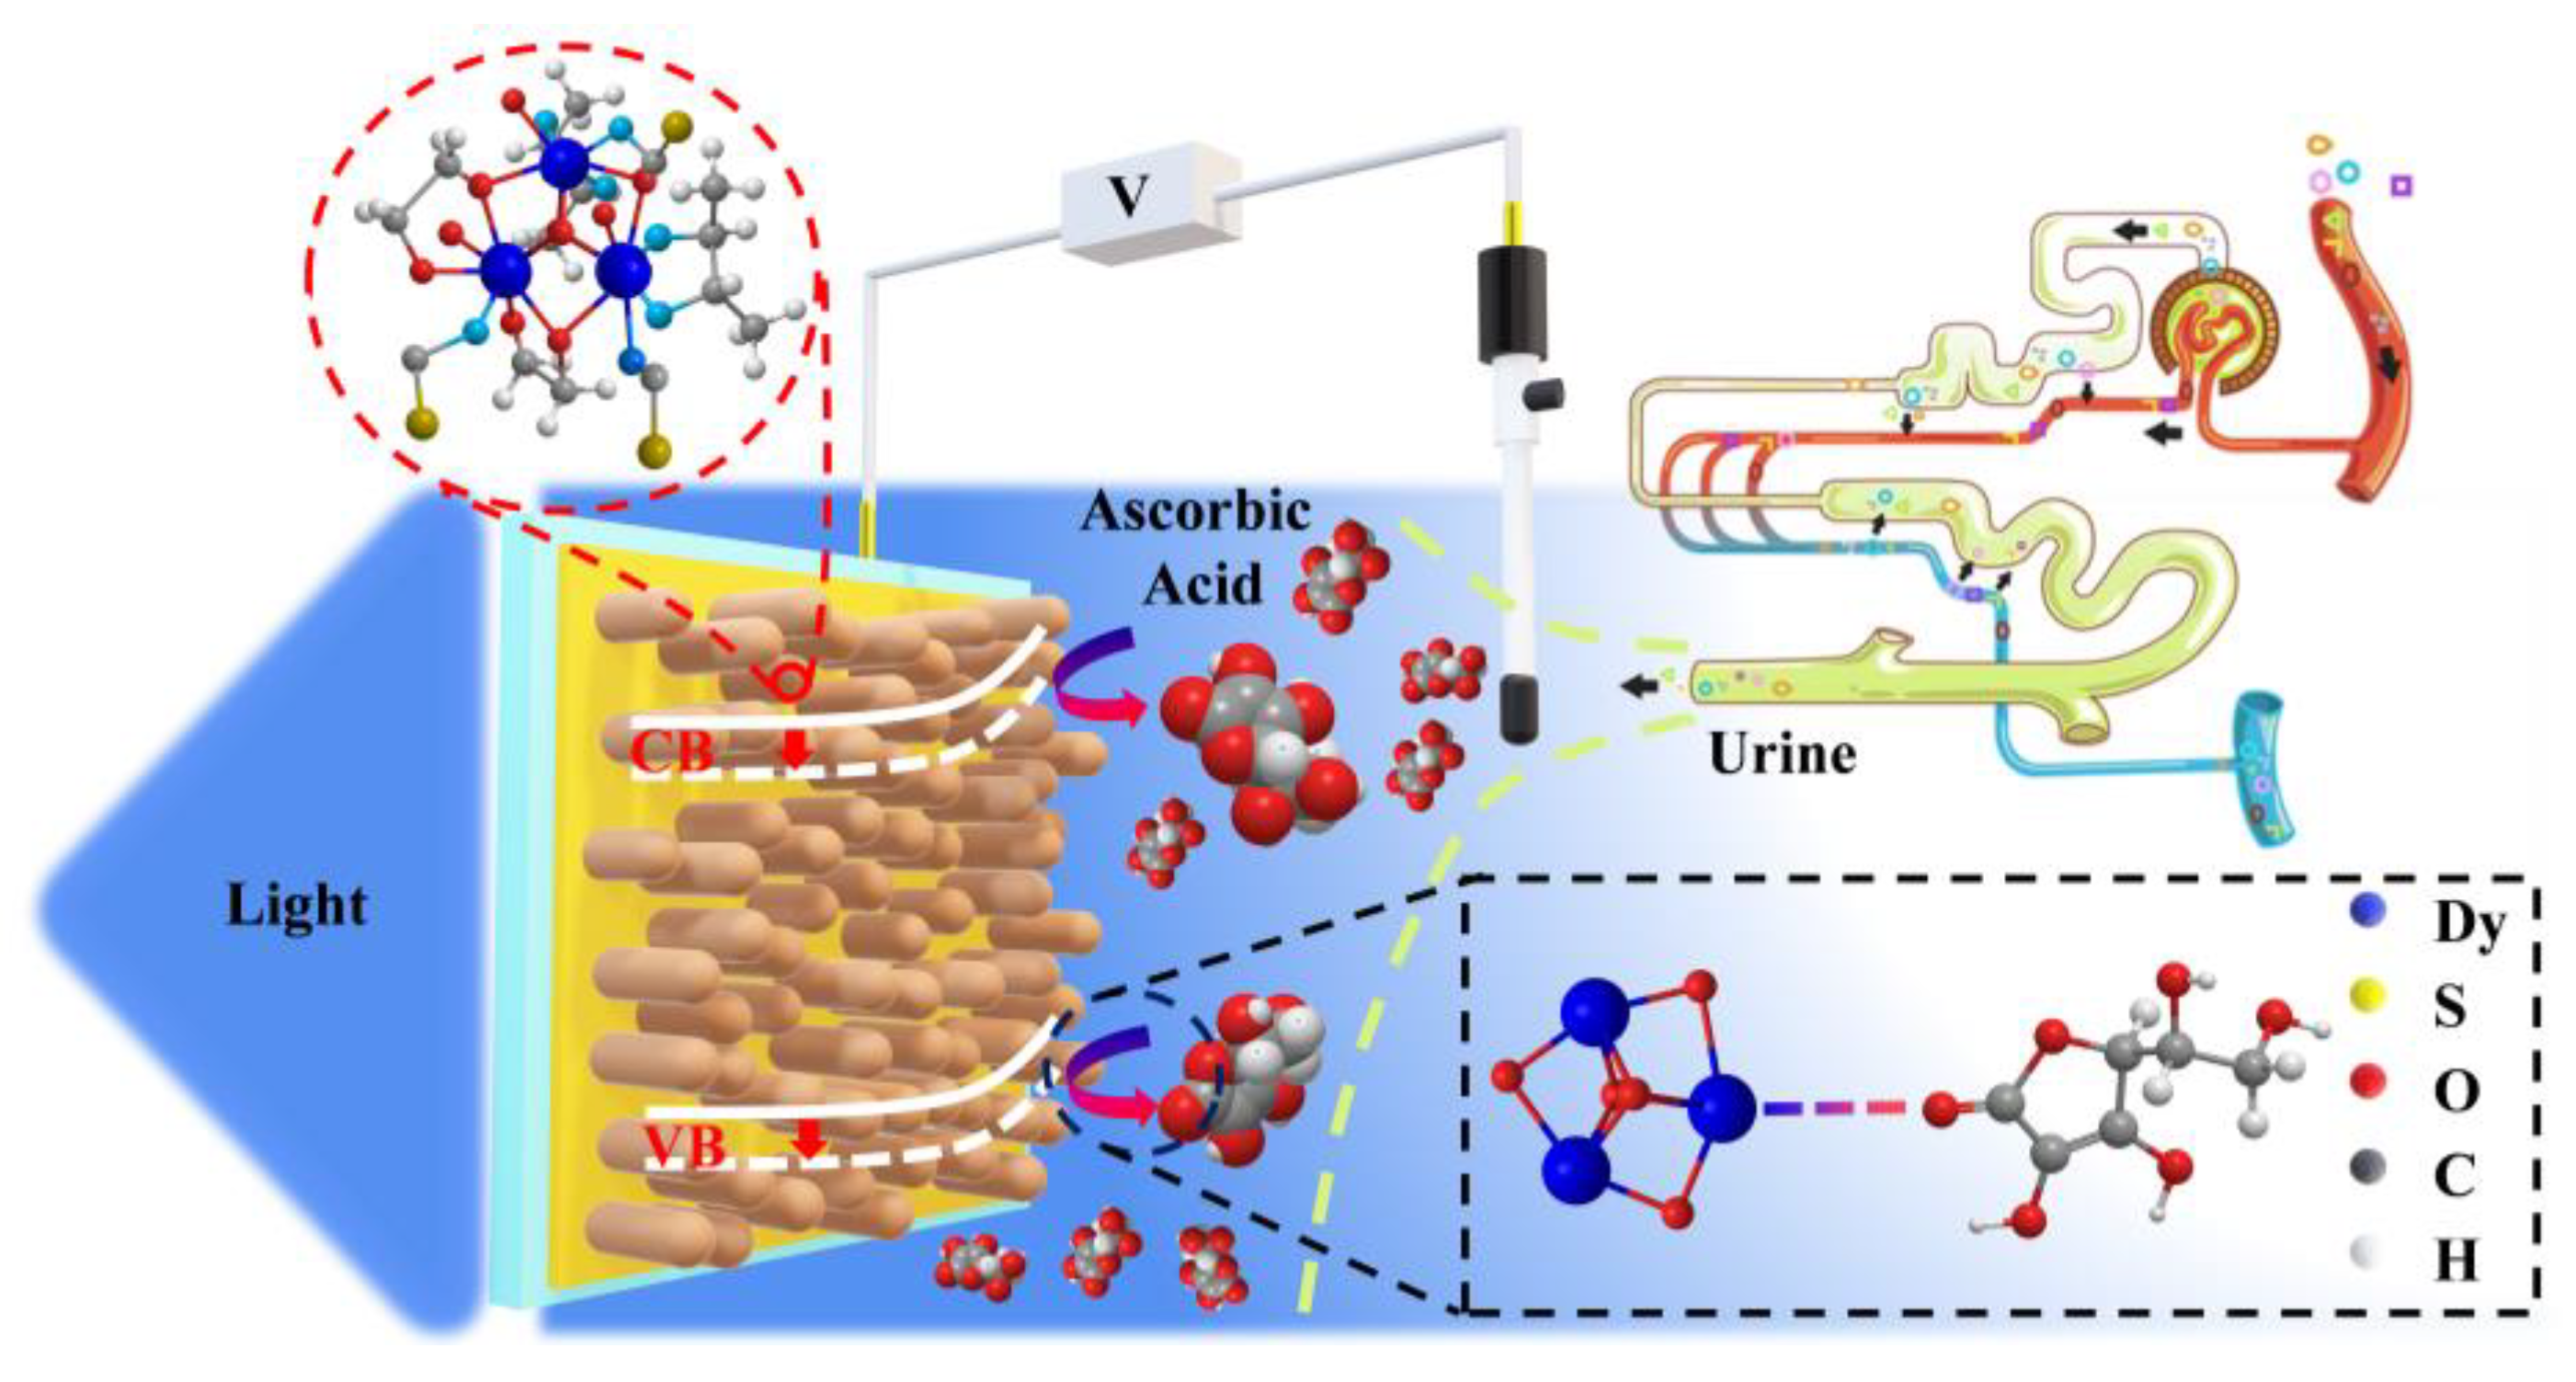
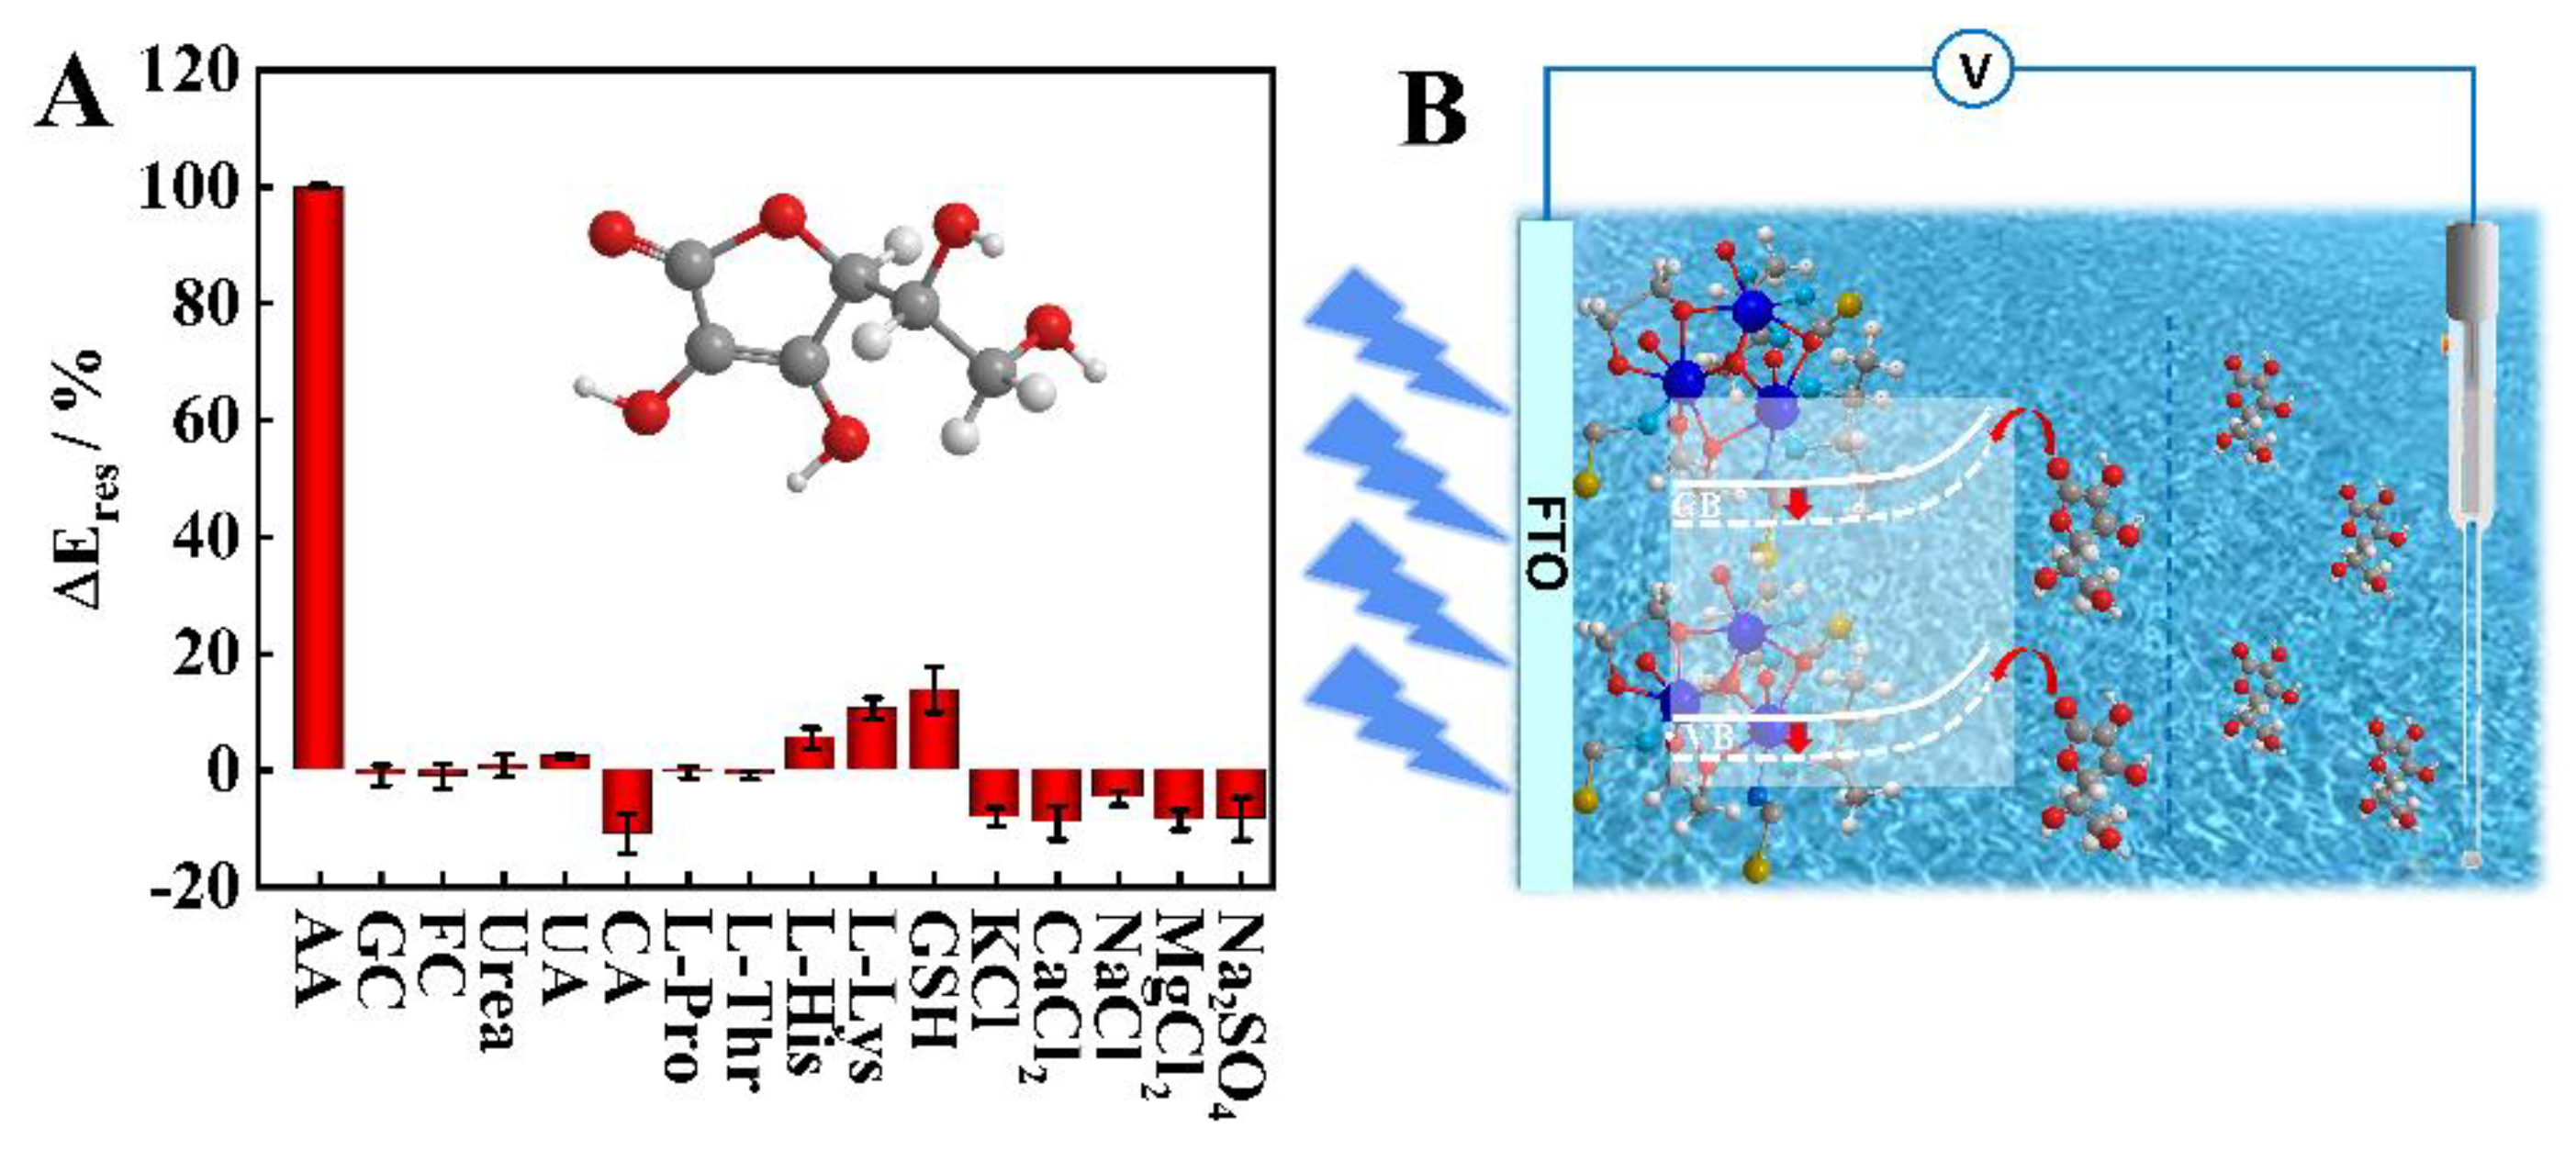
3.5. Mechanism Analysis of AA Detection by Dy-OSCN/FTO PEC Sensor

The possible mechanisms derivation on the Dy-OSCN/FTO PEC sensor was displayed as follows. The amount of charge carried by the specific adsorption of the target substance molecule (AA) on the semiconductor surface (ql) was equal to the charges carried by the material adsorbed on the electrode surface (polar molecular charge displacement), which could be written as qs and expressed as Formula (1):
ql = qs
When the electrode was just entering the solution, some of the electrons moved towards the electrode surface because the Fermi level inside the semiconductor was higher than the Fermi level in the solution. When the charge was balanced, the concentration of the semiconductor carriers at the surface of the solution (nsc) can be calculated according to Formula (2), where ND represents the total amount of charge carriers in a semiconductor conductor. It is a constant for a certain semiconductor under constant external excitation conditions, F is the Faraday constant, R is the ideal gas constant, and T is the test temperature. Since the experiment was conducted at room temperature, the test temperature can be estimated to be 298 K. E − Efb is the potential drop caused by band bending in semiconductors.
nsc = ND·e−F(E−Efb)/RT
Based on this, the charge of the semiconductor surface can be expressed as Formula (3), and e for the charge of an electron:
qs = e·nsc = e·ND·e−F(E−Efb)/RT
According to Freundlich’s adsorption isotherm Equation (4) and the concentration of the specific adsorbent in the solution, the charge of the target substance adsorbed on the electrode surface of the semiconductor material can be calculated by the Formula (5). Γ is the amount of the target substance adsorbed on the surface of the electrode material. kf is the Freundlich adsorption constant. When the electrode material and the target substance are determined, n is the adsorption constant of the specific material. In addition, z is the amount of charge carried by the molecule of the target substance (or the charge offset due to the polarity of the molecule).
Γ = kf·c1/n
ql = z·Γ = z·kf·c1/n
According to the charge balance on both sides of the electrode surface in the no-current state, the equation can be established as follows:
e·ND·e−F(E−Efb)/RT = e·nsc = qs = ql = z·Γ = z·kf·c1/n
It can be obtained by rewriting it to Formula (7)
Δφ = EEfb = −(RT/F) × [ln·(z·kf/e·ND) + ln·c]
Since the potential drop caused by the band bending in the semiconductor is much larger than that in the double layer formed by the semiconductor electrode and the solution, the measured value Δφ is the potential drop in the semiconductor E − Efb.
Let the constant a be equal to (RT/F), and the constant b be equal to (RT/F) × ln·(z·kf); the Formula (7) can be changed to Formula (8):
Δφ = a·lnc + b
It can be observed from the derived formula that the logarithm of the test potential and the concentration of the target substance in the solution is linear when the electrode uses the OCPT method to measure the concentration of the target substance in the solution. The results of practical tests are in good agreement with the derived expressions.
Thus, the possible detection mechanism scheme of AA on the Dy-OSCN/FTO PEC sensor can be indicated as shown in Figure 5B, a typical specific adsorption happened after the AA molecules diffused into the double layer at the electrode interface. The AA molecules would bond with the central atom of the crystal on the electrode surface (Scheme 1), which would affect the charge distribution on the electrode surface and change the bending state of the energy band inside the Dy-OSCN monocrystal, resulting in the changes of the potential responses. According to the classical formula of capacitance formed by band bending in the semiconductor and the capacitance of the interface double layer in semiconductor physics, the potential drop in the double layer is much smaller than the potential drop caused by band bending in the semiconductor, which has also been verified by the experiments of countless scientists. Based on this, the potential changes measure at the macro level are almost due to the band bending changes in the semiconductor. When the semiconductor is excited by light, the total number of carriers will increase, leading to the amount of charge reaching the electrode surface increasing due to the mutual repulsion of the same charge, which can absorb more charged molecules. Moreover, under the constant excitation wavelength and power, the separation and the recombination of carriers in the semiconductor will reach an equilibrium, and the concentration of carriers in the semiconductor would remain constant if the external environment of the semiconductor does not change. Once the external charge change causes the changes in semiconductor surface potential, the band bending degree in the semiconductor will change. According to the above theory, the changes in charge density between the semiconductor and the detecting system will cause a change in the internal band bending, leading to the potential difference between the working electrode and the reference electrode. Meanwhile, based on the classical electrochemical theory, the system of open-circuit potential detection was equivalent to a short circuit, in which almost no current flowed through the electrode, and the Fermi energy levels on both sides of the electrode surface were the same. By deriving the formula above, it can be found that the potential signal is only related to the concentration of the target in the solution, and the potential signal changes when the excited state is changed. The enhancement of the charge ability in the detection system would lead to an increase in the changing intensity of the potential responses, so the detection sensitivity would also increase. Therefore, the sensitivity of the Dy-OSCN/FTO electrode under light excitation is higher than that measured under a dark field, and the formula derivation and mechanism analysis lay a theoretical foundation for the method of AA detection.
As can be observed in the spectrum of FT-IR spectra in Figure 6A, the Fourier transform infrared (FTIR) spectrum of Dy6-SCN and Dy-OSCN demonstrates that the phenol structure in Dy6-SCN was easily oxidized to quinone, leading to changes in the coordination between the ligand and Dy in the Dy-OSCN complex. Moreover, the wavelength located at 1250–2250 cm−1 had multiple absorption peaks displacement, indicating that under the high temperature, the coordination of N on the pyrimidine and metal Dy dissociates, resulting in the partial collapse of the structure and asymmetry of the structure, which makes it easier for AA to coordinate with Dy-OSCN. To further study the specific response principle of the Dy-OSCN/FTO electrode, FT-IR spectra of the Dy-OSCN monocrystal before and after the (unwashed) binding with AA were characterized in Figure 6B,C. The spectrum of FT-IR spectra range from 500–2500 cm−1 was shown in Figure 6C, which had multiple absorption peaks displacement, indicating that the asymmetric C≡N bond stretching energy of Dy-OSCN had changed [47]. In addition the band at about 1256 cm−1 could be attributed to the ν(C-O) mode of phenol [48]. The result verified that the AA molecule was specifically bonded to the surface of the Dy-OSCN/FTO electrode and formed coordination bonds, leading to the changes in the potential signal [37].
According to Fermi energy level theory, charge balance theory, previous calculation, and experimental verification, the mechanism formula was deduced to lay a theoretical foundation for the rationality of the strategy. Based on the structure of the electrode material and target molecule, the possible detection mechanism speculated that the AA molecule was specially adsorbed and bonded with Dy-OSCN. During this process, the change of the charge on the interface caused the change of the band bending in the semiconductor and the change of photoelectric potential measurement. It was found that the peak positions of Dy-OSCN shifted significantly after AA detection. Thus, the rationality of the guessing mechanism was proved theoretically and practically.

3.6. Practical Application of the PEC Sensor in Real Human Urine Samples

Compared with other reported enzyme-free PEC methods in AA detection (Table 1), the detection range of the method adopted in this work has been broadened to some extent. At the same time, the LOD of the detection method used in this work is lower than that of the method with a similar detection range. Therefore, using OCPT technology and Dy-OSCN/FTO electrode to detect AA has obvious advantages.
To further investigate the actual performance of the Dy-SCN/FTO PEC sensor for the AA detection in humane urine, the real urine samples containing the AA concentration of 0.82569 mM, 1.107143 mM, and 1.37391 mM were detected, and the result was shown in Table 2. The recoveries of this detection method were all close to 100%. The stability and reproducibility could be observed from the RSD data (absolute values are all less than 1%), indicating the practicability of the Dy-OSCN/FTO PEC sensor for the detection of AA and further verifying the potential application value of the as-prepared electrode in actual sample analysis.

4. Conclusions

In summary, a novel enzyme-free photoelectrochemical (PEC) potential measurement system based on Dy-OSCN was developed for the determination of ascorbic acid (AA) in human urine. The as-prepared Dy-OSCN/FTO PEC sensor demonstrated a good linear range from 7.94 μM to 11.13 mM and a low detection limit of 3.35 μM. The electrode had good stability and repeatability after several detecting operations. Thus, a PEC sensor with ideal sensitivity and selectivity for AA determination was successfully constructed. Moreover, the rationality of the guessing mechanism and the FT-IR result verified that the AA molecule was specifically bonded to the surface of the Dy-OSCN/FTO electrode and formed coordination bonds. Such a PEC sensor was also successfully used to analyze AA in human urine samples, indicating a wide potential application for further use in the rapid and non-invasive assessment of AA levels in human physique monitoring.

Supplementary Materials

The following supporting information can be downloaded at: https://www.mdpi.com/article/10.3390/chemosensors10070268/s1, Table S1: High resolution projected electron microscope electron energy spectrum (HRTEM-EDS) element total distribution table of Dy-OSCN/FTO photoelectric detection electrode calcined at 400 °C. Table S2: Optimized conditions of the calcination temperature of Dy-OSCN /FTO electrode. Table S3: Optimized conditions of the excitation wavelength of Dy-OSCN /FTO electrode. Figure S1: X-ray diffraction (XRD) images of Dy-OSCN/FTO and FTO electrode. Figure S2: (A) Linear (R2) comparison and (B) low concentration signal intensity of AA tests with Dy-OSCN/FTO electrodes at calcination temperatures of 300 °C, 400 °C and 500 °C under 10 W LED light excitation at 630 nm, 535 nm, 465 nm and 420 nm. Figure S3: (A) UV diffuse reflectometry of Dy-OSCN/FTO electrode at calcination temperatures of 150 °C, 200 °C, 300 °C, 400 °C and 500 °C; (B) Kubelka–Munk curves of Dy-OSCN/FTO photoelectric detection electrodes at calcination temperatures of 150 °C, 200 °C, 300 °C, 400 °C and 500 °C. Figure S4: Parallel line test diagram of the same Dy-OSCN/FTO electrode for AA determination. Figure S5: The structural of [Dy33-O)22-O)3]. Figure S6: Thermogravimetric Analysis of Dy6SCN and Dy-OSCN. Figure S7: The thickness of the active layer on the surface of the electrode.

Author Contributions

Conceptualization, Z.Z. and D.H. (Dongfang Han); Data curation, R.X., T.W. and Z.L.; Formal analysis, Z.Z., D.H. (Dongfang Han), Z.L. and D.H. (Dongxue Han); Funding acquisition, D.H. (Dongxue Han) and L.N.; Investigation, D.H. (Dongfang Han) and Y.M.; Methodology, Z.Z., D.H. (Dongfang Han), R.X. and T.W.; Project administration, D.H. (Dongxue Han) and L.N.; Resources, D.H. (Dongxue Han) and L.N.; Software, Z.Z., D.H. (Dongfang Han), R.X. and Z.L.; Supervision, T.W., Z.W., F.H., D.H. (Dongxue Han), Y.M. and L.N.; Validation, R.X., T.W., Z.W. and F.H.; Visualization, Z.Z., D.H. (Dongfang Han), Z.L. and D.H. (Dongxue Han); Writing—Original draft, Z.Z., D.H. (Dongfang Han) and Z.L.; Writing—Review and editing, Z.Z., D.H. (Dongfang Han) and D.H. (Dongxue Han). All authors have read and agreed to the published version of the manuscript.

Funding

This work was sponsored by the National Natural Science Foundation of China (22172040, 21974031), the Department of Science and Techniques of Guangdong Province (2021A1515010180, 2019B010933001), Guangzhou Municipal Science and Technology Bureau (202102010449), and the Department of Guangdong Provincial Public Security (GZQC20-PZ11-FD084).

Institutional Review Board Statement

Not applicable.

Informed Consent Statement

Not applicable.

Data Availability Statement

Not applicable.

Conflicts of Interest

The authors declare no conflict of interest.

References

  1. Padayatty, S.J.; Levine, M. Vitamin C: The known and the unknown and Goldilocks. Oral Dis. 2016, 22, 463–493. [Google Scholar] [CrossRef] [PubMed] [Green Version]
  2. Foyer, C.H.; Noctor, G. Ascorbate and glutathione: The heart of the redox hub. Plant Physiol. 2011, 155, 2–18. [Google Scholar] [CrossRef] [Green Version]
  3. Hieu, T.V.; Guntoro, B.; Qui, N.H.; Quyen, N.T.K.; Al Hafiz, F.A. The application of ascorbic acid as a therapeutic feed additive to boost immunity and antioxidant activity of poultry in heat stress environment. Vet. World 2022, 15, 685–693. [Google Scholar] [CrossRef] [PubMed]
  4. Njus, D.; Kelley, P.M.; Tu, Y.J.; Schlegel, H.B. Ascorbic acid: The chemistry underlying its antioxidant properties. Free Radic. Biol. Med. 2020, 159, 37–43. [Google Scholar] [CrossRef] [PubMed]
  5. Traber, M.G.; Stevens, J.F. Vitamins C and E: Beneficial effects from a mechanistic perspective. Free Radic. Biol. Med. 2011, 51, 1000–1013. [Google Scholar] [CrossRef] [Green Version]
  6. Carr, A.C.; Maggini, S. Vitamin C and immune function. Nutrients 2017, 9, 1211. [Google Scholar] [CrossRef] [Green Version]
  7. Smirnoff, N. Ascorbic acid metabolism and functions: A comparison of plants and mammals. Free Radic. Biol. Med. 2018, 122, 116–129. [Google Scholar] [CrossRef]
  8. Lykkesfeldt, J.; Tveden-Nyborg, P. The pharmacokinetics of vitamin C. Nutrients 2019, 11, 2412. [Google Scholar] [CrossRef] [Green Version]
  9. Das, A.; Yadav, R.N.; Banik, B.K. Ascorbic acid-mediated reactions in organic synthesis. Curr. Organocatal. 2020, 7, 212–241. [Google Scholar] [CrossRef]
  10. Kashiouris, M.G.; L’Heureux, M.; Cable, C.A.; Fisher, B.J.; Leichtle, S.; Fowler, A.A. The emerging role of vitamin C as a treatment for sepsis. Nutrients 2020, 12, 292. [Google Scholar] [CrossRef] [Green Version]
  11. Fowler, A.A.; Syed, A.A.; Knowlson, S.; Sculthorpe, R.; Farthing, D.; DeWilde, C.; Farthing, C.A.; Larus, T.L.; Martin, E.; Brophy, D.F.; et al. Phase I safety trial of intravenous ascorbic acid in patients with severe sepsis. J. Transl. Med. 2014, 12, 32. [Google Scholar] [CrossRef] [PubMed] [Green Version]
  12. Ravetti, S.; Clemente, C.; Brignone, S.; Hergert, L.; Allemandi, D.; Palma, S. Ascorbic acid in skin health. Cosmetics 2019, 6, 58. [Google Scholar] [CrossRef] [Green Version]
  13. Sun, C.; Lee, H.; Yang, J.; Wu, C. The simultaneous electrochemical detection of ascorbic acid, dopamine, and uric acid using graphene/size-selected Pt nanocomposites. Biosens. Bioelectron. 2011, 26, 3450–3455. [Google Scholar] [CrossRef] [PubMed]
  14. Siddeeg, S.M.; Alsaiari, N.S.; Tahoon, M.A.; Ben Rebah, F. The application of nanomaterials as electrode modifiers for the electrochemical detection of ascorbic acid: Review. Int. J. Electrochem. Sci. 2020, 15, 3327–3346. [Google Scholar] [CrossRef]
  15. Attia, T.Z. Simultaneous determination of rutin and ascorbic acid mixture in their pure forms and combined dosage form. Spectrochim. Acta Part A-Mol. Biomol. Spectrosc. 2016, 169, 82–86. [Google Scholar] [CrossRef]
  16. Ribeiro, M.; Prado, A.; Batista, A.; Munoz, R.A.A.; Richter, E.M. Rapid method for simultaneous determination of ascorbic acid and zinc in effervescent tablets by capillary zone electrophoresis with contactless conductivity detection. J. Sep. Sci. 2019, 42, 754–759. [Google Scholar] [CrossRef]
  17. Costa, B.M.C.; Prado, A.A.; Oliveira, T.C.; Bressan, L.P.; Munoz, R.A.A.; Batista, A.D.; da Silva, J.A.F.; Richter, E.M. Fast methods for simultaneous determination of arginine, ascorbic acid and aspartic acid by capillary electrophoresis. Talanta 2019, 204, 353–358. [Google Scholar] [CrossRef]
  18. Liu, K.; Zhao, Y.; Zhang, L.; He, M.M.; Lin, W.F.; Sun, H.T.; Liu, Z.W.; Hu, J.; Wang, L.G. Biocompatible platinum nanoclusters prepared using bitter gourd polysaccharide for colorimetric detection of ascorbic acid. Biomolecules 2021, 11, 647. [Google Scholar] [CrossRef]
  19. Iranmanesh, T.; Foroughi, M.M.; Jahani, S.; Zandi, M.S.; Nadiki, H.H. Green and facile microwave solvent-free synthesis of CeO2 nanoparticle-decorated CNTs as a quadruplet electrochemical platform for ultrasensitive and simultaneous detection of ascorbic acid, dopamine, uric acid and acetaminophen. Talanta 2020, 207, 120318. [Google Scholar] [CrossRef]
  20. Zhang, X.; Zhang, Y.; Ma, L. One-pot facile fabrication of graphene-zinc oxide composite and its enhanced sensitivity for simultaneous electrochemical detection of ascorbic acid, dopamine and uric acid. Sens. Actuators B-Chem. 2016, 227, 488–496. [Google Scholar] [CrossRef]
  21. Baghizadeh, A.; Karimi-Maleh, H.; Khoshnama, Z.; Hassankhani, A.; Abbasghorbani, M. A voltammetric sensor for simultaneous determination of vitamin C and vitamin B-6 in food samples using ZrO2 nanoparticle/ionic liquids carbon paste electrode. Food Anal. Methods 2015, 8, 549–557. [Google Scholar] [CrossRef]
  22. Wang, X.; Long, C.; Jiang, Z.; Qing, T.; Zhang, K.; Zhang, P.; Feng, B. In situ synthesis of fluorescent copper nanoclusters for rapid detection of ascorbic acid in biological samples. Anal. Methods 2019, 11, 4580–4585. [Google Scholar] [CrossRef]
  23. Wang, X.; Watanabe, H.; Uchiyama, S. Amperometri L-ascorbic acid biosensors equipped with enzyme micelle membrane. Talanta 2008, 74, 1681–1685. [Google Scholar] [CrossRef] [PubMed]
  24. Chen, Z.; Peng, Z.; Jiang, J.; Zhang, X.; Shen, G.; Yu, R. An electrochemical amplification immunoassay using biocatalytic metal deposition coupled with anodic stripping voltammetric detection. Sens. Actuators B-Chem. 2008, 129, 146–151. [Google Scholar] [CrossRef]
  25. Yang, H. Enzyme-based ultrasensitive electrochemical biosensors. Curr. Opin. Chem. Biol. 2012, 16, 422–428. [Google Scholar] [CrossRef]
  26. Li, R.; Liu, Q.; Jin, Y.; Li, B. Fluorescent enzyme-linked immunoassay strategy based on enzyme-triggered in-situ synthesis of fluorescent copper nanoclusters. Sens. Actuators B-Chem. 2019, 281, 28–33. [Google Scholar] [CrossRef]
  27. Cao, J.; Wang, M.; Yu, H.; She, Y.X.; Cao, Z.; Ye, J.M.; Abd El-Aty, A.M.; Hacimuftuoglu, A.; Wang, J.; Lao, S.B. An overview on the mechanisms and applications of enzyme inhibition-based methods for determination of organophosphate and carbamate pesticides. J. Agric. Food Chem. 2020, 68, 7298–7315. [Google Scholar] [CrossRef]
  28. Wang, Z.; Mao, S.; Ogata, H. Facile low-temperature growth of carbon nanosheets toward simultaneous determination of dopamine, ascorbic acid and uric acid. Analyst 2011, 136, 4903–4905. [Google Scholar] [CrossRef]
  29. Zhao, D.; Yu, G.; Tian, K.; Xu, C. A highly sensitive and stable electrochemical sensor for simultaneous detection towards ascorbic acid, dopamine, and uric acid based on the hierarchical nanoporous PtTi alloy. Biosens. Bioelectron. 2016, 82, 119–126. [Google Scholar] [CrossRef]
  30. Peng, J.; Ling, J.; Zhang, X.; Zhang, L.; Cao, Q.; Ding, Z. A rapid, sensitive and selective colorimetric method for detection of ascorbic acid. Sens. Actuators B-Chem. 2015, 221, 708–716. [Google Scholar] [CrossRef]
  31. Zhao, J.; Yan, Z.; Qin, L.; Feng, X.; Wang, P. Application of cuprous oxide nanowires in an electrochemical sensor for ascorbic acid. Chem. Lett. 2014, 43, 814–816. [Google Scholar] [CrossRef]
  32. Kim, S.J.; Cho, Y.K.; Lee, C.; Kim, M.H.; Lee, Y. Real-time direct electrochemical sensing of ascorbic acid over rat liver tissues using RuO2 nanowires on electrospun TiO2 nanofibers. Biosens. Bioelectron. 2016, 77, 1144–1152. [Google Scholar] [CrossRef] [PubMed]
  33. Malinauskas, A.; Garjonyte, R.; Mazeikiene, R.; Jureviciute, I. Electrochemical response of ascorbic acid at conducting and electrogenerated polymer modified electrodes for electroanalytical applications: A review. Talanta 2004, 64, 121–129. [Google Scholar] [CrossRef] [PubMed]
  34. Zhang, X.; Lai, G.; Yu, A.; Zhang, H. A glassy carbon electrode modified with a polyaniline doped with silicotungstic acid and carbon nanotubes for the sensitive amperometric determination of ascorbic acid. Microchim. Acta 2013, 180, 437–443. [Google Scholar] [CrossRef]
  35. Raj, C.R.; Tokuda, K.; Ohsaka, T. Electroanalytical applications of cationic self-assembled monolayers, square-wave voltammetric determination of dopamine and ascorbate. Bioelectrochemistry 2001, 53, 183–191. [Google Scholar] [CrossRef]
  36. Dong, X.; Liu, D.; Meng, X.; You, T. Research progress on photoelectrochemical sensors for contamination analysis in agricultural fields. Anal. Sci. 2022, 38, 459–481. [Google Scholar] [CrossRef]
  37. Raizada, M.; Shahid, M.; Hussain, S.; Ashafaq, M.; Siddiqi, Z.A. A new antiferromagnetic Dy6 oxido-material as a multifunctional aqueous phase sensor for picric acid as well as Fe3+ ions. Mater. Adv. 2020, 1, 3518–3531. [Google Scholar] [CrossRef]
  38. Wu, L.; Yang, H.; Zeng, S.; Li, D.; Dou, J. A family of hexanuclear lanthanide complexes with slow magnetic relaxation for Dy6 cluster. Polyhedron 2017, 129, 77–81. [Google Scholar] [CrossRef]
  39. Li, X.; Li, H.; Chen, D.; Wang, C.; Wu, J.F.; Tang, J.; Shi, W.; Cheng, P. Planar Dy3+Dy3 clusters: Design, structure and axial ligand perturbed magnetic dynamics. Dalton Trans. 2015, 44, 20316–20320. [Google Scholar] [CrossRef]
  40. Munirathnam, K.; Nagajyothi, P.C.; Prakashbabu, D.; Deva Prasad Raju, B.; Shim, J. X-ray photoelectron spectroscopy and optical analysis of pure white light emitting Dy3+ and Mn2+ codoped Na3Y(PO4)2 phosphors for solid-state lighting. Ceram. Int. 2019, 45, 686–694. [Google Scholar] [CrossRef]
  41. Zalfani, M.; Van der Schueren, B.; Hu, Z.; Rooke, J.C.; Bourguiga, R.; Wu, M.; Li, Y.; Van Tendeloo, G.; Su, B. Novel 3DOM BiVO4/TiO2 nanocomposites for highly enhanced photocatalytic activity. J. Mater. Chem. A 2015, 3, 21244–21256. [Google Scholar] [CrossRef]
  42. Jiang, J.; Yu, J.; Cao, S. Au/PtO nanoparticle-modified g-C3N4 for plasmon-enhanced photocatalytic hydrogen evolution under visible light. J. Colloid Interface Sci. 2016, 461, 56–63. [Google Scholar] [CrossRef] [PubMed]
  43. Le, S.; Jiang, T.; Zhao, Q.; Liu, X.; Li, Y.; Fang, B.; Gong, M. Cu-doped mesoporous graphitic carbon nitride for enhanced visible-light driven photocatalysis. RSC Adv. 2016, 6, 38811–38819. [Google Scholar] [CrossRef]
  44. Wang, Q.; Li, J.; Zhang, J.; Zhu, G.; Zheng, H.; Cong, R. Novel self-assembled microstructures made from Dy doped AlN nanosheets: Formation mechanism, photoluminescence and magnetic properties. Appl. Surf. Sci. 2020, 527, 146825. [Google Scholar] [CrossRef]
  45. Zikriya, M.; Nadaf, Y.F.; Bharathy, P.V.; Renuka, C.G. Luminescent characterization of rare earth Dy3+ ion doped TiO2 prepared by simple chemical co-precipitation method. J. Rare Earths 2019, 37, 24–31. [Google Scholar] [CrossRef]
  46. Myrick, M.L.; Simcock, M.N.; Baranowski, M.; Brooke, H.; Morgan, S.L.; McCutcheon, J.N. The Kubelka-Munk diffuse reflectance formula revisited. Appl. Spectrosc. Rev. 2011, 46, 140–165. [Google Scholar] [CrossRef]
  47. Wu, J.; Demeshko, S.; Dechert, S.; Meyer, F. Macrocycle based dinuclear dysprosium(III) single molecule magnets with local D5h coordination geometry. Dalton Trans. 2021, 50, 17573–17582. [Google Scholar] [CrossRef]
  48. Lin, S.Y.; Wang, C.; Zhao, L.; Tang, J. Enantioselective self-assembly of triangular Dy3 clusters with single-molecule magnet behavior. Chem. Asian J. 2014, 9, 3558–3564. [Google Scholar] [CrossRef]
  49. Kim, S.J.; Kim, Y.L.; Yu, A.; Lee, J.; Lee, S.C.; Lee, C.; Kim, M.H.; Lee, Y. Electrospun iridium oxide nanofibers for direct selective electrochemical detection of ascorbic acid. Sens. Actuators B-Chem. 2014, 196, 480–488. [Google Scholar] [CrossRef]
  50. You, Q.; Liu, T.; Pang, J.; Jiang, D.; Chu, Z.; Jin, W. In situ fabrication of CuO nanowire film for high-sensitive ascorbic acid recognition. Sens. Actuators B-Chem. 2019, 296, 126617. [Google Scholar] [CrossRef]
  51. Yang, H.; Zhao, J.; Qiu, M.; Sun, P.; Han, D.; Niu, L.; Cui, G. Hierarchical bi-continuous Pt decorated nanoporous Au-Sn alloy on carbon fiber paper for ascorbic acid, dopamine and uric acid simultaneous sensing. Biosens. Bioelectron. 2019, 124, 191–198. [Google Scholar] [CrossRef] [PubMed]
  52. Jothi, L.; Neogi, S.; Jaganathan, S.K.; Nageswaran, G. Simultaneous determination of ascorbic acid, dopamine and uric acid by a novel electrochemical sensor based on N2/Ar RF plasma assisted graphene nanosheets/graphene nanoribbons. Biosens. Bioelectron. 2018, 105, 236–242. [Google Scholar] [CrossRef] [PubMed]
  53. Atacan, K.; Guy, N.; Ozacar, M. Preparation of gold decorated MoS2/NiO nanocomposite in the production of a new electrochemical sensor for ascorbic acid detection. Korean J. Chem. Eng. 2022, 1–10. [Google Scholar] [CrossRef]
  54. Wang, Q.; Xiao, X.; Hu, X.; Huang, L.; Li, T.; Yang, M. Molecularly imprinted electrochemical sensor for ascorbic acid determination based on MXene modified electrode. Mater. Lett. 2021, 285, 129158. [Google Scholar] [CrossRef]
  55. Qu, C.; Li, H.; Zhou, S.; Li, G.; Wang, C.; Snyders, R.; Bittencourt, C.; Li, W. Bi2S3/rGO Composite Based Electrochemical Sensor for Ascorbic Acid Detection. Chemosensors 2021, 9, 190. [Google Scholar] [CrossRef]
  56. Ma, Y.; Zhang, Y.; Wang, L. An electrochemical sensor based on the modification of platinum nanoparticles and ZIF-8 membrane for the detection of ascorbic acid. Talanta 2021, 226, 122105. [Google Scholar] [CrossRef]
Figure 1. (A) Synthesis process of the Dy-OSCN monocrystal photocatalysts; (B) SEM image, (C) TEM image and (DK) HR-TEM image of Dy-OSCN; (EJ) EDS images of Dy-OSCN.
Chemosensors 10 00268 g001
Figure 2. (A) Total X-ray photoelectron spectroscopy (XPS) spectra of Dy-OSCN/FTO electrode; high-resolution XPS spectra of (B) Dy 3d, (C) S 2p, (D) C 1s, (E) N 1s, and (F) O 1s.
Chemosensors 10 00268 g002
Figure 3. (A) X−ray diffraction (XRD) images of Dy6−SCN; (B) fine XRD patterns of Dy−OSCN/FTO electrode; (C) UV−vis DRS and Tauc plots of as-prepared Dy−OSCN/FTO electrode calcined at 400 °C.
Chemosensors 10 00268 g003
Figure 4. (A) Potential responses of the Dy−OSCN/FTO electrode at different concentrations of AA in the range of 7.94 μM to 13.71 mM; (B) the corresponding linear calibration curve for AA detection.
Chemosensors 10 00268 g004
Figure 5. (A) Selectivity of the PEC sensor to AA interferes including GC, FC, urea, UA, CA, L-Pro, L-Thr, L-His, L-Lys, GSH, KCl, CaCl2, NaCl, MgCl2 and Na2SO4; (B) diagram of possible detection mechanism of AA on enzyme-free Dy-OSCN/FTO PEC sensor.
Chemosensors 10 00268 g005
Scheme 1. Schematic diagram of Dy-SCN/FTO PEC sensor detecting AA.
Chemosensors 10 00268 sch001
Figure 6. The Fourier transform infrared (FTIR) spectrum of (A) Dy6−SCN and Dy−OSCN; (B) Dy−OSCN monocrystal before and after (unwashed) binding with AA; (C) a larger version of A (500 − 2500 cm−1).
Chemosensors 10 00268 g006
Table 1. Comparison of linear range and detection limit of enzyme-free electrochemical methods for determination of AA.
Modified MaterialsLinear Range (μM)LOD (μM)References
Iridium Oxide1–1000<0.4[49]
CuO20–1000.05[50]
Pt(Au-Sn) alloy200–200013.4[51]
N2/Ar/RFGraphene100–14005.3 × 10−3[52]
Au-MoS2/NiO2–500.13[53]
MIPs/MXene/GCE0.5–100.27[54]
Bi2S3/rGO5–12002.9[55]
ZIF-8/Pt NPs/GCE10–25005.2[56]
Dy-SCN/FTO7.94–11,1303.35This work
Table 2. Recovery of AA in human urine by Dy-OSCN/FTO photoelectric detection electrode.
SampleSpiked (mM)Found (mM)Recovery (%)RSD (%)
Urine0.825690.828 ± 0.00879100.280.506141
1.071431.0927 ± 0.06531101.990.670382
1.379311.4076 ± 0.09329102.050.996175
RSD (%) = (Standard deviation/the average of the data obtained by repeating 3 times) × 100%.
Publisher’s Note: MDPI stays neutral with regard to jurisdictional claims in published maps and institutional affiliations.

