Article

Promising Novel Barium Carbonate One-Dimensional Nanostructures and Their Gas Sensing Application: Preparation and Characterization

by
Nagih M. Shaalan
1,2,3
1
Al-Bilad Bank Scholarly Chair for Food Security in Saudi Arabia, Deanship of Scientific Research, Vice Presidency for Graduate Studies and Scientific Research, King Faisal University, Al Ahsa 31982, Saudi Arabia
2
Department of Physics, College of Science, King Faisal University, Al Ahsa 31982, Saudi Arabia
3
Physics Department, Faculty of Science, Assiut University, Assiut 71516, Egypt
Chemosensors 2022, 10(6), 230; https://doi.org/10.3390/chemosensors10060230
Submission received: 28 May 2022 / Revised: 11 June 2022 / Accepted: 15 June 2022 / Published: 17 June 2022

Abstract

:
Recently, barium carbonate-based nanomaterials have been used for sensor and catalysis applications. The sensing performance can be improved with a suitable one-dimensional nanostructure. In this regard, novel nanosized BaCO3 materials were fabricated by a one-pot designed thermal evaporation system. Ten milligrams of Ba as raw material were used to deposit BaCO3 nanostructures at a pressure of 0.85 torr and a temperature of 850 °C in a partial oxygen atmosphere of the ambient. This simple method for fabricating novel BaCO3 nanostructures is presented here. X-ray diffraction was indexed on the orthorhombic polycrystalline structure of the prepared BaCO3. The nanostructures deposited here could be described as Datura-like structures linked with nanowires of 20–50 nm in diameter and 5 µm in length. The BaCO3 nanostructure prepared by the current method exhibited a semiconductor-like behavior with an activation energy of 0.68 eV. This behavior was ascribed to the nature of the morphology, which may possess large defective points. Thus, this nanostructure was subjected to gas sensing measurements, showing high activity toward NO2 gas. The proposed sensor also underwent deep investigation toward NO2 at various gas concentrations and working. The response and recovery time constants were recorded in the ranges of 6–20 s and 30–150 s, respectively. The sensor showed its reversibility toward NO2 when the sensor signal was repeated at various cycles of various concentrations. The sensor was exposed to different levels of humidity, showing high performance toward NO2 gas at 250 °C. The sensor exhibited fast response and recovery toward NO2 gas.

1. Introduction

In these decades, much attention has been paid to nanomaterials and their use in many technological applications, especially nanomaterials for heavy metal oxides. To obtain these nanomaterials, technology has opened many spaces to develop ways to manufacture these materials in different nanostructures. The innovation of different methods of preparation has attracted the interest of researchers in various disciplines. These methods include chemical and physical ways such as chemical vapor deposition (CVD) and physical vapor deposition (PVD) and chemical route methods. Among these methods, PVD is used to produce various nanomaterials such as SnO2 [1,2] in various nanostructures. These nanomaterials have been used in applications such as gas sensing [1,2] and photocatalysis [3]. The oxides are among the most widely used materials in various applications because of their chemical and physical properties, such as electrical and optical properties, in addition to their stability in the most extreme conditions. Among these materials, BaCO3 is a substance with many industrial applications [4,5,6,7]. BaCO3 exists in three phases, cubic, hexagonal, and orthorhombic, and the orthorhombic phase can be synthesized under ambient conditions. BaCO3 is thermodynamically stable compared to other heavy carbonate materials.
The fabrication of BaCO3 at the nanometer scale made this compound of wide applications in many technological and scientific fields [8,9,10]. The BaCO3 nanomaterials have better catalytic activity than other heavy carbonate materials. An example is performed in the solid oxide in a fuel cell as a cathode electrode due to a support surface reaction process [11]. By controlling the structure of BaCO3 and its luminescence properties, it was possible to produce a material with unique optical properties used in photonic devices [5]. BaCO3 nanostructures were produced by various methods including precipitation [12], microwave-assisted [13], and facile composite-hydroxide-mediated route [8]. These nanomaterials were used in many applications [9,10,14,15,16,17].
One of the important applications for the environment and human and animal health is the gas sensing field [18,19,20]. The oxides have been used extensively in this application for various gases. Among these gases, nitrogen dioxide is spread indoors and outdoors and extends to fertilizers used in agriculture [21,22]. Many studies have focused on fabricating highly sensitive oxides and a carbon-based sensor for such gases [23,24]. One of the highly reactive gases is NO2, and its group is known as nitrogen oxides (NOx). Inhalation of air that contains high concentrations of NO2 can irritate the human respiratory system. Exposure for short periods to concentrations can exacerbate respiratory problems, causing asthma, coughing, and difficulty breathing. Respiratory problems may worsen when exposed for longer periods and cause diseases, whether in adults or children [25]. Exposure to 1.0 ppm of NO2 for a long time can lead to lung and respiratory health problems in humans [26,27,28]. Nitrogen dioxide also reacts with water, oxygen, and other chemicals in the atmosphere and causes acid rain, which damages sensitive ecosystems such as forests and lakes. Nitrite salts are widely used in industrial manufacturing processes such as fertilizer and food preservation. This may lead to the production of nitrogen dioxide in its ionized form, NO 2 , which can contaminate foods, soil, and natural water. In addition, intaking of NO 2 at concentrations higher than 8.7 ppm can cause a transformation of normal hemoglobin into methemoglobin, which causes methemoglobinemia, the well-known “blue baby syndrome” in children [29,30]. Thus, detection of such hazardous gases resulting from automotive emissions is very important for environmental protection and human and animal health.
In this paper, an innovative method for making a BaCO3 nanostructure based on PVD using thermal evaporation in a closed system at a low vacuum is described. Using this method, the nanostructure of BaCO3 is produced. A detailed explanation of how to manufacture this compound and the practical steps for it are presented. The morphology of the prepared nanomaterial was studied by FESEM, and the crystal structure and elemental composition were confirmed by XRD and EDX. The BaCO3 nanostructure prepared using the current method exhibited a semiconductor-like behavior. This behavior is described in terms of the nature of the morphology and defective points. The nanostructure was subjected to gas sensing measurements towards NO2 gas, which was studied at different gas concentrations and working temperatures. The electrical properties of BaCO3 were also studied while the compound was in air, as well as in air including gas.

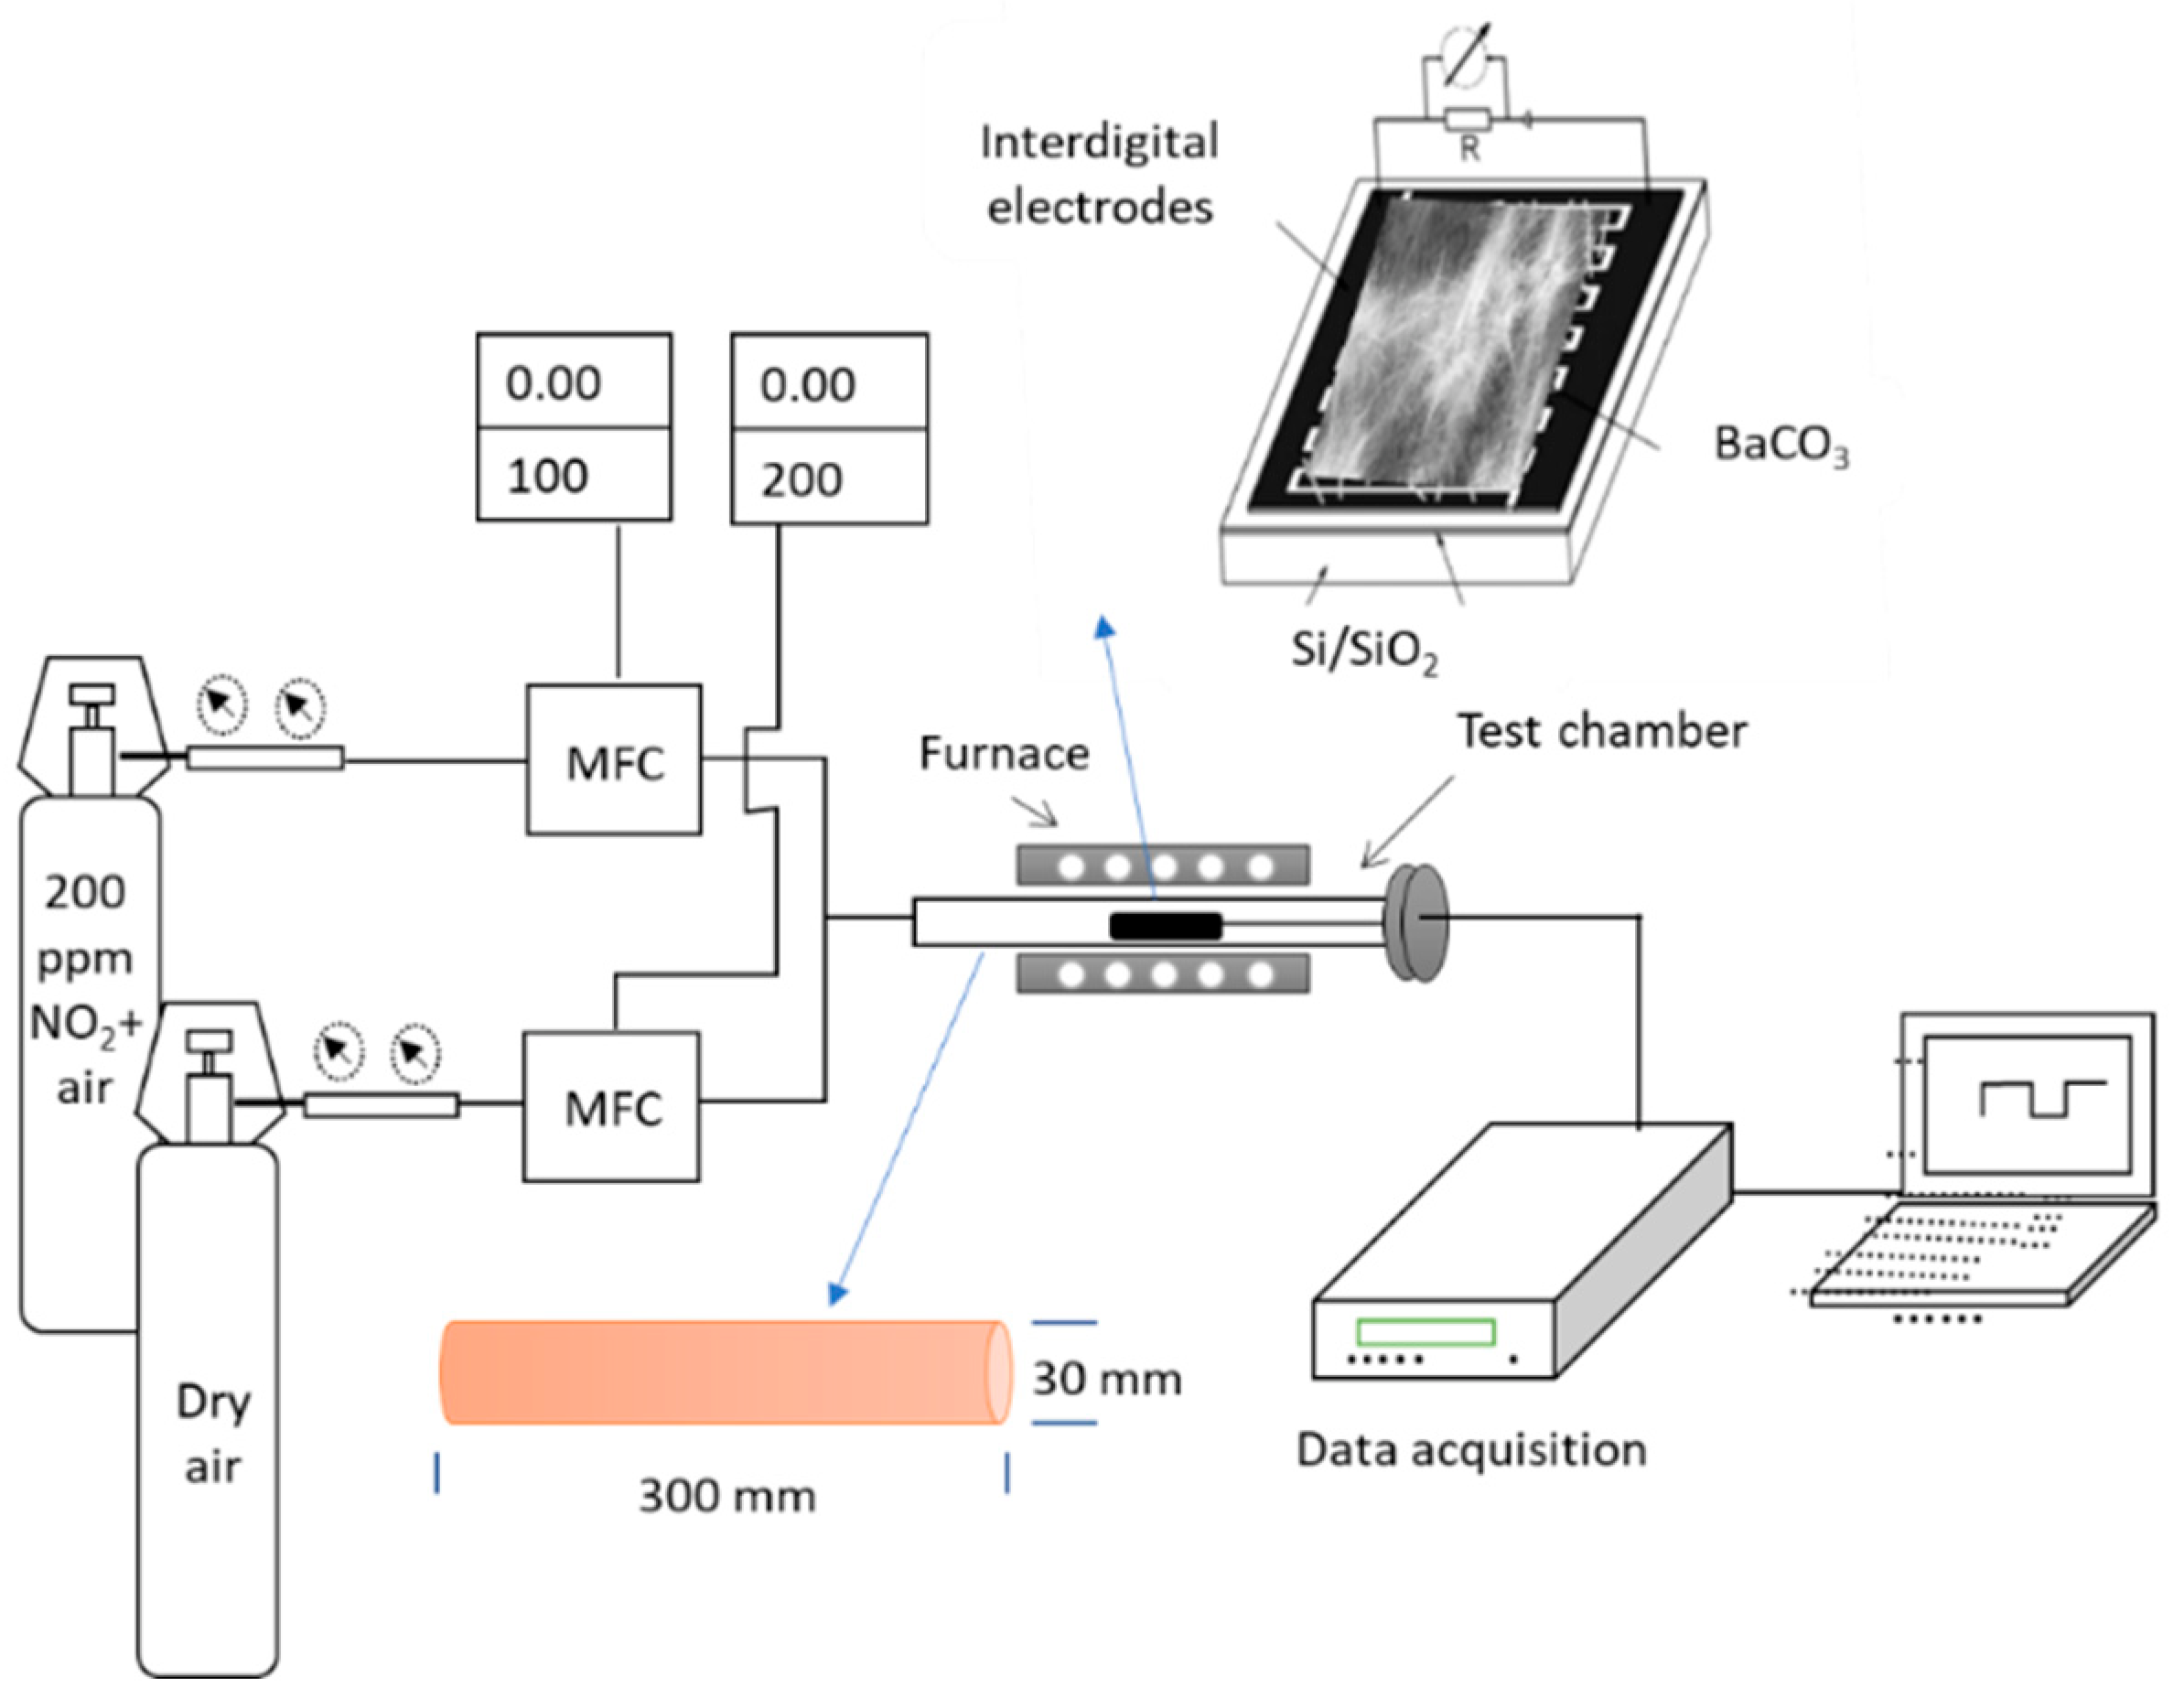
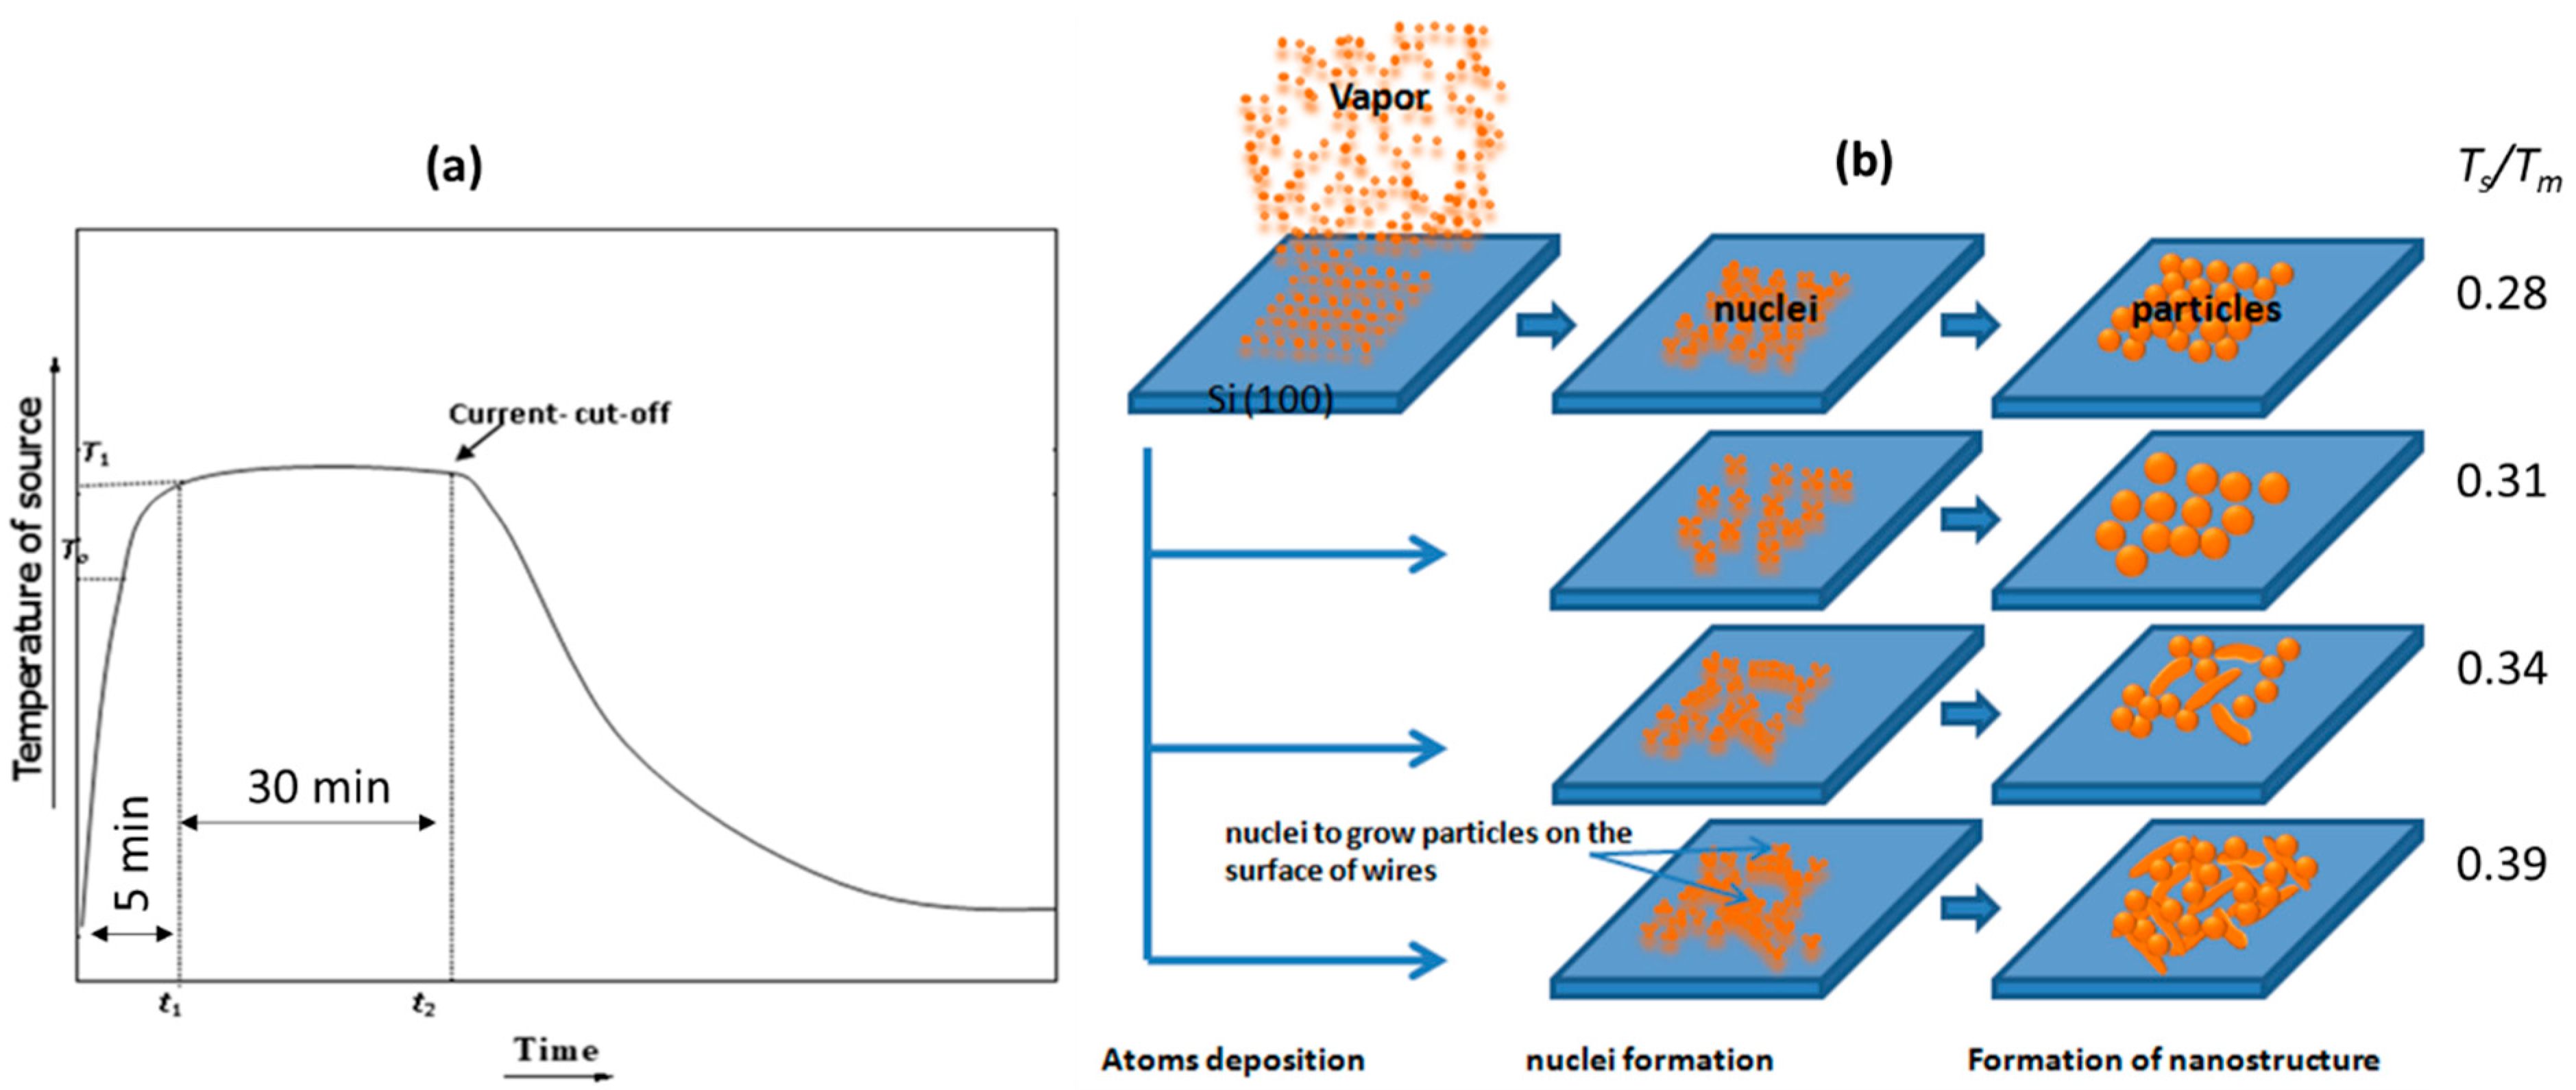
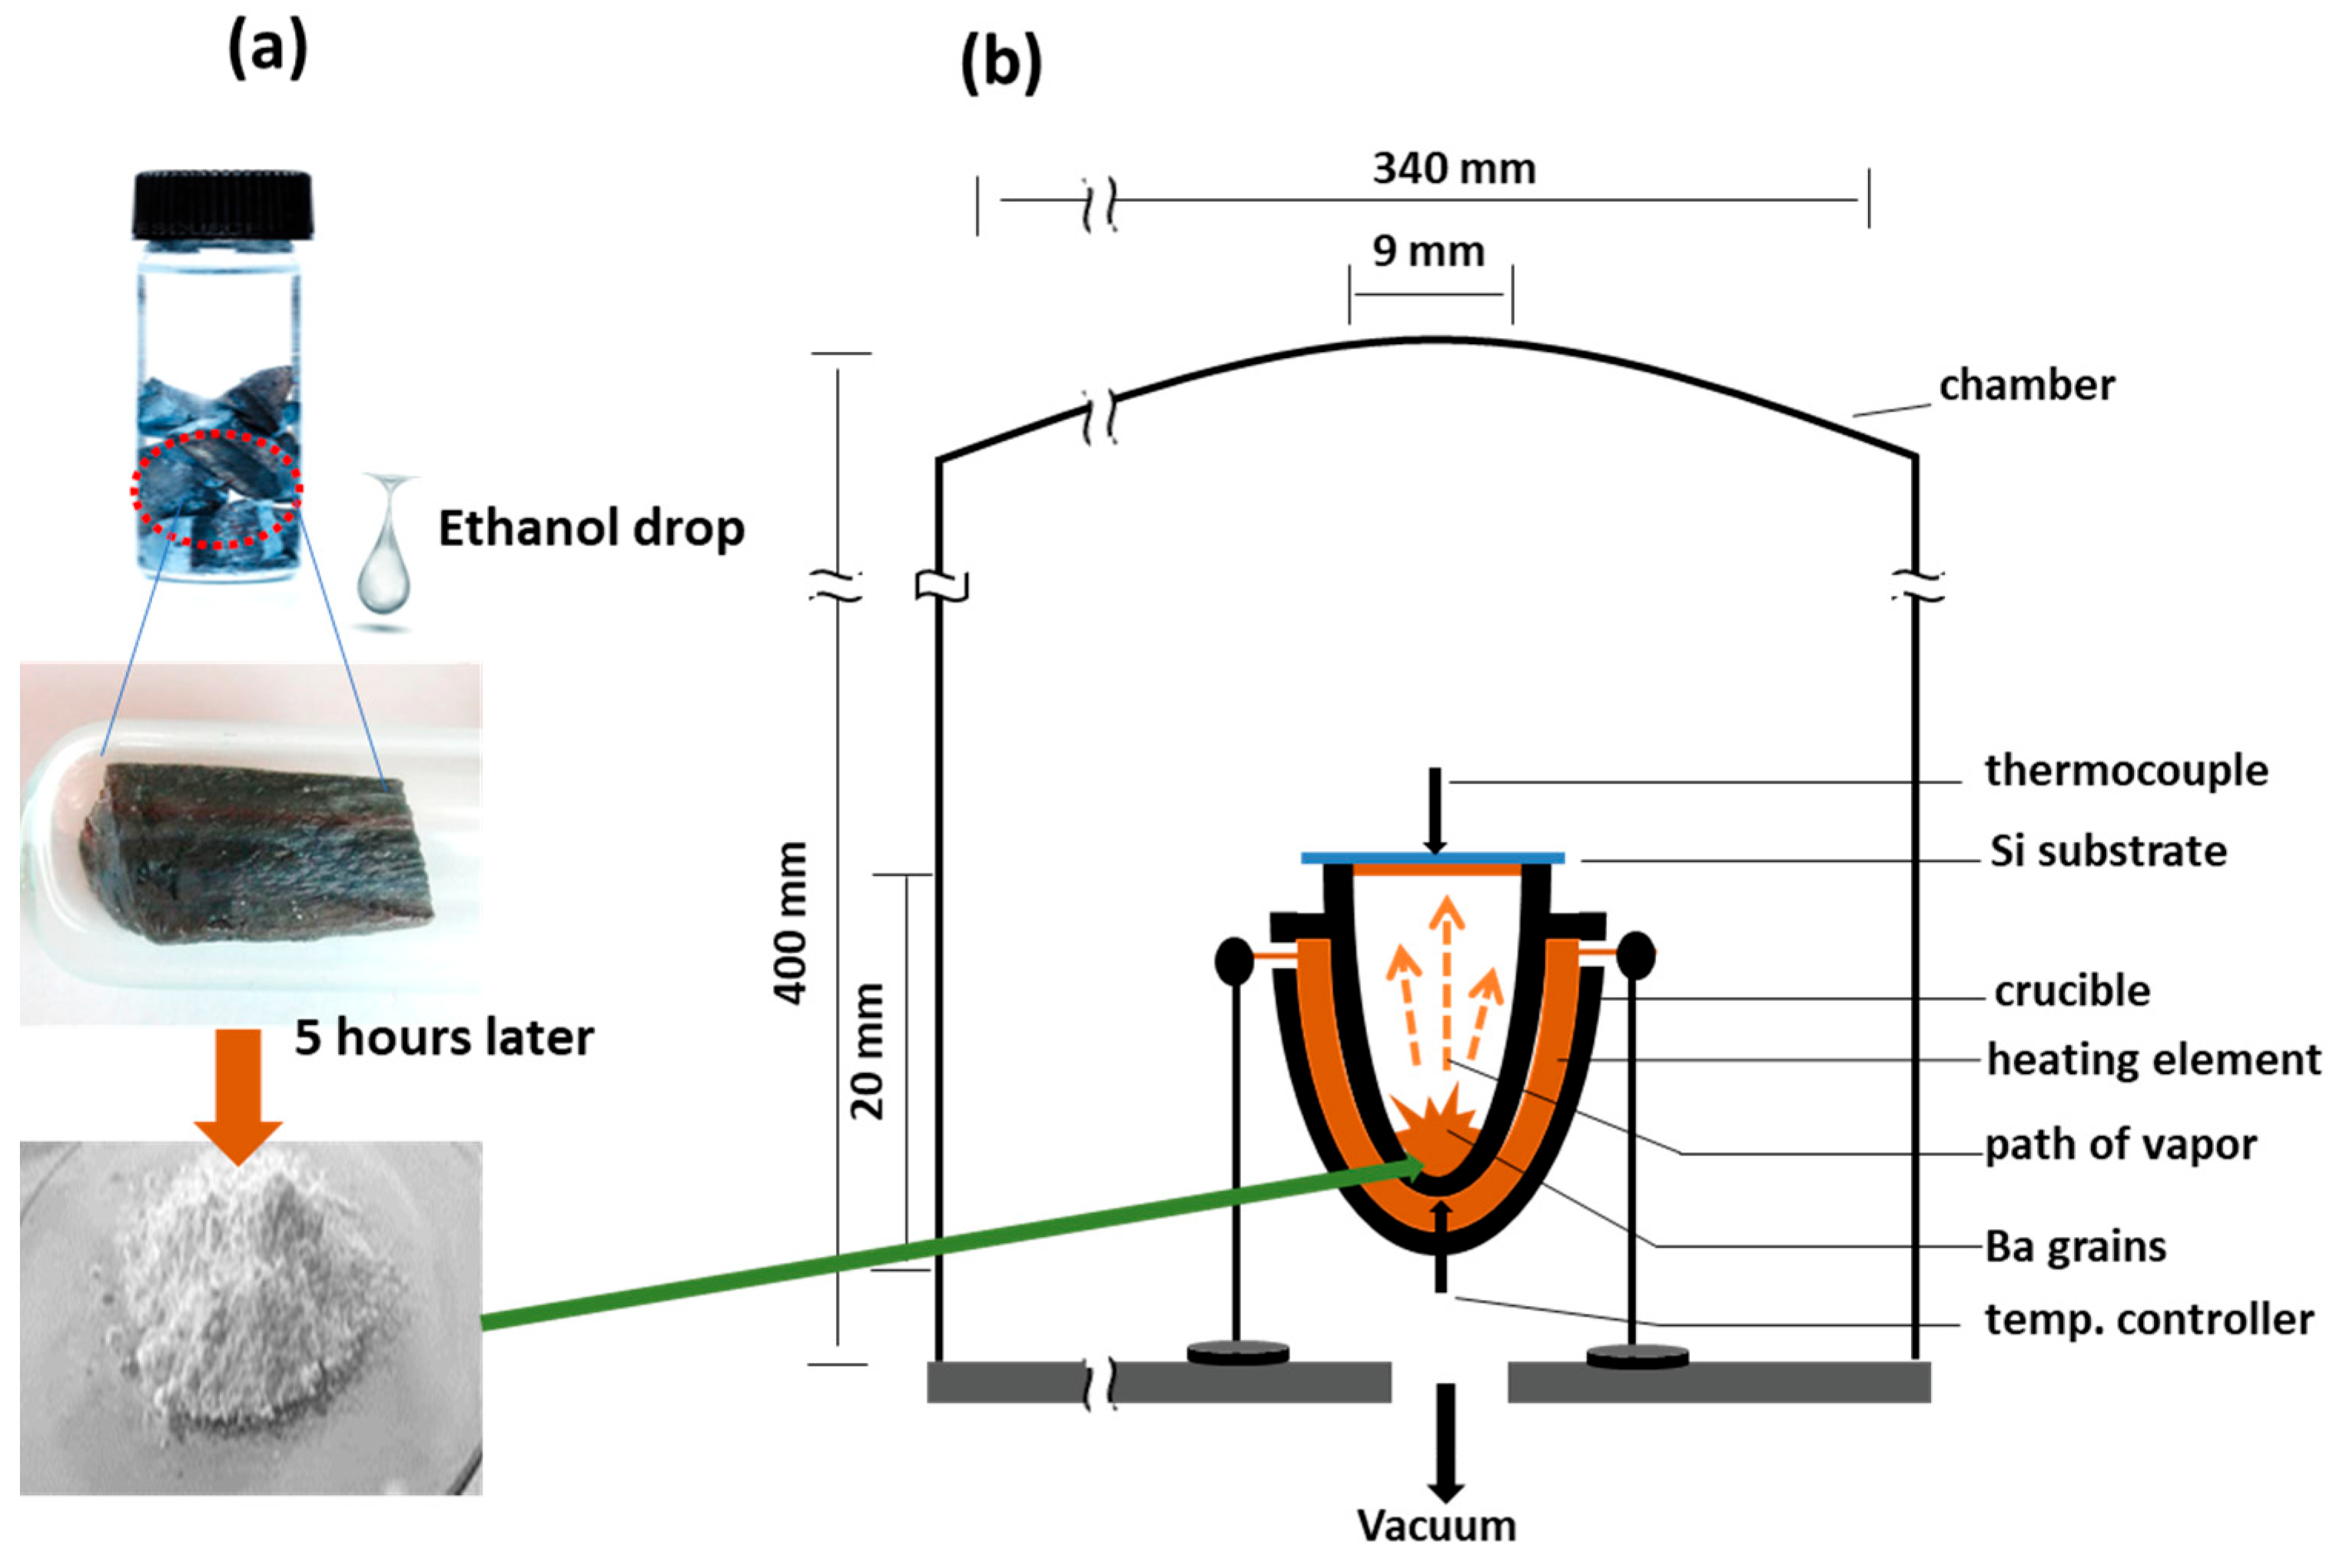
2. Materials and Methods

Most of the methods for the preparation of BaCO3 are chemical-based methods. Here, a one-pot method for fabricating novel morphologies is proposed. The experiment was performed in a vacuum system made of a chamber with a diameter of 340 mm and a height of 400 mm. The material was deposited in a heating set designed with double crucibles bordered by a heating element, as shown in Figure 1. Pure Ba metal was stored in an oil-filled bottle to avoid the reaction with the ambient. A small piece of Ba, about 10 mg, was withdrawn from the bottle and placed in a glass dish in the air for 5 h; a drop of ethanol made the dark Ba convert to white color. The white materials were put in the double crucible covered by SiO2/Si substrate. The chamber was evacuated to targeting value. The double crucible was heated up to 850 °C within 4.0 min and maintained for 30 min under 0.85 torr of ambient, where the substrate temperature was 300 °C. Afterward, the crucible was left to cool down to RT, resulting in a white layer coating the substrate. The deposited layers were characterized by FESEM (Jeol model 6700F) attached to an EDX system. The crystal structure was analyzed by XRD powder diffraction (Shimadzu-6100) with Cu-Ka radiation of 1.5406 Å, 40 kV, 40 mA, and a diffraction angle range of 2θ = 15–65°.
To prepare the sensing device, the BaCO3 nanostructure was scratched and dispersed in ethanol and then was dropped on Si/SiO2 substrate equipped with Pt interdigitated electrodes with finger width and spacing of 35 µm, where 1.0 mg of the powder was dissolved in 10 mL of ethanol and then only 1.0 mL was dropped on pt-electrodes at 60 °C, and then the device was calcined at a temperature of 400 °C for 30 min. Pt interdigitated electrodes were fabricated in advance by DC-puttering followed by lithography processes. Then, the device was applied for the sensing measurement by inserting it into a chamber made of a quartz tube surrounded by a heating furnace, as shown in Figure 2. The gas sensing system consisted of Horiba mass flow controllers controlled for 100 and 200 SCCM, a temperature controller, and an Agilent multimeter for electrical measurements. The chamber temperature was varied from RT up to 350 °C. The total flow rate of air or air containing NO2 gas was kept at 200 SCCM for all measurements. The percentage of the sensor response is calculated by Equation (1):
S % = Δ R R a × 100
where Δ R = R g R a is the change in the resistance due to the exposure to gas, R a is the resistance in air, and R g is the resistance in the air including gas.

3. Results

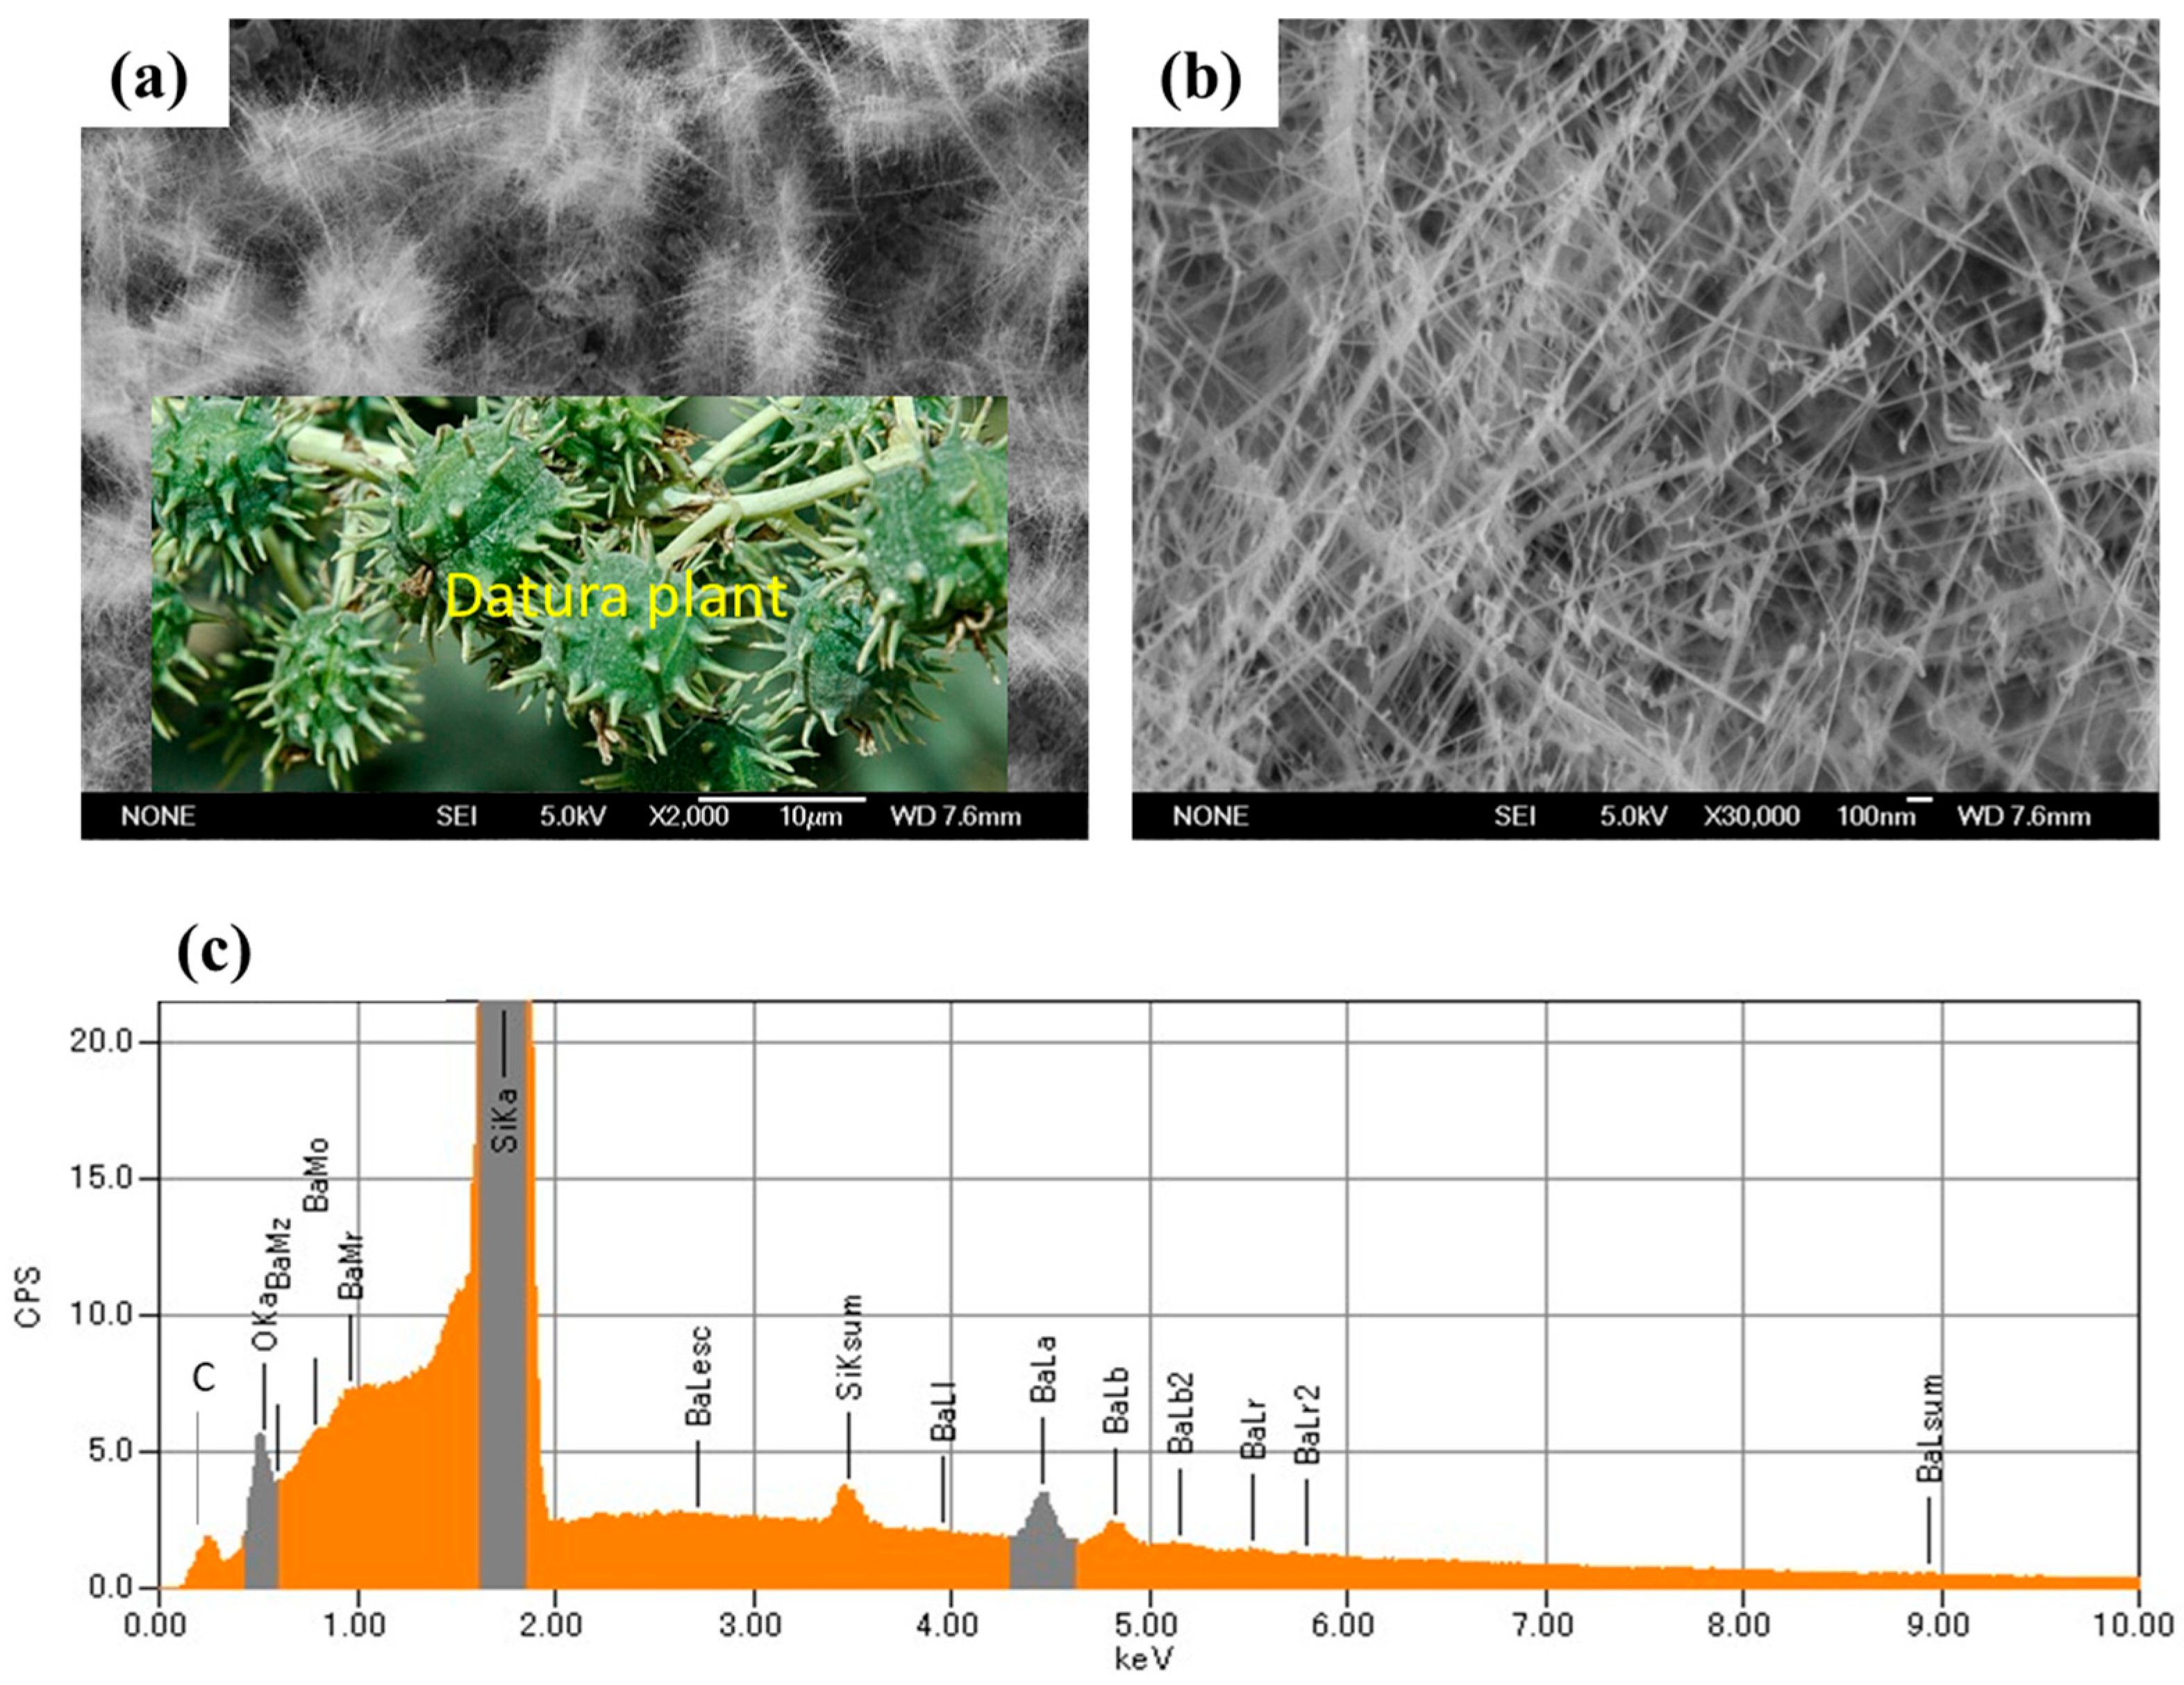
3.1. BaCO3 Characterizations

The prepared sample was firstly characterized by FESEM to demonstrate the morphology of the synthesized products. Figure 3 shows SEM images observed for the sample prepared at a vacuum of 0.85 torr and a temperature of 850 °C. The morphology of the sample prepared at a lower vacuum of 0.85 torr is a Datura-like structure (like the natural plant). These Datura structures are linked by nanowires of 20–50 nm in diameter and 5 µm in length. The nanowires are straight in shape, as shown in Figure 3a,b. This observed morphology is interesting for further investigation in sensing applications. More elemental investigation for the prepared compound was carried out by EDX coupled with SEM-6700F. Figure 3c shows the EDX spectra of the prepared product. Ba element was detected at various X-ray energies. The most observed lines are Ba-Lα and Ba-Lβ at 4.5 and 4.8 keV. The EDX spectra confirmed that there is no impurity observed in the sample other than Ba, O, and C elements, where the Si peak is coming from the Si substrate. EDX showed that the weight percentages are 68%, 8%, and 24% corresponding to Ba, C, and O elements, respectively. This result confirms the relative weight percentage of Ba, C, and O for the bulk BaCO3 composition.
Figure 4 shows XRD patterns measured for the source and the synthesized samples. The source material refers to the powder described in Figure 1a. The obtained XRD charts are compared to the standard cards of BaO, BaCO3, and Ba(CO3)2. The source materials are indexed in two phases, which are close to the BaO and BaCO3 as well. The dual phases of the source materials may be due to the reaction of Ba with oxygen and C in air and ethanol. The source was subjected to thermal evaporation with airflow under 0.85 torr. The source material was subjected to thermal evaporation into the designed system at a vacuum of 0.85 torr and airflow. After deposition, the product was indexed on a BaCO3 orthorhombic structure with calculated lattice parameters of a = 5.319, b =8.918, and c = 6.501 Å, compared with standard values of a = 5.285, b =8.972, and c = 6.431 Å, matching with the standard card of JCPDs-45-1471 and data reported in [31].

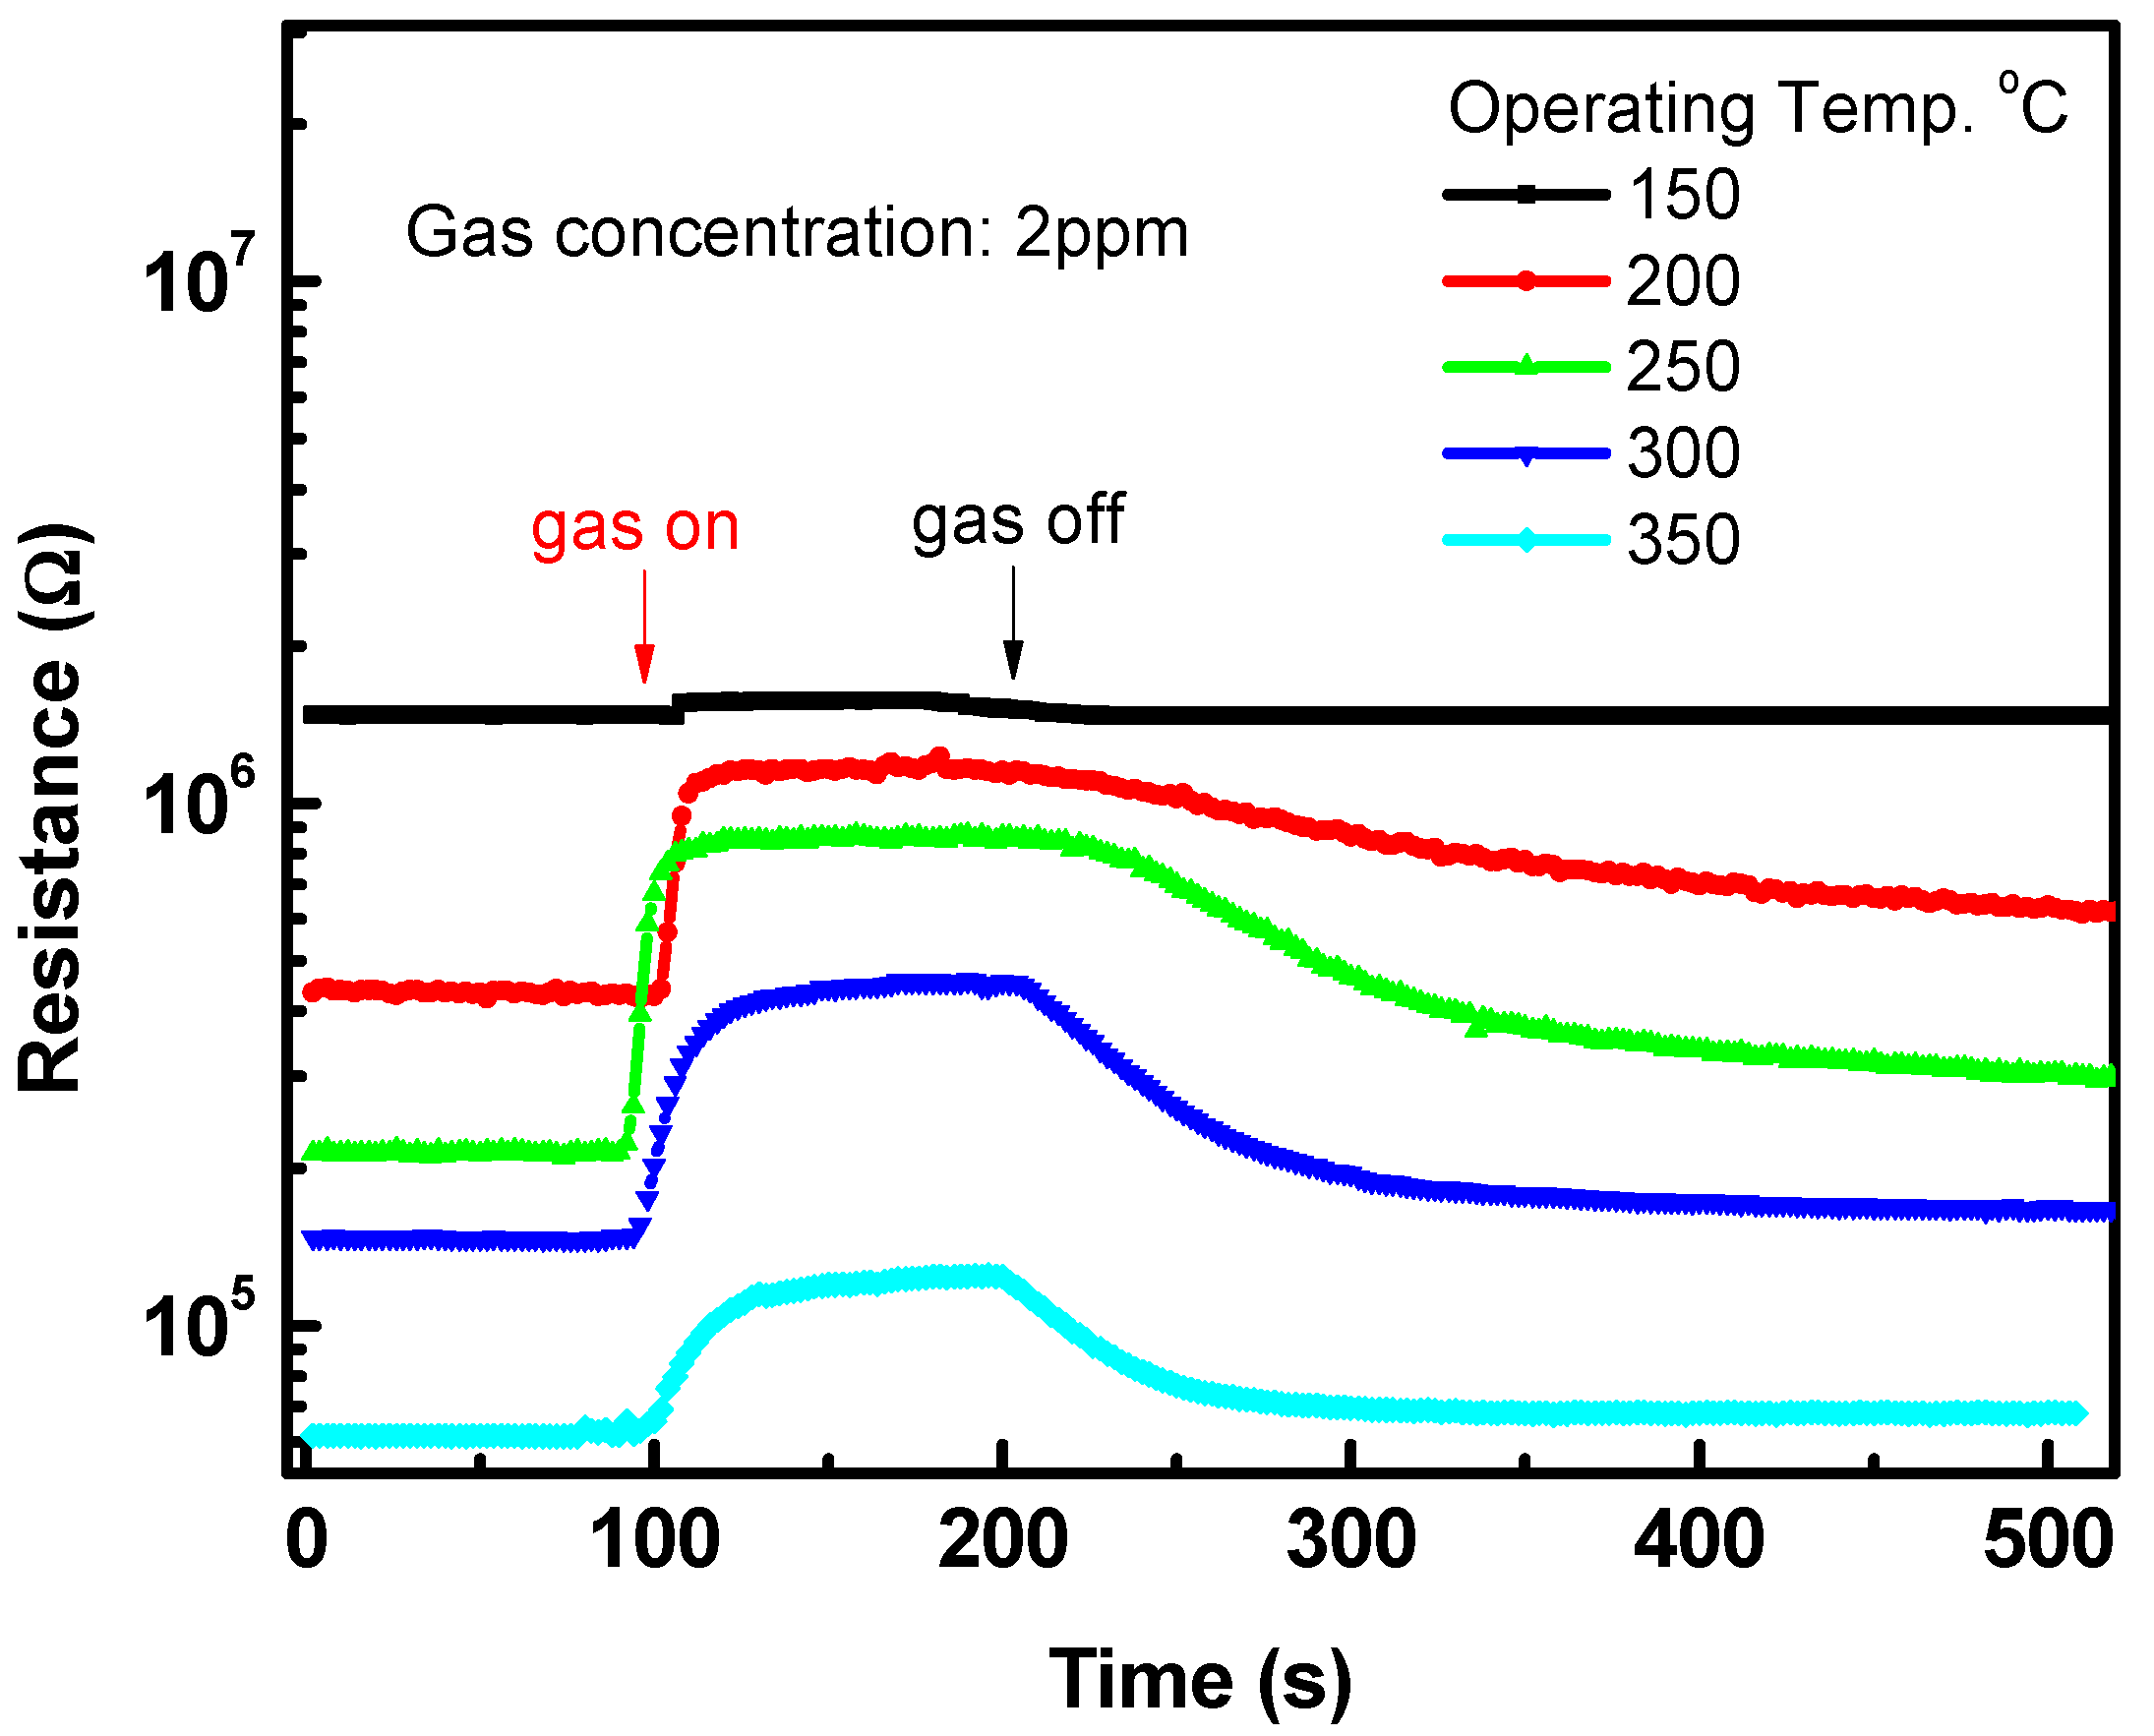
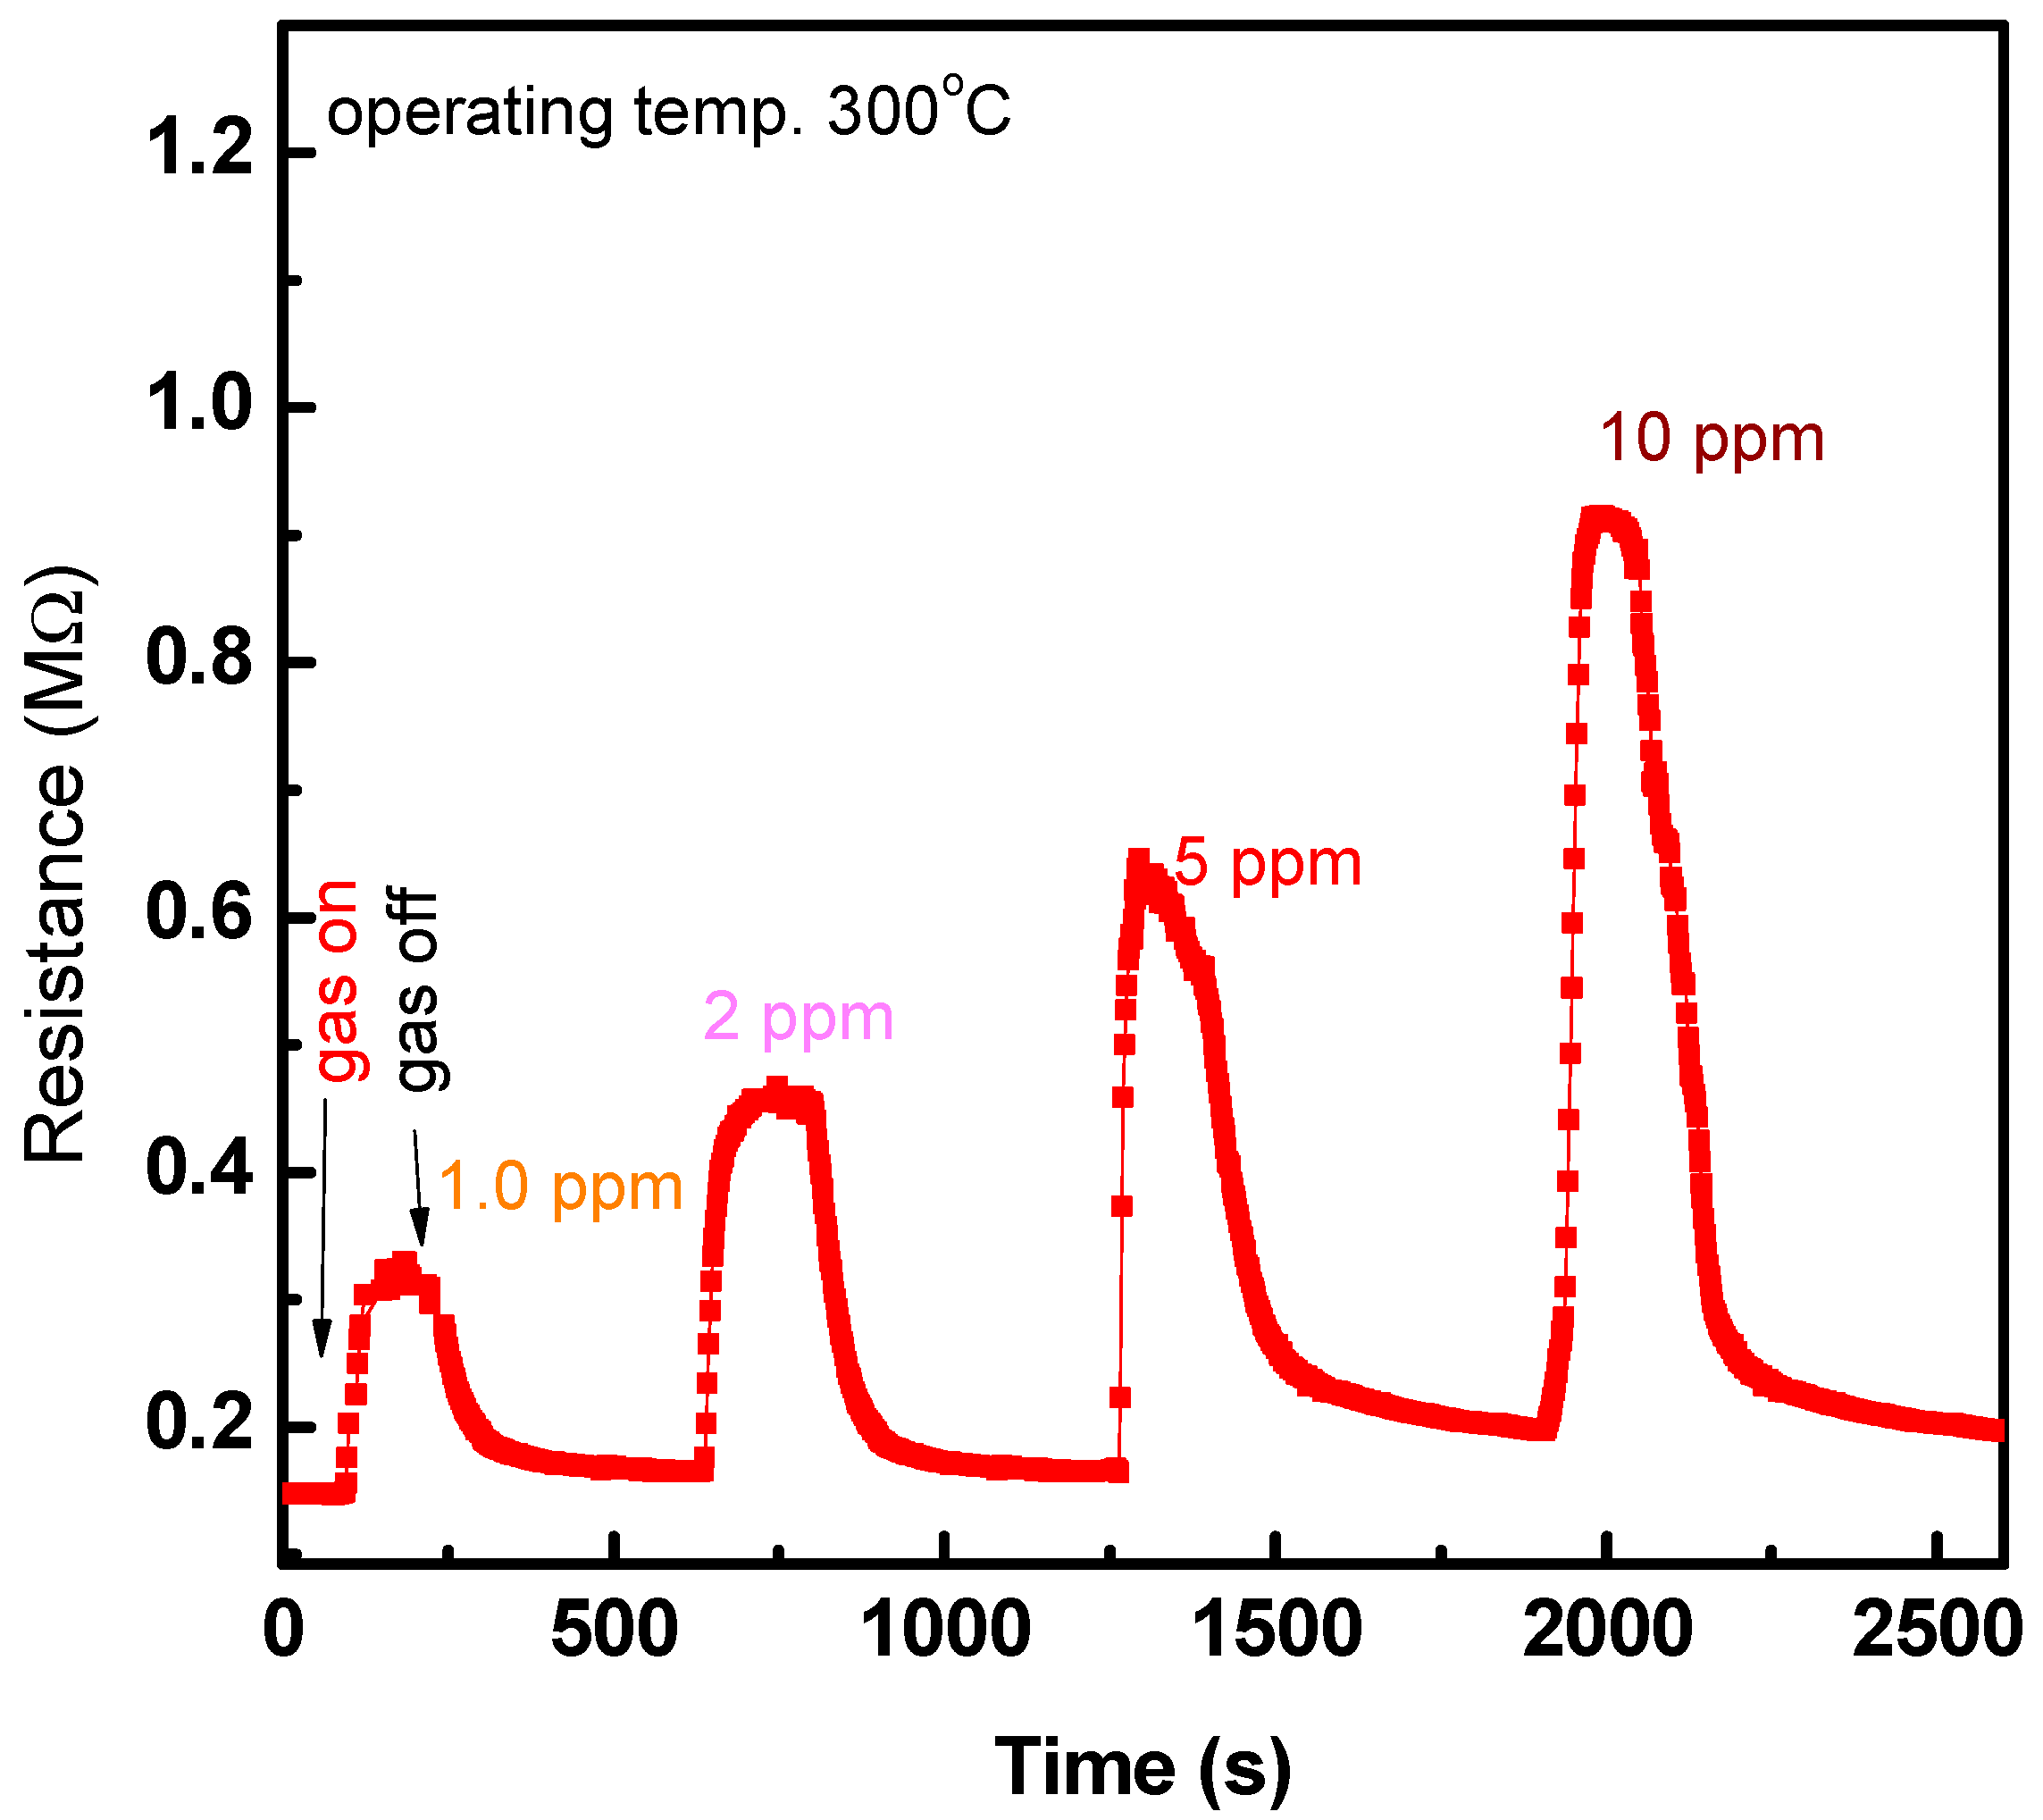
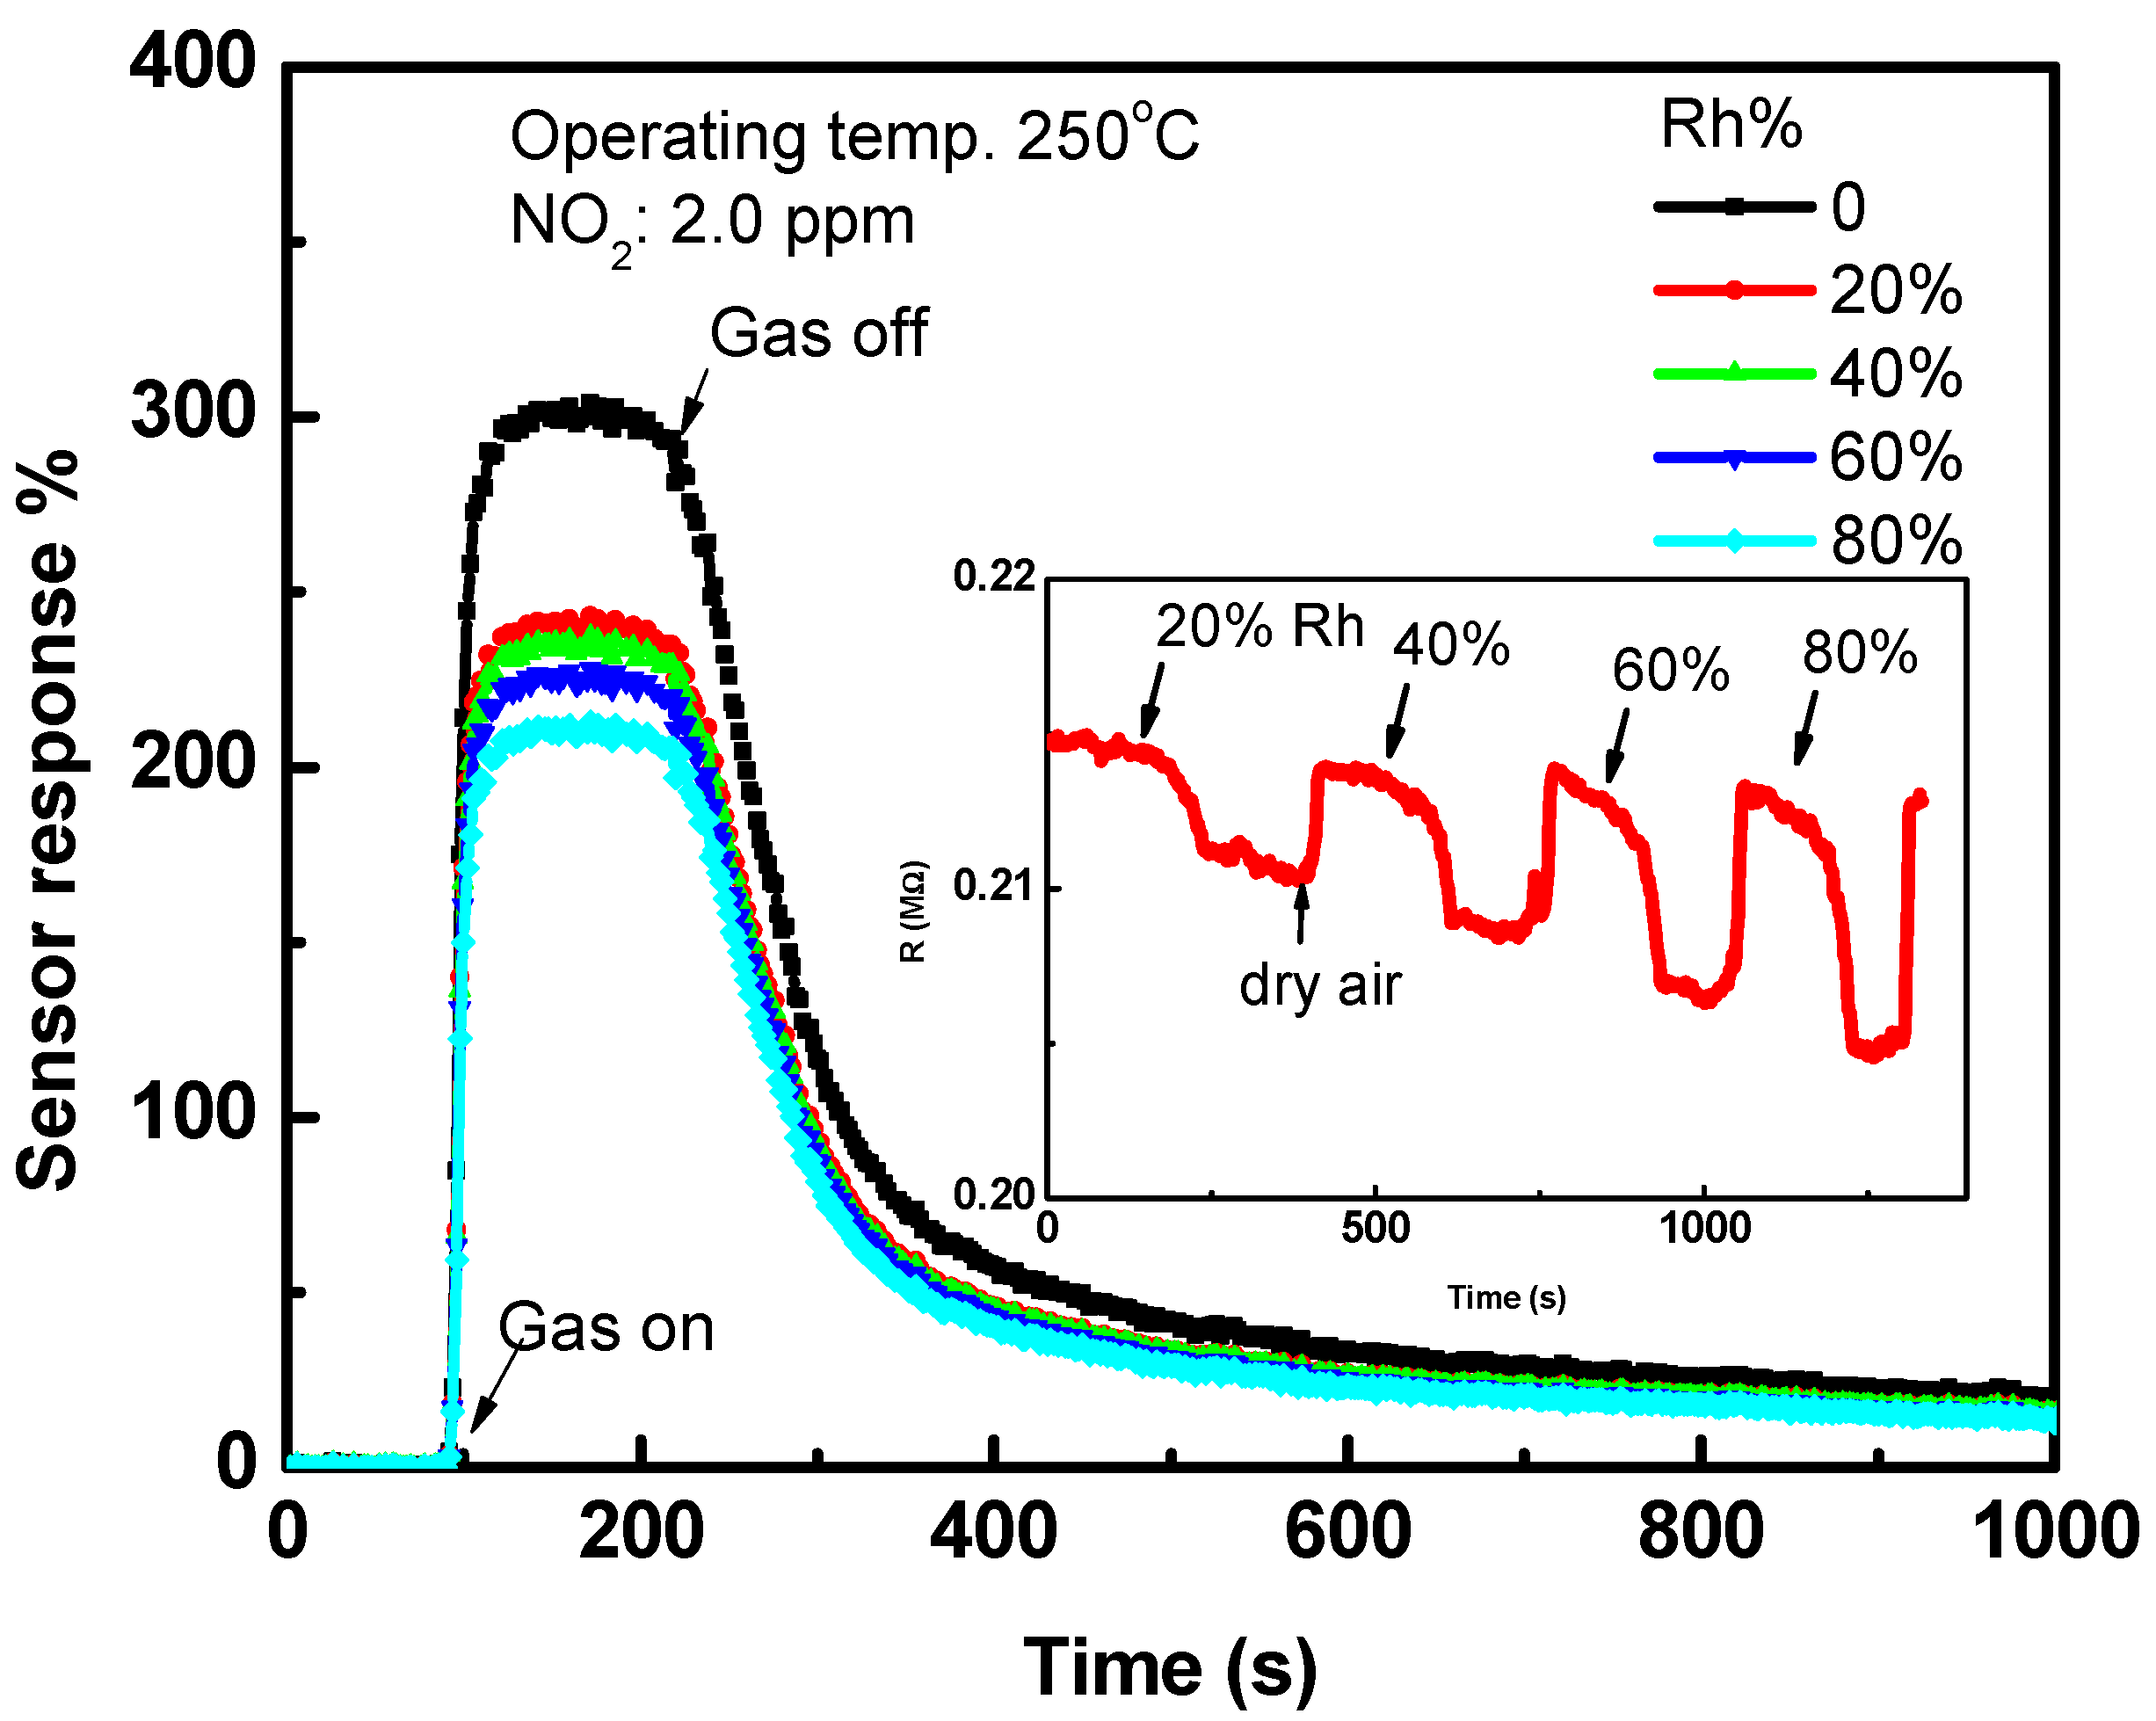
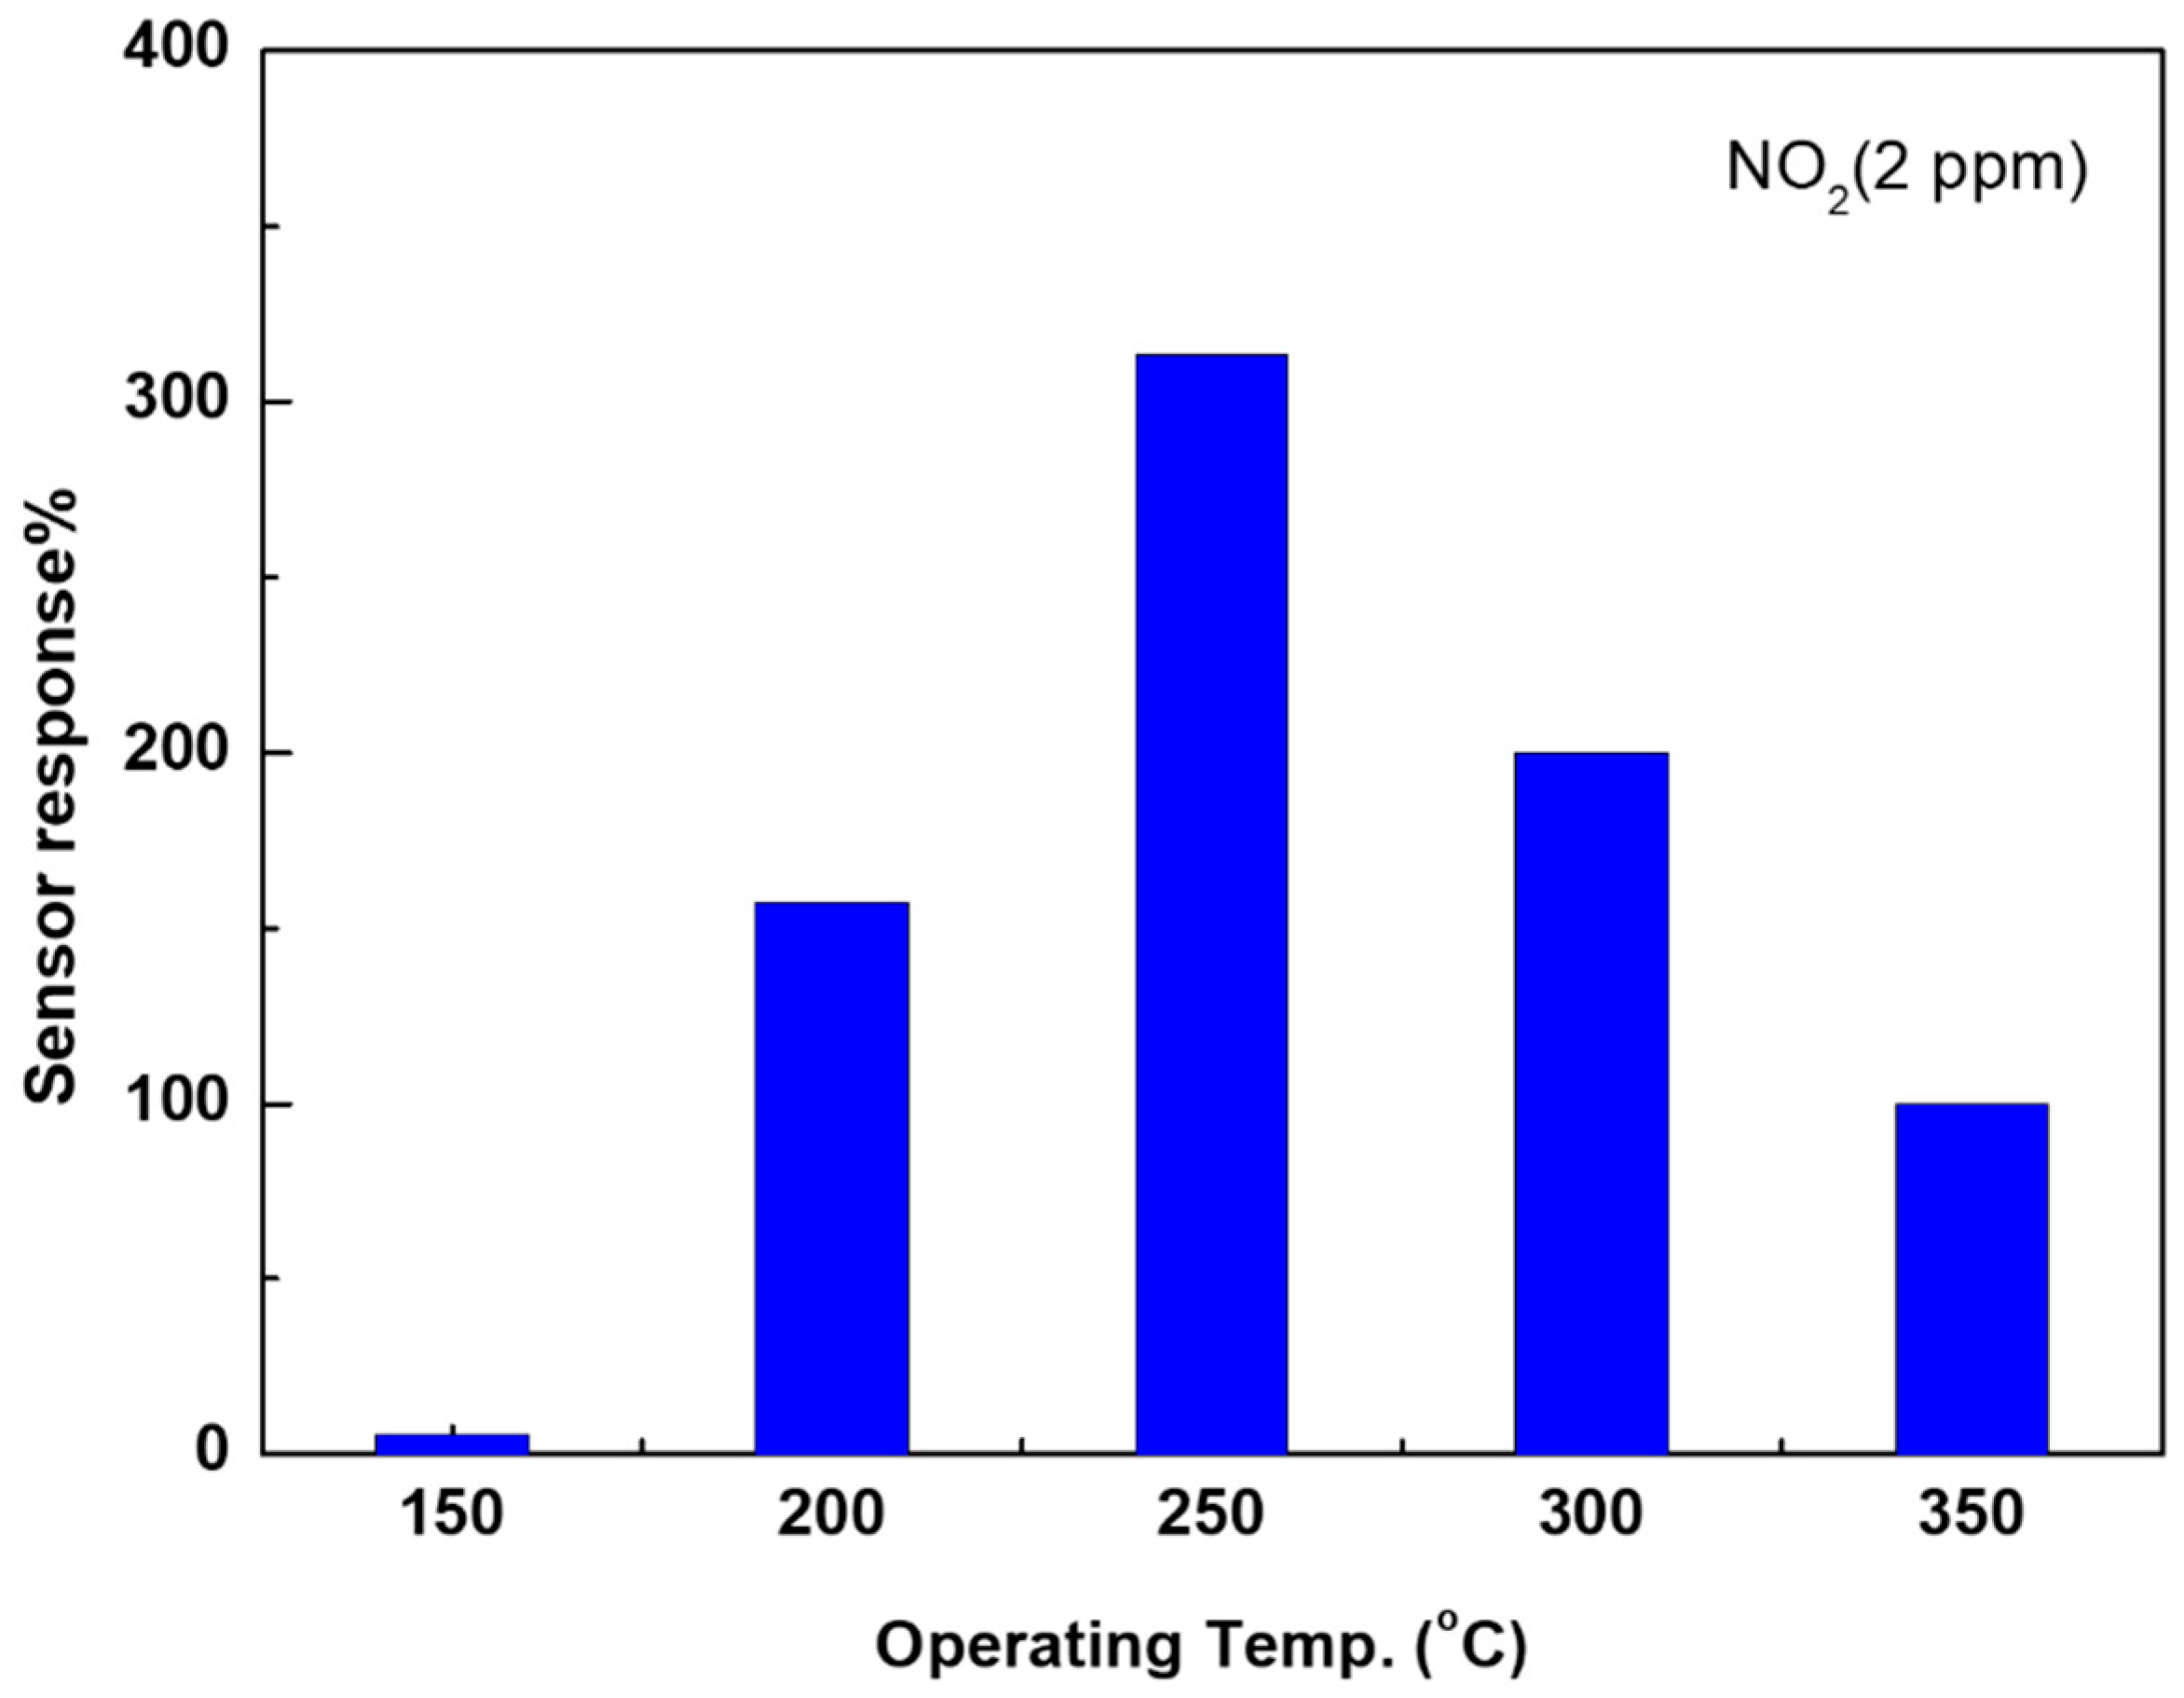
3.2. Sensing Characteristics of NO2 Gas

The sample synthesized at 0.85 torr was prepared for gas sensing measurements. Figure 5 shows the sensor signal at various working temperatures of 150 °C up to 350 °C. The gas concentration is 2.0 ppm, and the total flow rate is 200 SCCM. The present device was not sensitive at temperatures less than 150 °C. However, it is well sensitive at higher temperatures. The sensor responds to the gas in a short time (a few seconds), but more time is taken to recover to its initial resistance. The response and recovery time constants are defined as the time or resistance taken to reach 90% of the steady value or base resistance. The recovery time decreased an increase in the working temperature. When the sensing layer was exposed to the gas, the resistance increased, suggesting that NO2 may react directly with the BaCO3 surface, capture the conduction electrons, and reduce the free carrier density of the bulk. The sensing parameters, namely the sensor response and the response and recovery time constants, are shown in Table 1. As seen in this table, the response time constant almost has same value at all temperatures, where the increment is about 2 times of others at 350 °C. This may be dependent on the type of chemical reaction or gas adsorption at this high temperature. The recovery time constant gradually decreased from 150 to 40 s as the temperature increased from 200 °C to 350 °C, and the molecule desorption is faster at high temperatures. The temperature dependence of the sensor response is an important curve for understanding the sensor performance toward the gas at various operating temperatures. Figure 6 shows the temperature dependence of the sensor response for 2 ppm of NO2 gas. The sensor response was about 6% at 150 °C, increased up to 315% at 250 °C, and then decreased again. Thus, the most active temperature of the sensing layer of 1D-BaCO3 was recorded at 250 °C.
The change in intrinsic resistance in air and air including gas with the temperature was studied, as shown in Figure 7. The resistance is observed to decrease from 1.5 × 10⁶ Ω to 0.15 × 10⁶ Ω when the temperature changes from 150 °C to 350 °C. The difference between the resistance in air and that in air containing gas at 150 °C is very low, indicating the low activity of the surface at this temperature, which may explain the fast response and recovery times at this temperature shown in Figure 5. A large difference in resistance was observed at 250 °C, indicating the most active temperature. Although the resistance was measured in air, semiconductor-like behavior is observed for BaCO3. The conductance is well represented by an exponential function [32,33], as follows:
G = G 0   exp E a 2 K T   ln G = ln G 0   E a 2 K T
where Ea is the activation energy, K is the Boltzmann constant, and G 0 is the exponential constant of the type associated with the Arrhenius equation. The inset shows the logarithm relationship of the conductance and the inverse of temperature. It was used to calculate the activation energy of BaCO3 in air and gas-containing air, using the data points shown in Figure 7.
The reversibility of the sensor with a repeating signal is very important for any sensing device. Figure 8 demonstrates the time dependence of the sensor signal at various gas concentrations of 1–10 ppm and the operating temperature of 300 °C. Firstly, the sensor was exposed to only air, then to air including gas for 200 s, and finally to only air to recover back to the baseline. This was repeated for various gas concentrations. The response and recovery times are reasonable, and the sensor shows a reversible behavior. The calibration curve of the sensor response is essential to understanding the capability of the device for detecting various gas concentrations. The change in the device conductance with the change in the gas concentration exhibits the ability of the device to distinguish the concentration of gas. However, this change can be well demonstrated by the calibration curve, as shown in Figure 9. The sensor response gradually improved with an increase in the gas concentration. The data points are fitted well with the power function (dotted line). The relation was S % = 127 ± 13 × C 0.633 , where C is the gas concentration in ppm. The sensor is more sensitive toward gas at low concentrations than at higher concentrations.
Figure 10 shows the gas selectivity based on NO2 (2.0 ppm), NO (5.0 ppm), CO (50 ppm), and H2 (1000 ppm). The difference in selecting the concentration depends on the harmful level of these gases. The inset of the figure shows the sensor signals toward these gases. The sensing measurements were carried out under the same conditions, namely 200 SCCM and 250 °C. The sensor still showed a response toward these gases but showed a very low response compared to the NO2 response, which was measured at a lower concentration. The results confirmed that the current fabricated BaCO3 sensing layer is superior for detecting NO2 gas at low concentrations. In general, the selectivity of the sensor toward a specific gas is not well understood. Many processes in chemistry and physics occur at a surface; many such processes are complex. However, the NO2 molecules find their way directly to the interstitial and defective points of the BaCO3 surface, and they are the most reactive molecules in the NOx group. Thus, the direct interaction of the charge transfer was considered the main sensing mechanism for the NO2 reaction; however, most of the reducing gases such as CO, NO, and H2 prefer to react with atomic oxygen ions O .
Figure 11 shows the effect of humidity on the sensor performance at the most sensitive operating temperature of 250 °C and gas concentration of 2.0 ppm. In this figure, the sensor was subjected to various humidity conditions starting from 20% RH and increasing up to 80% RH. It seems that the sensor is affected by the humidity levels, where the response decreased to a 15% lower value compared to the dry air condition. The humidity harms the sensor response. The inset figure may explain the effect that the resistance of the sensor decreased when the sensor was exposed to only humidified air and then returned to almost base value (needed more time to recover) when dry air was introduced. The resistance continued to decrease with an increase in the humidity level. This resistance behavior toward a humidified atmosphere is opposite to the resistance behavior toward the NO2 gas. Thus, the sensor response toward NO2 decreased with an increase in the humidity level. There are two processes of adsorption of water molecules on the surface: (1) chemical adsorption of a single layer of water with a proton transition between hydronium ions (H2O + H+ >> H3O+) and (2) multilayer adsorption of water with increasing humidity, in which both H+ and H3O+ work as charge carriers [4,34,35]. However, the sensor is still working well toward highly reactive NO2 in this harsh environment, although its response was reduced to 25%.

4. Discussion

In this section, an attempt is made to propose the growth mechanism of the nanostructure prepared using this method. It is known that the vapor pressure and the temperature of the substrate largely affect the growth of the nanomaterials produced by thermal evaporation [36,37]. The growth mechanism is shown in Figure 12. Figure 12a presents the increase in the temperature of source materials as a function of time. The temperature of the source increases with the time to a stationary temperature, T1, within ~5 min. If we consider that the deposition starts at a temperature, namely To, lower than the temperature of the stationary deposition, T1, this indicates that a small layer of nuclei forms before the beginning of the stationary deposition. The atoms or molecules evaporate inside the inner crucible. They land on the surface of the heated substrate, which controls the kinetics of the species on the surface due to the surface energy gained by thermal heating. The atom and molecule react with each other to form new bonds. The aggregation of the adsorbed molecules will be the nuclei of nanostructures, as shown in Figure 12b. At the beginning of heating, the energy is not sufficient to grow a 1D nanostructure, forming fine clusters grown from limited nucleation sites. At a high temperature, some clusters are condensed to form rods on the SiO2 surface and become roots for 1D nanostructures. Each root was a base connecting the species landing on the surface to form a single nanowire. The nanowires grow randomly due to the non-epitaxial relation of BaCO3 and SiO2 film. The growth of different nanostructures may depend on the substrate temperature, Ts, relative to the melting temperature of the prepared material, Tm, as shown in Figure 12b. The substrate temperature should range between Tm/2 and Tm/4, in an embodiment, to produce a resulting nanostructure growth. For example, when Ts/Tm = 0.28 > 0.25, the energy for growing the 1D is not sufficient, and small nanoparticles are grown from limited neighbor nucleant sites. Increasing the substrate temperature may slightly increase the mobility of nuclei, which combine to become larger nanoparticles. Since 0.25 < Ts/Tm = 0.34 or 0.39 < 0.5 at the temperatures tested, some particles condense for a short time to form droplets on the substrate and become nuclei for 1D growth. The melting point of BaCO3 is 811 °C. The substrate temperature tested here was 300 °C (where Tm/4 = 202 °C and Tm/2 = 505 °C). In the present case, the substrate temperature relative to the melting point is 0.39, which allows the 1D BaCO3 to grow, as shown in the SEM image in Figure 3.
Barium is a chemically reactive material and always exhibits the oxidation state of 2+. The reaction of Ba2+ with oxygen occurs at room temperature in ambient conditions [38]. Because of its high reactivity, barium is often stored under mineral oil or in an inert atmosphere. From the XRD analysis, the polycrystalline phase of the prepared samples of BaCO3 was observed. The growth direction is mostly dominated by the plane (111) and (200) for the nanowires. The crystallite size is estimated from XRD patterns using the Scherrer relation [39]:
D = K λ β   cos θ
where D, K, and λ are the average crystallite size in nanometers, the Scherrer constant (0.9), and the XRD wavelength of CuKα (0.15046 nm). β is the full width at half maximum (radian) for the high-intensity peaks at diffraction angle θ (radian). The crystallite size of 22.0 was found for the nanostructures prepared at 0.85 torr. In addition, the obtained BaCO3 might be formed due to the reaction of Ba(OH)2 with CO2 in the atmosphere during the subsequent steps shown in Figure 1. The simplified expressions for chemical reactions are described by [8,40]:
Ba 2 + + 2 OH Ba OH 2
Ba OH 2 + CO 2 BaCO 3 + H 2
or
BaO + CO 2   BaCO 3
when barium cations ( Ba 2 + ) exposed to air and ethanol react with hydroxide groups OH , forming Ba OH 2 , or otherwise partially forming BaO , as observed in XRD for the source. During the thermal evaporation, both these products can react with carbon dioxide CO 2 , forming the last stable product of BaCO 3 . This result was confirmed by XRD and EDX.
Shahid et al. [8] have reported that the single-phase polycrystalline BaCO3 bulk with orthorhombic structure has an optical bandgap energy of 5.5 eV at room temperature, which indicates that BaCO3 at room temperature is an insulator. However, the electrical measurements revealed that the sample under study is a semiconductor-like compound. When the temperature was increased to 425 K (150 °C), the resistance was 1.5 × 10⁶ Ω, as shown in Figure 7. Thus, the BaCO3 behaved like the semiconductors that do not conduct electric current well at lower temperatures but exhibit measurable conductivity at higher temperatures, as shown in Figure 7. This is due to the specific band structure of temperature-dependent electronic energy levels. In the current case, the activation energy separation is 0.68 ± 0.04 eV in air. This slightly decreased to 0.52 ± 0.04 eV in the presence of gas due to the chemical bonds between NO2 gas and BaCO3, and the NO2 reaction creates a depletion layer deeply into the surface and bulk [40]. A stronger thermal activation of the Arrhenius type was observed for BaCO3. It is known that the higher the activation energy, the smaller the energy gap [41]. The question arises of what mechanism is responsible for the electrical conductivity in the BaCO3 under study. Therefore, it is likely that the thermal energy kT was able to activate the electrons in these compounds. At high temperatures, more electrons are thermally activated into the conduction band, leaving positively charged particles (holes) in the valence band. Thus, the conductance increased with increasing temperatures. The semiconductor-like behavior observed for the current BaCO3 may come from the bandgap modification due to the fabrication of a highly defective nanostructure, which is highly suitable for sensing properties.
The reaction between the gas and sensing layer is considered a surface phenomenon, where the gas reacts directly with the oxide surface or through the oxygen species. The interaction of NO2 and the nonstoichiometric surface of BaCO3 results in the formation of NO2 adsorbed species. On the nonstoichiometric surface, the stable adsorption sites of nitrogen dioxide are bound to more than two barium ions due to the oxygen vacancies, where two oxygen atoms are coordinated with the barium cations. The reaction of NO2 on the oxide surface was found to exhibit a highly complex behavior [42,43,44,45,46]. It was found that the reaction of NO2 with the surface is dependent on the surface temperatures due to the availability of electrons and oxygen species. At surface temperatures lower than 200 °C, NO2 was found to reversely oxidize the surface [42]. At surface temperatures of 200 °C up to 400 °C, an oxidizing reaction by oxygen ions occurred, giving way to the normally observed oxidation behavior. At this high temperature, poisoning effects were observed. The poisoning effect was associated with the creation of higher molecular species containing at least two nitrogen atoms such as N 2 O 4   surf 2 . Moreover, NO2 can react with the electron surface directly or through surface oxygen species. In addition, the oxygen molecules adsorb on the surface in different forms such as O2 at a temperature less than 200 °C, O at 200–400 °C, and O2 at higher temperatures [42,47]. According to the results described above, a part of the adsorbed molecules of NO2 bonded with surface electrons to form nitrite ( NO 2 ) at the nonstoichiometric surface of BaCO3 at low temperatures (<200 °C), as a possible reaction:
NO 2   gas   + e NO 2
where the formation of NO 2 is thermally activated, indicating the increase in the sensor response with the increase in temperature up to 250 °C, as shown in Figure 6. The mechanism of such a reaction is shown in Figure 11. The increase in sensor response with the increase in the operating temperature up to the maximum of 250 °C can be ascribed to the nature of the sensing layer; the sensing layer has very low conduction carrier density at lower temperatures, and this density increases with the increase in the temperature. This nature is like the semiconductor nature, as shown in Figure 7. Thus, with an increase in the conduction electrons in BaCO3, NO2 molecules react with more electrons, increasing the sensor response. However, a further increase in the operating temperature (>250 °C) may result in low adsorption and low diffusion of the gas molecules into the sensing layer, resulting in a decrease in the sensor response. Thus, the amount of adsorbed NO2 molecules decreases with increase in temperature; in addition, the gas sensing properties are determined out at 1.0 atom (not pressured gas). Moreover, it is known that the adsorption of gas molecules is sensitive to the surface temperature [48,49]. At higher temperatures, NO2 molecules also may react with O , forming unidentate nitrate ( NO 3 ), as observed by Raman spectroscopy [43]. This NO 3 does not play a role in the sensing, since the carriers of the oxide will not change, and only the charge is transferred from surface species of O to NO2, which form NO 3 , as follows:
NO 2   gas   + O NO 3
NO 3 is also dissociated from the NO2 gas molecule and O through the reverse reaction (8). NO 2 may desorb through the reverse reaction (7) or the following reaction:
NO 2 NO gas + O
At moderating temperature, direct interaction of adsorbed NO2 molecules with the surface may be likely (Figure 13b):
O 2   gas + e NO gas + O surf
With an increase in the temperature, the adsorption of gas onto the surface may be reduced, causing a decrease in the charge exchange between NO2 molecules and the oxide surface. Furthermore, we can also propose another suitable mechanism based on the Coulomb interaction force. In its nature, NO2 is a reactive molecule, and the electronegativity of oxygen and nitrogen is 3.44 and 3.04, respectively. Due to the difference in electronegativity, the NO bond ensures some non-zero dipole moment in the direction of oxygen. The electronegativity of an atom is its strength to attract the bonded electrons towards it. Thus, the physical adsorption of the NO2 molecules is enough to create a Coulomb force (electric dipole) between the BaCO3 and NO2, creating a depletion layer, as shown in Figure 13c. This type of electric dipole causes an increase in the sensor resistance due to the freezing of the electrons in BaCO3.
In the last decade, one-dimensional (1D) semiconductor nanostructures have become the focus of intense research due to their distinctive application in the fabrication of electronic and optoelectronic devices and sensors at the nanometer scale [1]. They have new properties that are intrinsically linked to reduced dimension and size, which opens new applications that their predecessors did not have. When we use nanomaterials in the form of nanoparticles, we work with average grain size, but when using 1D materials, the sensor has a different geometry according to the dimensions of the nanowires. Some studies have been conducted recently on the dependence of the sensing properties of material oxides based on the geometric parameters of the nanomaterials that make up the sensing layer, such as nanoparticles, microwires, and nanowires. It was found that nanowires have high sensitivity toward nitrogen dioxide NO2 gas compared to microwires and nanoparticles. This may be attributed to the fact that in the case of nanowires, there is a decrease in the density of grain boundaries and an increase in the contributions of metal oxide and electrode contacts, which led to an increase in the contribution of the interaction of the spillover effect. In addition, the potential barrier for electronic conduction strongly depends on the ratio of the grain diameter to the thickness of the depletion layer (called Debye length) [25]. When the diameter of the nanowires is small compared to the Debye length layer, the conduction channel becomes very narrow, which makes the nanowires more sensitive to gas molecules adsorbed on their surface. The congruence of the carrier screening length with the lateral dimensions of the carrier makes nanowires highly sensitive and efficient transducers of surface chemical processes into electrical signals. These results may explain the sensitivity of BaCO3 nanowires observed here.

5. Conclusions

In summary, a novel one-dimensional BaCO3 nanostructure was synthesized by one-pot thermal deposition using Ba as a raw source. The nanostructures were indexed on the orthorhombic structure of BaCO3 with dominant growth directions of (111) and (200). The deposition was carried out at a low vacuum of 0.85 torr, temperature of 850 °C, and source weight of 10 mg of Ba. The morphology of the thick layer prepared at 0.85 torr was described as a Datura-like grain with an extension to nanowires. The diameter of the nanowire was 20–50 nm, and its length was 5.0 µm. The BaCO3 nanostructure prepared by the current method exhibited a semiconductor-like behavior with an activation energy of 0.68 eV. This behavior was ascribed to the nature of the morphology, which may possess large defective points. Thus, this nanostructure was subjected to gas sensing measurements, and it showed high activity toward NO2 gas. The morphology was promising for NO2 detection. It showed the ability to detect NO2 at a wide temperature range of 150 to 350 °C. The temperature and gas concentration dependence of the sensor response were examined. The maximum response of 313% was observed at a temperature of 250 °C. The sensor exhibits the capability of tracing the increase in NO2 gas concentration. Although the sensor was exposed to different levels of humidity, it still performed well against NO2 gas at 250 °C.

Funding

This work was supported by [Al Bilad Bank Scholarly Chair for Food Security in Saudi Arabia], Deanship of Scientific Research, Vice Presidency for Graduate Studies and Scientific Research, King Faisal University, Saudi Arabia (Grant No. CHAIR63).

Institutional Review Board Statement

Not applicable.

Informed Consent Statement

Not applicable.

Data Availability Statement

Data are available on request.

Acknowledgments

The author thanks Toshinari Yamazaki, University of Toyama, Japan, for his support in measuring FESEM and EDX.

Conflicts of Interest

The author declares no conflict of interest.

References

  1. Shaalan, N.M.; Yamazaki, T.; Kikuta, T. Influence of morphology and structure geometry on NO2 gas-sensing characteristics of SnO2 nanostructures synthesized via a thermal evaporation method. Sens. Actuators B Chem. 2011, 153, 11–16. [Google Scholar] [CrossRef]
  2. Shaalan, N.M.; Yamazaki, T.; Kikuta, T. Effect of micro-electrode geometry on NO2 gas-sensing characteristics of one-dimensional tin dioxide nanostructure microsensors. Sens. Actuators B Chem. 2011, 156, 784–790. [Google Scholar] [CrossRef]
  3. Rashad, M.; Shaalan, N.M.; Hafiz, M.M. Enhanced photocatalytic of Zno nanostructures via shape controlled platinum thin film. Dig. J. Nanomater. Biostruct. 2015, 10, 823–830. [Google Scholar]
  4. Zhang, H.; Hu, C.; Zhang, M.; Yang, R.; Zheng, C. Synthesis of BaCO3 nanowires and their humidity sensitive property. J. Nanosci. Nanotechnol. 2011, 11, 10706–10709. [Google Scholar] [CrossRef]
  5. Li, J.-M.; Wei, D.-P.; Hu, Y.-B.; Fang, J.; Xu, Z.-A. Synthesis of ultrafine green-emitting BaCO3 nanowires with 18.5 nm-diameter by CO2 vapor-assisted electrospinning. CrystEngComm 2014, 16, 964–968. [Google Scholar] [CrossRef]
  6. Zhu, W.; Cai, C.; Lin, J.; Wang, L.; Chen, L.; Zhuang, Z. Polymer micelle-directed growth of BaCO3 spiral nanobelts. Chem. Commun. 2012, 48, 8544–8546. [Google Scholar] [CrossRef]
  7. Hertzberg, B.; Sviridov, L.; Stach, E.A.; Gupta, T.; Steingart, D. A Manganese-Doped Barium Carbonate Cathode for Alkaline Batteries. J. Electrochem. Soc. 2014, 161, A835–A840. [Google Scholar] [CrossRef] [Green Version]
  8. Shahid, T.; Arfan, M.; Zeb, A.; BiBi, T.; Khan, T.M. Preparation and physical properties of functional barium carbonate nanostructures by a facile composite-hydroxide-mediated route. Nanomater. Nanotechnol. 2018, 8. [Google Scholar] [CrossRef] [Green Version]
  9. Kim, D.Y.; Kang, H.; Choi, N.-J.; Park, K.H.; Lee, H.-K. A carbon dioxide gas sensor based on cobalt oxide containing barium carbonate. Sens. Actuators B Chem. 2017, 248, 987–992. [Google Scholar] [CrossRef]
  10. Cao, X.; Zhang, Z.; Zhang, X. A novel gaseous acetaldehyde sensor utilizing cataluminescence on nanosized BaCO3. Sens. Actuators B Chem. 2004, 99, 30–35. [Google Scholar] [CrossRef]
  11. Hong, T.; Brinkman, K.S.; Xia, C. Barium Carbonate Nanoparticles as Synergistic Catalysts for the Oxygen Reduction Reaction on La0.6Sr0.4Co0.2Fe0.8O3−δSolid-Oxide Fuel Cell Cathodes. ChemElectroChem 2016, 3, 805–813. [Google Scholar] [CrossRef]
  12. Chen, G.; Chen, J.; Peng, J. Homogeneous precipitation synthesis of BaCO3 powders with a needle-like morphology. Green Process. Synth. 2018, 7, 225–230. [Google Scholar] [CrossRef]
  13. Chen, G.; Chang, X.; Chen, J.; Zhao, W.; Peng, J. Investigation of BaCO3 Powders Synthesized by Microwave Homogeneous Precipitation. High Temp. Mater. Process. 2015, 34, 757–764. [Google Scholar] [CrossRef]
  14. Lee, J.-S.; Lee, J.-H.; Hong, S.-H. NASICON-based amperometric CO2 sensor using Na2CO3–BaCO3 auxiliary phase. Sens. Actuators B Chem. 2003, 96, 663–668. [Google Scholar] [CrossRef]
  15. Obata, K.; Shimanoe, K.; Miura, N.; Yamazoe, N. NASICON devices attached with Li2CO3-BaCO3 auxiliary phase for CO2 sensing under ambient conditions. J. Mater. Sci. 2003, 38, 4283–4288. [Google Scholar] [CrossRef]
  16. Matsubara, S.; Kaneko, S.; Morimoto, S.; Shimizu, S.; Ishihara, T.; Takita, Y. A practical capacitive type CO2 sensor using CeO2/BaCO3/CuO ceramics. Sens. Actuators B Chem. 2000, 65, 128–132. [Google Scholar] [CrossRef]
  17. Usher, T.-M.; Kavey, B.; Caruntu, G.; Page, K. Effect of BaCO3 Impurities on the Structure of BaTiO3 Nanocrystals: Implications for Multilayer Ceramic Capacitors. ACS Appl. Nano Mater. 2020, 3, 9715–9723. [Google Scholar] [CrossRef]
  18. Kou, L.; Zhang, D.; Liu, D. A Novel Medical E-Nose Signal Analysis System. Sensors 2017, 17, 402. [Google Scholar] [CrossRef] [Green Version]
  19. Shirui, Z.; Jihua, W.; Daming, D.; Wengang, Z.; Xiande, Z. A Review of Contact Sensors Used for Monitoring Malodorous Gas in Animal Facilities. Adv. Mater. Res. 2013, 629, 655–661. [Google Scholar] [CrossRef]
  20. Shaalan, N.; Hamad, D. Low-temperature hydrogen sensor based on sputtered tin dioxide nanostructures through slow deposition rate. Appl. Surf. Sci. 2022, 598, 153857. [Google Scholar] [CrossRef]
  21. Li, G.; Xia, Y.; Tian, Y.; Wu, Y.; Liu, J.; He, Q.; Chen, D. Review—Recent Developments on Graphene-Based Electrochemical Sensors toward Nitrite. J. Electrochem. Soc. 2019, 166, B881–B895. [Google Scholar] [CrossRef]
  22. Zhang, Y.; Nie, J.; Wei, H.; Xu, H.; Wang, Q.; Cong, Y.; Tao, J.; Chu, L.; Zhou, Y.; Wu, X. Electrochemical detection of nitrite ions using Ag/Cu/MWNT nanoclusters electrodeposited on a glassy carbon electrode. Sens. Actuators B Chem. 2018, 258, 1107–1116. [Google Scholar] [CrossRef]
  23. Lee, S.W.; Jung, H.G.; Jang, J.W.; Park, D.; Lee, D.; Kim, I.; Kim, Y.; Cheong, D.Y.; Hwang, K.S.; Lee, G.; et al. Graphene-Based Electronic Textile Sheet for Highly Sensitive Detection of NO2 and NH3. Sens. Actuators B Chem. 2021, 345, 130361. [Google Scholar] [CrossRef]
  24. Ali, S.; Gupta, A.; Shafiei, M.; Langford, S. Recent Advances in Perylene Diimide-Based Active Materials in Electrical Mode Gas Sensing. Chemosensors 2021, 9, 30. [Google Scholar] [CrossRef]
  25. Jarvis, D.; Adamkiewicz, G.; Heroux, M.-E.; Rapp, R.; Kelly, F.; Jarvis, D.; Adamkiewicz, G.; Heroux, M.-E.; Rapp, R.; Kelly, F. Nitrogen Dioxide. In WHO Guidelines for Indoor Air Quality: Selected Pollutants; World Health Organization: Geneva, Switzerland, 2010; Volume 5. [Google Scholar]
  26. Gillespie-Bennett, J.; Pierse, N.; Wickens, K.; Crane, J.; Howden-Chapman, P.; Shields, H.; Viggers, H.; Free, S.; Phipps, R.; Fjallstrom, P.; et al. The respiratory health effects of nitrogen dioxide in children with asthma. Eur. Respir. J. 2011, 38, 303–309. [Google Scholar] [CrossRef] [Green Version]
  27. US Department of Health and Human Services. Agency for Toxic Substances and Disease Registry. In Nitrogen Oxides (NO, NO 2, and others) CAS 10102-43-9; UN 1660 (NO) CAS 10102-44-0; UN 1067 (NO 2) UN 1975 (Mixture); ATSDR: Atlanda, GA, USA, 1975; Volume 1660. [Google Scholar]
  28. Chauhan, A.J.; Krishna, M.T.; Frew, A.J.; Holgate, S.T. Exposure to nitrogen dioxide (NO2) and respiratory disease risk. Rev. Environ. Health 1998, 13, 73–90. [Google Scholar]
  29. Shivakumar, M.; Nagashree, K.L.; Manjappa, S.; Dharmaprakash, M.S. Electrochemical Detection of Nitrite Using Glassy Carbon Electrode Modified with Silver Nanospheres (AgNS) Obtained by Green Synthesis Using Pre-hydrolysed Liquor. Electroanalysis 2017, 29, 1434–1442. [Google Scholar] [CrossRef]
  30. Mo, R.; Wang, X.; Yuan, Q.; Yan, X.; Su, T.; Feng, Y.; Lv, L.; Zhou, C.; Hong, P.; Sun, S.; et al. Electrochemical Determination of Nitrite by Au Nanoparticle/Graphene-Chitosan Modified Electrode. Sensors 2018, 18, 1986. [Google Scholar] [CrossRef] [Green Version]
  31. Antao, S.M.; Hassan, I. BaCO3: High-temperature crystal structures and the Pmcn→R3m phase transition at 811 °C. Phys. Chem. Miner. 2007, 34, 573–580. [Google Scholar] [CrossRef]
  32. Shackelford, J.F. Introduction to Materials Science for Engineers; Pearson Education, Inc., New Jersey Library: Upper Saddle River, NJ, USA, 2003; p. 463. [Google Scholar]
  33. Stuart, K.T. Chapter: Semiconductor Materials. In Microelectronics, 2nd ed.; Whitaker, J.C., Ed.; CRC Press: Boca Raton, FL, USA, 2006. [Google Scholar] [CrossRef]
  34. Anderson, J.H., Jr.; Parks, G.A. Electrical conductivity of silica gel in the presence of adsorbed water. J. Phys. Chem. 1968, 72, 3662–3668. [Google Scholar] [CrossRef]
  35. Chen, Z.; Lu, C. Humidity Sensors: A Review of Materials and Mechanisms. Sens. Lett. 2005, 3, 274–295. [Google Scholar] [CrossRef] [Green Version]
  36. Shaalan, N.; Yamazaki, T.; Kikuta, T. Synthesis of metal and metal oxide nanostructures and their application for gas sensing. Mater. Chem. Phys. 2011, 127, 143–150. [Google Scholar] [CrossRef]
  37. Dai, Z.; Pan, Z.; Wang, Z.L. Novel Nanostructures of Functional Oxides Synthesized by Thermal Evaporation. Adv. Funct. Mater. 2003, 13, 9–24. [Google Scholar] [CrossRef]
  38. Kresse, R.; Baudis, U.; Jäger, P.; Riechers, H.H.; Wagner, H.; Winkler, J.; Wolf, H.U. Barium and Barium Compounds. In Ullmann’s Encyclopedia of Industrial Chemistry; Wiley: Hoboken, NJ, USA, 2007. [Google Scholar] [CrossRef] [Green Version]
  39. Patterson, A.L. The Scherrer Formula for X-ray Particle Size Determination. Phys. Rev. 1939, 56, 978–982. [Google Scholar] [CrossRef]
  40. Broqvist, P.; Panas, I.; Grönbeck, H. Toward a Realistic Description of NOx Storage in BaO: The Aspect of BaCO3. J. Phys. Chem. B 2005, 109, 9613–9621. [Google Scholar] [CrossRef]
  41. Sawicki, B.; Tomaszewicz, E.; Piątkowska, M.; Groń, T.; Duda, H.; Górny, K. Correlation between the Band-Gap Energy and the Electrical Conductivity in MPr2W_2O10Tungstates (Where M = Cd, Co, Mn). Acta Phys. Pol. A 2016, 129, 94–96. [Google Scholar] [CrossRef]
  42. Ruhland, B.; Becker, T.; Müller, G. Gas-kinetic interactions of nitrous oxides with SnO2 surfaces. Sens. Actuators B Chem. 1998, 50, 85–94. [Google Scholar] [CrossRef]
  43. Sergent, N.; Epifani, M.; Comini, E.; Faglia, G.; Pagnier, T. Interactions of nanocrystalline tin oxide powder with NO2: A Raman spectroscopic study. Sens. Actuators B Chem. 2007, 126, 1–5. [Google Scholar] [CrossRef]
  44. Kim, S.; Kim, D.-H.; Park, S.-G. Highly sensitive and on-site NO2 SERS sensors operated under ambient conditions. Analyst 2018, 143, 3006–3010. [Google Scholar] [CrossRef]
  45. Harrar, J.E.; Rigdon, L.P.; Rice, S.F. Raman spectral study of solutions of N2O4 and N2O5 in nitric acid. J. Raman Spectrosc. 1997, 28, 891–899. [Google Scholar] [CrossRef]
  46. Shaalan, N.; Yamazaki, T.; Kikuta, T. NO2 response enhancement and anomalous behavior of n-type SnO2 nanowires functionalized by Pd nanodots. Sens. Actuators B Chem. 2012, 166-167, 671–677. [Google Scholar] [CrossRef]
  47. Shaalan, N.M.; Morsy, A.E.A.; Abdel-Rahim, M.A.; Rashad, M. Simple preparation of Ni/CuO nanocomposites with superior sensing activity toward the detection of methane gas. Appl. Phys. A 2021, 127, 1–12. [Google Scholar] [CrossRef]
  48. Wang, X. Chapter 4—Lacustrine Shale Gas Occurrence Characteristics. In Lacustrine Shale Gas; Gulf Professional Publishing: Houston, TX, USA, 2017; pp. 179–241. [Google Scholar] [CrossRef]
  49. Flores, R.M. Chapter 4—Coalification, Gasification, and Gas Storage. In Coal and Coalbed Gas Fueling the Future; Elsevier: Boston, MA, USA, 2013; pp. 167–233. [Google Scholar] [CrossRef]
Figure 1. (a) Steps of Ba transport from the storage bottle to the air and ethanol; (b) evaporation design includes double crucibles placed in a vacuum stainless-steel chamber.
Chemosensors 10 00230 g001
Figure 2. Scheme of gas sensing apparatus used for the sensing measurements.
Chemosensors 10 00230 g002
Figure 3. (a,b) FE-SEM micrographs and (c) EDX for deposited BaCO3 nanostructures prepared at 0.85 torr.
Chemosensors 10 00230 g003
Figure 4. XRD patterns of calculated BaO, BaCO3 (orthorhombic), and synthesized BaCO3 at 0.85 torr. Note: Ba(CO3)2 (monoclinic) is only for comparison.
Chemosensors 10 00230 g004
Figure 5. The change in sensor conductance for BaCO3 nanowires upon exposure to 2.0 ppm of NO2 gas at a working temperature range of 150–350 °C.
Chemosensors 10 00230 g005
Figure 6. The sensor response of BaCO3 nanowires versus the temperature.
Chemosensors 10 00230 g006
Figure 7. The resistance of BaCO3 nanowires versus the temperature in air and the air containing 2.0 ppm NO2 gas. The inset shows the logarithm of conductance of BaCO3 nanowires versus the inverse of temperature.
Chemosensors 10 00230 g007
Figure 8. The signal at various gas concentrations for BaCO3 nanowires.
Chemosensors 10 00230 g008
Figure 9. Calibration curve of the fabricated sensor with a fitting curve.
Chemosensors 10 00230 g009
Figure 10. The sensor selectivity toward various gases (NO, H2, and CO) compared to NO2 measured at 250 °C. The inset shows sensor signals toward these gases.
Chemosensors 10 00230 g010
Figure 11. The sensor response toward 2.0 ppm of NO2 at various relative humidity levels. The inset is the change in sensor resistance when exposed to 20–80% RH.
Chemosensors 10 00230 g011
Figure 12. (a) Scheme illustrating the increase in source temperature as a function of time; (b) scheme illustrating the growth mechanism of BaCO3 nanostructures.
Chemosensors 10 00230 g012
Figure 13. Various sensing mechanisms for NO2 reactions with BaCO3: (a) direct reaction of electrons captured by NO2 molecules; (b) dissociation of NO2 to NO and O species; (c) electric-dipole interaction.
Chemosensors 10 00230 g013
Table 1. Sensing parameters for BaCO3 at various operating temperatures.
ParameterOperating Temp. (°C)
150200250300350
Sensor response%6157313200100
Response time constant (s)6891020
Recovery time constant (s)301501006040
Publisher’s Note: MDPI stays neutral with regard to jurisdictional claims in published maps and institutional affiliations.

