1. Introduction
The release of estrogenic pollutants to the environment and natural resources, even at very low concentrations, can cause side effects affecting most organisms and serious ecological damage to the water system [
1]. Natural water resources are contaminated by Equ and other estrogenic hormones that are naturally found in animals and are widely used in postmenopausal hormone supplements in women. These chemicals are rapidly transported to groundwater.
Environmental estrogens, known as estrogenic endocrine disrupting chemicals (e-EDCs), are a subgroup of endocrine disrupting chemicals (EDCs) that modulate the action of the female sex hormones, such as estrone (E1), 17β-estradiol (E2) and estriol (E3). EDCs are compounds that alter the hormonal systems of organisms. Estrogenic hormones included in the list of chemical pollutants published by the US Environmental Protection Agency (US EPA) in 2016 and revised in 2020, can only be detected above certain limits with the detection methods used today.
Equilin (Equ), estrone (E1), 17β-estradiol (E2) and estriol (E3) molecules, which are frequently used for hormonal treatment in humans and animals and are mentioned in EPA’s list, draw attention. In particular, the lack of sensor studies performed with the Equ molecule is a clear problem. In addition, Equ and its derivatives are used as the active ingredient of the drugs used in hormone treatments in the post-menstrual period. Long-term use of these drugs also increases the risk of breast cancer.
Due to its different chemical structure from other estrogenic hormones, Equ has been investigated by stereo chemical analyses to cause miscoding in DNA lesions [
2]. Okahashi et al. (2010) prepared a monoclonal antibody (4OHEN) specific to 4-hydroxyequilenin that attaches to DNA and triggers breast cancer. In the immunoassay where they used their own antibody, they observed that, when a drug containing equilin was administered to a mouse model as a hormone replacement therapy, the levels of 4-OHEN-DNA attachments increased in a time-dependent manner in various tissues, including the uterus and ovaries [
3].
For the determination of equilin and equilenin in the urine of normal postmenopausal women after treatment with conjugated estrogens, Gatti et al. (2000) used a high-performance liquid chromatographic (HPLC) method with fluorescence detection in combination with post-column online photochemical derivatization. They detected to the equilin and equilenin under isocratic conditions with UV irradiation at λ
ex = 280 nm and λ
em = 410 nm in urine samples [
4]. In another study, equilin was detected from the plasma of pregnant women using the Reverse-Phase Liquid Chromatographic Method equipped with a UV detector set at 220 nm and an ODS Hypersil column. With this method, equilin was determined from pregnant women’s plasma with a concentration of 70–800 ng/mL, with 4.20–16.46 intra-assay precision (%CV) and 3.16–9.68 inter-assay precision (%CV) [
5].
It is important to develop a sensor system for the detection of Equilin because of its interactions with DNA and the emergence or progression of many types of cancer (health risk level 0.35 µg/L in water [
6]). Sensors transform their own changes into digital signals that are affected by physical or chemical changes in their environment. As a gravimetric sensor, the Quartz Crystal Microbalance (QCM) sensor system is a surface-sensitive technology used to monitor mass changes (nano grams) at the molecular scale. Mass, which is the basic property of an analyte, is measured by acoustic equipment in QCM [
7].
Real-time changes in frequency due to molecular interactions or reactions occurring on the quartz crystal surface can be monitored through QCM sensing systems. Even the frequency affected by the addition or removal of small amounts of mass can be detected. Quartz crystals with different properties (thickness, various metal-plated and MHz, cutting shape, etc.) are easily available since quartz crystals are affordable; therefore, they can be used for different purposes. In addition, the development of easy-to-use, portable and sensitive QCM sensors that offer on-site measurement is also a reason for preference [
8].
In principle, if the target molecule (analyte) is adsorbed or desorbed on the QCM crystal surface, which is coated with the recognition material, the resonance frequency changes, and the sensogram indicates that the analyte bound on the surface. This is based on determination of the changes in resonance frequency (ΔF) caused by the molecules adsorbed on the sensor surfaces. With the piezoelectric effect, the quartz crystal produces resonance at its natural frequency through the oscillator circuit.
The oscillation frequency depends on the quartz thickness, quartz density, cutting shape, environmental conditions and, most importantly, the mass deposited/removed. The resonance frequency shift (ΔF) of oscillating quartz is linearly related to its mass change (Δm) (Equation (1)). As the mass begins to accumulate on the crystal surface, the oscillation frequency decreases [
9]. Quartz crystal is used as a mass sensor because the oscillation frequency can vary as a function of mass.
Due to the sensitive microbalance, QCMs facilitate a range of liquid measurements, such as biological molecular detection [
10], coupling with liquid chromatography [
11], corrosion imaging [
12] and electrochemical analysis [
13]. It is important to choose the modification molecules that recognize the analyte precisely on the quartz surface. Therefore, sensor sensitivity is highly dependent on the success of surface functionalization. In recent years, the self-assembled monolayer (SAM) approach to surface functionalization has been widely used in electronic devices, such as sensors, micro/nano patterning and thin film transistors to produce ultrasensitive sensor surfaces [
14].
For SAM, as the functional head and end groups of the linker molecule, there is a spontaneous formation of ordered molecular structures with high affinity for the analyte in the presence of weak or strong interactions/bonds with different biomolecules. The most commonly used phenomenon for SAM is gold thiol interactions in gold quartz. In this sense, since 11-mercaptoundecanoic acid (11-MUA) has long alkane chains and carboxyl-containing thiols, SAM can be formed without the need for an extra modification/functionalization step [
15].
Computational molecular modeling studies provide a priori understanding of the outcomes of an experimental study. Computer-aided molecular modeling studies allow researchers timesaving and predict the binding preferences of target molecules to ligands. Molecular docking is a method that determines the conformations that a molecule prefers when bonding to another molecule to form a stable complex. In other words, it is a method that examines the interactions and movements during binding between a ligand and receptor [
16]. Ligand–protein docking can be examined by considering the cases where the ligand is free, the protein (receptor) is rigid or both the ligand and the protein are flexible [
17].
With AutoDockTools, a configuration file must be prepared for the docking calculation [
18]. This configuration file contains the information of the cartesian coordinates of the area center to be docked and the scoring function parameters along with the ligand and target molecule information. By running the program with this file, the binding affinities (binding affinity or strength of the ligand that binds to the receptor) can be determined precisely close to the actual results [
19].
In this study, for the detection of Equ, the gold-coated QCM sensor surface was modified with 11-MUA molecules by forming a SAM, and then amino acids were attached to the SAM 11-MUA-modified sensor surface by secondary interactions. By the Equ flow from the amino-acid-attached QCM nanosensor surface, amino acids that interact more strongly with Equ are removed from the sensor surface. The binding preferences of Equ to three different amino acids, namely Tyr, Trp and Phe, were monitored in real-time QCM measurements. The two amino acids Tyr and Phe were suggested to have a greater affinity towards Equ in the literature, compared to other amino acids, due to their hydrophobic nature; whereas Trp was added to this study as it is also hydrophobic to, thus, make a comparison [
20].
By going beyond the traditional uses of QCM, we detected Equ based on the mass removed from the nanosensor surface, rather than the mass attached. Visualization of the molecular interactions by molecular docking showed the sizes and locations of the binding sites, bind types and their positions. In order to determine the binding sites between Equ and three different amino acids (Tyr, Trp and Phe), molecular docking studies were also performed. In addition, binding energy calculations from docking studies provided information about the interactions energetic favorability. These affinity interactions obtained from molecular modeling studies were confirmed with QCM results.
2. Materials and Methods
2.1. Materials and Devices
11-Mercaptoundecanoic acid (11-MUA) (%98), tyrosine (≥98%), tryptophan (≥98.5%), phenylalanine (≥98%), Equ (≥98%), estrone (≥99%), estriol (≥97%), 17β-estradiol (≥98%), ethanol (96.0–97.2%), di-potassium hydrogen phosphate (anhydrous) and potassium phosphate monobasic (≥99%) were purchased from Sigma-Aldrich (St. Louis, MI, USA). Hydrogen peroxide (30%) and sulfuric acid (95–97%) were purchased from Merck-Millipore (Burlington, MA, USA).
The real-time (online) detection of Equ in aqueous solutions was monitored by a QCM sensing system (OpenQCM−1, Novaetech, Pompeii, Italy). A 5 MHz AT fundamental cut quartz crystal sensor with gold surface was used for the QCM experiments (Novaetech, Italy). The openQCM Wi2 open source software was used for monitoring the real time QCM measurements. The structural and physical characterizations of the modified QCM electrodes were confirmed by Attenuated Total Reflection Fourier-Transform Infrared Spectroscopy (ATR-FTIR, Thermo Fisher-Nicolet is50, Waltham, MA, USA) and constant drop contact angle (CA, Biolin Scientific-Attension Theta, Helsinki, Finland).
2.2. Molecular Docking Studies
2.2.1. Software and Operating Systems
In this study, AutoDock v4.2.6 was used with the AutoDockTools GUI (Graphical User Interface) component v1.5.6. AutoGrid was used for the calculation module (grid complex) and was developed by the Scripps Research Institute [
21]. UCSF Chimera v.1.15rc was used for the preparation of ligand [
22] and protein structures under a Windows 10 Enterprise v.20H2, Monster workstation with an Intel(R) Core(TM) i7-10750H CPU@2.6 GHz processor, 16-GB RAM and 512-GB solid state drive running a Windows operating system [
23].
2.2.2. Dock Preparation and Targeting Binding Sites
The eight PDB files (PDB IDs: 1EQU for equilin, 5HS6 for estrone, 1X8V for estriol, 1A27 for 17β-estradiol, 2HDX for tyrosine, 2WEU for tryptophan, 3MK2 for phenylalanine and 2QNX for 11-mercaptoundecanoic acid) used in the study were accessed from
https://www.rcsb.org/search (accessed on 1 September 2020). Since the -SH end of the 11-MUA molecule will hold onto the gold surface of the QCM sensor in experimental studies, this terminal was blocked for computer modeling studies as well.
The ligands and amino acids prepared for docking in Chimera were first processed with AutoGrid [
24]. Then, AutoDockTools were used to determine which ties in the ligand would be treated as rotatable and to analyze their positions [
25]. The Molecular Modeling Toolkit operations was used to minimize templates. AddH and AddCharge commands were used to add and remove hydrogen to the molecules, respectively [
26]. The Gasteiger method used was based on the partial equation of charges by determining rotatable and stationary atoms [
27].
In AutoDock v4.2.6, the active sites, which were targeting molecules of the Tyr, Trp and Phe amino acids to interact with estrogenic hormones (equilin, estrone, estriol and 17β-estradiol) and 11-MUA were studied using various docking parameters in Lamarckian Genetic Algorithm v4.2. For the docking, the Lamarckian Genetic Algorithm (LGA) was used with various configurations, such as the rate of gene mutation 0.02, rate of crossover 0.8 and 2.5 × 10⁷ evaluation numbers as default. The target coordinates were clearly stated as a 40 × 40 × 40-point grid box where the values were counted along the x, y and z axes with 0.368 Å of spacing, respectively. For all conformations, the amino acids were preserved during the docking process, while the hormones were still flexible. Ten iterations were run for each calculation.
2.3. QCM Experiments
Piranha solution (concentrated sulfuric acid (H2SO4) and 30% hydrogen peroxide (H2O2) (3:1, v/v) mixture) was used to clean all bare gold quartz surfaces. The quartz sensor was washed with piranha solution for 3 min and then dried after rinsing with deionized water and then with ethanol. The cleaned and dried gold-coated quartz sensors were immersed in the freshly prepared 11-MUA solution in ethanol at 4 mM of concentration and incubated for 16 h for SAM formation. At the end of the incubation time, the QCM nanosensor was rinsed once with ethanol to remove unbound and weakly attached 11-MUA molecules on the surface. Then, the QCM nanosensor was dried and stored at +4 °C until the next use.
2.3.1. Detection of Equ on QCM Nanosensor
The amino acid solutions in the concentration range of 50 µM–2 mM were prepared in 1 mM phosphate buffer. The frequency changes in QCM nanosensors interacting with amino acid solutions of different concentrations were recorded. The highest mass changing was observed under 1 mM amino acid concentration, while the concentrations of amino acids adsorbed on the nanosensor were plotted against each concentration.
The cleaned SAM modified quartz crystal nanosensors were treated with 1 mM Phe, Tyr and Trp solutions separately for 30 min. The amino-acid-treated quartz crystal nanosensors were rinsed with 1 mM phosphate buffer after that time to remove unbound amino acids. The prepared nanosensors were adapted to the QCM system. First, the nanosensor was rinsed with DI water at a 150 µL/min of flow rate for 3 min to reach equilibrium. Then binding solutions containing Equ with concentration ranges between 25–1000 nM were pumped through the flow cell by a peristaltic pump at a constant flow rate of 150 µL/min. The resonance frequency changes (ΔF, Hz) were recorded in real-time monitoring until they became stable for nearly 10 min.
When mass changes due to frequency shift of sensing studies made at different overtones (3, 5, 7 and 9) were compared, seventh overtone data were used as they provided the lowest signal-to-noise ratio. We repeated the same process three times for each concentration and used the average of Δ
F values. The mass change (Δ
m) on the QCM nanosensor was calculated according to the Sauerbrey equation.
Here, ΔF: the resonance frequency shift, Hz; f0: the resonance frequency of quartz crystal, MHz; Δm: the mass change, g; ρq: the quartz density; μq: the shear modulus of quartz for AT-cut crystal; and A: the piezo electrically active crystal area. For a 5 MHz quartz crystal, Cf, Nominal Sensitivity, 17.7 ng/Hz·cm2 and n: overtone number.
2.3.2. Equilibrium Binding Analysis
During the adsorption phenomena, the rate control mechanism takes place in three possible steps. The first of these is mass transfer to the outer surface as soon as adsorption begins. The second is the constant rate reaction. The last is that the adsorption takes place towards the inner layers. The rate control of the adsorption mechanism is explained by pseudo-first and second-order kinetic models. While the pseudo-first-order model is diffusion-controlled, the second-order is chemisorption controlled. In other words, the first is mass transfer and the second is based on chemical reactions. In many systems based on physical adsorption, the pseudo-first order equation is quite commonly used for adsorption of a solute in a solution [
28].
The adsorption under pseudo-first order states in which the analyte concentration endures constant in the flow cell is explained as follows:
where
is time-dependent mass ratio in QCM,
and
is the instantaneous and maximum recorded response signal by adsorption,
c is the concentration of Equ (nM), and
and
are the association (nM/s) and dissociation rate constant (1/s), respectively.
is the binding constant. It is calculated with
. When the system comes to balance,
and the equation may be rewritten:
is obtained from a plot of
versus
and the dissociation constant
is calculated as
. If Equation (2) is rearranged:
A straight line with the slope of
versus
is calculated from
for interaction-controlled kinetics. The initial binding rate is directly proportional to the analyte concentration. The forward and reverse analysis speeds are obtained by calculating
S from the response graph that changes with time due to the total mass change (
) the nanosensor:
where
is calculated from the slope of the line
versus
. This will be a straight line with a slope of
. If
>>
then
is not reliably found from the cut-off point of the graph (
). Therefore,
is calculated by passing the solvent buffer solution of the analyte through the binding sites that are completely saturated:
where
is the initial mass amount and
and
are the values obtained from the desorption curve [
29].
2.3.3. Equilibrium Binding Isotherms
The adsorption isotherm is the equilibrium relationship between the dissolved adsorbate in the liquid phase and the amount of adsorbate adsorbed on the adsorbent at constant temperature. The equilibrium binding affinity of Equ towards amino acids is explained by the following adsorption isotherms. Three different isotherm models were fit between Equ and the modified QCM nanosensor: the Langmuir, Freundlich and Langmuir–Freundlich (LF) models. In addition, a Scatchard analysis was also plotted to determine the affinity of the Equ for amino acids.
Here, Δmmax: maximum QCM signal shift (nM/cm2); Δmeq: QCM signal shift at equilibrium (nM/cm2); c: analyte concentration (nM); KA: binding equilibrium constant (nM); KD: dissociation equilibrium constant (1/nM); and 1/n: Freundlich surface heterogeneity index.
The Langmuir adsorption isotherm is explained using Equation (8). This isotherm assumes only the single-layer adsorption of analyte molecules with equal energies at each binding and that no interaction between molecules and neighboring regions occurs. With the Langmuir isotherm, it is proven that the adsorbent surface has a limited number of regions where adsorbate molecules can be adsorbed and that these regions have reached saturation.
The Freundlich adsorption isotherm assumes that the adsorbate molecules are adsorbed to the adsorbent in multiple layers. With the Freundlich model, it is assumed that each functional region on the adsorbent surface has different adsorbing potential. This is a model that depends on whether the neighboring regions are full or not (Equation (9)) [
30]. The Langmuir–Freundlich isotherm defines the adsorption energy on heterogeneous adsorbent surfaces depending on the distribution of the adsorbent on the surface. When the adsorbate concentration is low, this model conforms to the Freundlich isotherm model, while at high concentrations, it conforms to the Langmuir isotherm (Equation (10)) [
31].
2.4. Selectivity Studies of QCM Nanosensor
The selective binding preference of the modified QCM nanosensor was examined using different EDCs (estrone, estriol and 17β-estradiol) at 500 nM concentration in 10 min of interaction time. The binding and equilibrium constants were also calculated for these EDCs interacting with each amino acid. The control studies were also conducted with 11-MUA-modified nanosensors without using amino acids.
2.5. Reuse of QCM Nanosensor
In order to examine the reusability of the QCM nanosensor, the solutions containing 1000 µM Tyr and 500 nM Equ (with 150 µL/min flow rate) were passed through the SAM 11-MUA-modified nanosensor. For each cycle, Tyr was passed over the nanosensor for an average of 5 min at first, and then the Equ solution was passed for approximately 6–7 min. In the last step, phosphate buffer at pH 4 was passed through the sensor system for an average of 6 min to wash the sensor. The increase and decrease in the resonance frequency were recorded with the amino acid binding and removing steps in real-time monitoring. The reusability of the modified QCM nanosensor was tested employing multiple cycles until no significant decrease was observed.
3. Results and Discussion
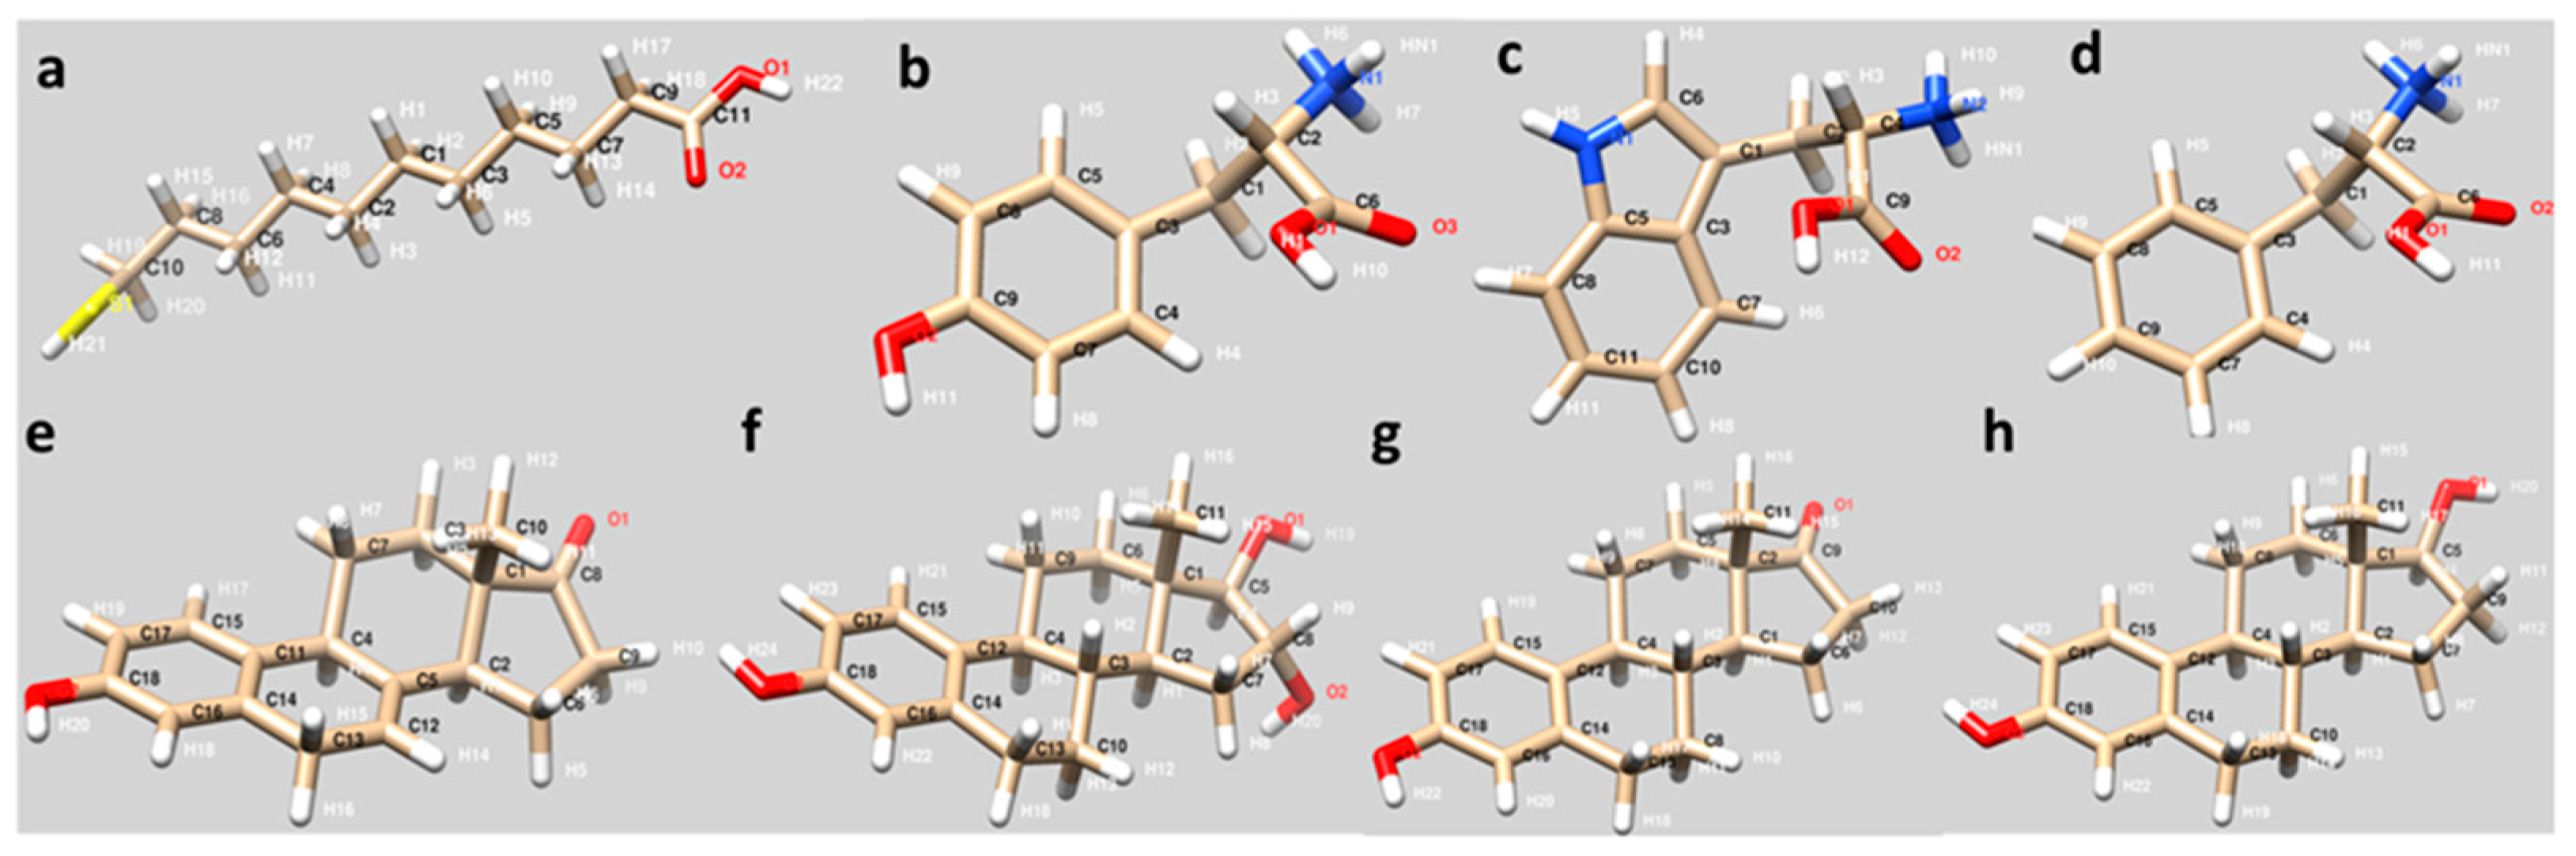
3.1. Molecular Docking of 11-MUA and Amino Acids
The interaction of 11-MUA molecule with three different amino acids (Tyr, Trp and Phe) were investigated by molecular docking experiments. The structures of the molecules prepared and minimalized in the UCSF Chimera software (v.1.15rc, developed by the UCSF Resource for Biocomputing, Visualization, and Informatics (RBVI), University of California, San Francisco, CA, USA) to be used in docking studies are shown in
Figure 1.
In the resulting cluster analysis of conformations for the docking of 11-MUA and Tyr, Trp and Phe, the numbers of distinct conformational clusters were found as 3, 6 and 3 out of 10 runs, respectively. Structurally similar clusters were ranked in order of increasing energy.
When amino acids interact with 11-MUA, binding energy released. According to clustering histogram, the lowest binding energies between 11-MUA and Tyr, Trp and Phe were estimated as −1.65, −2.08 and −1.99 kcal/mol, respectively. The greater the binding energy released, the greater is the affinity of binding. In addition to the docking results, the free energies in the statistical mechanical analysis of 11-MUA and Tyr, Trp and Phe were calculated as −1365.63, −1365.68 and −1366.00 kcal/mol at 298.15 K, respectively, which confirms the binding of 11-MUA and amino acids were energetically favorable (
Table 1).
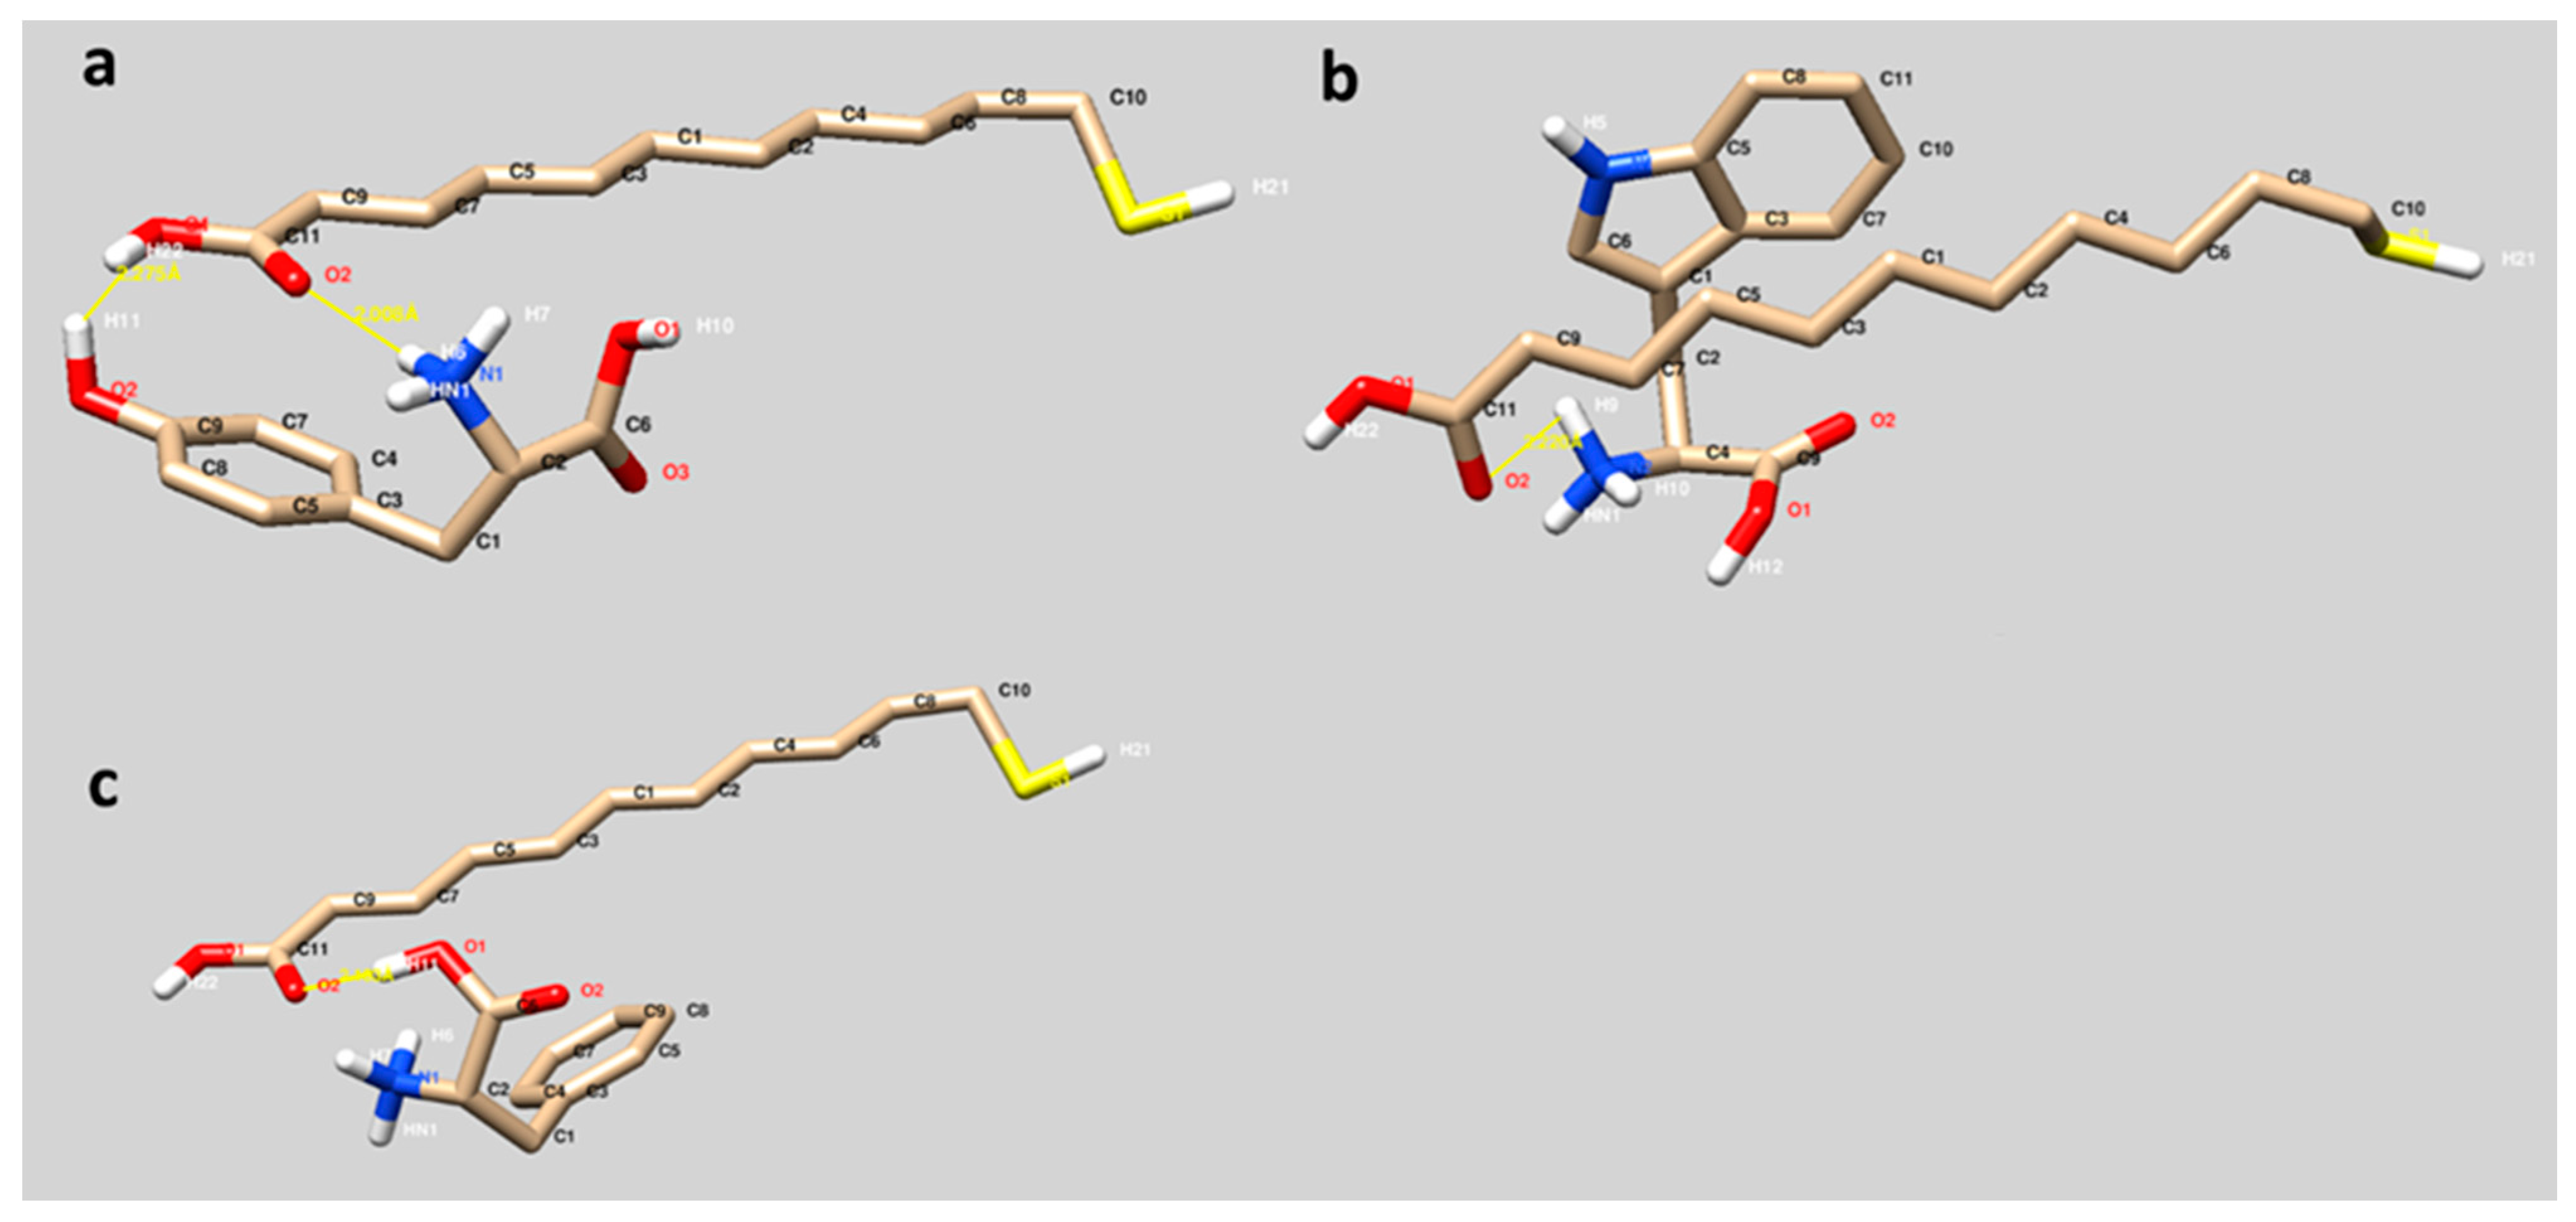
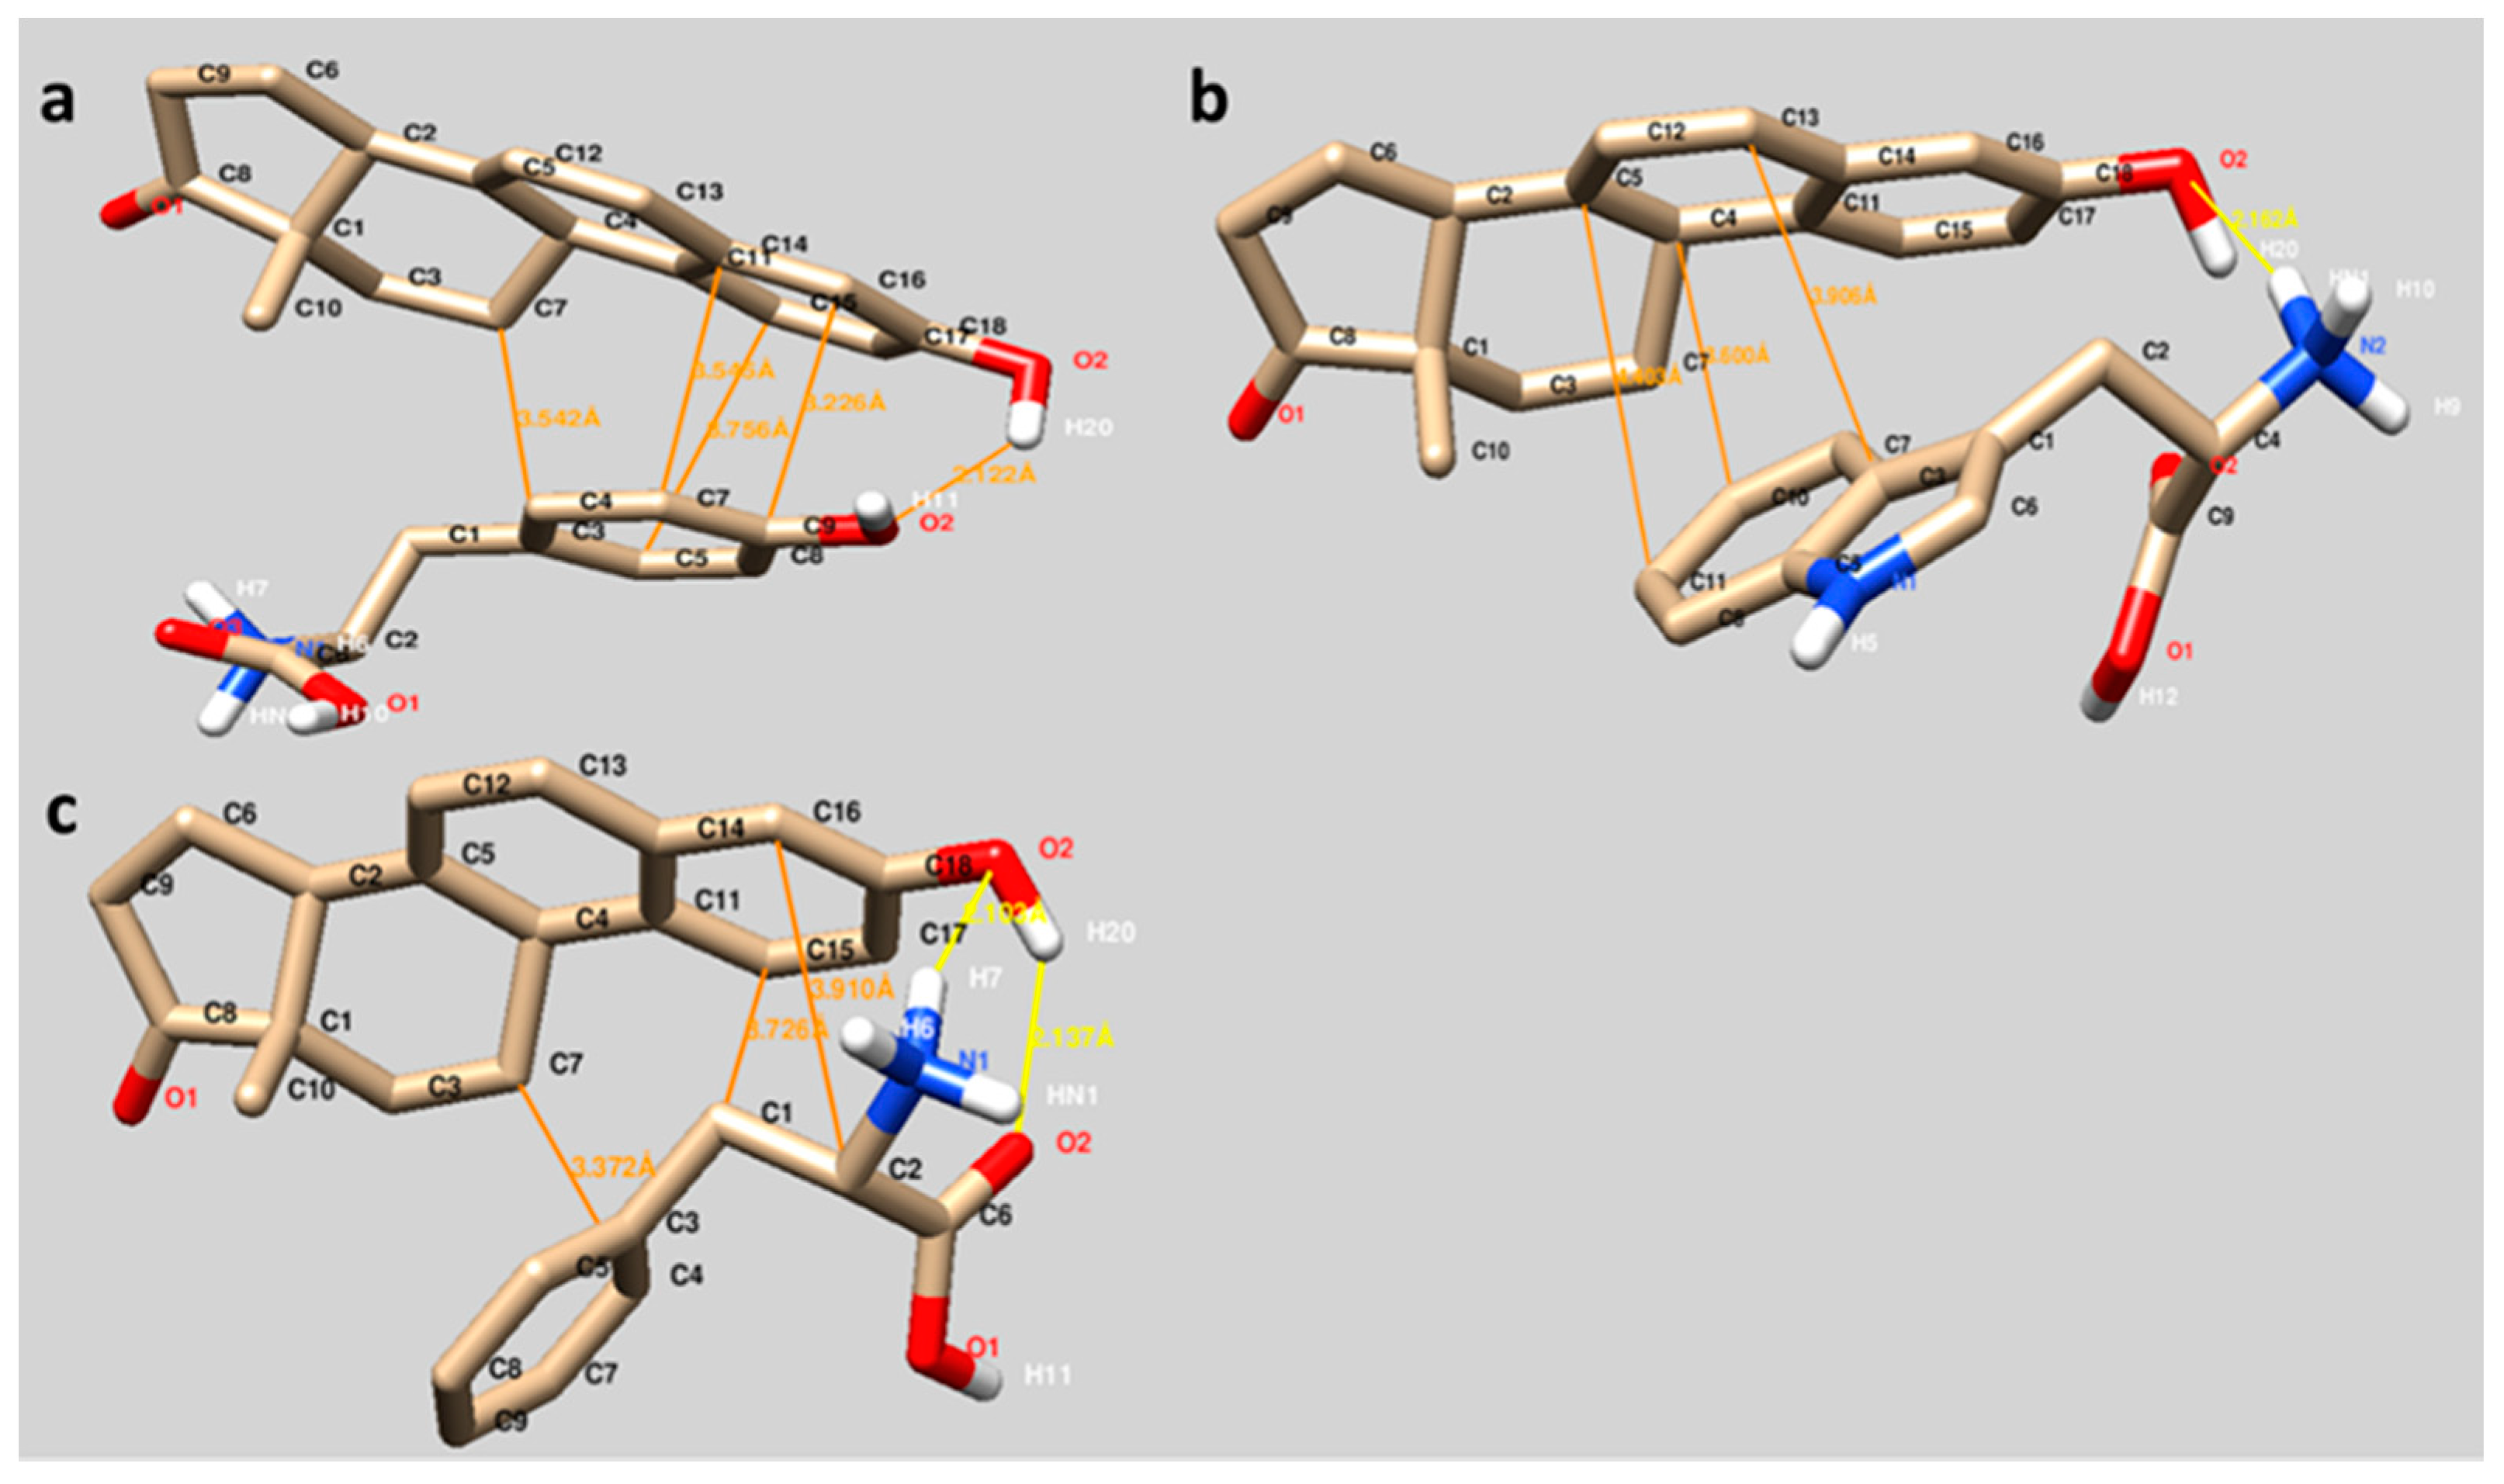
The binding modes of 11-MUA to Tyr, Trp and Phe are visualized in
Figure 2. The interactions between 11-MUA and three different amino acids occurred mainly through the hydrogen bonding (yellow lines). Furthermore, the orientation of all amino acids through the carboxyl side of 11-MUA is significant. Among these hydrogen bonds,
Figure 2a has a particular visual. The 11-MUA and Tyr interaction occurred between O1 and O2 of 11-MUA and hydroxyl group of phenyl residue (O2-H11) and hydrogen atom (H6) of the amine group, respectively (
Figure 2a). In
Figure 2b,c, hydrophobic residues of Trp (indole) and Phe (phenyl) were well fitted to the alkyl chain of the 11-MUA, and therefore hydrophobic interactions may contribute to the binding.
3.2. Molecular Docking of Equ and Amino Acids
According to conformational clustering analysis of Equ and three different amino acids (Tyr, Trp and Phe), the number of distinct conformational clusters were found as 2, 3 and 1 out of 10 runs using a root-mean-square deviation (RMSD)-tolerance of 2.0 Å, respectively. In the clustering histogram, the lowest binding energies between Equ and Tyr, Trp and Phe were estimated as −2.90, −2.57 and −2.76 kcal/mol, respectively (
Table 1). The lowest binding energies of Equ and Tyr, Trp and Phe were slightly lower than 11-MUA and amino acid interactions. The lower the binding energy, the more stable is the interaction.
Thus, the binding affinity of Equ to amino acids are higher than 11-MUA interactions. Moreover, the lowest binding energy with high affinity was estimated for Tyr as −2.90 kcal/mol, which is in conformity with experimental binding constants. This finding supports the easy scavenging of amino acids (Tyr, Trp and Phe) by Equ molecules. In addition, the free energies resulted in the statistical mechanical analysis of Equ in accordance with Tyr, Trp and Phe were calculated as −1367.10, −1366.73 and −1367.00 kcal/mol at 298.15 K, respectively. The interactions between Equ and Tyr, Trp and Phe were also energetically favorable (
Table 1).
The binding sites of Equ to three different amino acids (Tyr, Trp and Phe) are visualized in
Figure 3. The interactions between Equ and Tyr, Trp and Phe mainly occurred through hydrophobic interactions (orange lines). As seen in
Figure 3, the hydrophobic residues of Tyr (phenyl ring,
Figure 3a), Trp (indole group,
Figure 3b) and Phe (phenyl residue,
Figure 3c) are well oriented in the Equ ring system, in which the hydrophobic interactions may also contribute to the binding.
Table 1 summarizes the lowest binding energies and free energies of 11-MUA and Equ in accordance with three different amino acids theoretically.
3.3. QCM Experiments
3.3.1. QCM Nanosensor Characterization
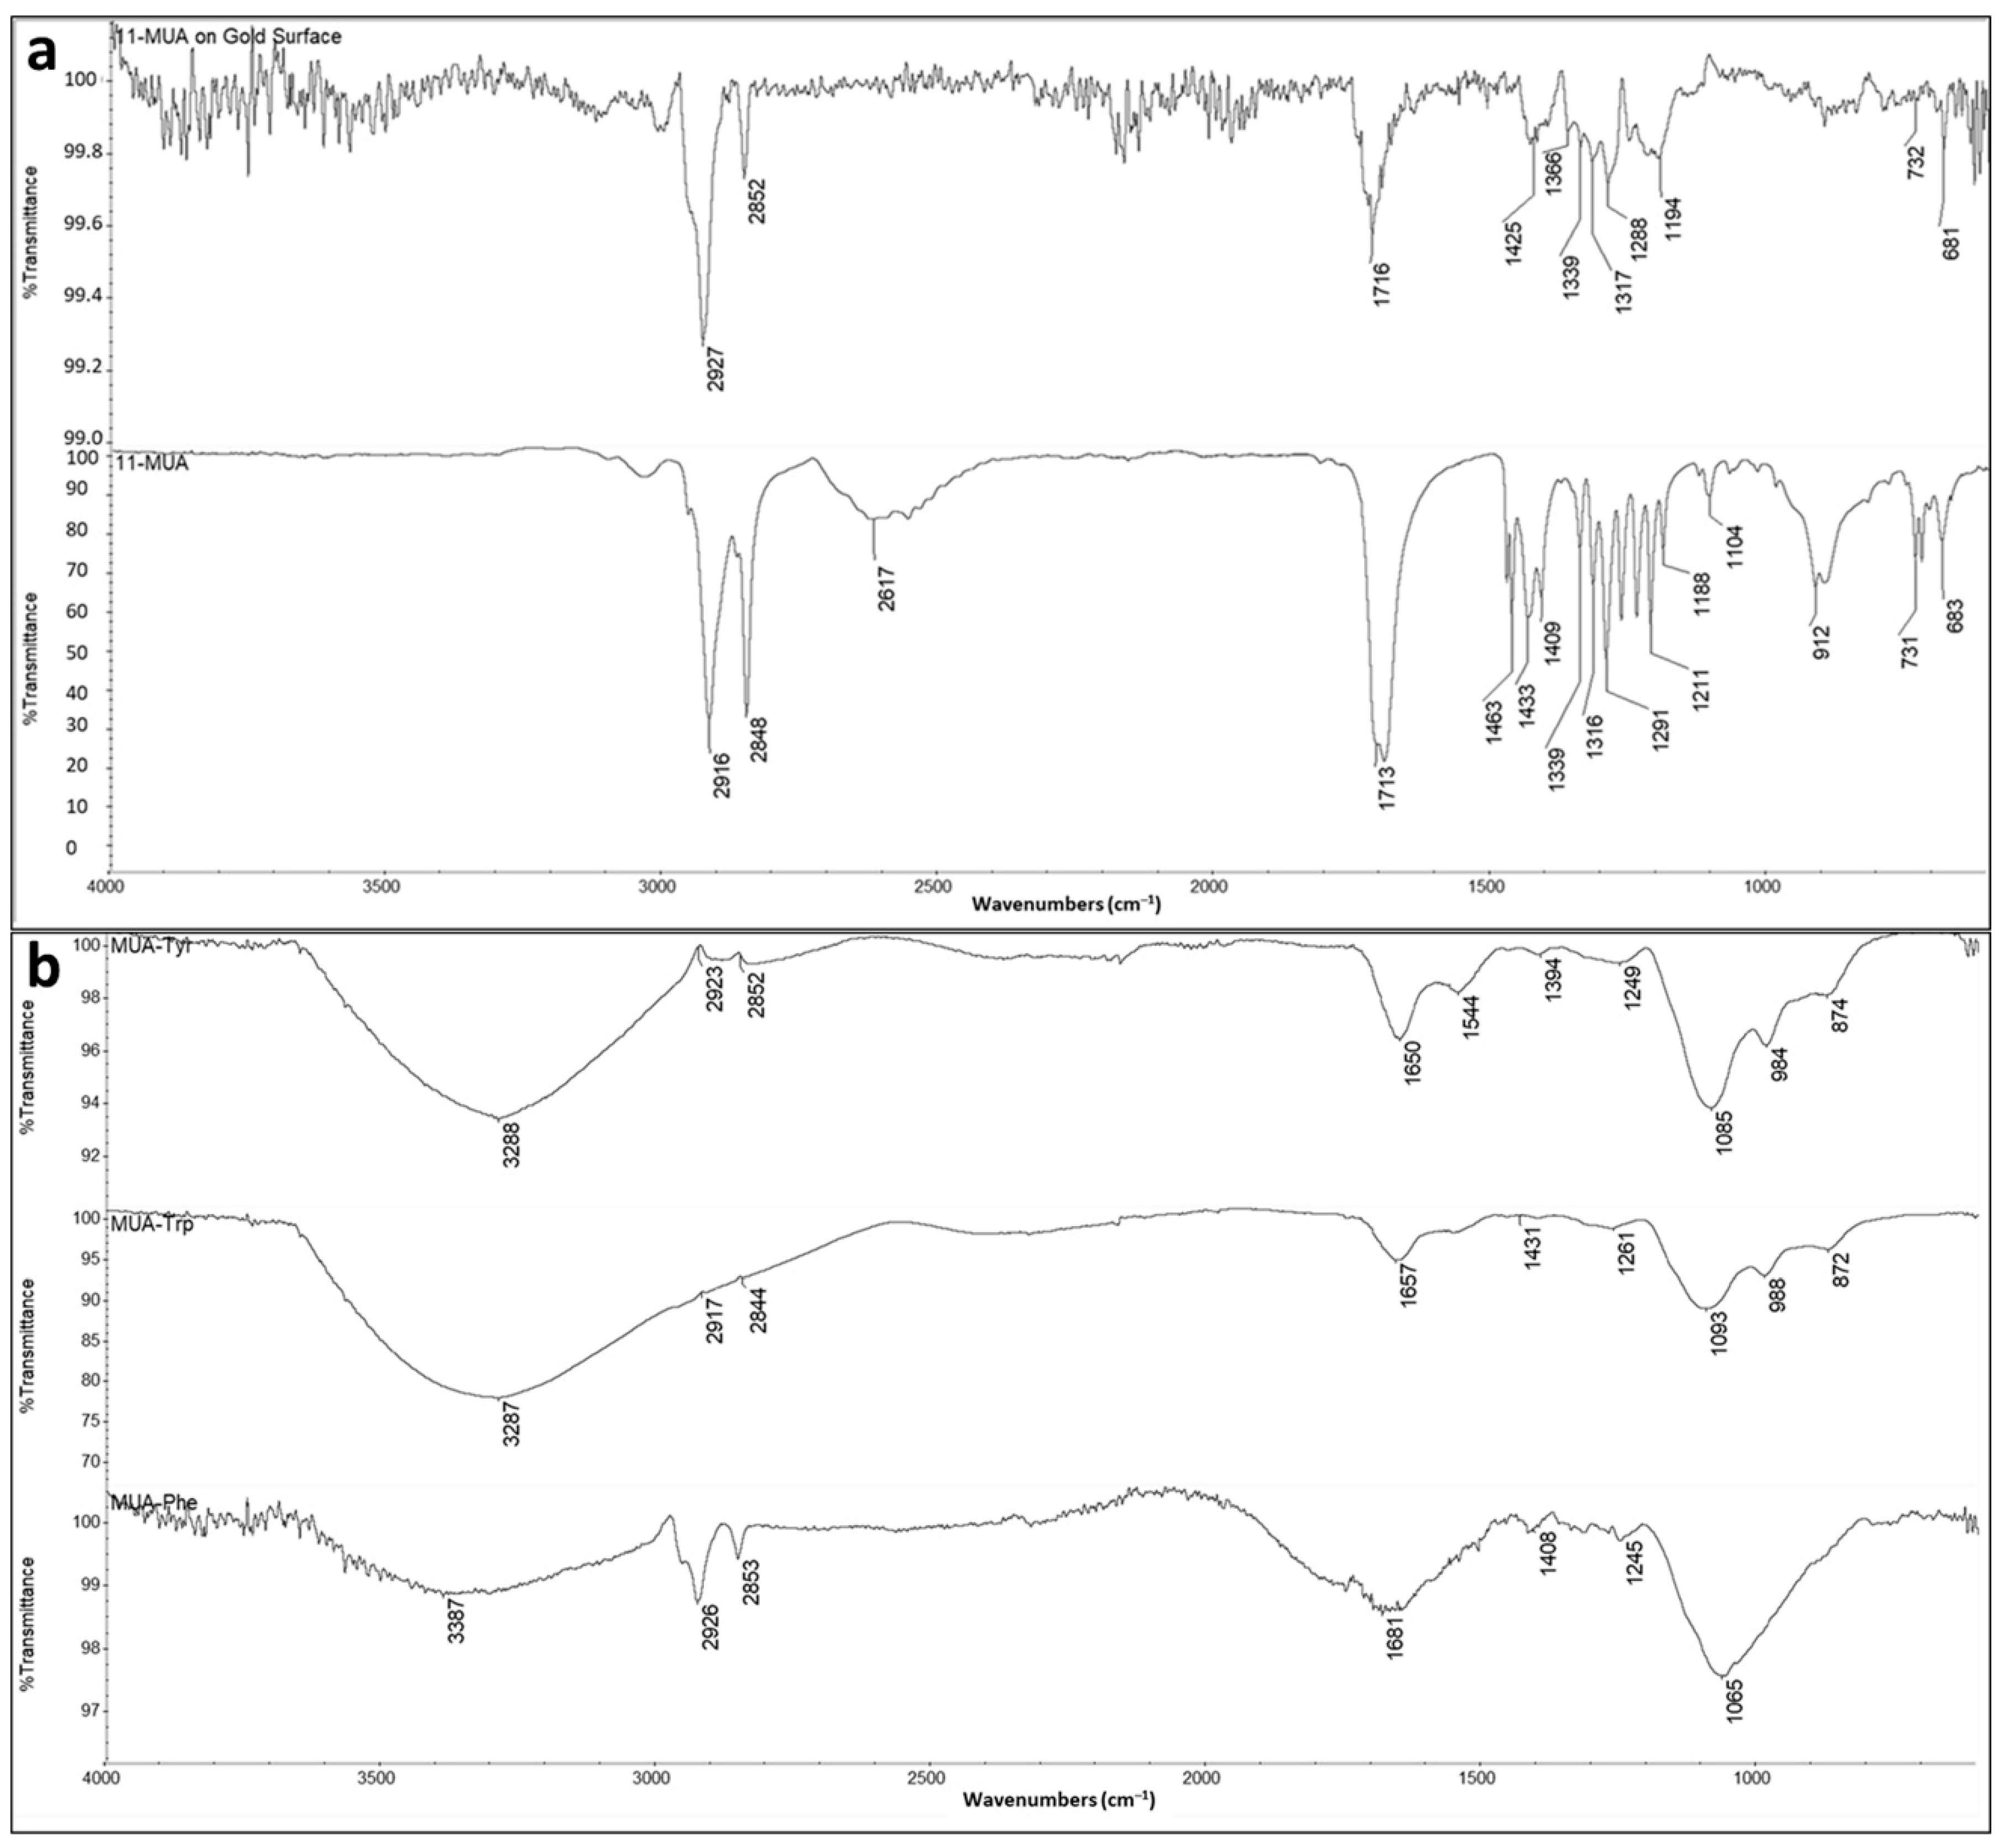
Quartz crystals that were used for the Equ detection were characterized by FTIR and the constant drop contact angle (CA) to determine the surface chemistry and the surface hydrophobicity, respectively. The comparative stack FTIR spectra of 11-MUA and 11-MUA-modified gold coated quartz crystal are given in
Figure 4a. Accordingly, the distinctive thiol group (-SH) as a weak broad band around 2617 cm
−1 of 11-MUA disappeared due to the covalent attachment of -SH and forming S-Au bond to gold surface in modified quartz crystal.
This confirmed that the 11-MUA molecules were attached to the gold quartz crystal surface from the thiol (-SH) groups. In addition, a sharp band at 1716 cm
−1 in the FTIR spectrum of 11-MUA-modified quartz crystal proves that there is carbonyl stretching (C=O stretch) on the sensor surface [
32]. In other words, the carboxyl (–COOH) groups that allow amino acid modification remain free on the sensor surface.
The intensity of the carbonyl band (C=O) of the 11-MUA at 1716 cm
−1 lessened when amino acids were attached to the 11-MUA-modified surface (
Figure 4b). As can be seen from the results of the molecular docking studies (
Figure 2), amino acids interacted with 11-MUA from the COOH group. This confirmed that the free carboxyl groups on the sensor surface are covered by attached amino acids. Moreover, the characteristic amide band of amino acids at around 1650 cm
−1 and hydroxyl (OH) groups at around 3550–3200 cm
−1 appeared after the attachment of amino acids to 11-MUA-modified sensor surface [
33].
The contact angle values of unmodified and 11-MUA, Tyr-MUA, Trp-MUA and Phe-MUA-modified QCM surfaces are given in
Table 2 as 59.87°, 55.28°, 74.89°, 76.27° and 80.67°, respectively. In the literature, the Differential Scanning Calorimetry (DSC) data showed that Trp has the most hydrophobic amino acid residue and that Phe was the second most hydrophobic on the basis of heat of transition. For Tyr, significant differences were observed between the phenolic and the phenoxide anionic states. At pH 7, where Tyr is protonated, it was less hydrophobic than both Trp and Phe [
34].
In the case of CA measurements, the data were in conformity with the hydrophobicity index values of Tyr, Trp and Phe at pH 7. The hydrophobicity index values for Tyr, Trp and Phe were 63, 97 and 100, respectively [
35]. Findings by Narayan et al. (2019) showed that the decrease in the contact angles of carboxylic acid-terminated monolayers compared to the bare gold surface was based on the presence of -COOH groups on the surface. The researchers also showed that this gold surface was covered with dense arrays of thiol tail groups with monolayer arrangement [
36].
The sensor surfaces, whose hydrophilicity increased with the 11-MUA modification, gained hydrophobic properties after interacting with amino acids. Therefore, the modified QCM sensor surfaces became more hydrophobic than the 11-MUA-modified surfaces. The contact angle values of Tyr-MUA and Trp-MUA were close due to the orientation of Tyr to 11-MUA through the phenyl hydroxide (OH) group, which may alter its hydrophobicity, as seen in the simulation in
Figure 2a. Briefly, the increasing CA values of 11-MUA, Tyr, Trp and Phe in order support the hydrophobicity of the surface.
3.3.2. Detection of Equ on QCM Nanosensor
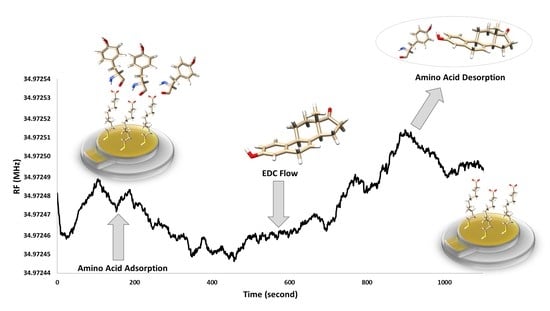
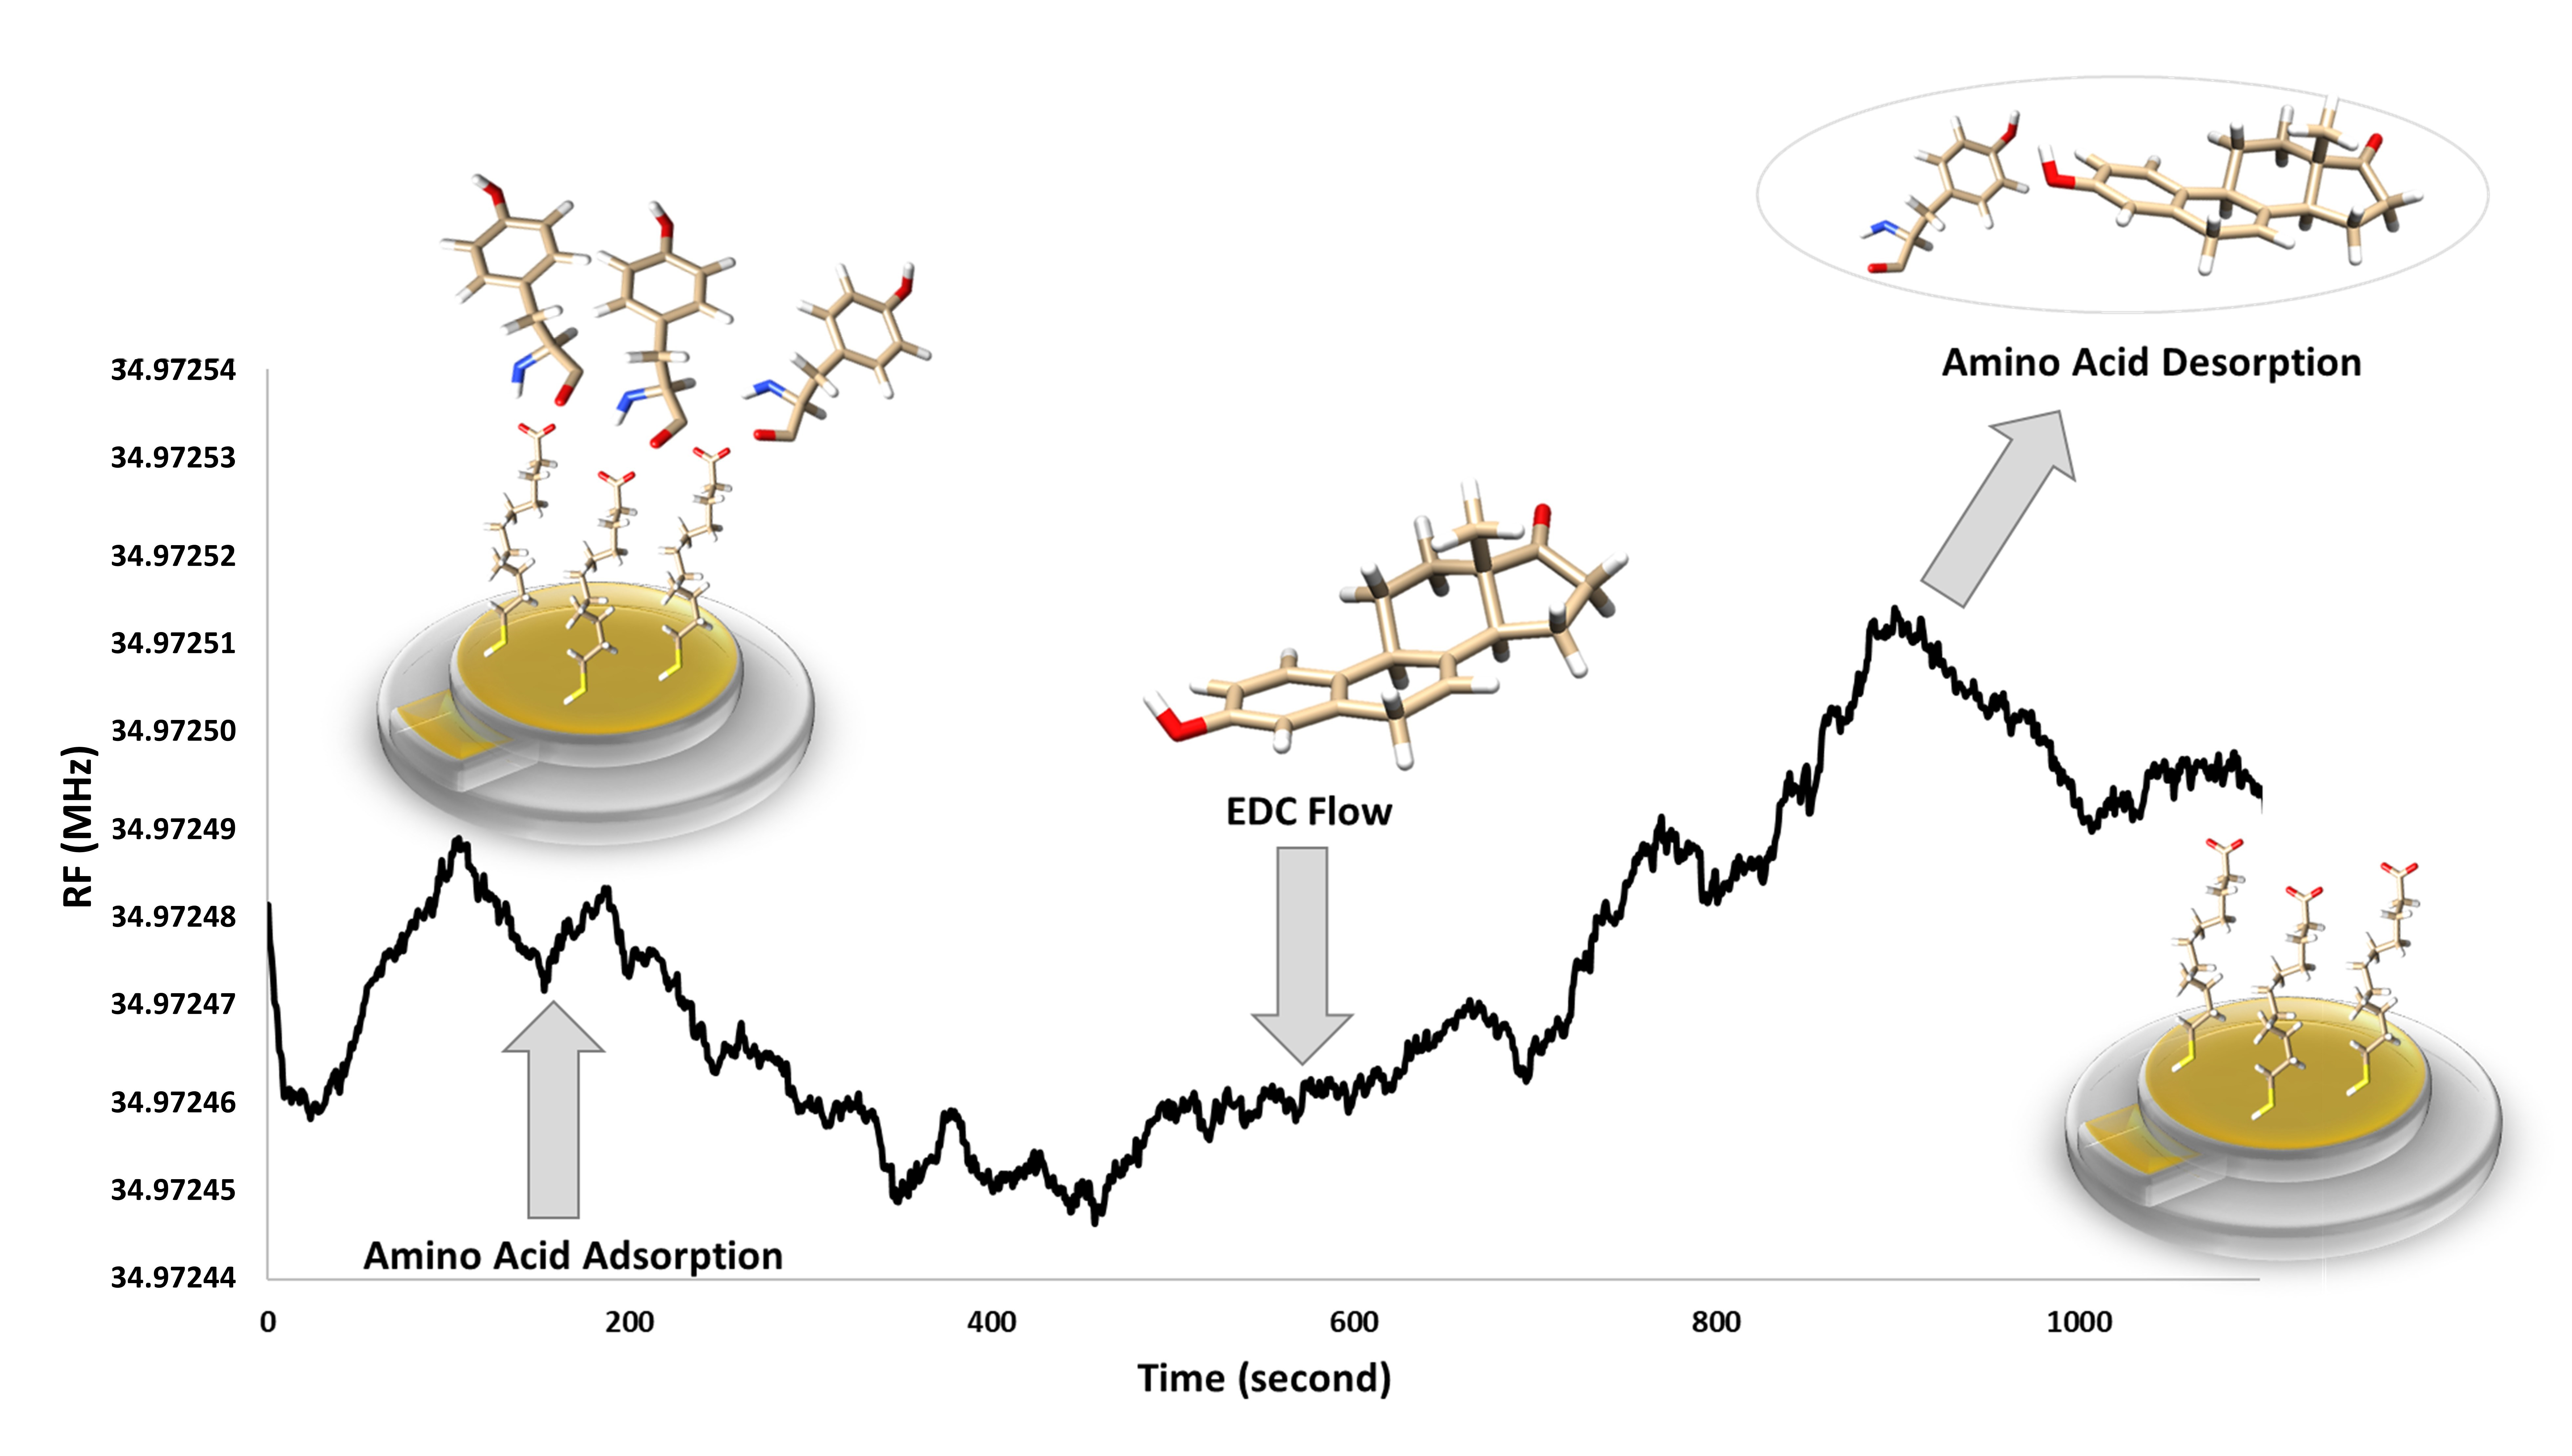
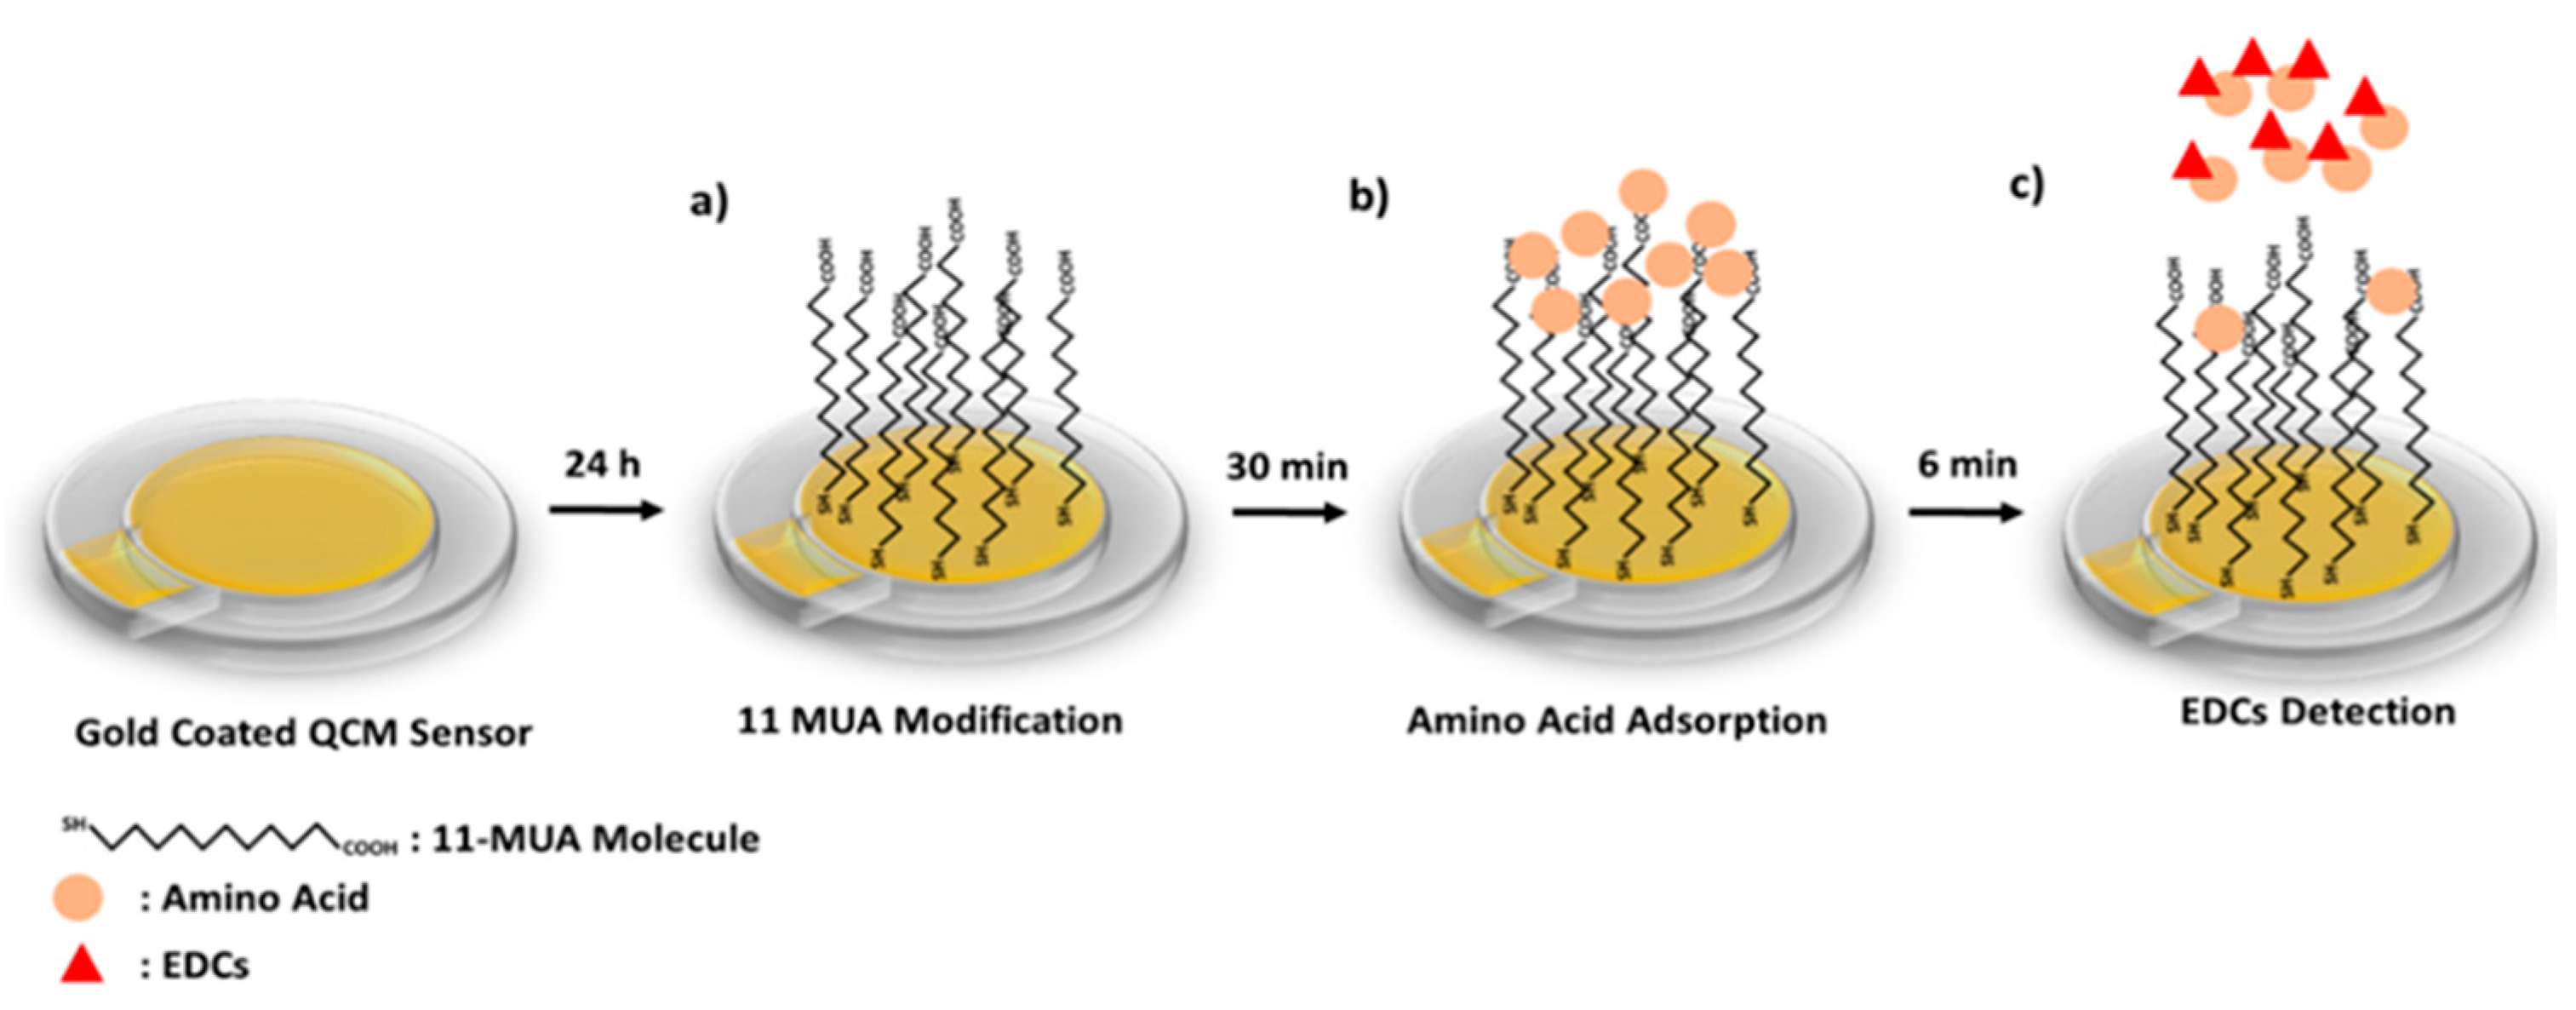
The preparation of the QCM nanosensor to detect of Equ is schematized in
Scheme 1. First, the gold coated QCM sensor surface was modified with 11-MUA molecules by forming a SAM. While the 11-MUA molecules bind to the gold QCM sensor surface from the thiol (-SH) groups, the carboxyl (–COOH) groups that allow amino acids modification remain free on the sensor surface (
Scheme 1a). Secondly, amino acids are attached to the SAM 11-MUA molecules by secondary interactions. With the attachment of amino acids, the mass on the sensor surface increases, causing a decrease in the resonance frequency in the QCM sensogram (
Scheme 1b).
Lastly, by the Equ flow from the amino-acid-attached QCM nanosensor surface, amino acids that interacted more strongly with Equ and were removed from the sensor surface. This causes an increase in the resonance frequency in the QCM sensogram (
Scheme 1c). The binding preferences of Equ to three different amino acids were monitored in real-time QCM measurements. In going beyond the traditional uses of QCM, we detected Equ based on the mass removed from the nanosensor surface, rather than the mass increased. All secondary interactions were confirmed by molecular modeling studies and used to prior experimental QCM results.
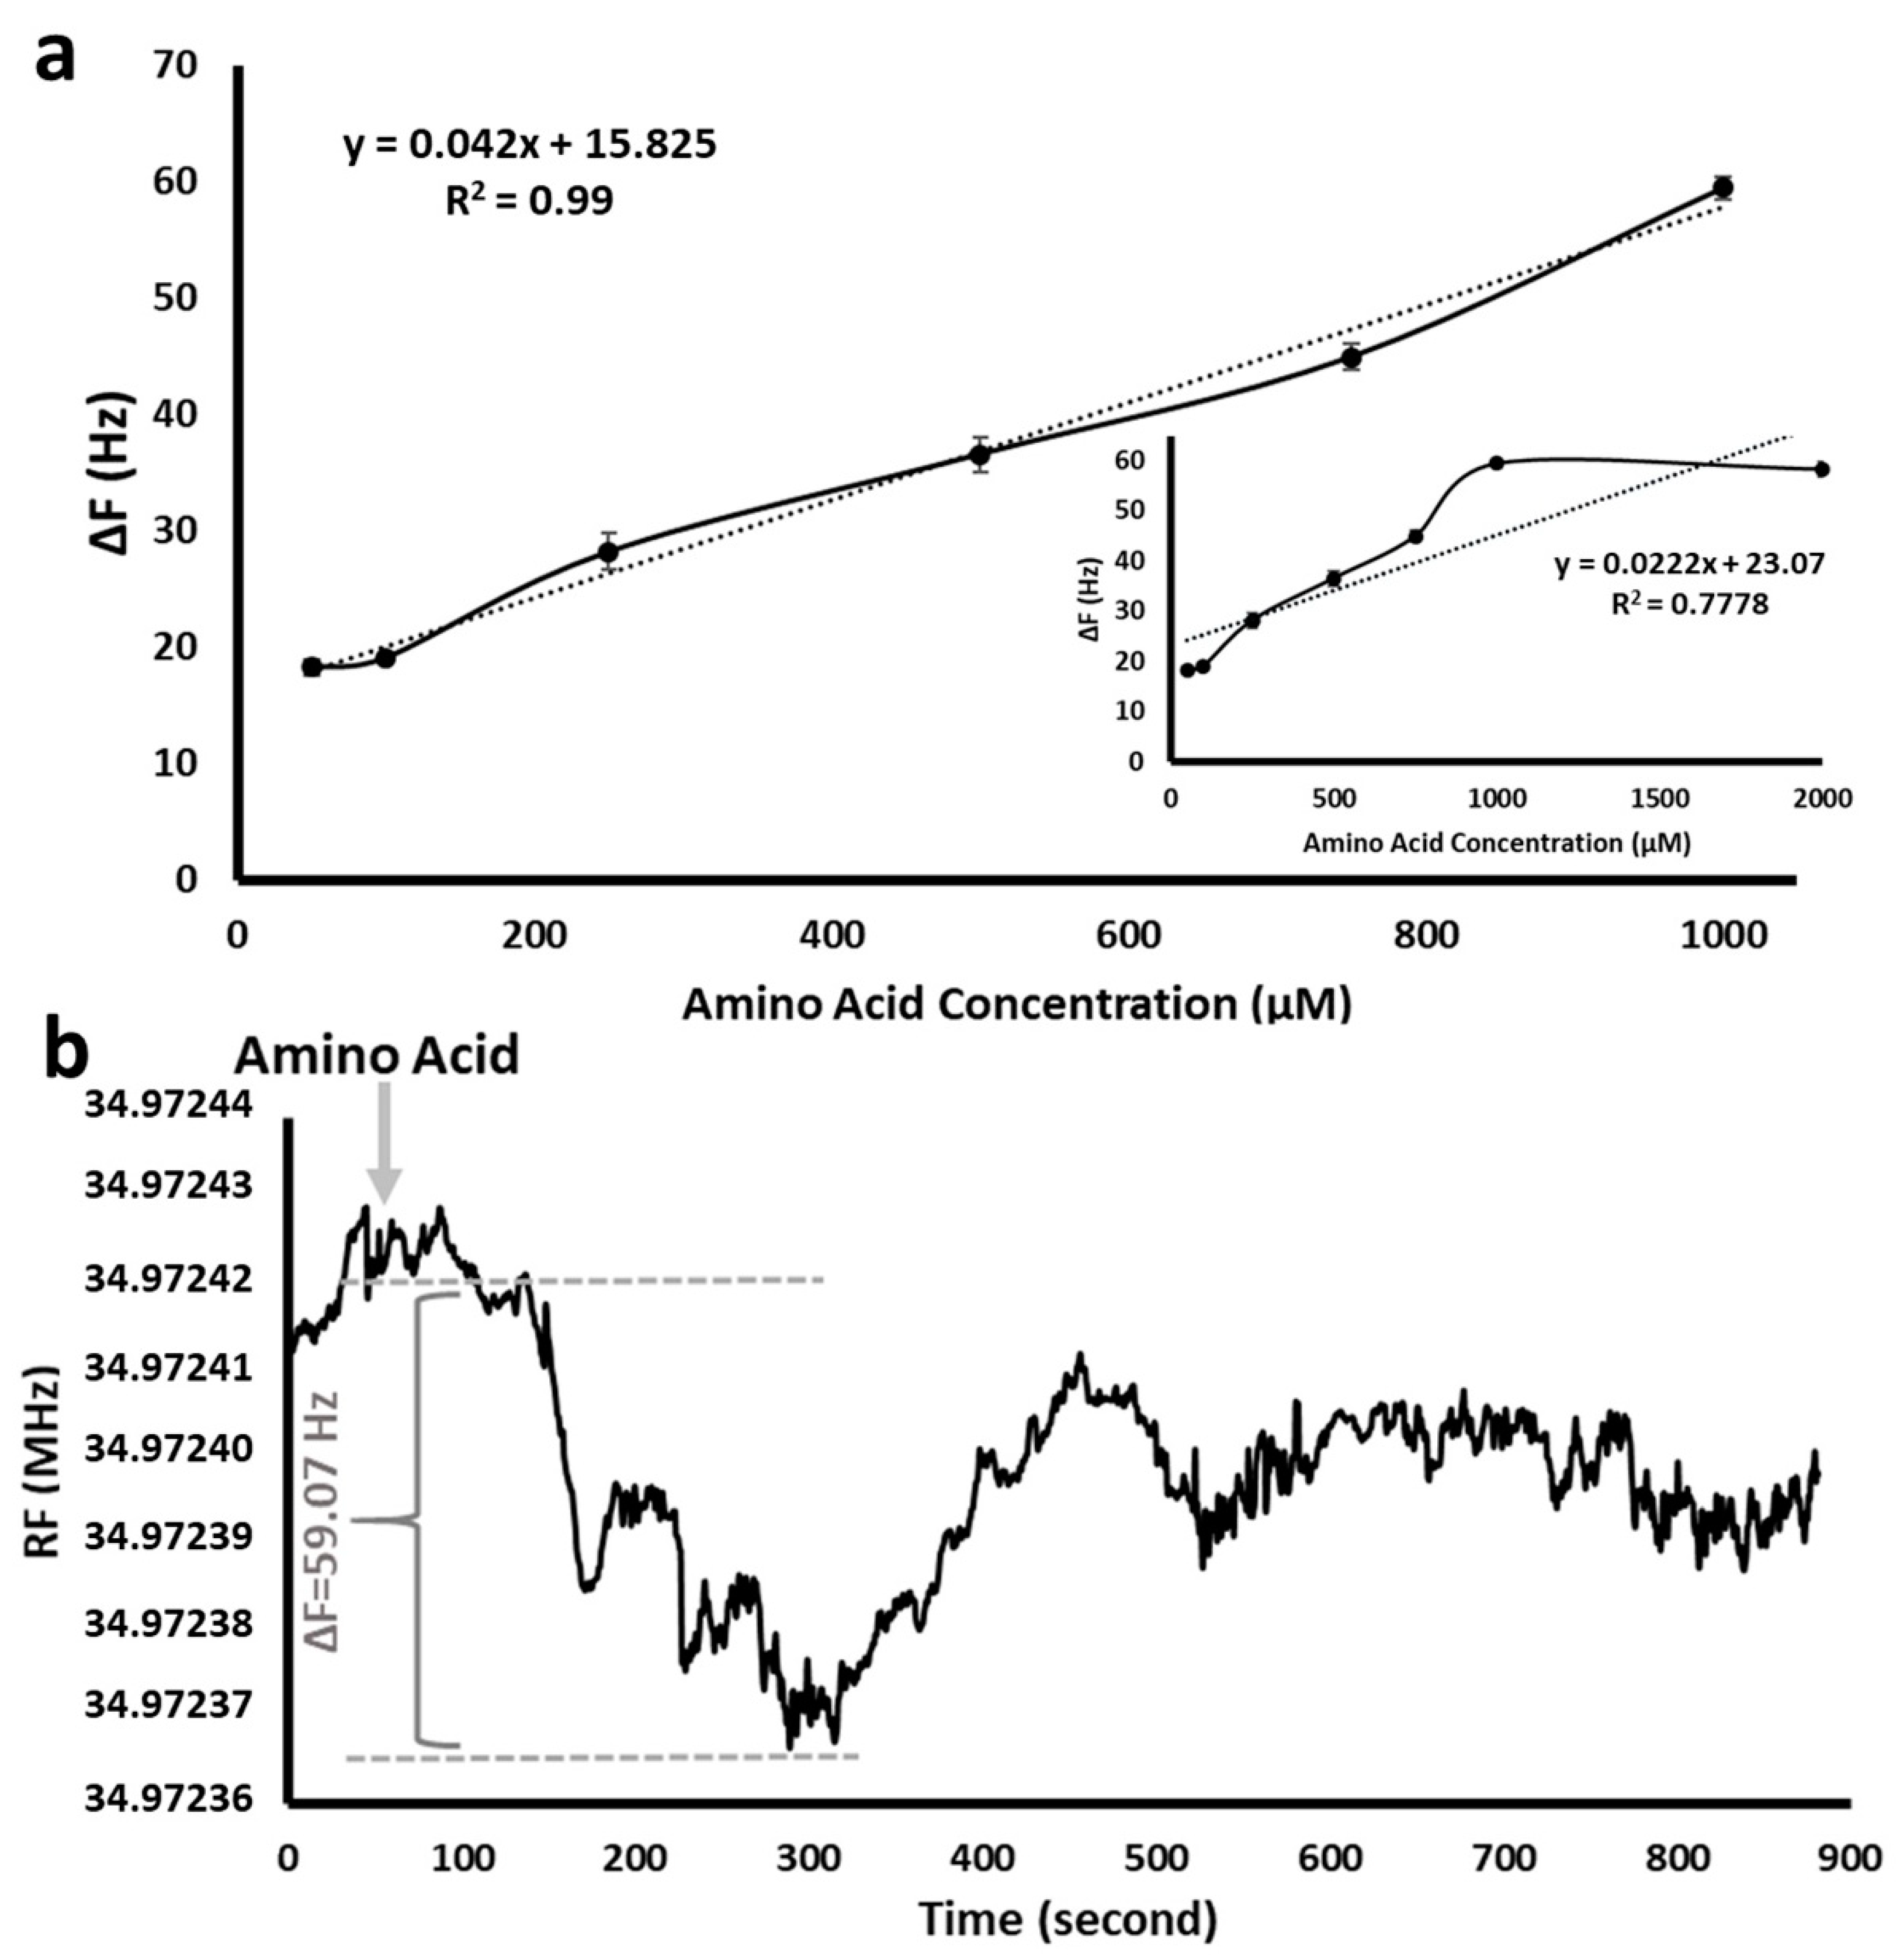
The effect of the amino acid initial concentration was detected by different amino acid concentrations in the range of 50 µM–2000 µM using SAM 11-MUA-modified QCM nanosensor. As seen in
Figure 5a, the resonance frequency increased linearly as the concentration of the analyte increased up to 1000 µM. After that amount, it reached a plateau. Therefore, the amino acid concentration was maintained at 1000 µM in all QCM experiments.
Figure 5b shows the real-time measurement of the resonance frequency change as 59.07 Hz (ΔF) with a 1000 µM of initial amino acid solution in the QCM nanosensor. The frequency changes between the moment the amino acid entered the nanosensor (about 50th second) and the moment when it left (about 315th second) are seen in the part marked with the arrow in
Figure 5b. While the amino acid solution passed through the 11-MUA-modified nanosensor surface, amino acid molecules interacting with SAM caused a mass increase on the sensor surface. The amount of mass increase on the surface caused a decrease in the oscillation of the QCM sensor and thus the resonance frequency. It should be noted that there was no significant difference in amino acid type. Therefore, Phe was used as the model amino acid in all QCM experiments.
In the continuous flow system, the amino acid molecules adsorbed as soon as they reached the nanosensor surface. As the mass began to accumulate on the crystal surface, the frequency decreased. The reason for the sudden decrease in frequency was that the surface was modified with -COOH groups of 11-MUA molecules that allow amino acids to be adsorbed. Some of the amino acids that were piled on each other without being adsorbed on the crystal surface were swept away by the effect of the flow, and this caused a slight increase in frequency of the sensogram. The overall decrease in frequency shift confirms to amino acid binding.
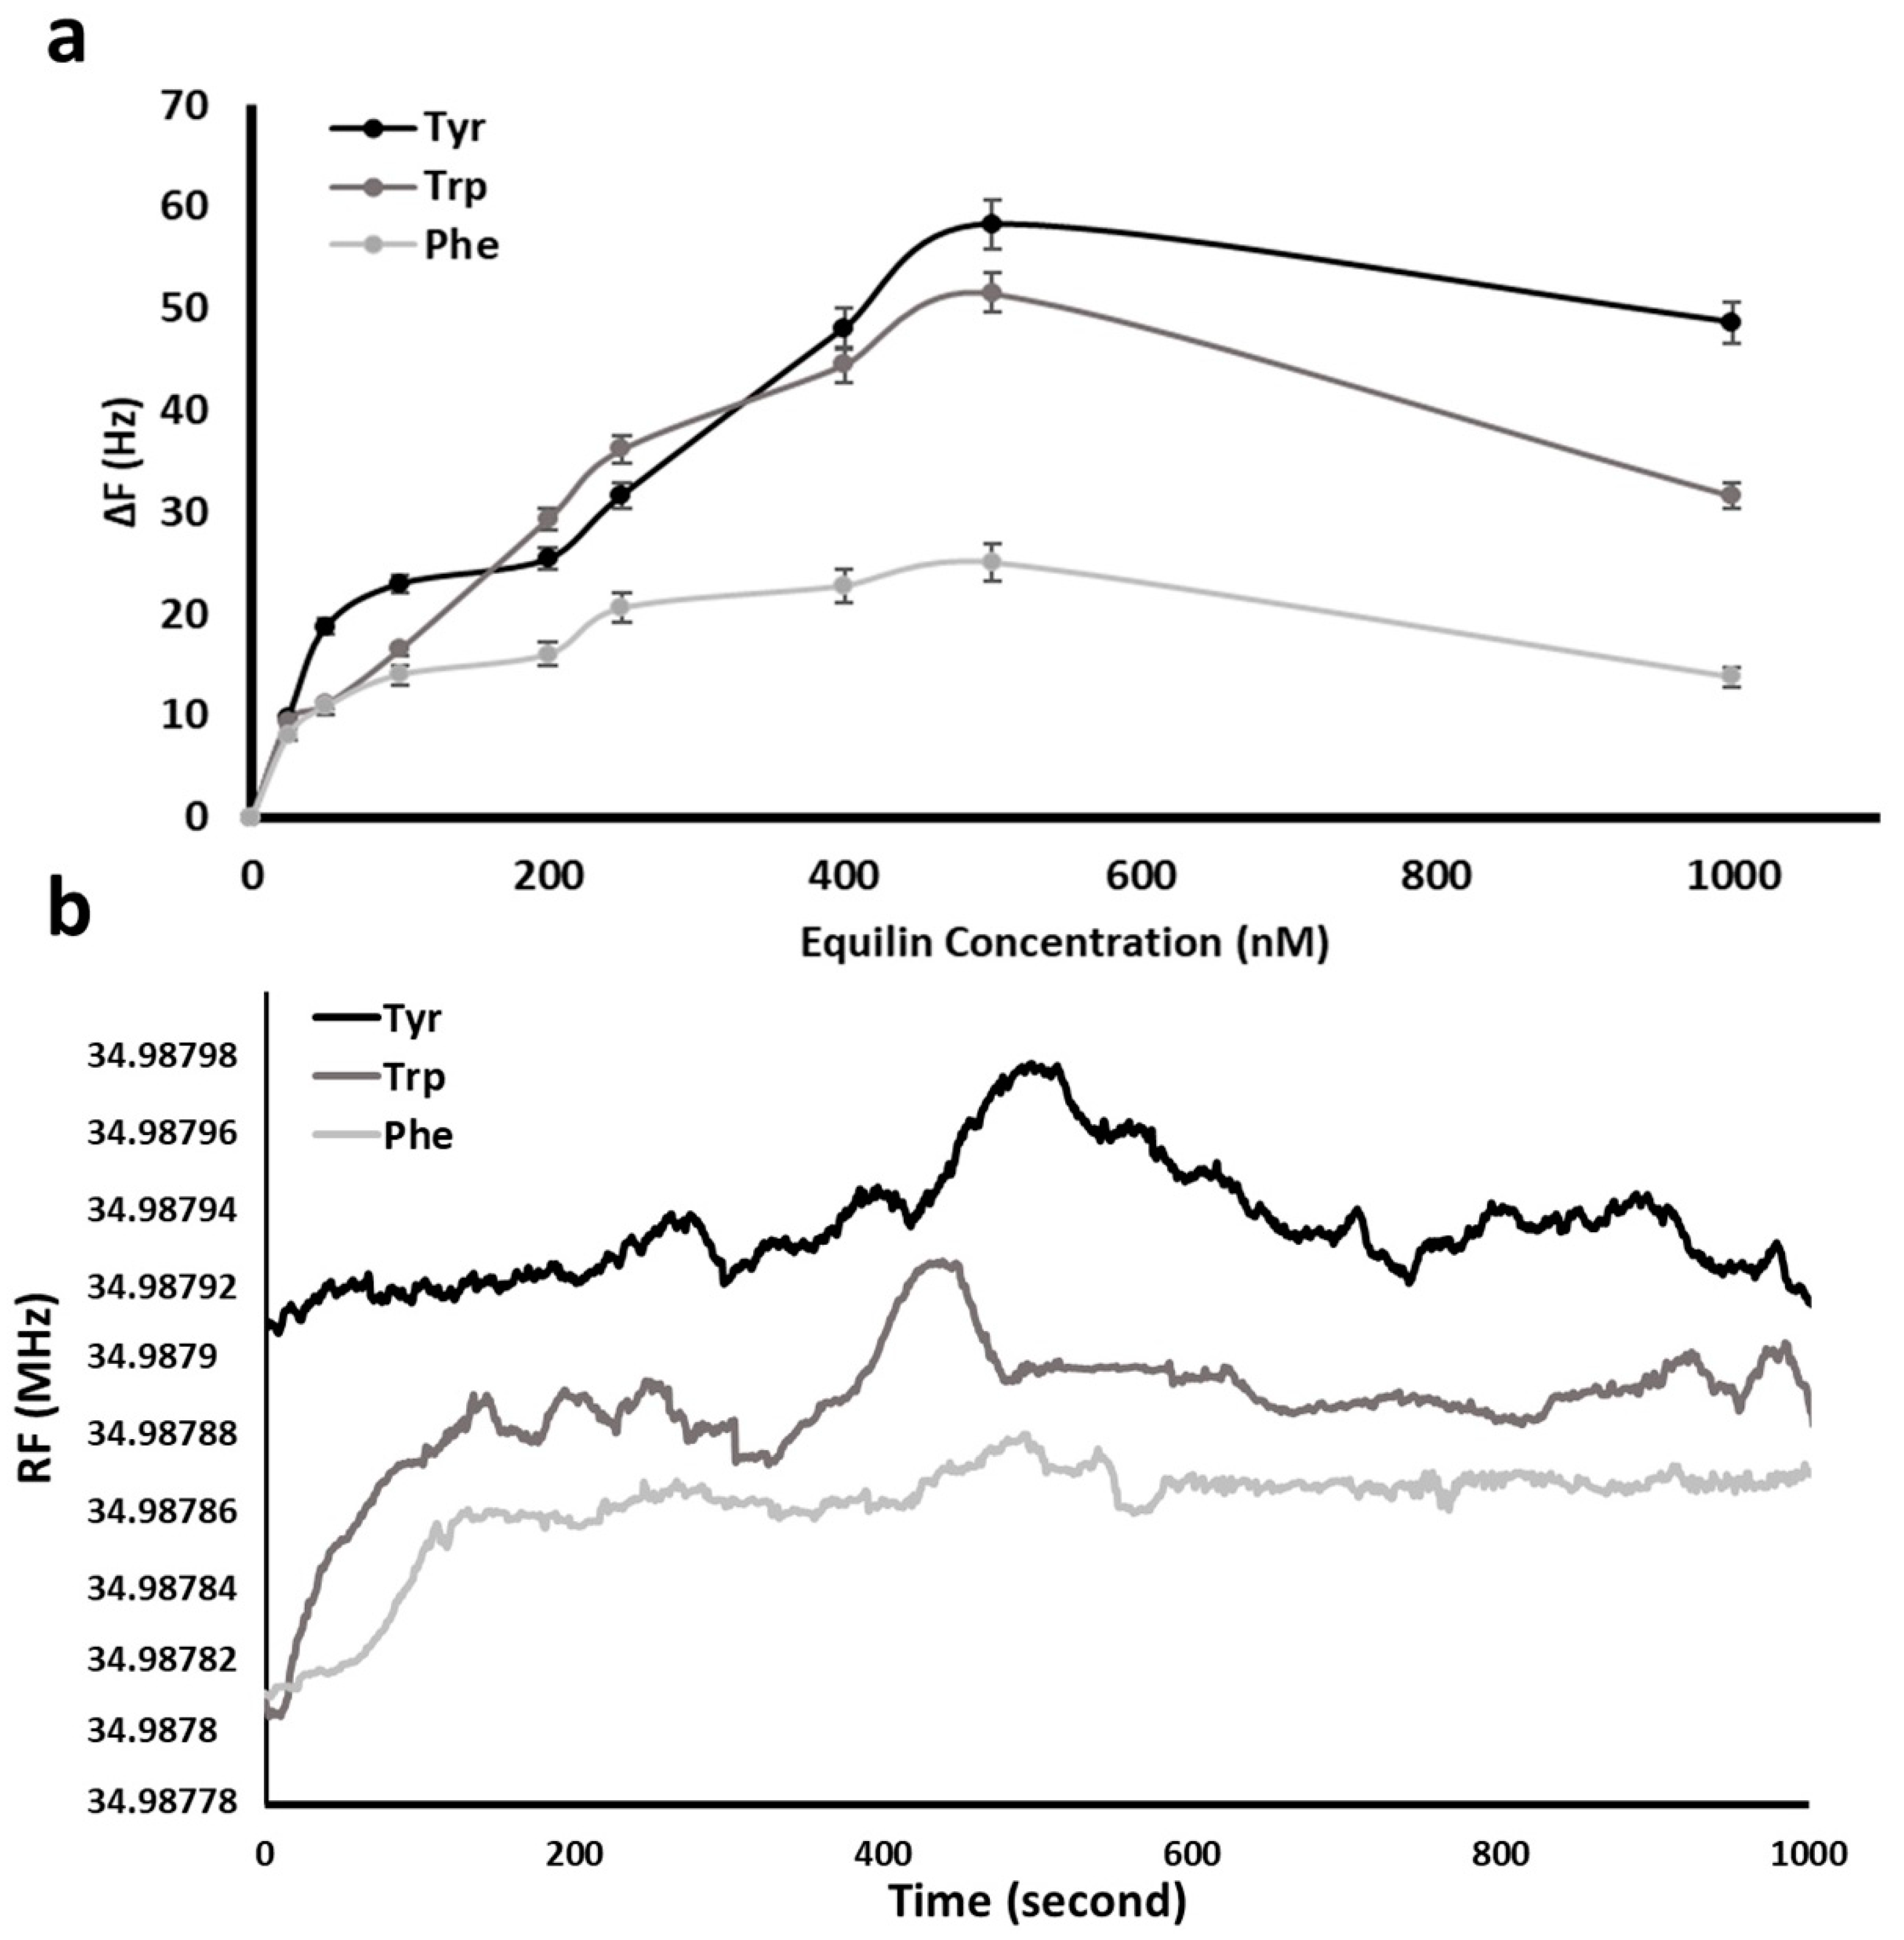
Separately amino acid (Tyr, Trp and Phe) modified QCM nanosensor were used for the real time detection of Equ from aqueous media.
Figure 6a exhibits the increase in resonance frequency shift (ΔF) of QCM nanosensor in response to diverse concentration of Equ solutions in the range of 25–1000 nM. All experiments were repeated in triplicate, and the averages were plotted. The response of QCM nanosensor increased against increasing Equ concentration and reached a plateau at 500 nM of the Equ initial concentration. During the removal of amino acids from the nanosensor surface by Equ flow, the change in resonance frequency was linear up to 500 nM Equ.
The frequency changes and their standard deviations (SD) induced by 500 nM Equ solution on different amino acid coated surfaces are 58.31 (±SD: 2.34), 51.57 (±SD: 1.95) and 25.09 (±SD: 1.75) Hz for Tyr, Trp and Phe, respectively. After this concentration, the increase slowed down and then a slight decrease was observed. The decrease of shift in resonance frequency was due to the decrease in the amino acid molecules to be removed from the sensor surface over time.
In addition, after the amino acid molecules are swept from the sensor surface, there is a weak interaction between the exposed 11-MUA molecules and Equ, which causes an increase in mass and therefore a decrease in frequency in the nanosensor. The maximum frequency change of amino acid was observed as 58.31 Hz (ΔF) at the 300–420th seconds of the flow for Tyr due to the higher binding affinity between Equ and Tyr amino acid. The maximum frequency changes at all concentrations were observed within an average of 300–420th seconds and were plotted as in
Figure 6b.
The limit of detection (LOD) and limit of quantification (LOQ) were calculated with the standard deviation (s) and slope (b) values obtained from the Equ calibration curve. The equation was used for the detection limit calculation and for the determination of quantification limit. The standard deviation values calculated as 7.61 × 10⁻⁴, 1.2 × 10⁻³ and 3.6 × 10⁻⁴ for Tyr, Trp and Phe attached QCM nanosensor surfaces, respectively. The b values were calculated as 2 × 10⁻⁴, 3 × 10⁻⁴ and 7 × 10⁻⁵ from the slope of the Equ calibration curve on Tyr, Trp and Phe attached nanosensors, respectively.
By using Tyr-, Trp- and Phe-modified QCM nanosensor signal, the LOD and LOQ values were found to be 4.59, 5.05 and 6.30 as well as 15.31, 16.84 and 21.01 ng/L, respectively, with a linear dynamic detection in the range of 25–500 nM. The linear dynamic range value represents the concentration range in which there is a proportionality between the analyte concentration and the ΔF in the QCM sensogram. This indicates the amount of ΔF that the sensor sensing system can measure during a measurement. The theoretical molecular docking results are in conformity with the higher affinity between Equ and Tyr as compared to other amino acids.
The response time of Equ detection is shown in
Figure 6b. When the stable baseline was obtained by equilibrium solution water, Equ solution (500 nM) was injected to the QCM system. As seen in
Figure 3, the interaction between Tyr and Equ molecule is based on hydrophobic interactions, while in Trp and Phe it is based on hydrogen bonds and rare hydrophobic interactions. Since Trp and Phe were oriented from amino and carboxyl groups, respectively, they interact with Equ by weak hydrogen bonds. In addition, the orientation of Phe functional sides against Equ caused weaker adhesion compared to Trp.
Therefore, a lower frequency shift with Equ flow was observed in the Phe sensogram compared to Tyr and Trp in
Figure 6b. For Tyr, Trp and Phe sensograms, Equ solution entered the nanosensor system at 110, 120 and 130th seconds, respectively. Therefore, while determining frequency change in the sensograms, the frequency difference between Equ’s entry to the nanosensor system and the moments when they reach the maximum were evaluated. The sudden increase in frequency seen up to the 100th second of the sensogram is based on the baseline shift due to the wetting of the dry nanosensor surface with water. The increase in resonance frequency was observed immediately after an average of 300–420 s depending on the removal of amino acid by the Equ molecule. The process continued for 15–20 min in order to observe the change in the resonance frequency over time.
3.3.3. Binding Analysis of Equ to Amino Acids
In this study, unlike the traditional QCM sensor systems, the desorption mechanism of Equ was investigated. The sensing process was performed depending on the amount of mass removed from the surface instead of the mass change caused by the molecules attached to the quartz crystal surface. Therefore, interactions between Equ and three different amino acids were examined separately. Mass reduction was observed with the removal of amino acids by Equ molecules.
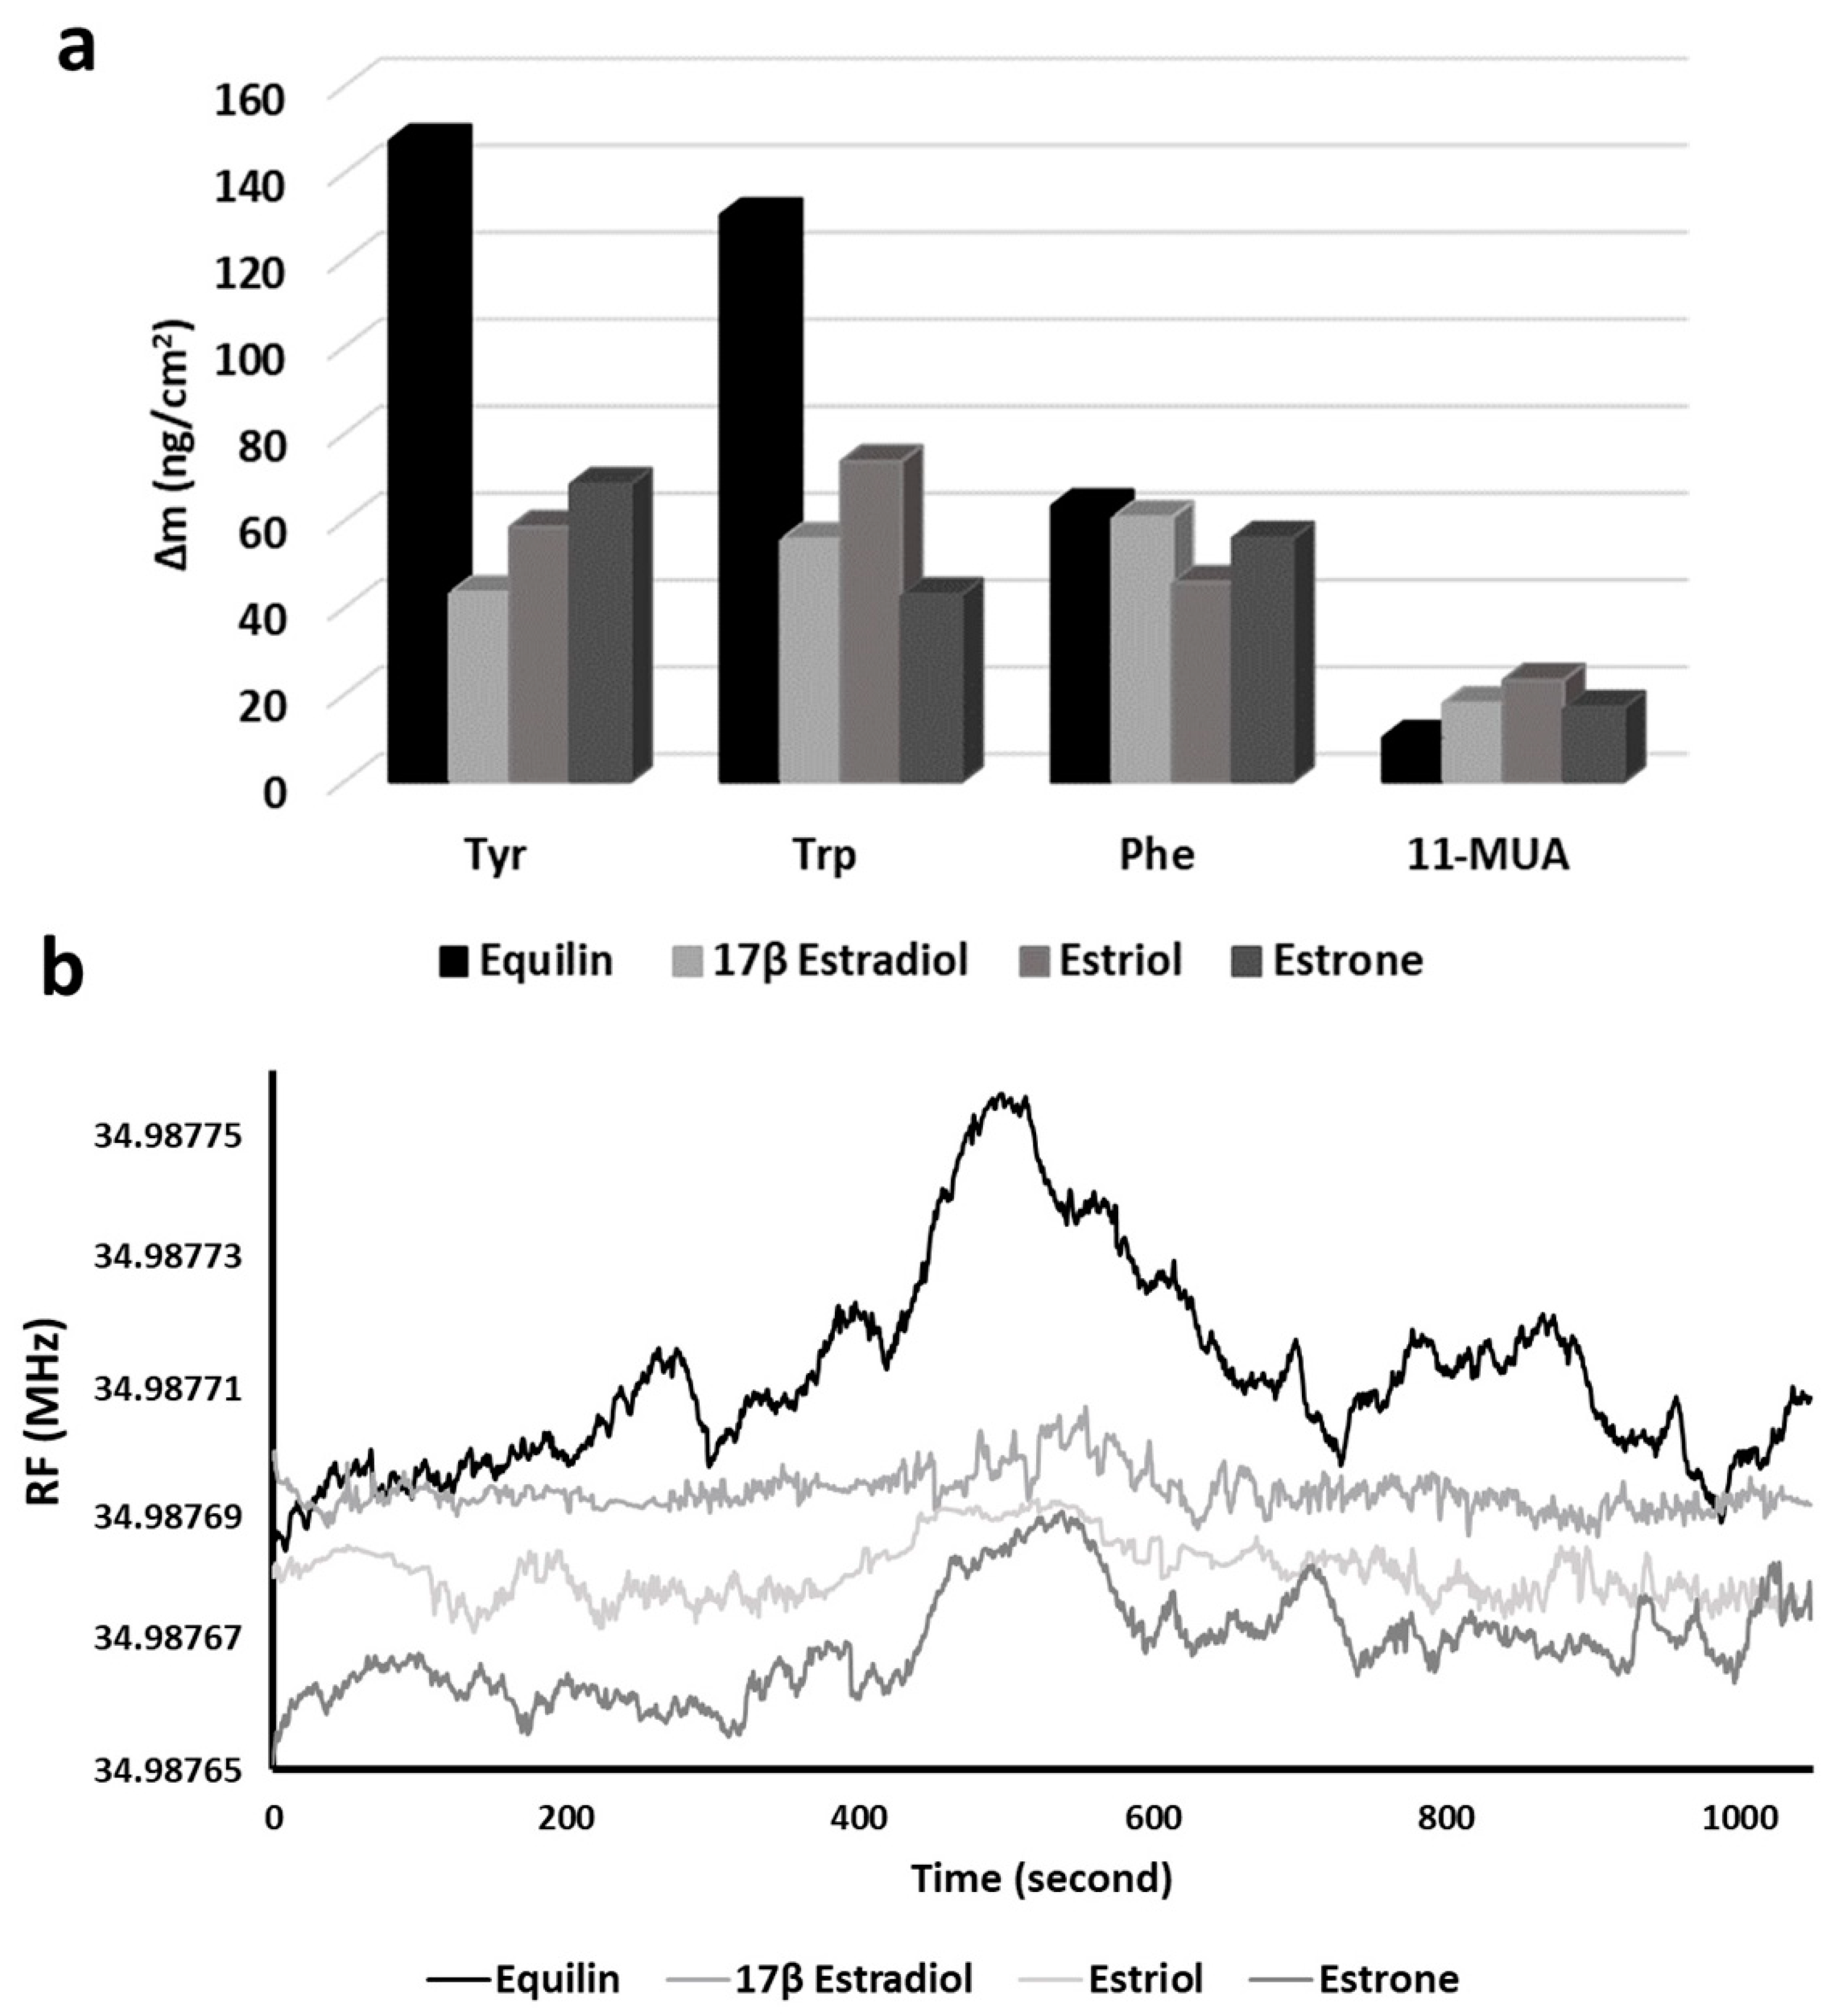
The experimental Tyr, Trp and Phe amounts removed from the nanosensor surface by Equ molecules were obtained as 147.44, 130.39 and 63.44 ng/cm
2, respectively. Equ interactions with three different amino acids (Tyr, Trp and Phe) were found to fit well to the Langmuir–Freundlich isotherm model, in which the calculated amount of Equ-Tyr, Equ-Trp and Equ-Phe were obtained as 434.78, 312.50 and 303.03 ng/cm
2 respectively (
Table 3). Heterogeneous surface interaction is mentioned here.
In addition, this adsorption model explains the distribution of adsorption energy on the heterogeneous nanosensor surface. While there is an interaction compatible with the Freundlich model at low adsorbate concentrations, there is an interaction compatible with the Langmuir isotherm at high concentrations. As discussed in computerized docking studies, the interaction between Equ and amino acids (Tyr, Trp and Phe) interrelated with the hydrophobic interactions between the Equ ring system and the indole, phenyl and benzene groups of Tyr, Trp and Phe, respectively.
The binding and removal preference of amino acids in accordance with Equ are examined by equilibrium (Scatchard) and association kinetic analysis (
Table 4). The amount of amino acid molecules and Equ on the sensor surface, binding and dissociation of amino acid-Equ complex were investigated by time-dependent binding analyses. According to the calculations,
KA values were 0.005, 0.01 and 0.002 nM for Equ-Tyr, Trp and Phe interactions, respectively, while
KD values were found as 204, 72 and 457.14 1/nM.
KA is the binding equilibrium constant used to characterize how fast the ligand binds to the receptor.
KD is the dissociation equilibrium constant and is expressed by the ligand concentration at which half of the ligand binding sites of the receptor non-covalent binding processes are reversible, that is, the ligand can both attach and dissociate from the receptor. The binding and dissociation processes are characterized not only by the equilibrium constants but also by how fast the binding/dissociation takes place [
37].
Our sensor system focuses on removing amino acids from the sensor surface. In other words, equilibrium binding calculations were made based on the mass reduction due to desorption at the sensor surface. The dissociation equilibrium constants of amino acid molecules captured by Equ from the sensor surface vary depending on the separation times from the sensor.
The Scatchard analysis also allows understanding the relationship between reversible Equ-amino acid binding. The mechanism of binding by Scatchard is explained by using the number of binding sites. In the Scatchard analysis, the interactions at the equilibrium of the system are evaluated regardless of the initial concentration of the analyte. If
KD is less than
KA, this indicates that there is an interaction between the ligand and analyte at more than one point [
38]. If
KA is less than
KD, it is understood that binding occurs strongly from a single point [
39].
Our values in
Table 4 also show binding preference of Equ and amino acids is a single point and considerably strong. In addition, the lowest LOD and LOQ values (4.59 and 15.31 ng/L, respectively) of Equ were obtained in Tyr-modified QCM nanosensor, while the highest values (6.30 and 21.01 ng/L, respectively) Phe modified one. In this study, LOD and LOQ values are under the maximum contaminant level (MCL) of Equ (0.35 µg/L) that was determined by the EPA. These results confirm the sensitive detection of Equ in water samples.
3.4. Comparison of QCM Nanosensor to Three Different EDCs
The maximum frequency decreasing obtained by the interaction of the Equ and the modified QCM nanosensor were determined as 500 nM of Equ concentration in 420 s of interaction time. Therefore, the interactions of three different EDCs (estrone, estriol and 17β-estradiol) were tested under same conditions. All experiments were repeated in triplicate, and their averages were plotted. In QCM detection, the mass changes produced by the other EDCs are compared with that of Equ, it was observed that Equ has the highest frequency change. When the three-dimensional chemical structures of EDCs are examined, unlike the others, it is seen that Equ has a non-hydrogenated double bond at C12 in the structure. The delocalized pi-electron has a lower electron density than the localized pi bond in the C=C double bond, making Equ more reactive compared to the other EDCs (as can be seen in
Figure 1).
Moreover, the interactions of EDCs with 11-MUA were investigated in control experiments. As seen in
Figure 7a, there is no significant frequency change in mass change of 11-MUA and EDC interactions. This finding is believed to be based on weak interactions (such as electrostatic and Van der Waals interactions) between the –COOH groups of 11-MUA arrayed on the sensor surface and –OH groups of EDCs. According to molecular docking studies of the interactions between Equ and amino acids (
Figure 3), hydrophobic interactions were observed between Tyr, Trp and Phe (phenyl ring, indole group and phenyl residue, respectively) and the Equ ring system.
Intermolecular hydrophobic interactions are stronger than noncovalent interactions, such as Van der Waals and electrostatic interactions [
40]. Experimental results as the affinity interactions between EDCs and 11-MUA were less than the affinity between EDCs and amino acids, confirming the weak interaction between EDCs and 11-MUA. In short, in the presence of noncovalent interactions between EDCs and 11-MUA, very little amount of EDCs was attached on the sensor surface and caused a small amount of mass change [
41]. The mass change in 11-MUA interactions with Equ, 17β-Estradiol, estriol and estrone were 10.11, 17.97, 23.33 and 17.04 ng/cm
2, respectively.
These results showed that the interaction between Equ and Tyr was higher than the other EDC molecules. The highest mass change (147.44 ng/cm
2) occurred in Equ detection on the Tyr-modified QCM nanosensor. When it was evaluated together with the molecular docking results, the phenyl ring of Tyr may have caused the desire to make hydrophobic bonds with Equ.
Figure 7b shows the frequency changes of Equ, 17β-estradiol, estriol and estrone molecules over time in the Tyr-modified QCM nanosensor.
At the moment the EDCs reached the sensor surface, they caused an increase in resonance frequency of the sensogram. This frequency increase is evidence of the reduction of the mass on the sensor surface by removing the Tyr molecules via EDC molecules. Within an average of 360–420 s, the EDCs swept the maximum Tyr molecules from the sensor surface and reached the highest frequency value. Then, the effect of liquid flow on the surface and interaction between the -COOH groups of the MUA on the sensor surface with EDCs caused the frequency decreases.
In literature, there exist many reports on the detection of estrogenic hormones. However, this study was conducted due to the limited number of articles in the literature for the selective and sensitive detection of Equ. Among these studies, Ito et al. detected the cortisol in antibody-antigen interaction-based QCM sensor with 0.1 to 100 pg/mL LOD [
42]. In another study, Li et al. used a zeolite filter on the QCM sensor system for the detection of Bisphenol A (BPA), E1, E2 and sulfamethoxazole (SMZ).
This system was based on sorbate-sorbent interactions (based on functional groups) and they reached 0.85–1.58 ng/ng adsorption capacity [
43]. Jia et al., developed a surface plasmon resonance (SPR) sensor system to detect E2. They used anti-estradiol monoclonal antibody (E2-mAb) coated magnetic nanoparticles and their LOD value was 0.81 ng/mL [
44]. According to these results, while some LOD values are lower than ours, some are higher. However, still the most critical point here is that previous studies are based on specific affinity. Since the diagnostic material they use (molecularly imprinted polymeric structures, aptamer, antibody, etc.) depends on the substance to be detected, system parameters need to be rearranged while investigating each molecule. However, in this study the EDCs can be directly and specifically detected according to their affinity to different amino acids in real time monitoring in one step.
3.5. Reuse of QCM Nanosensor
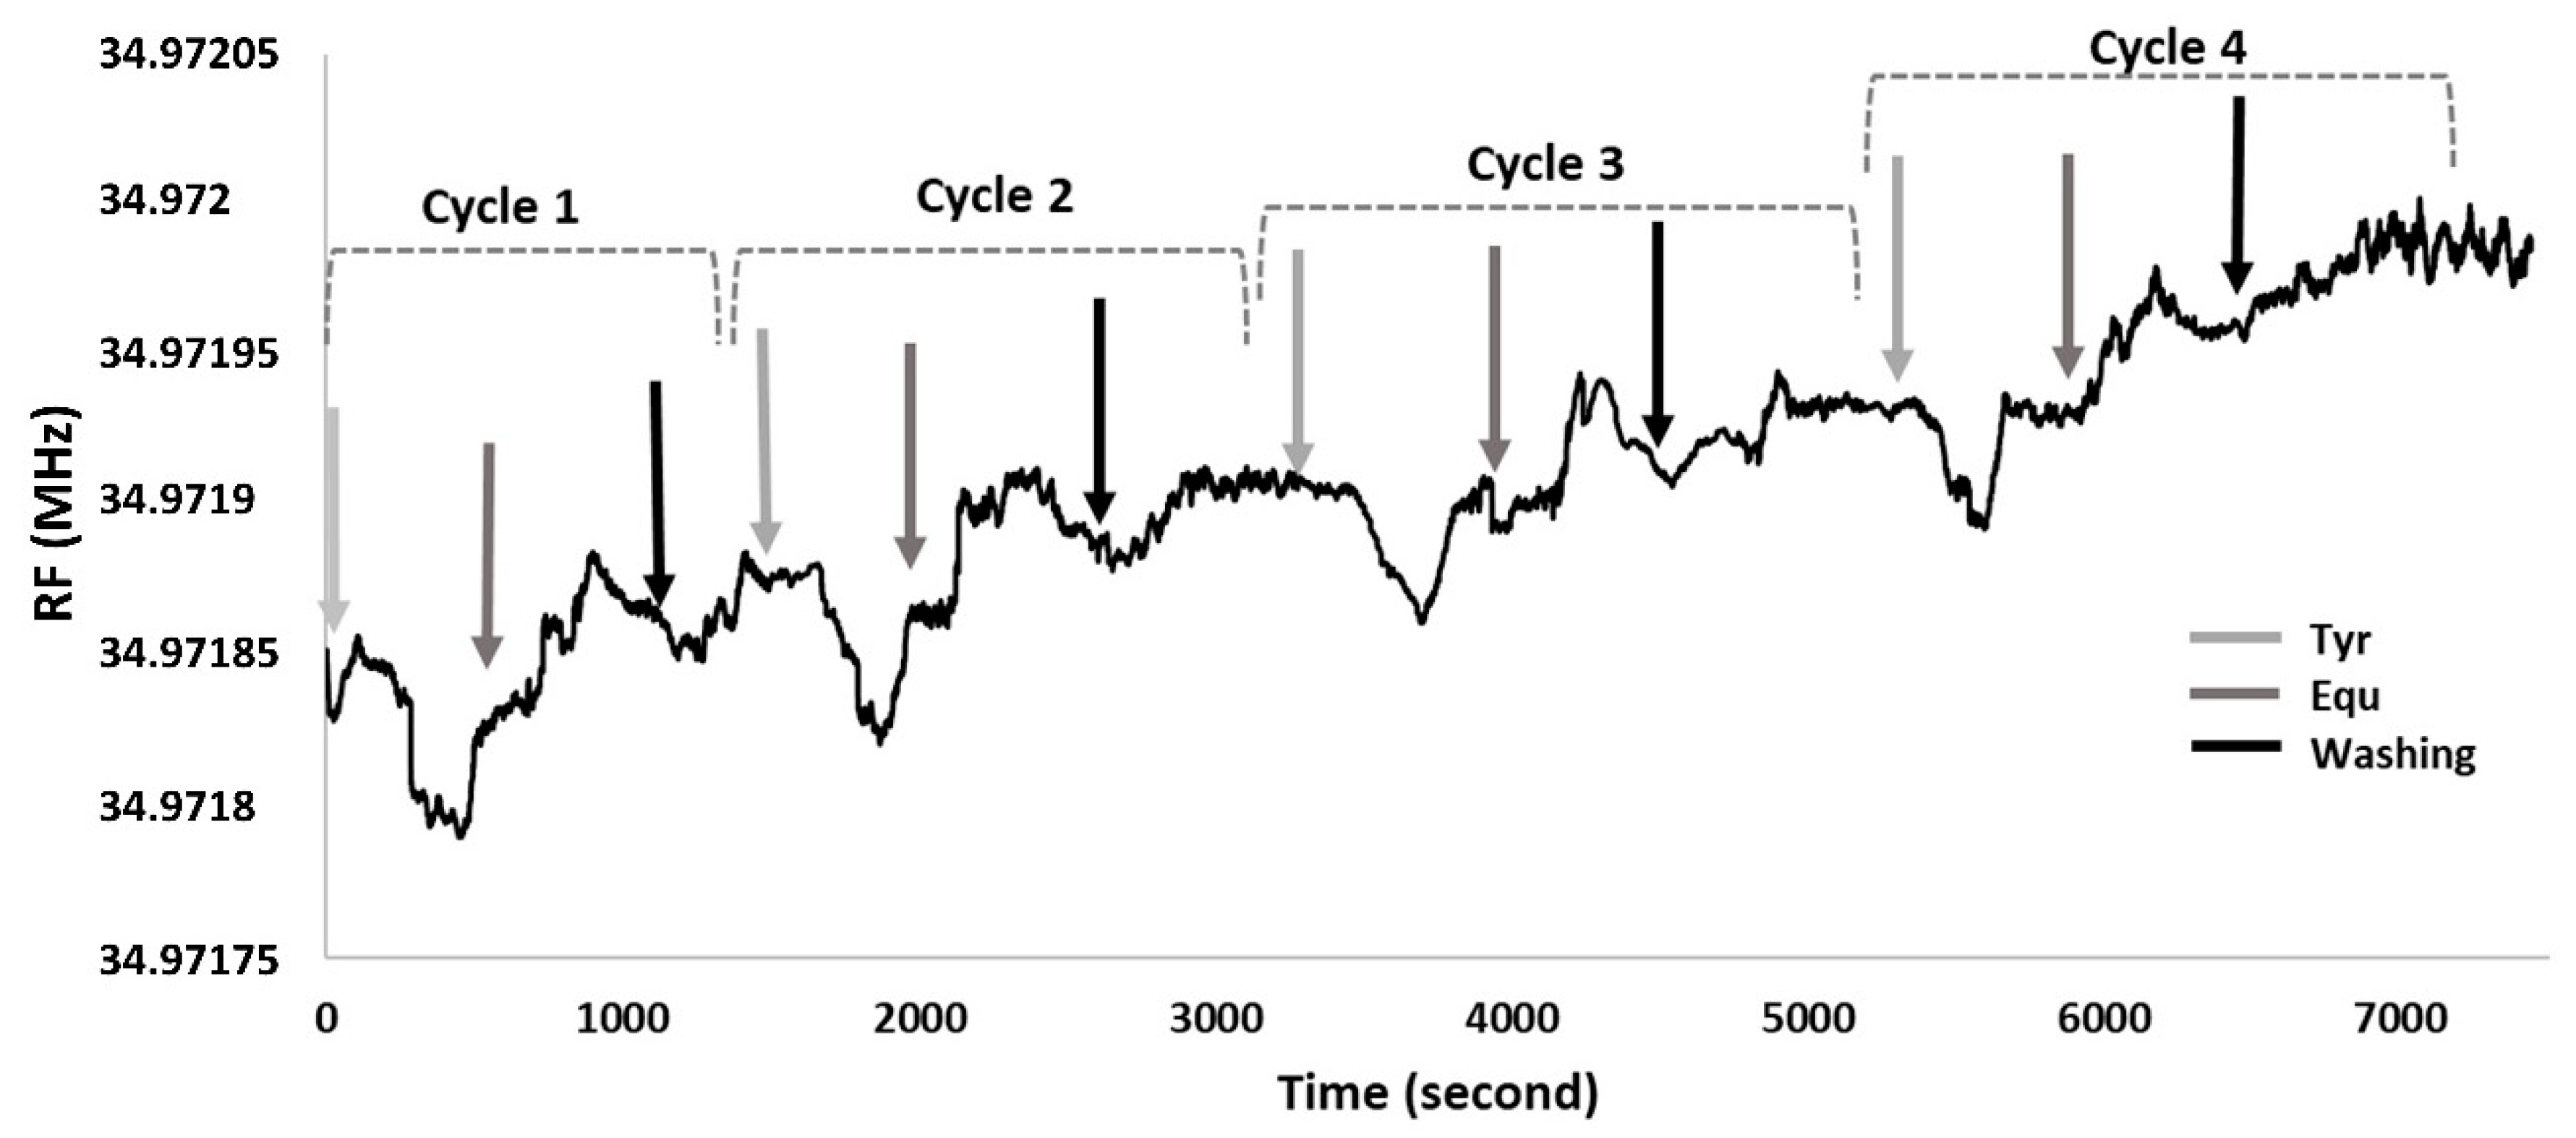
In order to test how many times, the QCM nanosensor can be used with single 11-MUA modification, their interactions with Tyr and Equ were monitored in real-time with adsorption and removal processes (
Figure 8). For the first cycle, as the Tyr was flowed through the QCM nanosensor, the resonance frequency dropped by 56.01 Hz nearly after 4 min. The nanosensor was kept stable for 3 min and was then fed with the Equ solution. After 5 min, there was an increase in resonance frequency as 49.46 Hz since Equ caught and swept Tyr.
To wash the electrode surface, phosphate buffer was passed through. In this step the resonance frequency increased by 32.75 Hz. Then, for the second, third and fourth cycle, the Tyr solution repeatedly flowed through the nanosensor surface. This caused a frequency drop of 49.25, 45.71 and 41.46 Hz in about 4 min, respectively. After the nanosensor reached equilibrium, Equ solution was sent into the system and a frequency increase of 47.27, 42.42 and 39.94 Hz were observed in 5–6 min for the second, third and fourth cycles, respectively.
Then, in the washing step, frequency increases of 29.26, 28.12 and 27.49 Hz were recorded for the second, third and fourth cycle, respectively. There was no significant resonance frequency change observed at the end of fourth cycle. After the 4th cycle, the changes in the frequency were rather dramatic. Therefore, the reusability of this sensor was found to be up to four times. In the overall cycle, the resonance frequency decreases due to Tyr attached to the nanosensor surface, as it increases due to Equ that removes Tyr from the surface. As a result, it was observed that 11-MUA-modified QCM nanosensor can be used four times with 80.75% of efficiency for Equ detection under continuous washing conditions, without removing the electrode from the system.
4. Conclusions
In this study, a new nanosensor system for the detection of Equ, which is easy to use is prepared with very low-cost materials and also gives precise results in a very short time (nearly 6 min) with a very low LOD value, which was 4.59 ng/L for Tyr-modified QCM nanosensor. In this study, in going beyond the traditional uses of QCM, we detected Equ with removing amino acids from the nanosensor surface. As a result of binding isotherm studies, interactions between Tyr-, Trp- and Phe-modified nanosensor surfaces and Equ were found to fit the Langmuir–Freundlich binding isotherm.
When the Tyr was used for the modification of QCM nanosensor, the Equ mass change was the highest in comparison to three different EDCs: 17β-estradiol, estriol and estrone. The lowest LOD (4.59 ng/L) and LOQ (15.31 ng/L) values were observed for the Tyr-modified QCM nanosensor for the detection of Equ. In addition, we compared the experimental data to simulated molecular docking studies using AutoDock tools. The free energy between Tyr and Equ was estimated as −1367.10 kcal/mol, while for the amino acids Trp and Phe, they were −1366.73 and −1367 kcal/mol, respectively.
The hydrophobic residues of Tyr (phenyl ring), Trp (indole group) and Phe (phenyl residue) were oriented with the Equ ring system, in which the hydrophobic interactions may have also contributed to the binding. These results are in good agreement with the experimental data. The Tyr-modified QCM nanosensor showed the highest sensitivity and selectivity for Equ detection. Various studies on this topic have indicated that gravimetric sensor systems for endocrine disrupting chemicals detection have high adsorption capacity [
45]; nevertheless, they have limitations, including being complicated, requiring high cost chemicals and sometimes pre-purification or enrichment procedures [
46]. To the best of our knowledge, this study represents the first QCM-based sensor system for Equ detection.


