Article

Femtosecond Direct Laser Writing of Silver Clusters in Phosphate Glasses for X-ray Spatially-Resolved Dosimetry

1
Center of Intense Lasers and Applications (CELIA), University of Bordeaux, 33400 Talence, France
2
Institute of Condensed Matter Chemistry of Bordeaux (ICMBC), University of Bordeaux, 33600 Pessac, France
3
UJM, CNRS, IOGS, Laboratoire Hubert Curien, University of Lyon, UMR 5516, 42000 Saint Etienne, France
4
Institut des Sciences Moléculaires (UMR 5255 CNRS), Université de Bordeaux, 33400 Talence, France
*
Author to whom correspondence should be addressed.
Chemosensors 2022, 10(3), 110; https://doi.org/10.3390/chemosensors10030110
Submission received: 1 February 2022 / Revised: 2 March 2022 / Accepted: 8 March 2022 / Published: 11 March 2022
(This article belongs to the Special Issue Optical Chemical Sensors and Spectroscopy)

Abstract

:
Radio-photoluminescence in silver-doped phosphate glasses has been extensively used for X-ray dosimetry. In this paper, we present the potential of silver clusters for X-ray spatially resolved dosimetry. Those clusters are generated in phosphate glasses containing a high concentration of silver oxide by femtosecond direct laser writing technique. Two phosphate glasses of different compositions were investigated. First, the spectroscopic properties of the pristine glasses were studied after X-ray irradiation at different doses to assess their dosimetry potential. Second, the impact of X-rays on the three-dimensional inscribed silver clusters has been analyzed using several spectroscopies methods. Our analysis highlights the resilience of embedded silver clusters acting as local probes of the deposited doses. We demonstrate that these inscribed glasses can define the range and sensitivity of X-ray doses and consider the realization of spatially-resolved dosimeters.

1. Introduction

Since Schulman et al. [1,2], radio-photoluminescence (RPL) has been extensively studied in silver-doped phosphate glasses [3,4], considered nowadays as a reliable passive radiation dosimetry technique for ionizing radiations (Gamma and X-rays) [5,6,7,8]. After exposure to ionizing radiation, such glasses exhibit an intense luminescence while excited with ultraviolet (UV) light, which is referred to as the radio-photoluminescence (RPL) phenomenon. As RPL is known to be an established method for the determination of the absorbed doses [3,5,6,7], this technique can be applied to the individual monitoring of ionizing radiation as well as the monitoring of the natural environmental and/or man-made-emitting radiations in the dose range from tens of µGy up to several hundreds of Gy [9]. To better characterize the environmental radiation, RPL glasses have been coupled to a fiber system to obtain real-time dosimetry technology by continuously exciting the glass and collecting its RPL signal [10].
An observed limitation is that the RPL signal continues to increase both during and after irradiation. This signal grows following a saturating, exponential-type model, reaching a steady-state level after some hours. This well-known mechanism is called the “build-up” effect. The RPL signal is stabilized by the use of post-irradiation annealing procedures [8,11].
RPL glass dosimeters exhibit many good characteristics such as good reproducibility of the readout value, low energy dependence for photon energies within ±10% in the 0.03–1.3 MeV range, good dose linearity from 0.01 to 500 mGy [12]. Moreover, the luminescence centers are very stable unless the glass dosimeter is annealed at about 400 °C. This allows repeatable measurements to be achieved with little dispersion among samples and long-term stability against the fading effect (less than 1% fading after 30 days) [9,13]. Therefore, RPL glass dosimeters have been widely used as one of the accumulation-type dosimeters, among other types [14].
The basic mechanism responsible for the luminescence in these RPL glasses is summarized hereafter: ionizing radiations generate free electrons and holes that recombine with the Ag+ silver ions, converting them into Ag0 and Ag2+ electron and hole-trapped silver species, respectively [9,15,16,17,18]. Subsequently, the migration of these species leads to the clustering process of the Ag species forming Agmx+ type silver clusters [19,20]. However, the precise identification of the emitting centers (namely the involved nuclearities and associated population concentrations), their detailed generation mechanisms, and their optical characteristics remain difficult and it is still an active field of research and debate [18]. Several species such as Ag2+, Ag0, Ag2+, and Ag32+ have been reported as the main RPL centers under post-irradiation UV light excitation [19,20,21,22,23,24]. Although several articles have been published, no overall agreement has yet been achieved. It is generally agreed that the main RPL emission was ascribed to the orange emission peaking around 630 nm with a weaker blue emission peaking around 450 nm. The orange RPL was attributed to the hole-trapped Ag2+ centers and the blue emission was associated to silver ion reduction [16,17,25,26]. The lifetime of the blue RPL (2–10 ns) was about three orders of magnitude shorter than that of the orange one (2–4 µs) [9].
In the past two decades, the femtosecond direct laser writing (DLW) in transparent glasses has been extensively studied by many research groups. It is a well-established technique allowing to directly inscribe three-dimensional (3D) structures inside transparent glass substrates. For the silver-containing phosphate glasses used in this work, the femtosecond (fs) DLW process induces the formation of silver clusters Agmx+ (m is the number of ions and x is the formal charges) in the vicinity of the interaction voxel [27,28,29]. The fluorescence of these clusters presents a short lifetime, in the order of a few nanoseconds or less [30,31,32,33], while the hole-trapped Ag2+ centers have a longer lifetime in the few microseconds range [15]. Silver clusters are also responsible for a local refractive index modification Δ n , such modification type being called the type Argentum (type A) as previously reported [34,35,36]. Type A was demonstrated in numerous glass matrices containing silver ions. It allows for various local highly-contrasted optical responses (luminescence or refractive index) for the fabrication of photonic components and integrated devices. Such a type A structure allows, for instance, the creation of a novel type of optical waveguides in which the refractive index variation is supported by the clusters (and not by the glass matrix modification itself) [35]. The thermal stability of the photo-induced silver clusters was examined up to the transition temperature. The annealing processes from 100 °C up to 300 °C demonstrated the thermal stability of the clusters [28,30,37]. Ageing tests were also performed on the silver clusters at 100 °C for 3168 h, demonstrating no degradation in the fluorescence properties of the clusters [38].
To our knowledge, no research combining RPL and fs DLW has yet been conducted on those glasses. Recently, we demonstrated the generation of silver species in highly photosensitive silver-containing sodo-gallophosphate glasses exposed to X-rays, and the subsistence under X-ray irradiation of laser-inscribed molecular species such as the fluorescent silver clusters [39]. We reported that the phosphate glass network had a decisive influence on the X-ray photosensitivity and the formation of luminescent silver species, namely Ag2+ hole traps silver ions and Agmx+ silver clusters [39].
In this paper, the targeted objective is to evaluate the performances of a spatially-resolved dosimeter exploiting the properties of the laser-induced silver clusters localized in purpose in silver-containing phosphate glasses. Thus, RPL and fs DLW have been combined to estimate the potential of those laser-inscribed structures as local probes of the deposited doses. In the first part, we have deeply analyzed some of the recent results with silver-containing sodo-gallophosphate glass [39]. The spectroscopic properties allow for an estimation of the depth-dependent profiles of the linear absorption coefficient in absolute values. In the second part, another silver-containing phosphate glass composition is studied after X-ray exposure. Then, two depths localizations of identical fluorescent silver clusters are inscribed using fs DLW. The spectroscopic properties of the 3D structures are evaluated before and after X-ray irradiation to study the resilience of the irradiated silver clusters. The depth-dependent deposited dose within the glass thickness was evaluated using a Monte Carlo Geant4 simulation. Finally, the optical and spectroscopic properties were handled to demonstrate the realization of a sensitive and reliable dosimeter.

2. Materials and Methods

2.1. Glass Sample

Two glass compositions were used in this work. The first one was a commercial silver-containing zinc phosphate glass manufactured by Argolight Company (Bordeaux, France) (referred to as ARGO elsewhere in the publication). This glass was similar in composition to the one detailed in this reference [37]. The second one was an academic silver-containing pyro-phosphate glass (referred to as GPN elsewhere in the publication), synthesized using a classical melting-quenching method [39]. The pyro-phosphate glass is strongly depolymerized phosphate networks, mainly composed of dimeric phosphate tetrahedra. It was shown that this glass exhibits high photosensitivity to fs DLW, leading to highly fluorescent structures, which result both from its glass network and the presence of co-mobile sodium ions [40]. The refractive index of the GPN and ARGO glasses is measured at 589 nm using an Abbe refractometer enabling a precision of ±0.002. The chemical composition, the refractive index, and the glass transition temperature of the two glass samples are reported in Table 1.
Unlike currently commercialized RPL dosimeters (Ag-doped phosphate glasses with 0.17% Ag (w.c.)), our glasses contain two orders-of-magnitude more silver ions. Due to the high concentration of silver oxide incorporated in our two glasses, silver ions are weakly involved in isolated Ag+ site, emitting at 290 nm for an excitation centered around 220 nm and dominantly involved in Ag+-Ag+ pair sites showing an emission band near 380 nm for an excitation near 260 nm [36,40]. A transparency window is exhibited in silver-containing phosphate glasses from the visible range to the mid-IR range. The non-containing silver glass starts exhibiting an absorption around 230 nm, which is ascribed to the presence of defects and impurities in small quantities in the glass. However, the incorporation of silver in the glass shifts the absorption edge to higher wavelengths by introducing novel absorption features in the UV. Such a silver-induced shift of the material bandgap to lower energy levels further helps facilitate the laser-activation photochemistry of silver species under IR femtosecond laser exposure [41].

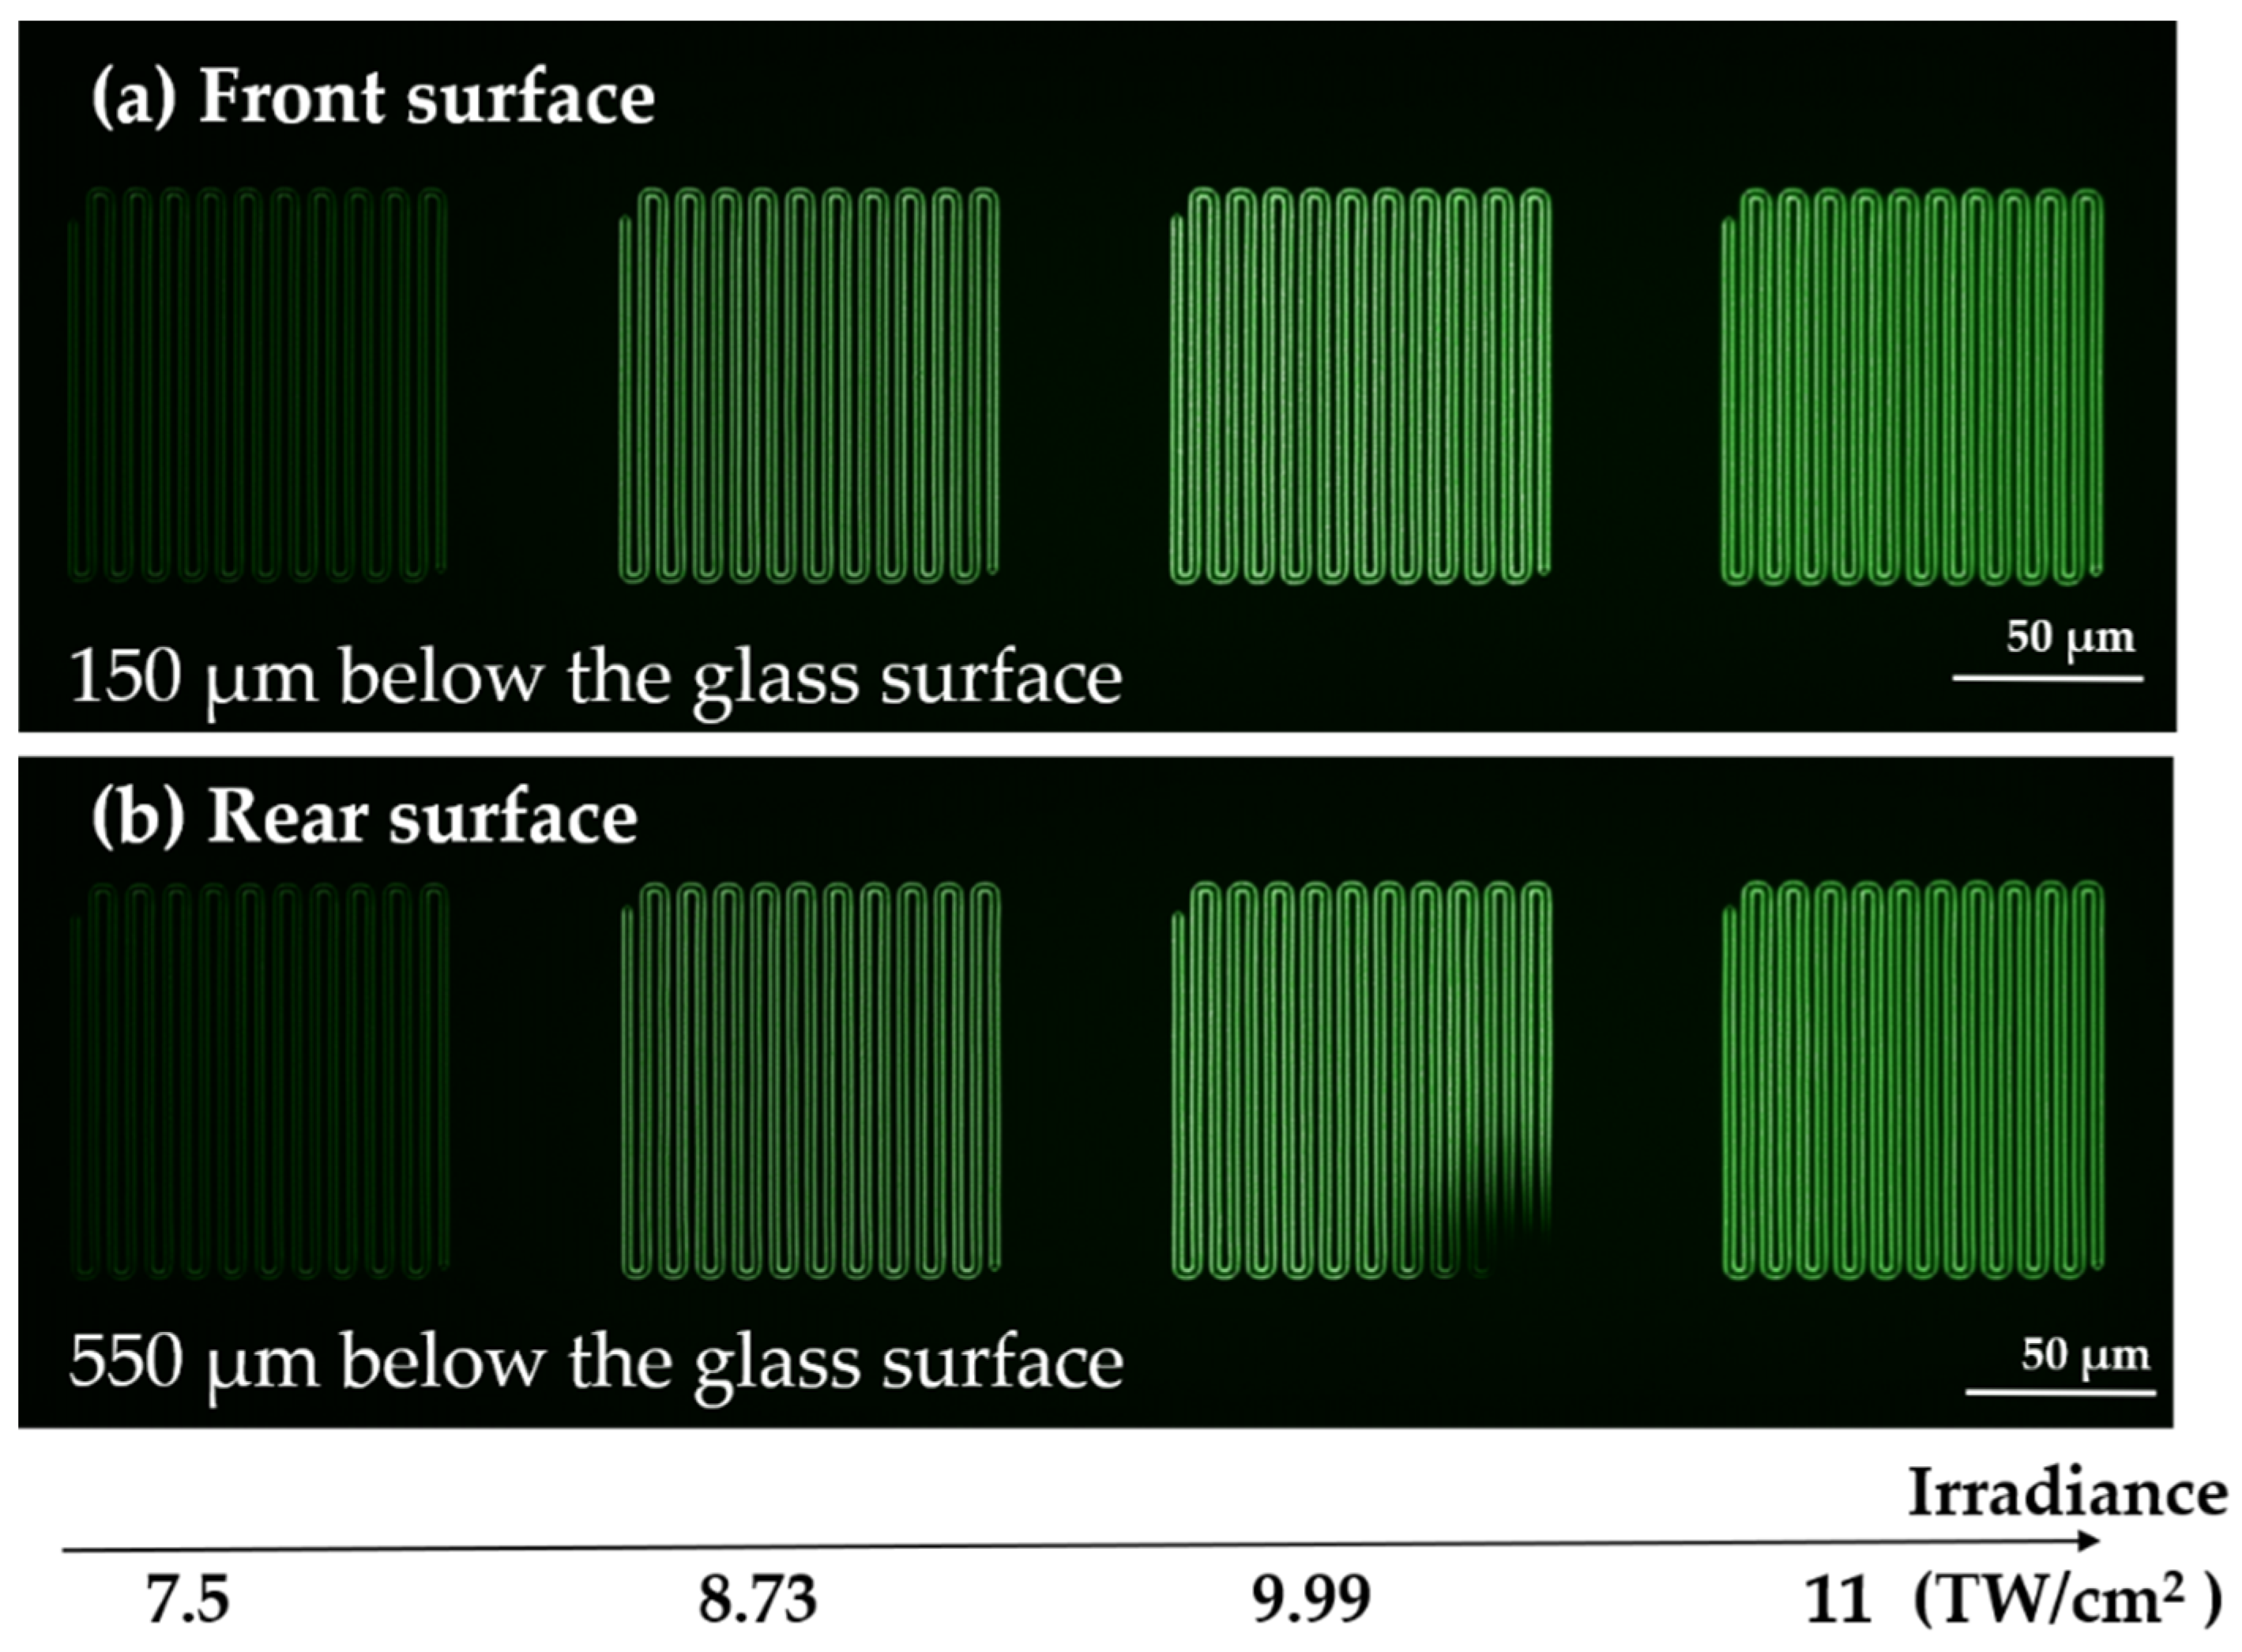
2.2. Infrared Femtosecond Direct Laser Writing (DLW) of Pristine Glasses

DLW was performed using a Yb:KGW fs oscillator (T-pulse 200, 9.8 MHz repetition rate, 412 fs pulse duration (FWHM) and emitting at 1030 nm wavelength, amplitude system) combined with an acousto-optic modulator in order to control the energy and number of pulses. The sample displacement and positioning were carried out using a high-precision 3D translation stage (XMS-50 stages, Micro controller). A spatial light modulator is used to compensate for both the different focal planes and the spherical aberrations. The microscope objective (Carl Zeiss, 20 × , 0.75 NA) used for this experiment is adapted for laser focalization under a microscope cover slide of ~170 µm with a refractive index (RI) of ~1.518. Given that our glasses exhibit higher refractive indices, the corresponding refractive index mismatch leads to a focused beam waist slightly larger than that obtained under ideal diffraction-limited focusing conditions equal to w 0 = 0.61   λ 0 N A [29]. In this experiment, the beam waist is calculated to 0.84 µm. The obtained experimental diameters of the inscribed structure have values between 1.5 and 2.2 µm. The laser irradiance deposited in the glass sample was measured after the focusing objective.
For the inscribed ARGO glass sample, the fs-inscribed glass is referred to as ARGOi elsewhere in the publication. Cartography of square linear structures of 100 µm × 100 µm with an interline spacing of 5 µm was written inside the glass, typically 150 µm below the surface (adapted depth for the objective) using a microscope objective. The irradiance was changed during the writing, from 7.5 TW/cm2 to 11 TW/cm2, while the writing speed was fixed at 70 µm/s. To have the same laser parameters at the focus spot, and thus to create identical silver clusters in two different planes, the sample was turned by 180° to inscribe the same structures at 150 µm below each of the two glass surfaces. In this way, the same DLW structures were written at 150 µm and 550 µm below the glass front surface, knowing that the glass thickness was 700 µm. Regarding the GPN glass, DLW was performed on a 1 mm thick sample. The inscribed glass is referred to as GPNi elsewhere in the publication. The same experimental setup described above was used to create a 3 × 3 mm2 square inscribed at 160 µm below the glass surface (adapted depth for the objective) for an irradiance of 13.4 TW/cm2 and a writing speed of 100 µm/s [36].
Similar luminescent patterns were obtained on both samples. Figure 1 shows the laser-inscribed silver clusters written in the ARGOi glass sample. As reported elsewhere, a nonlinear four-photon absorption process leads to the formation of the photo-induced silver clusters Agmx+ in the interaction voxel, composed of less than 10 atoms [35,36]. These silver clusters are distributed in a disjoint way in the interaction voxel owing to the weak initial atomic density of silver ions equal to approximately 7.9 × 10²⁰ atoms/cm3 (0.79 atom/nm3). At a low irradiance regime, the creation of silver clusters mostly starts from the pre-existing silver ion pairing (Ag+−Ag+) [36]. The high repetition rate of the fs pulsed laser allows for the activation of silver ion migration. The pulse-to-pulse process results in the aggregation of neutral and ionic silver species. The ionic migration has been proposed to occur radially from the center of the beam to the edge. The formation of fluorescent silver clusters Agmx+ at the surrounding of the interaction voxel occurs due to the combination of electrons production, silver reduction, and silver migration. The sample motion during the laser writing process gives access to the formation of 3D fluorescent structures within the glass volume [27,35,42]. These clusters are characterized by two main absorption bands in the UV range, typically centered around 290 nm and 340 nm, and by a broad and bright fluorescence emission in the whole visible range with a high quantum yield [29]. The fluorescence cross-section is higher than dye molecules and suffer no photobleaching, which is mandatory for application when fluorescence is used for long-term monitoring [43].

2.3. X-ray Irradiations of Pristine and Laser-Inscribed Glasses

ARGO and ARGOi glasses were irradiated (referred to as ARGO* and ARGOi* elsewhere in the publication) using the MOPERIX X-ray irradiator of Laboratory Hubert Curien of University Jean Monnet (Saint-Etienne, France). Its X-ray tube, with a tungsten anode, was operated at 100 kV and a current of 13.7 mA, providing X-rays with 40 keV energy on average. The measurements were taken at ambient temperature. The dosimetry was done with a PTW 23344 ionization chamber connected to a PTW UNIDOS E unit, allowing to measure the deposited dose at the sample surface with respect to water. The samples were irradiated with the same dose rate of 50.05 mGy(H2O)/s while changing the exposure time to accumulate three different doses of 2, 22, and 222 Gy(H2O).
X-ray irradiated glasses were colored in yellow after 222 Gy, as shown in Figure 2.
X-ray irradiations on GPN glass (referred to as GPN* elsewhere in the publication) were conducted using a Philips PW2274 X-ray tube with tungsten anode, operated at 20 kV and 32 kV for micro-luminescence and RPL experiments, respectively, at the Department of Materials Science of the University of Milano-Bicocca. The obtained dose values were compared to a calibrated 90Sr-90Y beta radioactive source using an optically stimulated luminescence emission from quartz crystalline powder (100–200 µm). A Machlett OEG50 X-ray tube with a tungsten anode operated at 32 kV was used to irradiate the glass samples for the absorption spectra. Dose evaluation was performed using a PTW Duplex calibrated ionization chamber. Two X-ray irradiation series were conducted, from 5 mGy to 5 kGy and from 2 to 365 Gy [39].

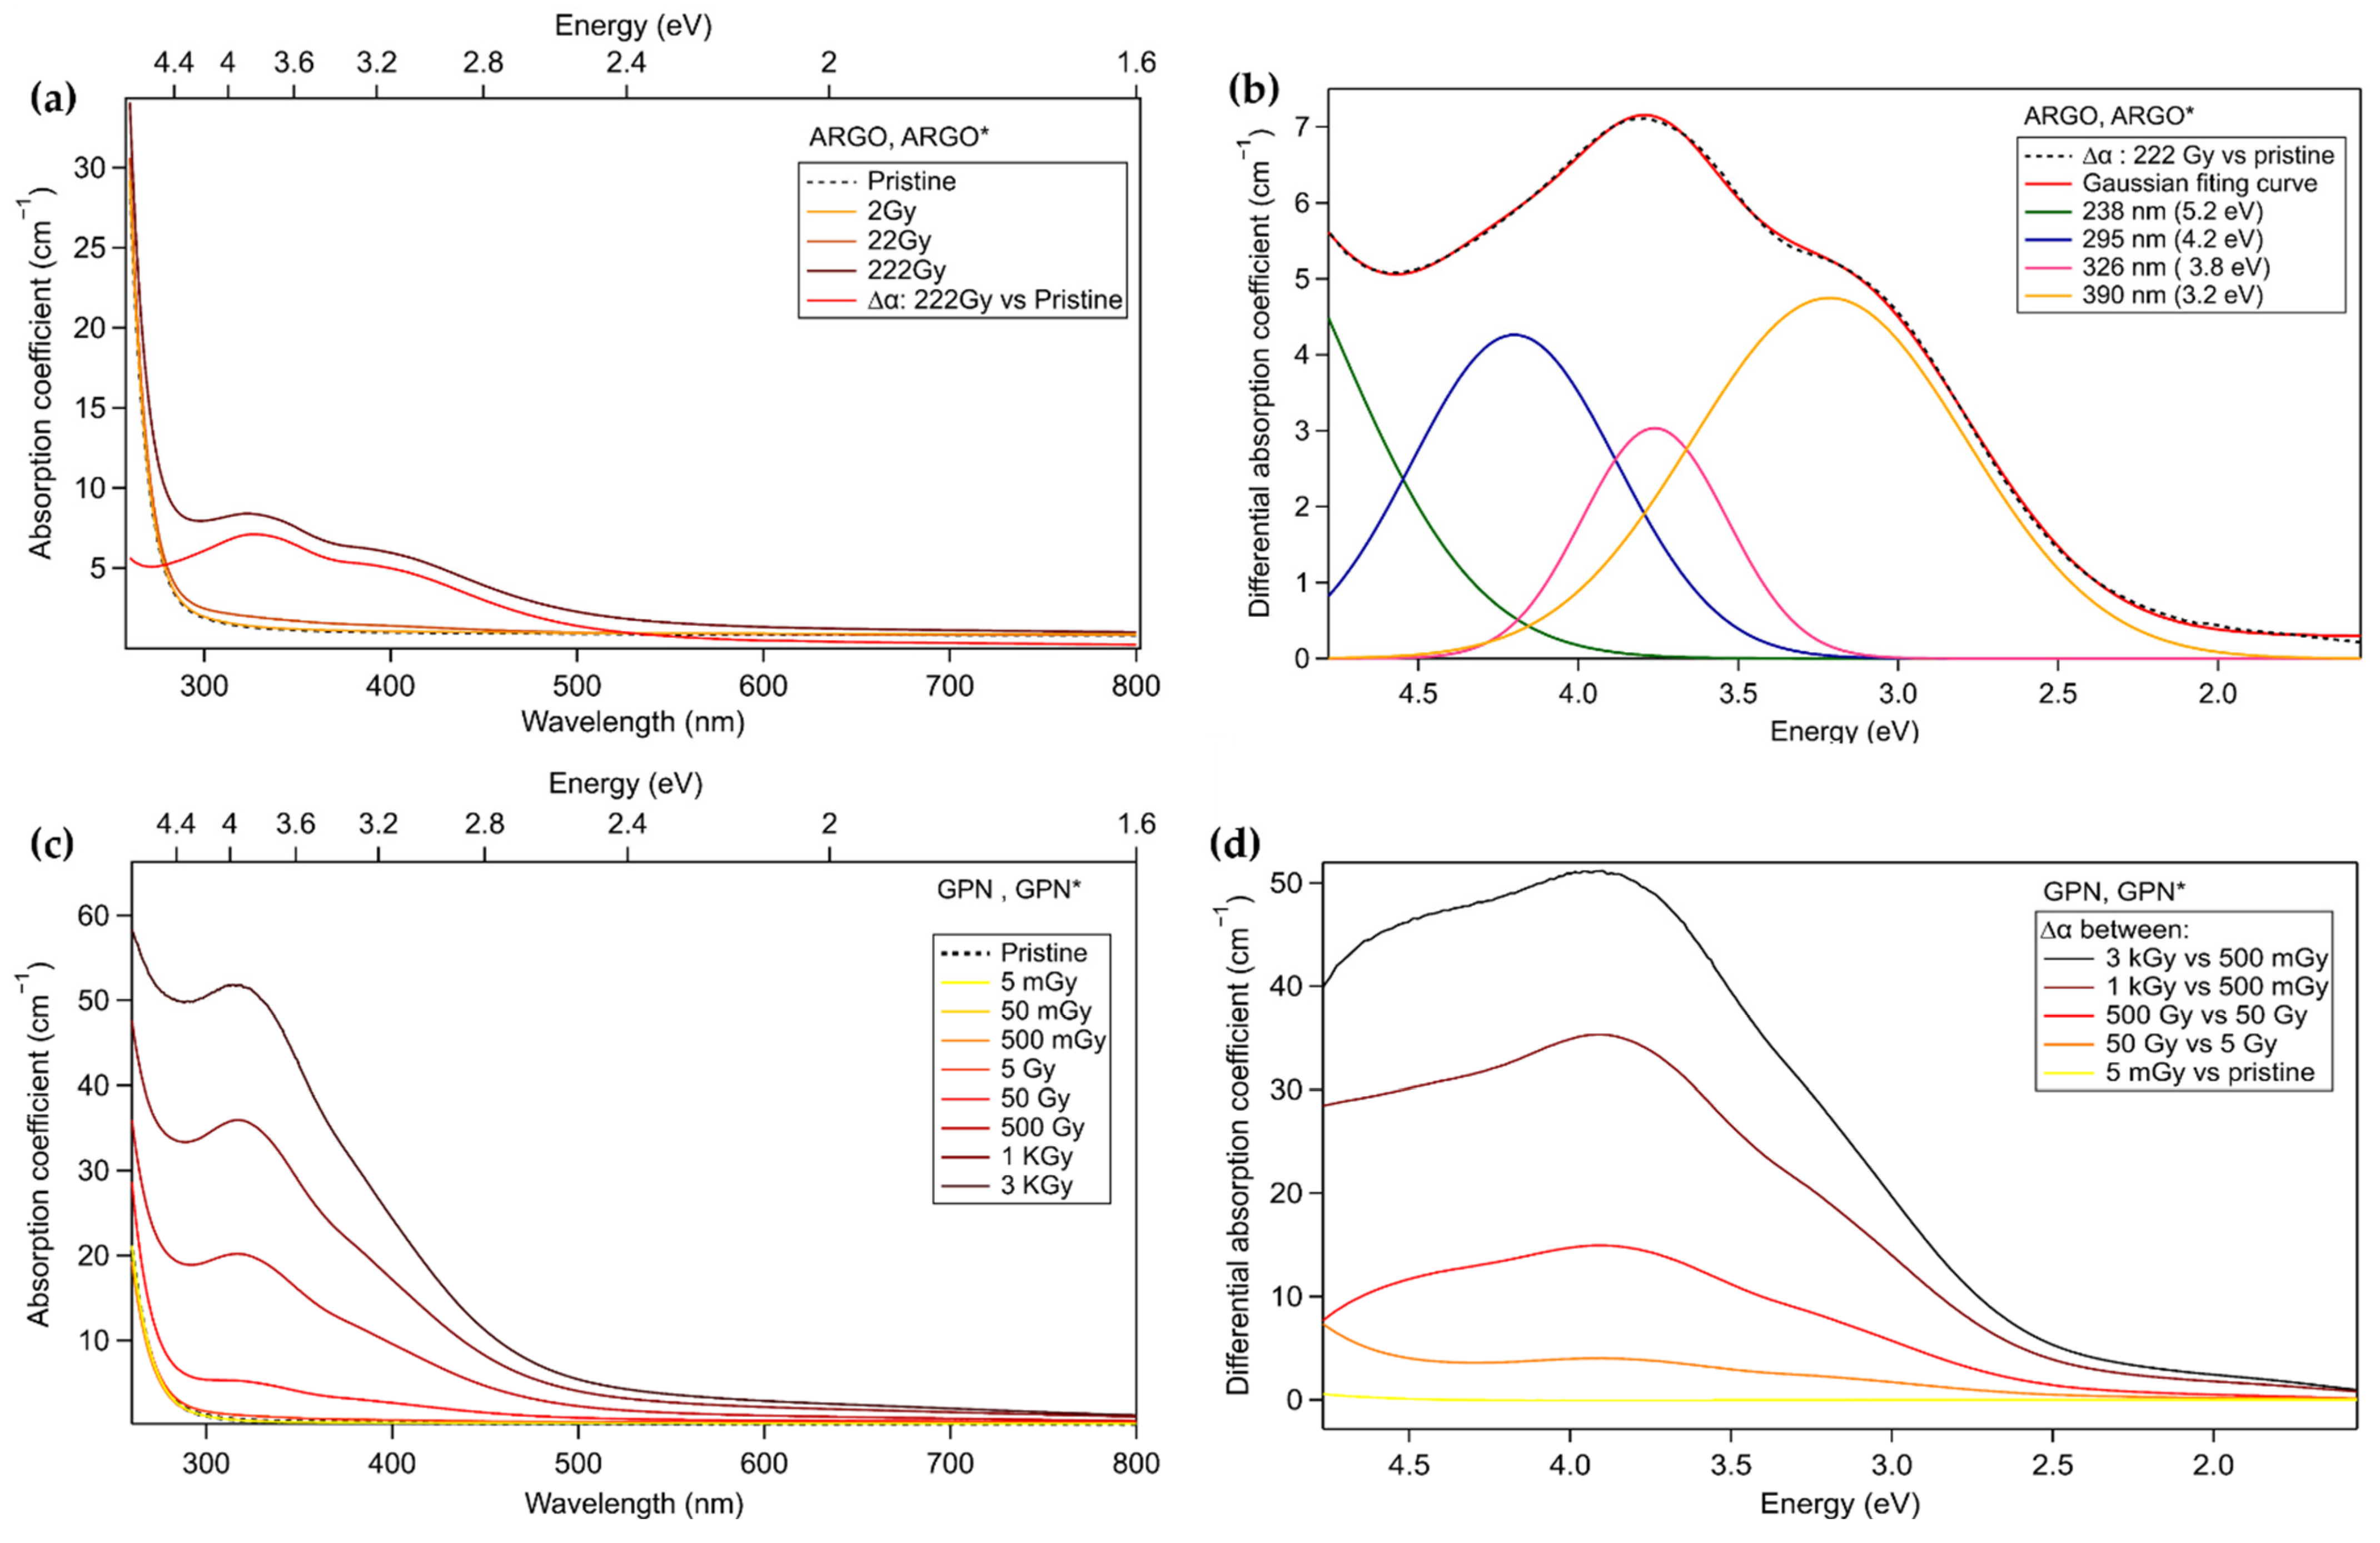
2.4. Absorption Spectroscopy

The transmission spectra for the ARGO and ARGO* glass samples were recorded with a Cary 5000 (Agilent Technologies) spectrophotometer in double beam configuration between 260 and 800 nm with a step of 1 nm and an integration time of 0.5 s.
The transmission spectra of the GPN and GPN* were recorded with a Cary 5000 (Varian) spectrophotometer between 200 and 800 nm with a step of 1 nm and an integration time of 0.1 s [39]. Note that both spectra were collected over the entire glass thickness.

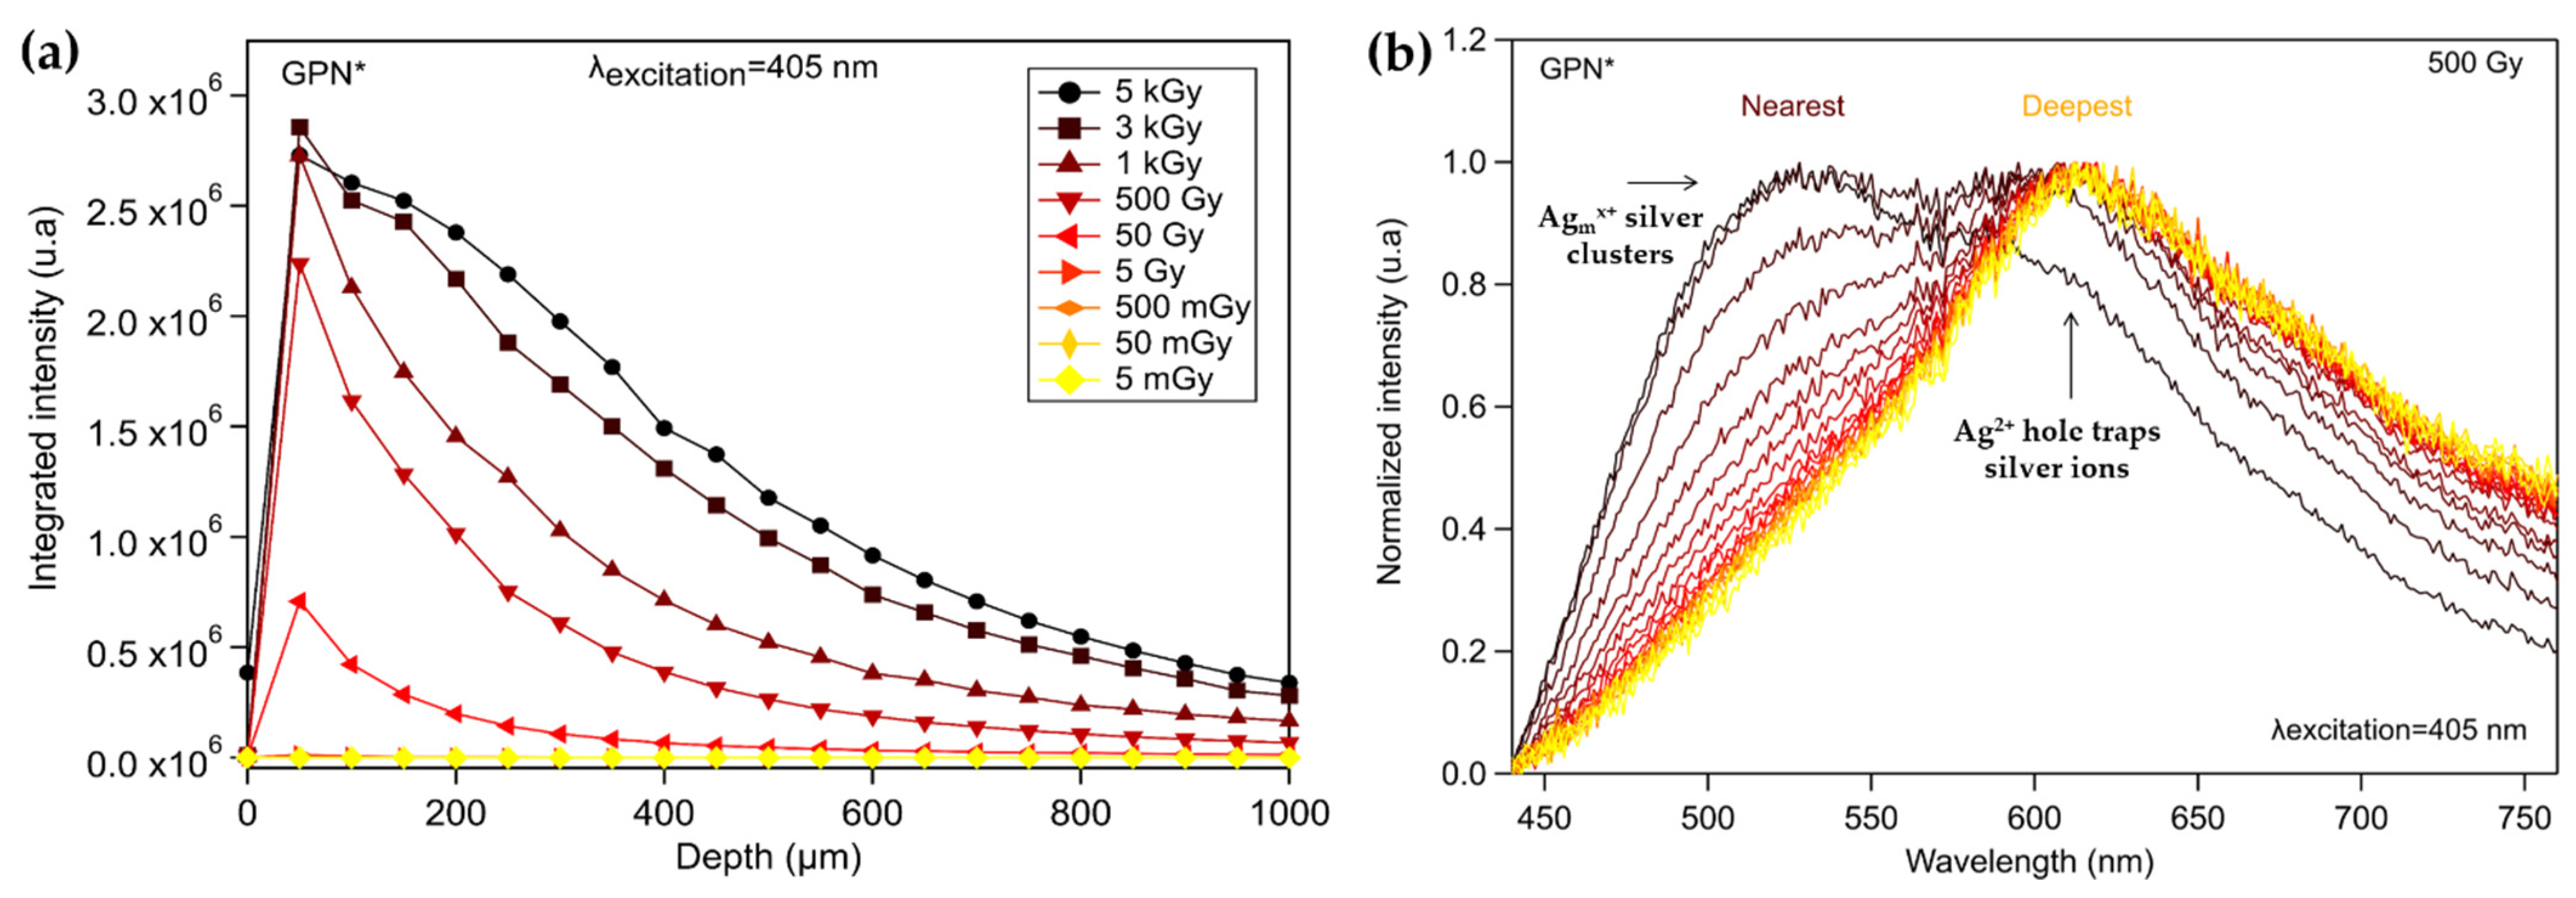
2.5. Radio-Photoluminescence Micro-Spectroscopy

Distinct radio-photoluminescence measurements were carried out with two distinct systems of equipment corresponding to a confocal LabRam Aramis (Jobin-Yvon) micro-spectrophotometer with a cooled CCD camera. One system (used for ARGO samples) was equipped with a HeCd laser (CW excitation at 325 nm), a UV microscope objective (40 × , 0.5 NA) (Hubert Curien laboratory (LabHC), St Etienne, France). The other system (used for GPN samples) was equipped with a CW laser diode (excitation at 405 nm), an Olympus microscope objective (100 × , 0.9 NA) (ICMCB, Bordeaux, France).
For the first system, emission spectra were dispersed by a diffraction grating of 150 lines/mm and were recorded with a step of 5 μm during linear cartography for a spectral region 450–800 nm. The excitation source was perpendicular to the front surface; the emission spectra were recorded from the same facet. Those measurements were made for the ARGO and ARGOi, before and after irradiation.
For the GPN* glass, the micro-luminescence measurements have been performed from the lateral facet of the pristine glass, perpendicularly to the front X-rays irradiated face. The spectral emissions were identically collected and then recorded for different lateral positions, corresponding to different X-ray irradiation depths, with position steps every 50 µm [29].

2.6. Micro-Absorption Spectroscopy

A homemade micro-absorption experiment was recently mounted to measure the differential absorption coefficients for the different inscribed patterns compared to a non-inscribed zone in the ARGOi* glass sample.
A tunable Ti-Sapphire laser (Chameleon Vision-S, tuning range 690–1050 nm, 80 MHz repetition rate, 75 fs pulse duration at 800 nm, average power at peak >2.5 W) was used as an excitation source. The measurement was achieved using a BBO crystal (6 × 6 × 0.5, θ = 29.2, φ = 90, SHG at 800 nm, type 1) to obtain a frequency-doubled beam emission in the UV-Visible range. The wavelength sampling (356–514 nm) was adjusted to have constant photon energy variation steps. The transmission spectra were collected with symmetrical scanning between a structured and a non-structured zone using a galvanometer scanning system (GSI Lumonics scan controller). A CCD camera is placed in order to visualize the structures and the scanning process. A blue diode at 380 nm was used as blue illumination to visualize the fluorescence of the structures on the CCD. A 435 nm long-pass filter is placed before the CCD to cut the blue diode, allowing the observation of the fluorescence of silver clusters.
The scanning signal is collected using a photodiode connected to an oscilloscope. A modulated current signal of a scan between an inscribed zone and a non-inscribed zone was compared to that in a non-inscribed zone. The difference between the two signals allows for the extraction of the value related to the inscribed structures. The local differential linear absorption coefficient was then calculated, considering the filling rate of the structure.

2.7. Phase Imaging Microscopy and Local Refractive Index Change Measurement

Refractive index variation Δ n between the unmodified glass and the silver clusters was measured for the ARGOi and ARGOi* samples using a phase-contrast microscopy method with the commercial SID4Bio wave front sensor (PHASICS company). A 100 × , 1.3 NA oil immersion objective was used to image the structures using white light illumination. The final output of the wave front sensor gave an intensity image and a phase image showing the optical path difference (OPD) experienced by light while passing through the laser-induced modified areas of the samples. Given the OPD, the real value of Δ n could be estimated by dividing the OPD by the thickness of the structures [36].

2.8. Fluorescence Lifetime Imaging Microscopy (FLIM)

The fluorescence lifetime imaging microscopy (FLIM) analysis was performed for the ARGOi and ARGOi* samples with a Picoquant MT200 microscope equipped with two MPD single photon avalanche diodes (SPADs) and a PicoHarp300 timing board for time-correlated single photon counting (TCSPC) operation in epi-collection mode.
The pulsed laser source was a PicoQuant picosecond diode laser (fibered) at 375 nm. The laser was injected by a 100 × , 1.40 NA oil objective (UPLSAPO100XO, Olympus, Tokyo, Japan) by an 80%T-20%R spectrally flat beam splitter and the fluorescence was collected by the same objective and transmitted by the same beam splitter to the confocal optics and detectors. The backscattered excitation light was rejected from the fluorescence signal by a 405 nm long-pass filter. Then, the signal was split by a 50/50 nonpolarizing beam splitter cube to the two SPADs and was filtered by two bandpass filters ((a) HQ510/80 with a 470–550 nm transmitted spectral window; (b) HQ425/50 with a 400–450 nm transmitted spectral window), both from Chroma Technologies, Rockingham, VT, USA. The laser was scanned by means of a piezoelectric stage in a grid pattern of 40 × 40 µm, 80 nm pixel and 0.6 ms/pixel.
For the FLIM images, a reference time was defined at the onset of the global image decay curve. The reported lifetime in each pixel was calculated as the first statistical momentum of the histogram distribution of the single photon arrival times, minus this reference time, pixel by pixel. This method is referred to as FAST-FLIM.
For quantitative analyses, decay curves corresponding to full images were fitted by a multi-exponential model using a “tail-fitting” method, i.e., without considering the convolution by the impulse response function of the instrument.

3. Results and Discussion

3.1. Study of Non-Inscribed Samples Exposed to X-rays

The refractive index of the ARGO glass was measured before/after X-ray irradiation with an Abbe refractometer. It decreases slightly in the two surfaces after 222 Gy dose (Table 2).
The absorption spectra for both glasses are depicted in Figure 3a (ARGO and ARGO*) and in Figure 3b (GPN and GPN*) after X-ray irradiation series from 2 Gy to 222 Gy and from 5 mGy to 3 kGy, respectively.
For the ARGO* glass sample, the radio-induced absorption bands appear in the spectral domain between 300 nm and 500 nm while increasing X-ray doses up to 222 Gy (Figure 3a). Two shoulders are visible in the radiation-induced absorption (RIA) spectrum at the maximum dose. New absorption band contributions appear in the GPN* glass sample and increase in amplitude, with the irradiation dose having a maximum of about 320 nm (Figure 3c). To better identify and track changes in the band contributions for both glasses, the difference absorption coefficient spectrum (222 Gy vs. pristine) of the ARGO* glass was fitted considering Gaussian energy contributions for the photo-induced species, as shown in Figure 3(b). It was found from the peak fitting that the absorption spectrum consists of three absorption bands peaking at around 295 nm (4.2 eV), 326 nm (3.8 eV), and 390 nm (3.2 eV). Some of those absorption bands are related to different centers, making the analysis untrivial. The band around 238 nm (5.2 eV) was assigned to the isolated Ag+ site in the pristine glass [36]. According to the literature, the three absorption bands, respectively, at around 295 nm, 326 nm, and 390 nm, with the maximum being 326 nm, could be assigned to Ag2+ hole traps silver ions [15,39,44]. The absorption band at 295 nm and 326 nm could also be ascribed to Agmx+ silver clusters [15,44], and the band around 390 nm could be related to the presence of Ag0 electron traps [15,27]. Besides, the difference absorption coefficient spectra between different conditions of irradiations were presented in Figure 3d for the GPN and GPN* glass samples. At higher doses, the cut-off of the glass increases, as shown in the 50 Gy vs. 5 Gy dose difference spectrum with additional bands at 320 at 390 nm. A complementary contribution at 280 nm appears from the 500 Gy vs. 50 Gy dose difference spectrum and above with the growth of both absorption bands. One should notice that the absorption coefficient spectra for 222 Gy of the ARGO* glass is approximately similar to the 50 Gy spectra of the GPN* glass sample.
Moreover, the emission spectra of the micro-luminescence measurements in the GPN* glass are presented in Figure 4 [39]. These measurements were recorded from the side of the GPN* glass sample so that excitation and collection conditions were kept the same, whatever the probed depth of over 1 mm distance from one side to the other.
The evolution of the integrated spectra measured at each depth is reported in Figure 4a. This integrated fluorescence signal, excited at 405 nm, increases with the X-ray dose. The decrease in the emission intensity with depth resulted from the X-ray depth attenuation. Figure 4b shows the spectral evolution for a 500 Gy dose at different depths changing from a 1 mm depth up to the surface. The nearest signal collected from the surface presents a wide emission band from 440 nm to 760 nm centered at about 520 nm, corresponding to silver clusters Agmx+. The signal that collected deeper below the glass surface exhibits a peak at 620 nm. According to the absorption coefficients and the emission spectra, the 620 nm emission band is related to the presence of Ag2+ hole traps silver ions. Thus, dose-dependent defects are generated: the lower doses generate a reservoir of luminescent Ag2+ hole traps silver ions while, for higher irradiation doses, silver luminescent clusters Agmx+ become dominant.
Figure 4a helped us to scale in absolute values and to estimate the depth-dependent profiles of the linear absorption coefficient at 405 nm for different incident X-ray doses (Figure 5). The underlying hypothesis is that the depth-dependent integrated fluorescence emission amplitude (shown in Figure 4a) is locally proportional to the depth-dependent linear absorption coefficients at 405 nm of the defects created by X-rays. Indeed, such depth-dependent linear absorption coefficients at 405 nm are considered to be proportional to the local X-ray dose deposition, and thus to the local density of the depth-dependent defects generated by X-rays (see Appendix A) [45].
As represented in Figure 5, linear absorption coefficient profiles at 405 nm are approximately constant as a function of the sample depth (>500 µm) between 5 mGy and 5 Gy doses. This behavior is not homothetic for depths inferior to 500 µm for the same dose range. Both depth and dose-dependency are present for doses larger than 5 Gy. The slope of the linear absorption coefficient profiles changes while increasing the X-ray dose, assuming the idea of the generation of distinct created populations of silver species versus depth. The depth dependence of X-ray-induced glass modification depends on the local X-ray intensity (local depth-dependent deposited dose). In addition, X-ray photon energy is not absorbed in the same way through the glass sample. The process by which photons are absorbed into matter depends on their energies as well as the effective atomic number of the absorbing material. Thus, the attenuation of the intensity with depth depends on the interaction modes of photons with matter such as the Compton effect, the photoelectric effect, Rayleigh scattering, and the production of pairs [46,47]. Probably, the damage of the material after a 3 kGy X-ray dose (radiation-induced darkening) affects the results shown in this graph, which should be taken with precaution.

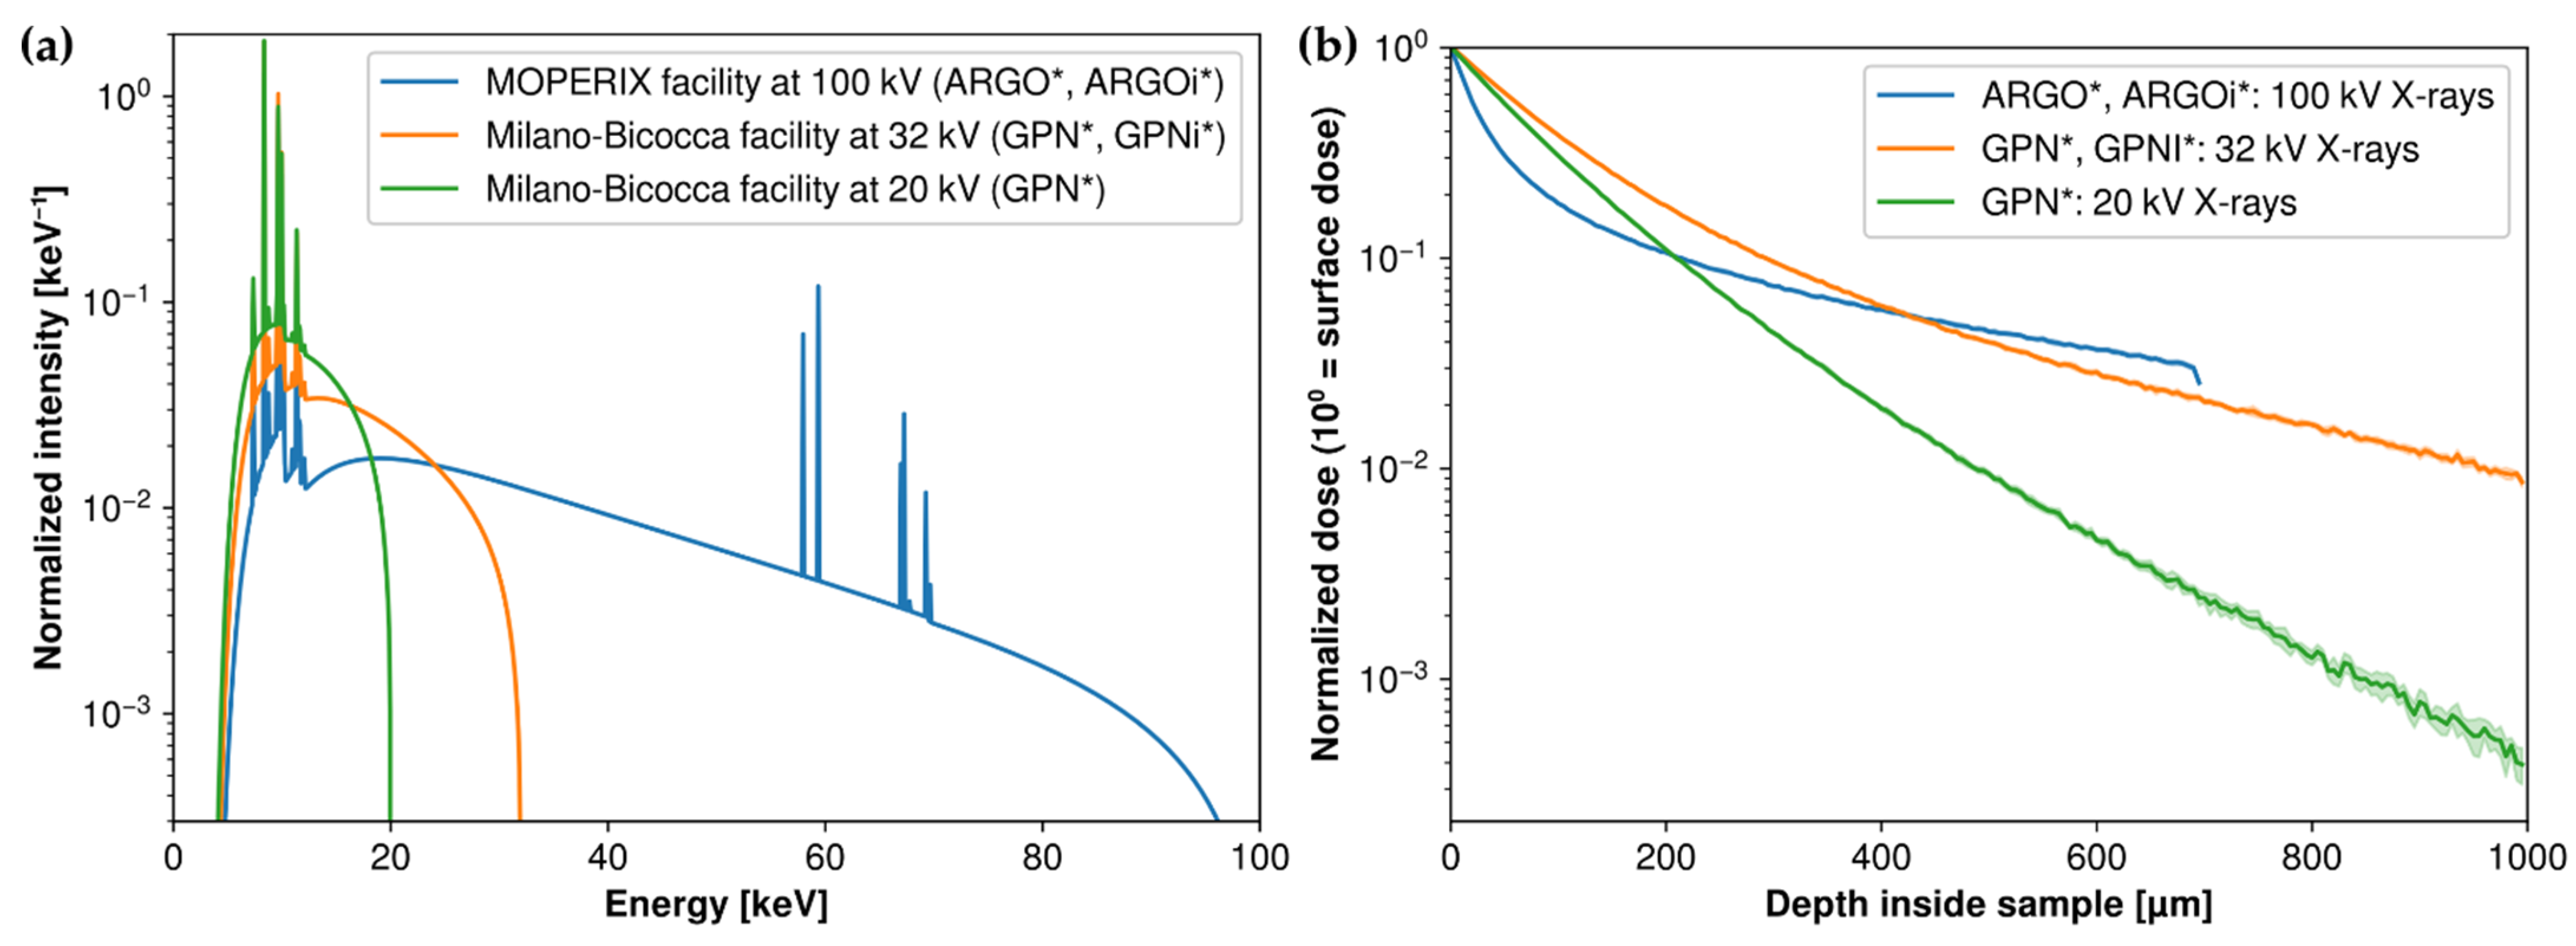
3.2. Simulation Model for Energy Spectrum and Depth-Deposited Dose

A simulation model was conducted using SpekPy and Geant4 toolkits in order to simulate the dose deposited by X-rays on ARGO*; ARGOi* and GPN*; GPNi* glasses.
The SpekPy simulation toolkit [48] (v2.0.6) was used in order to simulate the X-ray spectrum corresponding to each facility by providing the anode material (tungsten (W) in both cases) and supply voltage (100 KV for ARGO*; ARGOi* samples, 32 KV for GPN*; GPNi* samples and 20 kV for GPN* sample), along with a filtration of 4 mm beryllium (Be) and 10 mm air to take into account, at a first approximation, the drop in lower energies due to inherent filtration of the facilities. The resulting energy spectra are given in Figure 6a. Their shape is explained by the contribution of two components: bremsstrahlung, which shapes most of the spectrum, and characteristic emission, due to electronic transitions inside the atoms of the tungsten anode, resulting in peaks on the spectrum [49].
Then, the Monte Carlo Geant4 toolkit [50] (Geant4 v11.0.0 using G4EmStandard_opt4) was used to perform the actual simulation of dose deposition. Each sample was modeled as a box of a homogenous material, with the composition according to Table 1, and irradiated with photons according to the energy spectra simulated by SpekPy as described above. Each sample was cut in 140 and 100 respective layers along their thickness, enabling a spatial resolution of 5 µm and 10 µm, respectively, for ARGO*, ARGOi* and GPN*, and GPNi* samples. Simulation of the dose in the depth of each sample, relative to the dose measured at the surface, is shown in Figure 6b.
Similar simulations were performed by changing the box material to water or quartz, which could be combined with the in situ dosimetry measurements used to obtain the absolute value of the deposited dose inside each sample. Calculated dose data relevant to the waveguides inscribed inside glass samples are reported in Table 3.
According to the simulation, both materials absorb X-rays, resulting in a decreasing dose, as the depth inside the material increases. In the ARGOi* glass sample, the dose reaching the silver clusters is much lower than the one deposited at the sample surface. It is also noticeable that the rear-surface-inscribed silver clusters receive an attenuated dose three times smaller than that of the front-surface-inscribed silver clusters. GPN* and GPNi* glass samples show a different absorption characteristic, with a slower but steadier decrease in the dose. Knowing that the two irradiators have different energy spectra, the doses are not directly comparable.

3.3. Study of Silver Clusters Inscribed by DLW Exposed to X-ray Irradiation

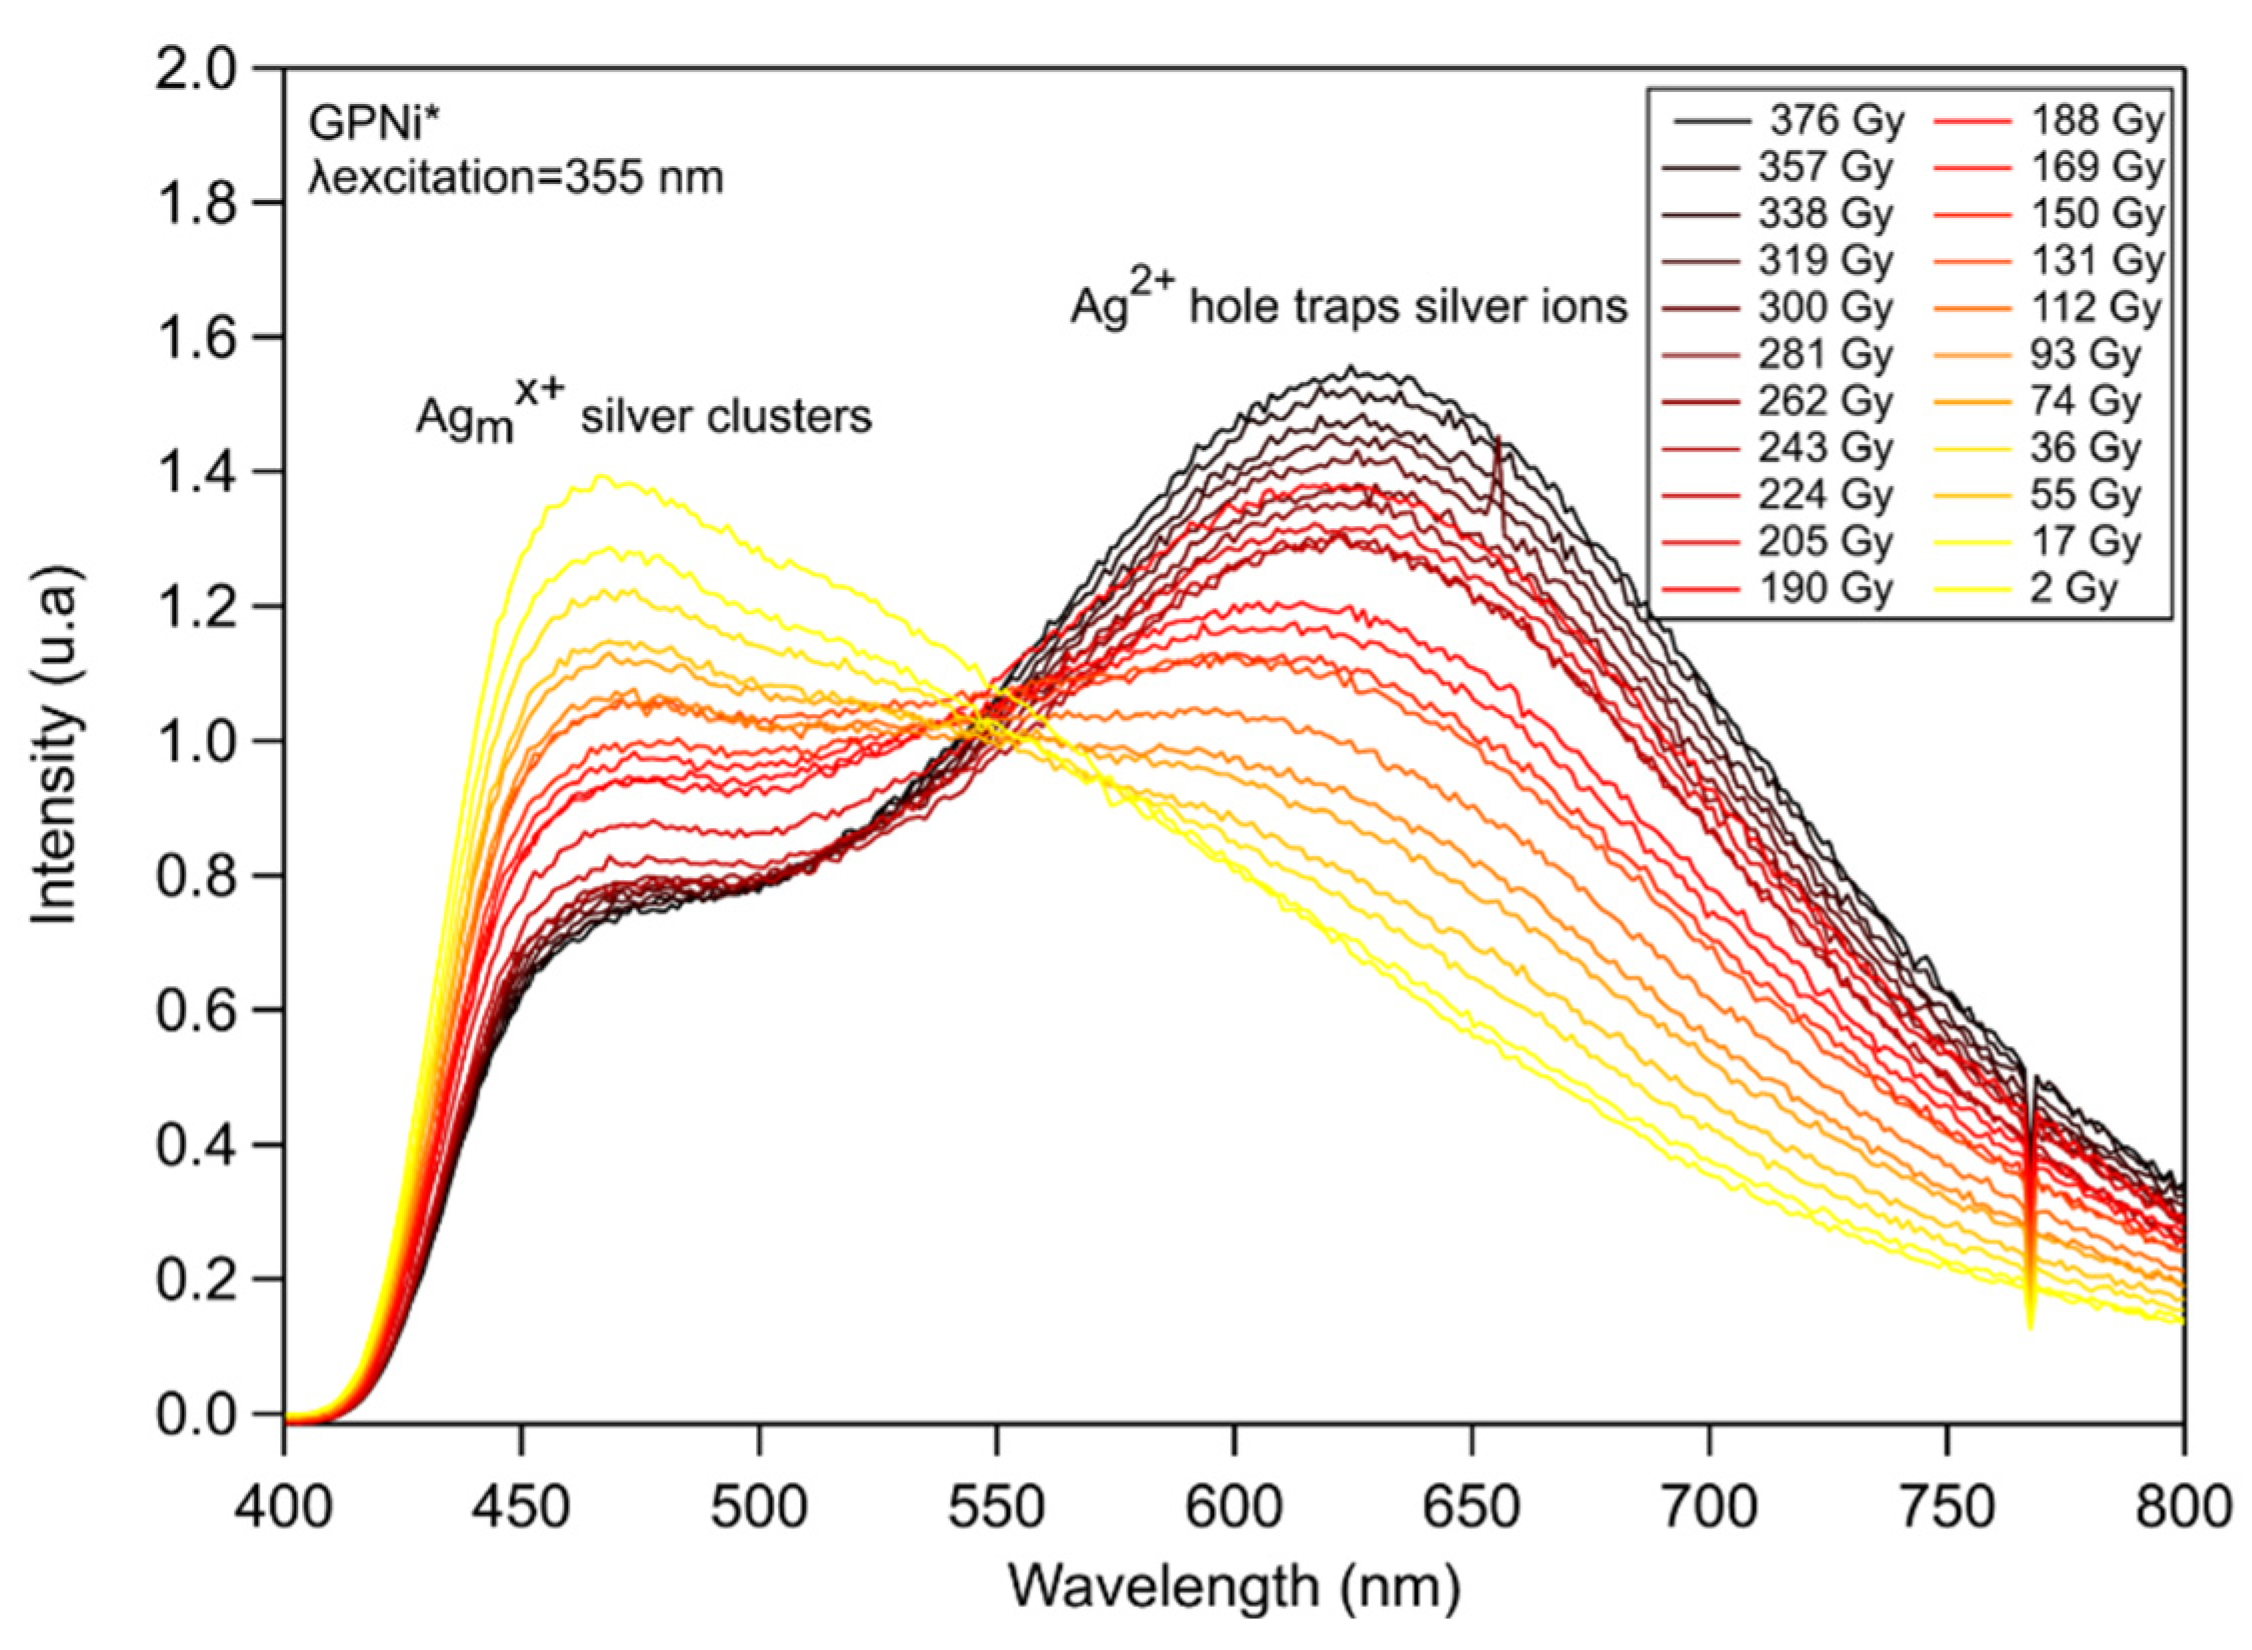
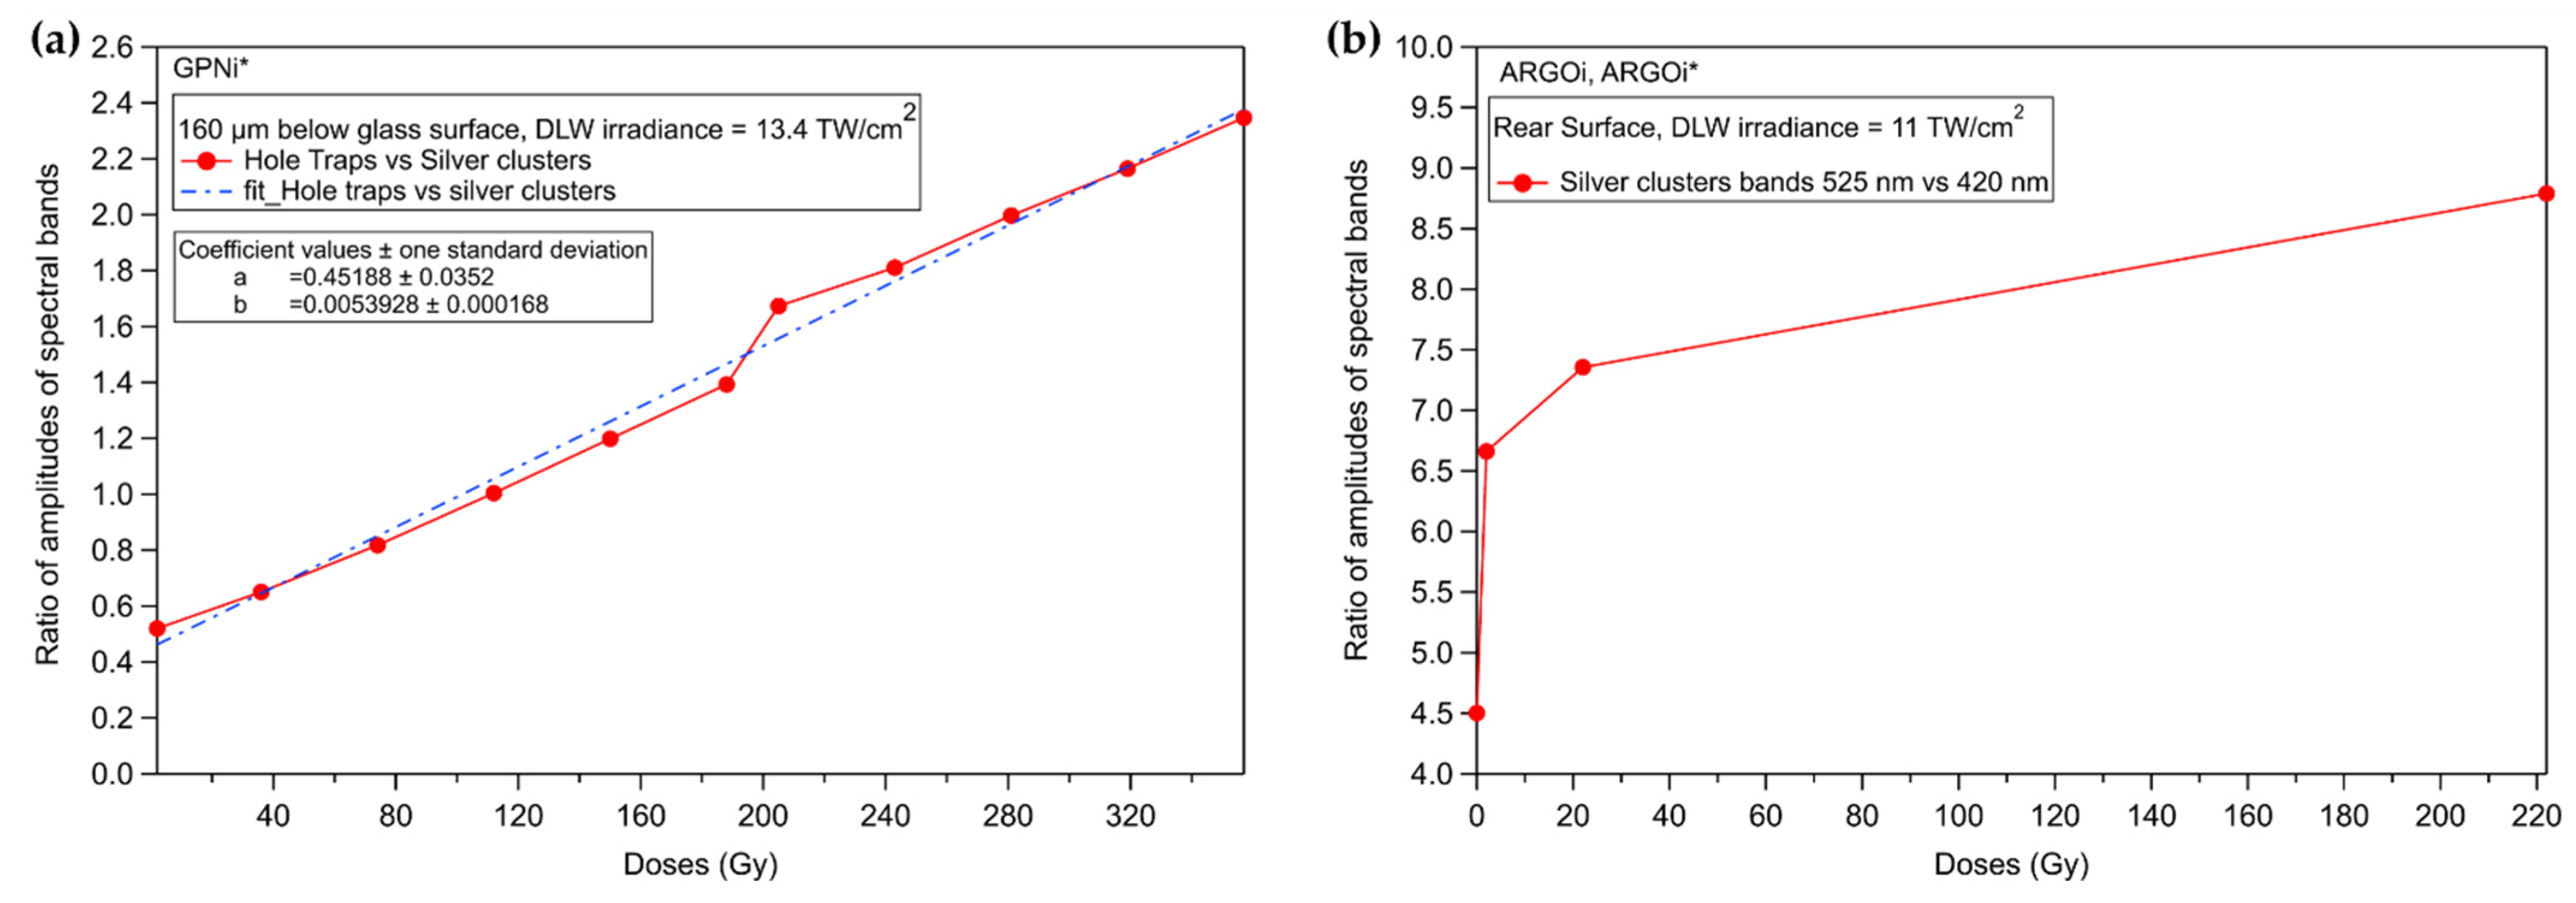
3.3.1. Silver Containing Sodo-Gallophosphate Glass (GPNi)

An all-in-one, epi-collected radio-photoluminescence experiment (combining X-rays irradiation and in situ UV excitation at 355 nm) was realized on the GPNi* glass sample. It integrated all the glass thickness and was carried out at the fs laser inscribed structure for an irradiance of 13.4 TW/cm2 at 160 µm below the glass surface. As shown in Figure 7, the spectra present a broadband luminescence centered at 460 nm, attributed to silver clusters AgmX+ inscribed by DLW, with a shoulder at around 620 nm attributed to hole trap defects corresponding to silver ions Ag2+ generated by X-ray irradiation. The spectra represent a spectrum balance as a function of the dose. A significant increase in the Ag2+ luminescence with X-ray doses overlays the DLW silver clusters luminescence, which decreases indirectly due to the absorption at 355 nm of the defects generated by X-ray in the 160 µm thickness from the glass surface down to the localization of the laser-inscribed silver clusters [39].

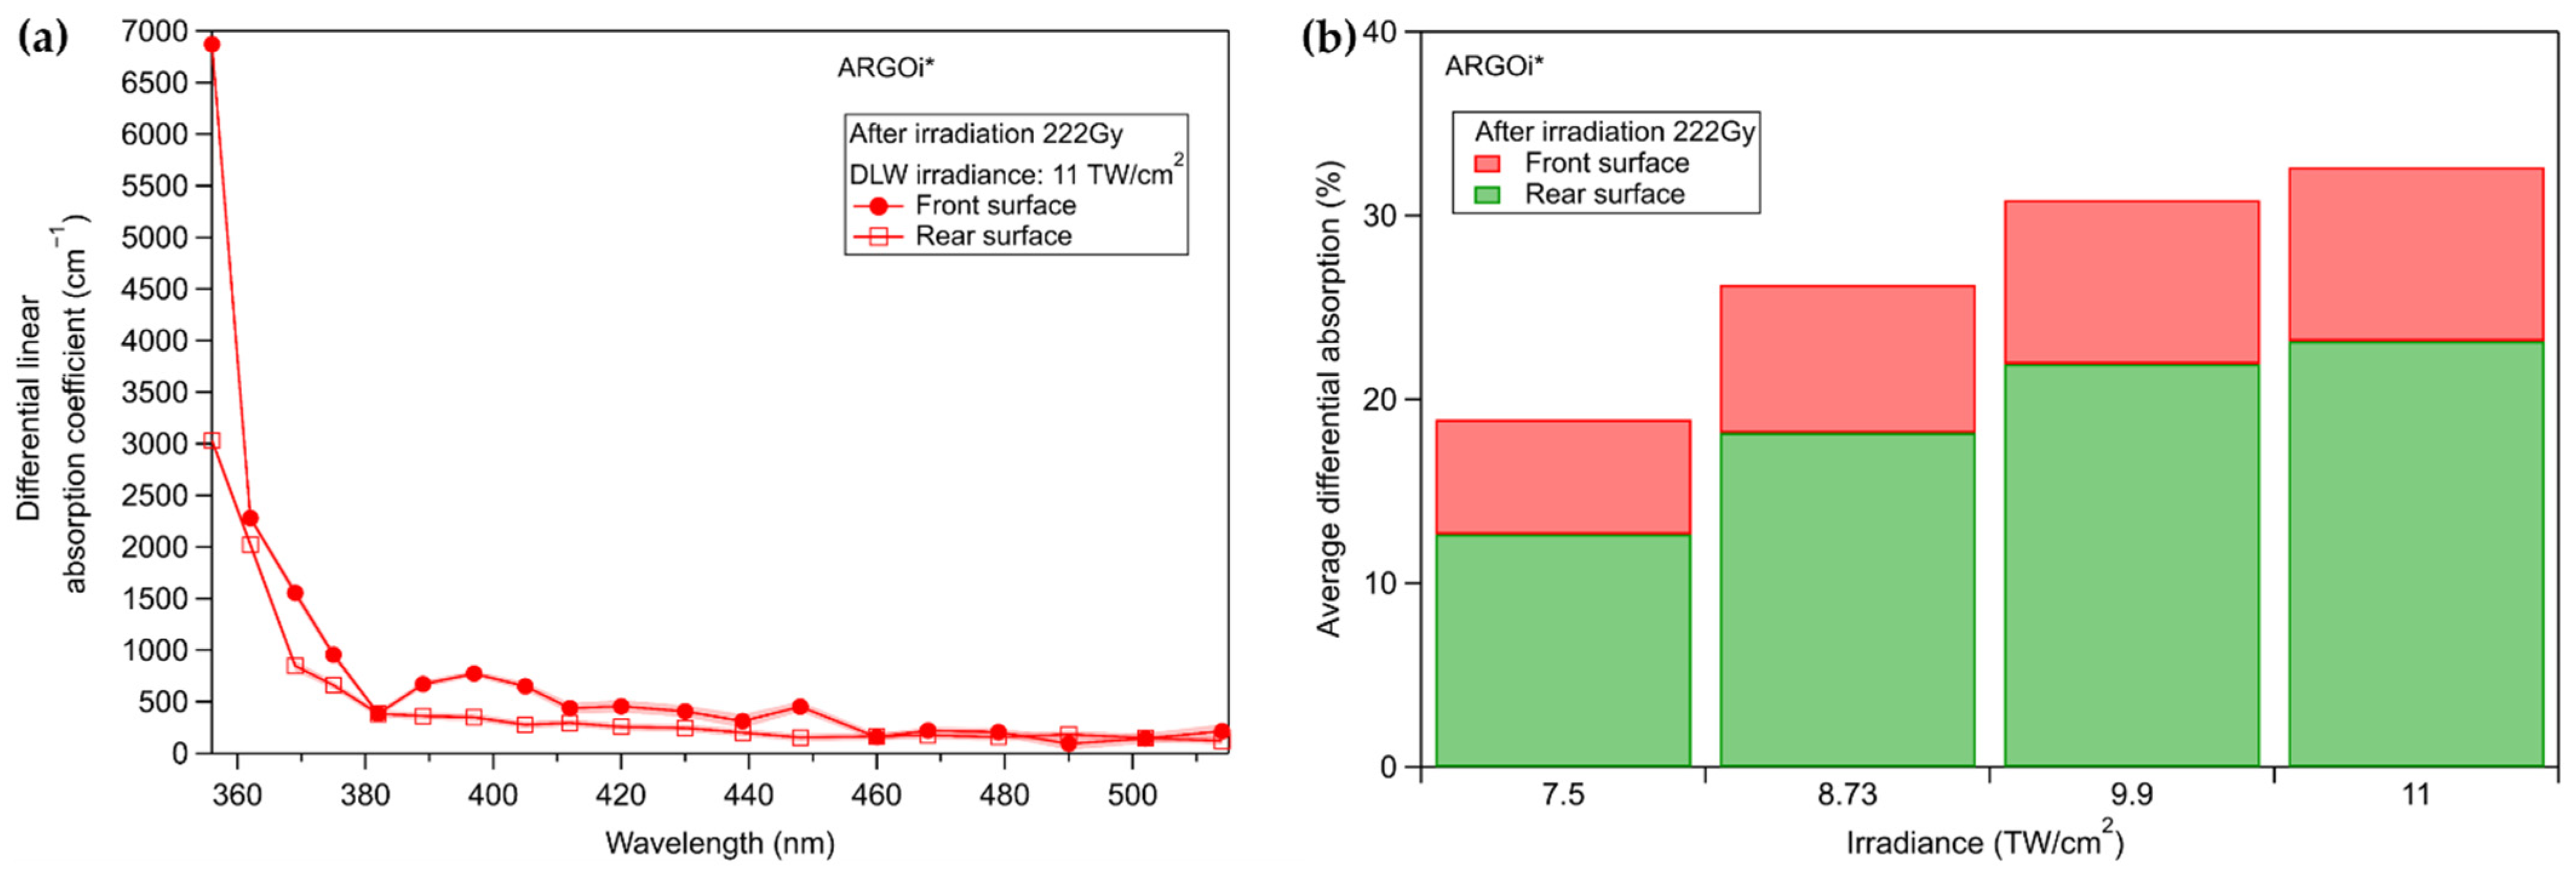
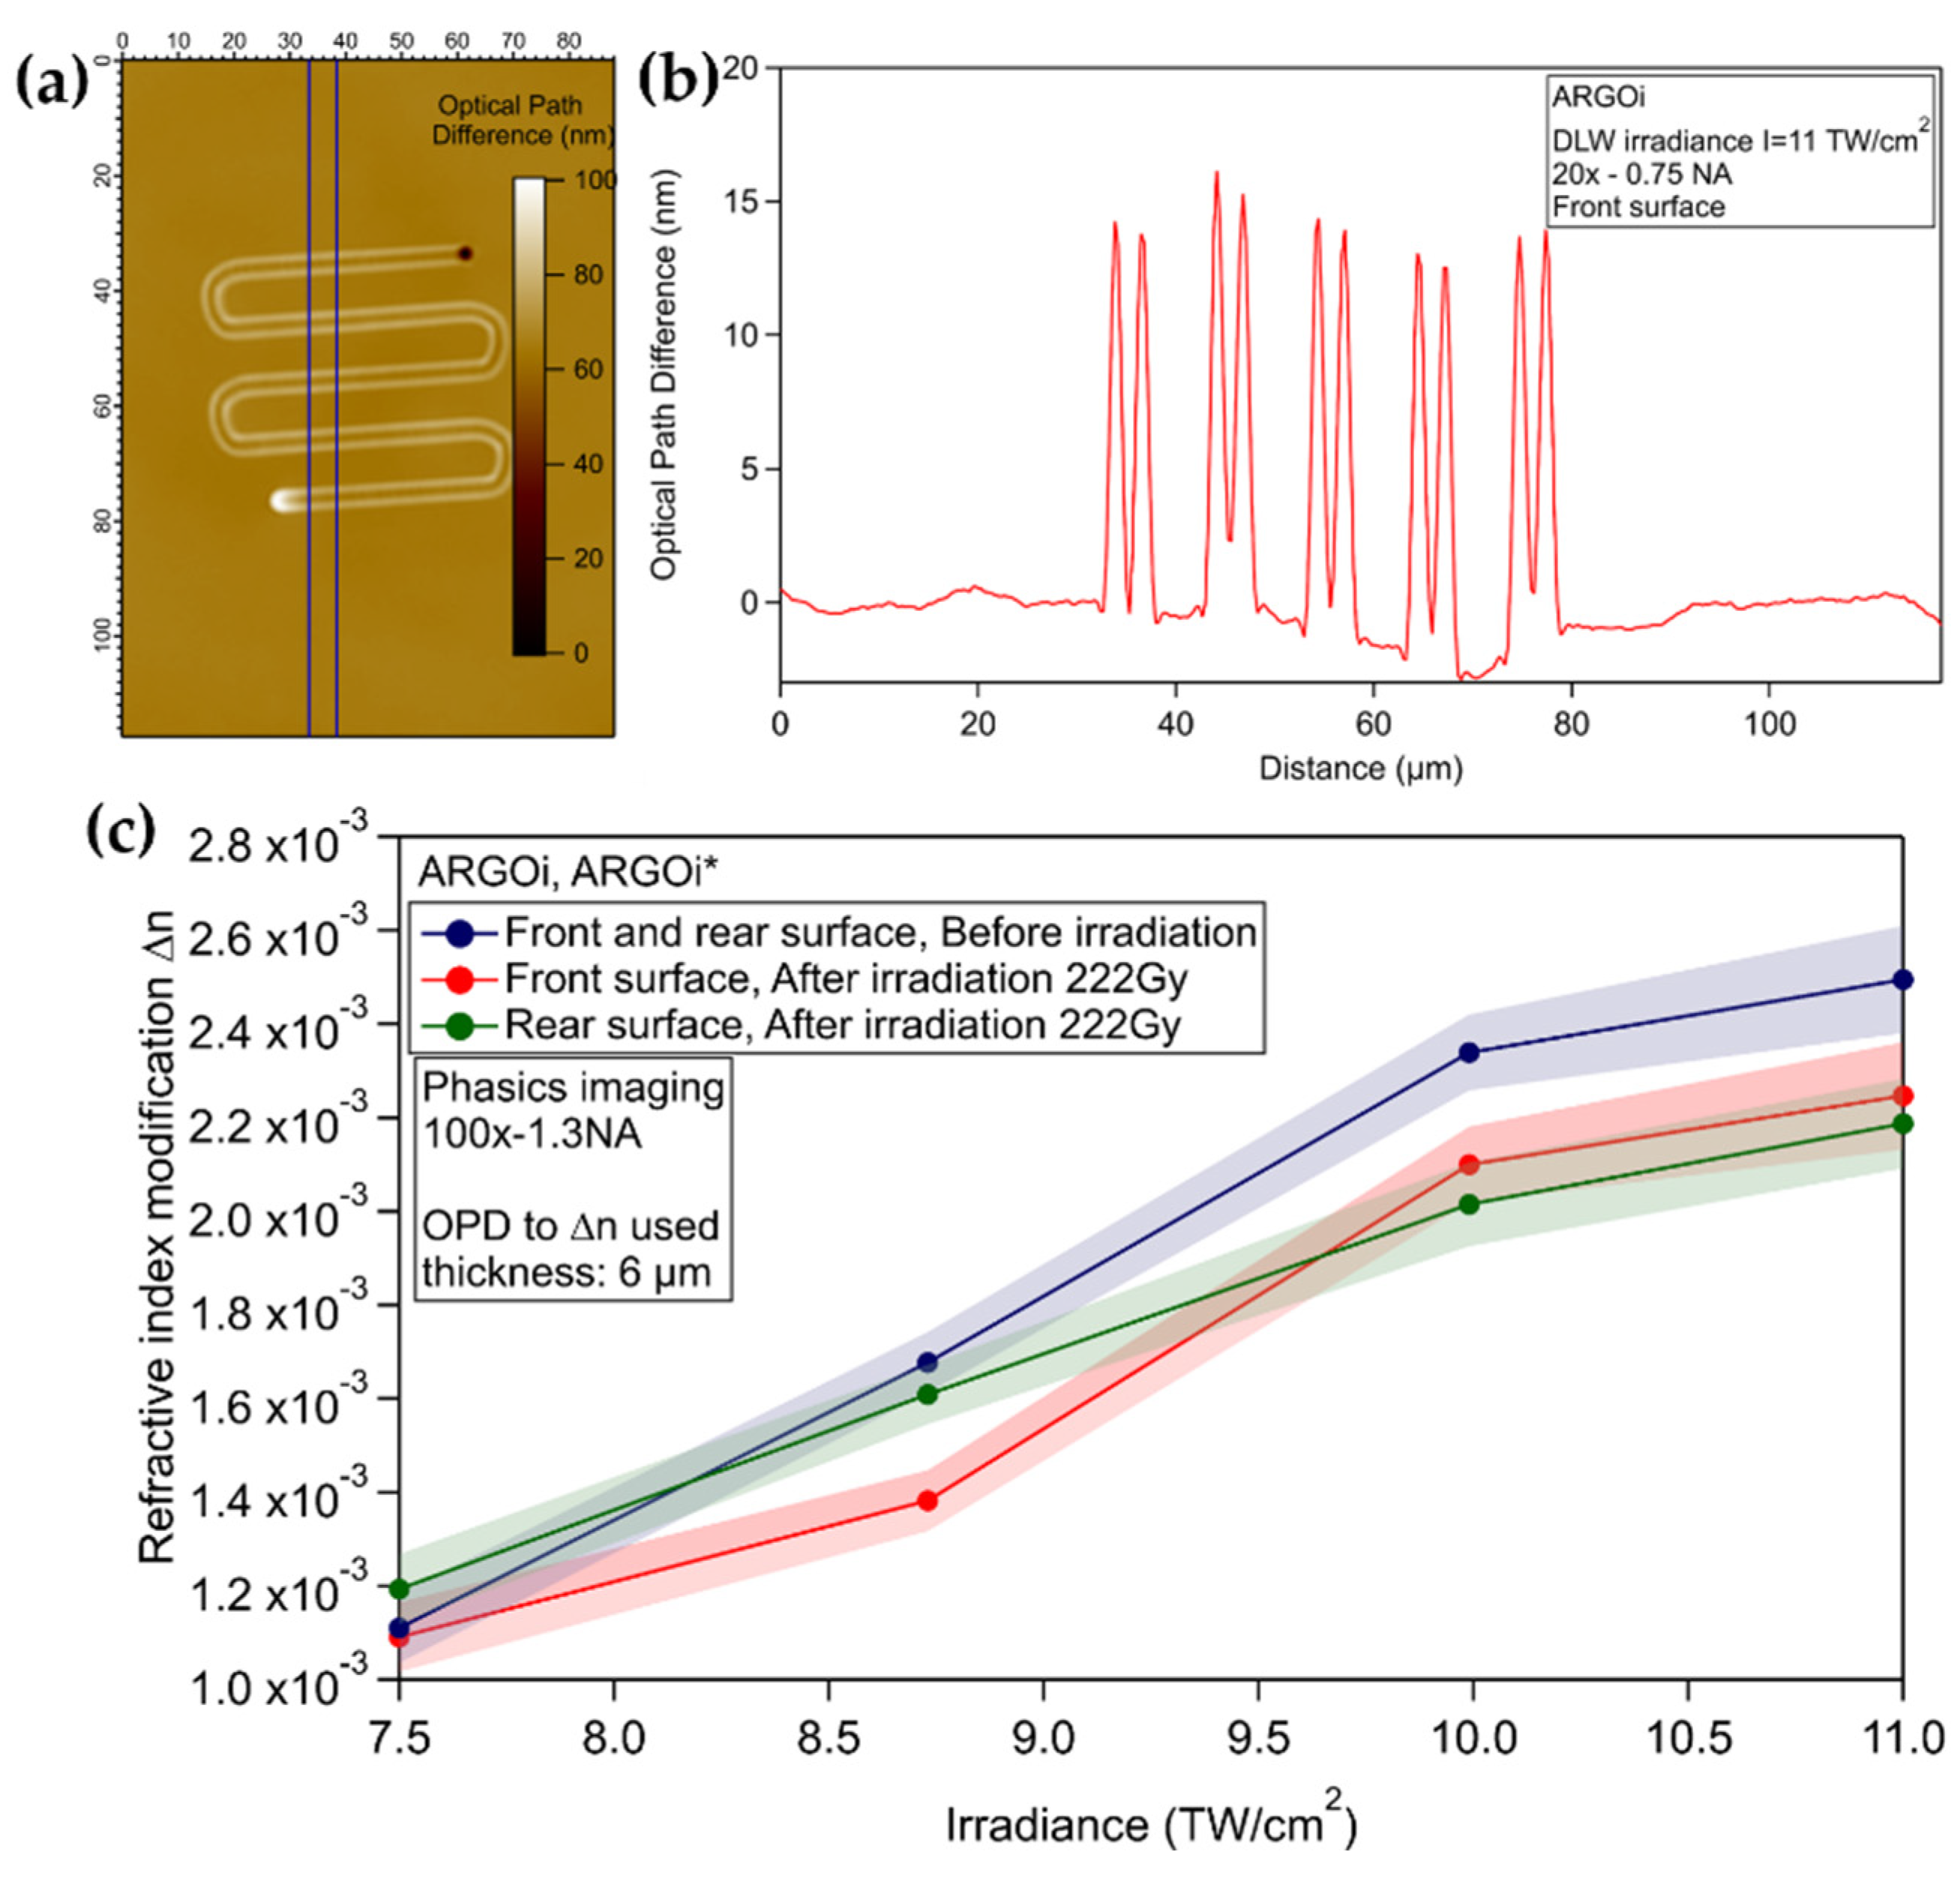
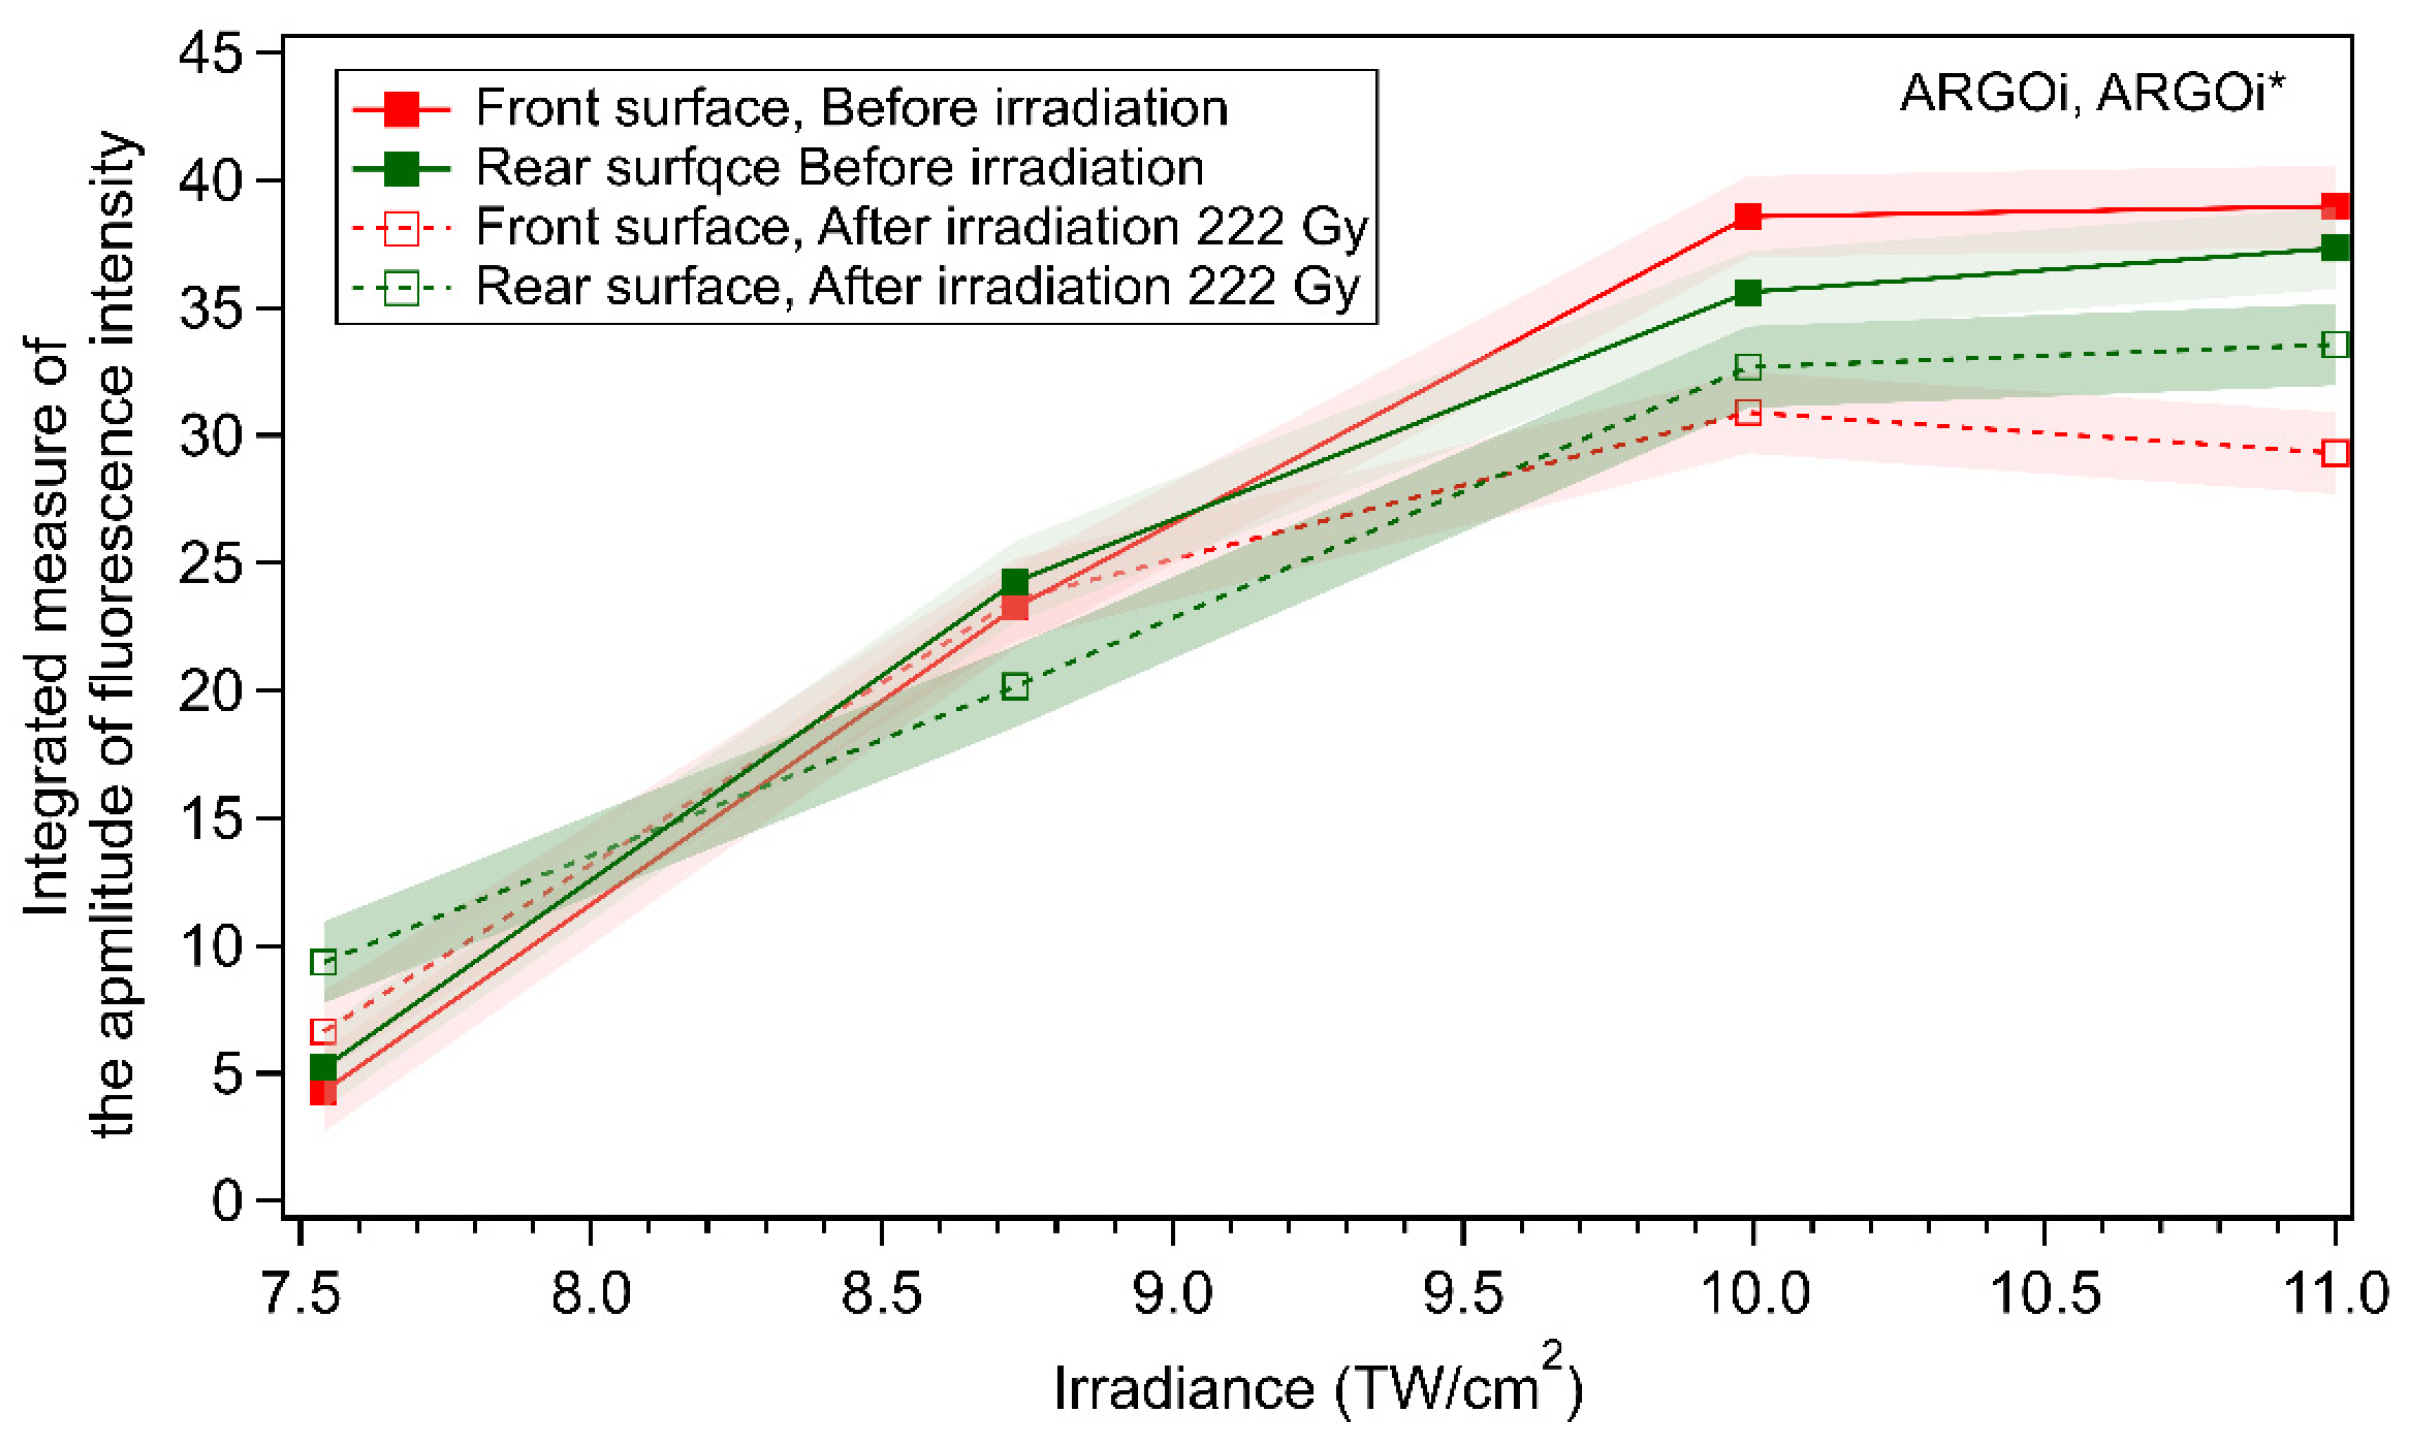
3.3.2. Commercial Argolight Glass (ARGOi)

Detailed experiments were conducted on the ARGOi and ARGOi* glass samples containing two inscribed surfaces of silver clusters.
First, the normalized photoluminescence spectra, on each pristine and irradiated glass (222 Gy), have been performed for excitation at 325 nm, as presented in Figure 8a for a depth of around 150 µm below the surface. This device does not give access to the spatial sampling in depth. This experiment has been also carried out on the fs laser-inscribed structures at the highest irradiance (11 TW/cm2) before and after 222 Gy of X-ray irradiation for the two planes (Figure 8b,c). In this case, the spatial resolution is related to the inscribed silver clusters. All the spectra in this experiment are not corrected by the spectral response of the instrumental chain of detection.
As shown in Figure 8a, the pristine glass presents no fluorescence signal in comparison to the one irradiated at 222 Gy. The emission intensity profile after 222 Gy exhibits an emission band with a maximum at 525 nm with shoulders at about 420 nm and 620 nm. According to the absorption bands and the emission spectra of the X-ray irradiated glass, the 620 nm emission band is related to the main absorption band at 326 nm of Ag2+ hole trap silver species. The 420 nm and 525 nm emissions are attributed to Agmx+ silver clusters [30,39]. Those bands were also observed here above in the GPN* glass, in Figure 4b from Section 3.1.
Figure 8b,c, conducted at the DLW structures, demonstrates that the main contribution is centered around 525 nm, with its lowest peak at around 420 nm for the two planes. When irradiating with 222 Gy X-ray dose, one observes that both planes act differently in terms of emission profiles. For the front surface, the 420 nm luminescence band decreases relatively by 13% due to the subsequent partial absorption of fluorescence emission in the blue range because of the absorption of the generated silver species after X-ray irradiation. It is noticeable that, for the rear surface, this band presents a greater relative decrease (about half of its original intensity) due to a larger glass thickness to propagate through before collection. The collected fluorescence in the region from 525 nm to 700 nm gradually increases in the front and the rear surfaces after 222 Gy X-ray dose. It corresponds to the additionally collected fluorescence emitted from the color centers Ag2+ in the sample thickness from the depth localization of the laser-inscribed silver clusters up to the surface. The photoluminescence of the pristine irradiated sample at 222 Gy, as shown in Figure 8a, demonstrates well that the red region (525–700 nm) corresponds to the generation of color centers in the irradiated glass sample. The spectrum of ARGOi* glass sample is several orders of magnitudes larger (×20) as compared to the one in ARGO* glass sample (see blue curves from Figure 8b,c compared to that of Figure 8a). One observes that the non-normalized spectra in the rear surface (not shown here) present a balance as a function of the dose in the silver clusters bands (420 and 525 nm) for the 0 and 2 Gy X-ray doses while the entire fluorescence spectra decrease after 22 and 222 Gy.
In order to quantify the difference between the fluorescence emission profiles from the rear-surface and front-surface laser-induced clusters after a 222 Gy irradiation, a calculated spectrum (black curves in Figure 8a,b) was obtained by estimating the attenuation of the DLW spectra (red curves in Figure 8a,b) due to absorption from defects created by the 222 Gy exposure. This attenuation estimation was calculated by:
I ˜ ARGOi * ( λ ) = I ARGOi ( λ ) e α 222 Gy ( λ ) L
where L is the glass thickness of the silver clusters localization, namely 150 µm for the front surface and 550 µm for the rear surface; α 222 Gy ( λ ) is the measured linear absorption spectrum after a 222 Gy X-ray dose from Figure 3a.
The difference in the 350–500 nm band between the experimental and calculated curves could be explained as follows: It was supposed that the linear absorption coefficient is averaged over the entire thickness of the two planes. As shown before, the linear absorption coefficient is depth-dependent, which means that the values measured over the 700 µm thickness (Figure 3a) cannot be the same in both planes at 150 µm or 550 µm depth. Note also that the emission of the fluorescence of the generated defects (blue curve in Figure 8a) was not taken into account in this calculated spectrum because the fluorescence cannot be quantified. This clarifies the difference in the red region (525–700 nm).
Micro-absorption measurements were performed in the two planes of the ARGOi* glass sample between a non-structured and a structured zone over a 100 × 100 μm2 surface, compared to a non-structured area. The local differential linear absorption coefficient of the laser-induced structures is reported in Figure 9a for the highest DLW irradiance structure for the two planes after 222 Gy X-ray irradiation. Other DLW irradiance structures were also investigated after 222 Gy (not shown here). The method of calculation is described in detail in Appendix B.
As for the measurements of Figure 9a (in the case of one single laser-induced structure created at 11 TW/cm2), the experimental spectra of the differential linear absorption coefficient are integrated over the optical frequency for all the DLW irradiance (Figure 9b). The proposed average differential transmission T for all these specific spectra is calculated with Equation (2):
T = ω 1 ω 2 e α ( ω ) H d ω ω 1 ω 2 d ω
where α is the measured local differential linear absorption coefficient for all the spectra (as from Figure 9a), H is the thickness of the laser-modified area that contains the silver clusters (6 µm estimation for the ARGOi glass), ω is the optical frequency corresponding the experimental wavelength sampling. The associated average differential absorption A is defined as A = 1 T , as shown in Figure 9b.
One can observe an increase of approximately 30% in the estimated average differential absorption of the clusters inscribed close to the front surface compared to that corresponding to the ones close to the rear surface. Such a 30% increase between the two silver cluster planes is approximately independent of the DLW irradiance. Due to the dose profile with depth (see Figure 6b), the deposited dose is locally larger in the plane of front-surface clusters compared to that in the plane of rear-surface clusters. Thus, the average absorption increase in the front-surface clusters is directly related to the larger deposited dose than that at the depth of the rear-surface clusters.
The refractive index variation Δ n between the pristine glass and the written structures was estimated using the wave front sensor (see Materials and Methods section) before and after X-ray irradiation for the two surfaces. Square structures of 50 µm × 50 µm with an interline spacing of 10 µm were inscribed with the same laser parameters in order to measure the refractive index modification. One example of a top view phase contrast image of the written structure at 11 TW/cm2 is shown in Figure 10a. Based on it, the OPD profile is plotted and correlated to the spatial distribution of the silver clusters showing two positive peaks for every laser passage (Figure 10b). Knowing the structures’ thickness (6 µm estimation for the ARGOi glass), the refractive index modification is calculated for the different laser-inscribed structures before and after X-rays for the two different planes (Figure 10c).
Our result shows that Δ n increases as a function of laser irradiance and that the formation of silver clusters is greater for higher irradiance, as previously reported [35,51]. The local refractive index modification slightly decreases quite similarly in the two irradiated planes after the 222 Gy X-ray dose.
In order to understand the phenomenon that happened after X-ray irradiation and to explain our results, the Clausius–Mossotti equation has been considered, defined as:
n ^ 2 1 n ^ 2 + 2 = N α 3
where N is the number of molecules per unit volume, α is here the mean polarizability of the silver clusters. The local refractive index of the laser-modified glass stands for n ^ = n g + Δ n ^ , where n g is the refractive index of the glass, Δ n ^ is the laser-induced complex index modification written as Δ n ^ = Δ n + i   Δ κ , with Δ n and Δ κ as its real and imaginary parts.
Since the pristine glass shows a slight refractive index decrease (Table 2) and additional absorption and emission bands (Figure 3a and Figure 8a) after an X-ray irradiation of 222 Gy, the environment of silver clusters was modified under X-ray irradiation. Equation (3) allows one to recognize the effect of the environment on the clusters’ refractive index modification Δ n ^ . Note that the measured Δ n corresponds to the measured quantity from the phase imaging technique, as shown in Figure 10c. The measured Δ κ is calculated using the average differential transmission from the micro-absorption experiment (Figure 9b), as follows: Δ κ = λ 4 π H l n ( T ) where T is the average differential transmission, H is the thickness of the laser-modified area that contains the silver clusters (6 µm estimation), λ is the wavelength (589 nm). Both measured values are later compared to the calculated ones using Equation (3).
First, the Clausius–Mossotti equation allows for the calculation of N α 3 before irradiation. The average differential absorption before irradiation was estimated to be 10% less than that in the rear surface. Then, the calculation of both parts of Δ n ^ after irradiation took into account the refractive index of the irradiated glass (Table 1). We considered a decrease in the initial value of N α 3 by 0.48% in order to adjust the calculated and measured values. It was supposed that the polarizability α of the silver clusters had not changed after irradiation. The comparison between the calculated and measured Δ n ^   is depicted in Figure 11 for the two planes.
In the front surface (Figure 11a), the calculated real part of the local refractive index modification superposed well with the measured one when N α 3 weakly decreases by 0.48%. A difference is observed in Figure 11b, as the imaginary part Δ κ measured is higher than the calculated one in the front surface. In the rear surface (Figure 11c,d), the calculated real and imaginary parts of the local refractive index modifications closely match with the measured one. One can notice that the decrease in N α 3 by 0.48% after irradiation is negligeable compared to the decrease in the local refractive index modification (approximately 12% after irradiation in Figure 10c). This underlines that the Δ n decrease after irradiation seen in the phase imaging technique is attributed to the modification of the cluster’s environment due to the creation of colored centers, i.e., the variation of the ambient polarizability of the irradiated matrix. The two curves comparing the imaginary parts of the front surface in Figure 11b show a significant difference: achieving their matching would require a much larger increase in N α 3 , by approximately 30% (instead of a decrease of 0.48%). This suggests additional absorption in the front-surface structures during the 222 Gy irradiation, resulting from the creation of additional silver clusters in the front surface.
The integrated measure of the amplitude of fluorescence intensity was performed for the different structures of the two surfaces before and after the 222 Gy X-ray dose for an excitation at 365 nm (Figure 12). Fluorescence images were obtained using an Olympus fluorescence microscope BX53 with a LUCPlanFLN objective of 60 × , 0.70 NA. The excitation light passes through the glass sample to reach the silver clusters of each surface, and the emitted light is epi-collected from the same facet. The rear surface was measured by turning the glass in order to have the same excitation reaching the structures. This shows that the fluorescence intensity of the two planes before irradiation is approximately the same, within the measurement error bars.
The fluorescence intensity of the clusters decreases after X-ray irradiation in the two planes. After irradiation, the front surface presents less fluorescence emission than the rear one due to having less excitation available for the clusters of the front surface compared to those in the rear one. Indeed, the front surface has been submitted to a larger X-ray dose deposition than the rear one. The creation of a large number of color centers in the front surface attenuates the excitation light at 365 nm as well as the emitted light while passing through the same thickness to reach the surface. Oppositely, greater fluorescence excitation is available for the irradiated clusters of the rear surface, because such a 365 nm excitation is less absorbed thanks to the smaller amount of color centers generated by the X-rays. Moreover, the emitted light of those clusters is even less absorbed while passing through the same thickness. Note that these generated color centers are stable at room temperature.
As demonstrated before, it is possible that additional silver clusters were generated in the front surface by X-rays (from Figure 11b). However, evidence that that their fluorescence increases owing to the domination of the absorption phenomenon it is not visible in this graph (Figure 3a).
Fluorescence lifetime imaging microscopy results using the Fast FLIM algorithm are shown in Figure 13 in order to evaluate the effect of the X-rays on the cluster emission. Such an experiment does not allow for collecting longer lifetimes, namely those attributed to silver hole center in the microsecond range.
As shown in Figure 13c, the fluorescence lifetime was evaluated with a triple exponential decay model in the ns range. The luminescence decays were normalized and shifted in axis for better vision. However, it is not attempted thereby to attribute each component to a precise population of emitters. Based on the fittings, the three fluorescence lifetimes for all laser-inscribed structures do not change before and after irradiation for the two planes for an emission at 425 nm as well as for an emission at 510 nm. The variation remains well below the accuracy of the measurement. Their associated amplitudes are also stable when comparing before and after X-rays. From the analysis of the fluorescence decays for all DLW irradiances, before and after irradiation, lifetimes and associated amplitudes average values with their standard deviations were derived and reported in Table 4. The peak intensities were between 6.6 × 10³ and 1.5 × 10⁴; the average chi2 was 1.05 with a standard deviation of 0.05.
It was clearly observed that the fluorescence lifetime was not correlated to irradiation with a 222 Gy X-ray dose, independent of the penetration depth and DLW irradiance; their distribution is also approximately constant. It demonstrates that the nature of silver clusters is invariable and resilient to X-ray irradiation at the investigated dose levels. The absence of substantial change in the decays indicates that neither conversion of silver clusters into a species of a different lifetime, nor did the generation of acceptors for the energy transfer from the excited silver clusters occur upon irradiation.

3.4. Inscribed Glasses with Silver Clusters for Application to X-ray Dosimetry

Working on the luminescence spectra for excitation at 355 or 325 nm of the inscribed-silver clusters and/or the color centers created after irradiation, an amplitude ratio of those bands for GPNi* and ARGOi* glasses can provide information regarding the dosimetry performances of those glasses.
The RPL spectra of the GPNi* glass sample (for DLW irradiance of 13.4 TW/cm2 at 160 µm below the glass surface; from Figure (7)) [39] could be systematically decomposed in three Gaussian emission bands with fixed widths and positions while the related amplitudes (associated to silver clusters and hole traps) were evolving with the dose. ARGOi and ARGOi* glass samples were also studied. A deconvolution with two Gaussian bands was realized for the non-normalized RPL spectra in the rear surface (for DLW irradiance of 11 TW/cm2 at 550 µm below the glass surface).
By evaluating the dose-dependent evolution of the amplitude ratio of hole traps versus that of silver clusters in the GPNi* glass sample (Figure 14a), a linear response is obtained, exhibiting a slope of sensibility ~0.005/Gy over the 2–357 Gy range. The precision of the dose sensitivity in this glass was estimated at 7% error for a 1 mm sample thickness in the dose range of 2 to 357 Gy. This precision can change depending on the depth of the silver cluster and thus on the material thickness crossed by X-ray irradiation. Concerning the ARGOi and ARGOi* glass sample, the dose-dependent evolution of the amplitude ratio of the two silver clusters bands (525 nm vs. 420 nm) presents a highly nonlinear response in the dose range 0–222 Gy. A saturation starts to occur from the 2 Gy X-ray dose (Figure 14b). Oppositely, a highly-varying evolution could be achieved with X-ray doses less than 2 Gy for this glass sample in the rear surface. It is not evident to have a dosimetry behavior in this dose range (2 to 222 Gy) using this glass sample. However, the ARGOi* glass sample presents a very strong dynamic for X-ray doses of less than 2 Gy, having a slope sensibility ~1/Gy over 0–2 Gy, which could be of interest to high-sensitivity dosimeter in this range [10].

3.5. Discussion

In the present work, the generation of silver species has been investigated in two types of silver-containing phosphate glasses exposed to X-ray irradiation, which includes the formation of Ag2+ hole traps silver ions and Agmx+ silver clusters. These silver species have shown a depth dependence in direct relation to the local X-ray deposited dose. Subsequently, several optical properties of the glass matrix are affected, such as the creation of radiation-induced absorption and emission bands, as well as a small decrease in the glass refractive index. Moreover, laser-inscribed fluorescent silver clusters have been validated previously to be thermally stable in silver-containing phosphate glasses [28,30,37,38] and subsistent to X-ray irradiation in the GPNi* glass sample [39]. This gives an opportunity to the laser-inscribed structures to be considered as local probes of the deposited X-ray dose. In this framework, identical silver clusters inscribed at two different depths have been investigated in ARGO glass sample before/after X-ray exposure. The generation of color centers in the irradiated matrix has several effects on the spectroscopic properties of the laser-inscribed silver clusters. In fact, these color centers modify the glass environment of the silver clusters, which in turn impacts the observation of the silver clusters’ optical properties. Indeed, the indirect changes in the fluorescence spectra, the fluorescence intensity, the modification of the refractive index of the silver clusters after X-rays are interpreted as resulting from the glass environment modifications more than the direct modification of the silver clusters themselves. Furthermore, the stability of the fluorescence lifetime of the irradiated laser-inscribed silver clusters, as well as their associated amplitudes, show their resilience to X-rays in both depths at the considered doses. However, additional X-ray-induced silver clusters may occur depending on the dose deposition, as shown with the micro-absorption measurements at the front surface of laser-inscribed clusters. This ensemble of experiments highlights the resilience of laser-induced silver clusters, with these species acting as local probes of the depth-dependent deposited doses.

4. Conclusions and Perspectives

This work has investigated the impact of X-rays in pristine and pre-inscribed silver-containing phosphate glasses for both compositions. We demonstrated the resilience of identical silver clusters inscribed in two depth localizations to X-rays at the deposited dose levels. The rear surface seems to have more reliable conditions to the investigated X-ray dose, taking into account the depth-dependent deposition of the dose in relationship with the X-ray energy spectrum. Information on the dosimetry performances of those glasses was achieved using the fluorescence amplitude ratio of the bands corresponding to color centers and/or inscribed-silver clusters. Indeed, laser-induced silver clusters can be used as local probes of the depth-dependent deposited doses. With these local probes, it is possible to adapt the dynamic and the linearity zone of the detector at differentiated dose ranges, giving the interest of spatially-resolved dosimeter.
While GPNi* showed good linearity in its sensing behavior over the 2–357 Gy range, the ARGOi* glass sample tendeded to have a higher sensitivity for X-ray doses (especially for doses range < 2 Gy). On the basis of the results presented, this approach could be further extended to combine laser inscription in photosensitive meter-scale fibers for the purpose of integrated dosimeters showing spatially-distribution sensitivity. By extrapolating the behavior of the ARGOi* glass sample, one may expect an accessible dosimeter response for 0–2 mGy using a 0.55 m of fiber, or even a 20 µGy scale being reached with 55 m of fiber. Concerning the GPNi*, a fiber of 0.16 m or 160 m length could be considered to show a linear dosimeter behavior in the 2–356 mGy or 2–356 µGy scale, respectively. Moreover, real-time fluorescence study after X-ray irradiation could be realized under/without UV excitation.

Author Contributions

Conceptualization, J.H., Y.P. and L.C.; methodology, J.H., T.G., A.M. (Adriana Morana), G.R., Y.O., A.B., S.G., T.C., Y.P. and L.C.; simulation, A.M. (Arnaud Meyer); formal analysis and investigation, J.H., A.M. (Adriana Morana), G.R., A.D.G., Y.O., A.B., S.G., T.C., Y.P. and L.C.; writing—original draft preparation, J.H.; writing—review and editing, All authors; supervision, Y.P., L.C. All authors have read and agreed to the published version of the manuscript.

Funding

This research was funded by French National Research Agency (ANR) [Grant: ANR-19-CE08-0021] and Region Nouvelle Aquitaine [Grant: APPR2020-2019-8193110] and from European Union’s Horizon 2020 research & innovation program under the Marie Skłodowska-Curie grant agreement No 823941 and Université de Bordeaux, GPR light.

Data Availability Statement

Data possibly available on demand to the corresponding author.

Conflicts of Interest

The authors declare no conflict of interest.

Appendix A. Calculation of the Estimated Depth-Dependent Profiles in Absolute Values of the Linear Absorption Coefficient at 405 nm

From Figure 4a, a differential equation of the intensity is used, having a depth-dependent linear absorption coefficient.
Δ I Δ Z = α e s t i m a t e d ( z ) I ( z )
where α e s t i m a t e d ( z ) is the estimated depth-dependent absorption coefficient at 405 nm.
α e s t i m a t e d ( z ) = c A ( z )
where A ( z ) is the amplitude of the local absorption coefficient profile proportional to the fluorescence intensity profile (Figure 4a) using an exponential fitting equation and c is a proportionality constant.
The proportionality constant c is adjusted by hand in order to have the same value between the effective absorption coefficient measured thanks to the UV/VIS transmission spectroscopy of the irradiated sample at 405 nm (Figure 3c) and the calculated one by integration of Equation (A1). The calculated effective absorption coefficient is given by:
α e f f e c t i v e , c a l c u l a t e d = 1 L ln ( I ( z ) I ( 0 ) )
where I ( 0 ) and I ( z ) is the result (from Equation (A1)) of the integrated equation for the initial intensity and for that at a corresponding depth, respectively; L is the thickness of the glass sample (1 mm).
Once c is adjusted, Equation (A2) allows to trace the estimated depth-dependent profiles of the linear absorption coefficient at 405 nm, as shown in Figure 5.

Appendix B. Calculation of the Local Differential Linear Absorption Coefficient

From Lambert–Beer equation, the intensity of the excitation source is given by:
I 1 ( λ ) = I 0 ( λ ) e α ( λ ) H
where I 0 ( λ ) is the initial intensity of the incident laser beam corresponding to the experimental wavelength sampling, H is the thickness of the laser-modified area that contains the silver clusters (given in cm), α ( λ ) is the local differential linear absorption coefficient (given in cm−1).
The local differential linear absorption coefficient α ( λ ) is thus calculated using Equation (A5):
α ( λ ) = 1 H l n ( I 1 ( λ ) I 0 ( λ ) )
where the intensities are calculated using the transmitted power as follows:
P R = S I 0   is the reference transmitted power and P A = S A I 1 + S A ¯ I 0   is absorbed transmitted power, where S is the total surface of the scanning beam; at the laser-inscribed structures, one can separate this scanning beam as S = S a + S a ¯ with S a the absorbing surface of the laser-inscribed structure and   S a ¯ the complementary non-absorbing surface of these structures.
This calculation takes into account the filling rate of the inscribed structure. Each laser pass is characterized by two lines, each having a thickness of approximately 400 nm, which corresponds to the absorbing surface. The interline between each laser pass for our structures is 5 µm. Thus, the filling rate of the structures is the fraction between the absorbed and the total surface for each laser passage, equal to τ = 0.8 5 = 0.16 . Using the oscilloscope, the power is measured in voltage in direct and alternative current. The alternative current, A C , is the comparison between two modulated signals: a scan between an inscribed zone and a non-inscribed zone compared to that in a non-inscribed zone. The reference and attenuated powers are respectively calculated by P R = D C + A C 2 and P A = D C A C 2 .

References

  1. Schulman, J.H.; Ginther, R.J.; Klick, C.C.; Alger, R.S.; Levy, R.A. Dosimetry of X-rays and Gamma-rays by Radiophotoluminescence. J. Appl. Phys. 1951, 22, 1479–1487. [Google Scholar] [CrossRef]
  2. Schulman, J.H.; Shurcliff, W.; Ginther, R.J.; Attix, F.H. Radiophotoluminescence dosimetry system of the U.S. NAVY Radiophotoluminescence Dosimetry System of the U.S. Nucleon (U.S.) Ceased Publ. 1953, 5, 10. [Google Scholar]
  3. Piesch, E.; Burgkhardt, B. Photoluminescence Dosimetry: The Alternative in Personnel Monitoring. Radioprotection 1994, 29, 39–67. [Google Scholar] [CrossRef] [Green Version]
  4. Piesch, E.; Burgkhardt, B. One-Element Phosphate Glass Dosimetry Systems for the Simultaneous Indication of Different Dose Quantities in Individual and Area Dosimetry. Radioprotection 1986, 17, 63–66. [Google Scholar] [CrossRef]
  5. Perry, J.A. RPL Dosimetry. Radiophotoluminescence in Health Physics. In Medical Science Series; Adam Hilger: Bristol, UK, 1987; Volume 19. [Google Scholar]
  6. Yamamoto, T. RPL Dosimetry: Principles and Applications. In AIP Conference Proceedings; American Institute of Physics: College Park, MD, USA, 2011; Volume 1345, pp. 217–230. [Google Scholar] [CrossRef]
  7. Kodaira, S.; Yanagida, Y.; Kawashima, H.; Kitamua, H.; Kurani, M.; Ogura, K. Note: Complementary Approach for Radiation Dosimetry with Ag+-Activated Phosphate Glass. Rev. Sci. Instrum. 2018, 89, 1–3. [Google Scholar] [CrossRef]
  8. McKeever, S.W.W.; Sholom, S.; Shrestha, N.; Klein, D.M. An In-Situ, Fiber-Optic System for Sub-Surface, Environmental Dose Measurements Using Radiophotoluminescence from Ag-Doped Alkali-Phosphate Glass. Radiat. Meas. 2020, 132, R713–R715. [Google Scholar] [CrossRef]
  9. Miyamoto, Y.; Takei, Y.; Nanto, H.; Kurobori, T.; Konnai., A.; Yanagida., T.; Yoshikawa., A.; Shimotsuma, Y.; Sakakura, M.; Miura, K.; et al. Radiophotoluminescence from Silver-Doped Phosphate Glass. Radiat. Meas. 2011, 46, 1480–1483. [Google Scholar] [CrossRef]
  10. Kurobori, T. Performance Characterisation of a Real-Time Fiber Dosimetry System Using Radiophotoluminescent Glasses. Jpn. J. Appl. Phys. 2018, 57, 1–7. [Google Scholar] [CrossRef]
  11. McKeever, S.W.W.; Sholom, S.; Shrestha, N.; Klein, D.M. Build-up of Radiophotoluminescence (RPL) in Ag-Doped Phosphate Glass in Real-Time Both during and after Exposure to Ionizing Radiation: A Proposed Model. Radiat. Meas. 2020, 132, 106246. [Google Scholar] [CrossRef]
  12. Hsu, S.M.; Yeh, S.H.; Lin, M.S.; Chen, W.L. Comparison on Characteristics of Radiophotoluminescent Glass Dosemeters and Thermoluminescent Dosemeters. Radiat. Prot. Dosim. 2006, 119, 327–331. [Google Scholar] [CrossRef]
  13. Ihara, Y.; Kishi, A.; Kada, W.; Sato, F.; Kato, Y.; Yamamoto, T.; Iida, T. Acompact System for Measurement of Radiophotoluminescence of Phosphate Glass Dosimeter. Radiat. Meas. 2008, 43, 542–545. [Google Scholar] [CrossRef]
  14. Ranogajek-Komor, M. Ranogajec-Komor, M. Passive solid state dosimeters in environmental monitoring. In New Techniques for the Detection of Nuclear and Radioactive Agents; Aycik, G.A., Ed.; Springer: Dordrecht, The Netherlands, 2009. [Google Scholar]
  15. Bourhis, K.; Royon, A.; Papon, G.; Bellec, M.; Petit, Y.; Canioni, L.; Dussauze, M.; Rodriguez, V.; Binet, L.; Caurant, D.; et al. Formation and Thermo-Assisted Stabilization of Luminescent Silver Clusters in Photosensitive Glasses. Mater. Res. Bull. 2013, 48, 1637–1644. [Google Scholar] [CrossRef] [Green Version]
  16. Kurobori, T.; Zheng, W.; Miyamoto, Y.; Nanto, H.; Yamamoto, T. The Role of Silver in the Radiophotoluminescent Properties in Silver-Activated Phosphate Glass and Sodium Chloride Crystal. Opt. Mater. 2010, 32, 1231–1236. [Google Scholar] [CrossRef] [Green Version]
  17. Kurobori, T.; Zheng, W.; Zhao, C. Silver-Activated Radiophotoluminescent Glass: Band Assignments and a Novel Readout System Using a Modulated UV Laser Diode. IOP Conf. Ser. Mater. Sci. Eng. 2010, 15, 1–8. [Google Scholar] [CrossRef]
  18. McKeever, S.W.W.; Sholom, S.; Shrestha, N. Observations Regarding the Build-up Effect in Radiophotoluminescence of Silver-Doped Phosphate Glasses. Radiat. Meas. 2019, 123, 13–20. [Google Scholar] [CrossRef]
  19. Dmitryuk, A.V.; Paramzina, S.E.; Perminov, A.S.; Solov’eva, N.D.; Timofeev, N.T. The Influence of Glass Composition on the Properties of Silver-Doped Radiophotoluminescent Phosphate Glasses. J. Non-Cryst. Solids 1996, 202, 173–177. [Google Scholar] [CrossRef]
  20. Yokota, R.; Imagawa, H. Radiophotoluminescent Centers in Silver-Activated Phosphate Glass. J. Phys. Soc. Jpn. 1966, 23, 1038–1048. [Google Scholar] [CrossRef]
  21. Miyamoto, Y.; Yamamoto, T.; Kinoshita, K.; Koyama, S.; Takei, Y.; Nanto, H.; Shimotsuma, Y.; Sakakura, M.; Miura, K.; Hirao, K. Emission mechanism of radiophotoluminescence in Ag-doped phosphate glass. Radiat. Meas. 2010, 45, 546–549. [Google Scholar] [CrossRef]
  22. Zheng, W.; Kurobori, T. Assignments and Optical Properties of X-ray-Induced Colour Centres in Blue and Orange Radiophotoluminescent Silver-Activated Glasses. J. Lumin. 2011, 131, 36–40. [Google Scholar] [CrossRef] [Green Version]
  23. Maki, D.; Nagai, T.; Sato, F.; Kato, Y.; Iida, T. Microscopic Dose Measurement with Thin Radiophotoluminescence Glass Plate. Radiat. Meas. 2011, 46, 1543–1546. [Google Scholar] [CrossRef]
  24. Maurel, C.; Cardinal, T.; Canioni, L.; Treguer, M.; Videau, J.J.; Choi, J.; Richardson, M. Luminescence Properties of Silver Zinc Phosphate Glasses Following Different Irradiations. J. Lumin. 2009, 129, 1514–1518. [Google Scholar] [CrossRef]
  25. Kurobori, T.; Itoi, H.; Yanagida, T.; Chen, Y.Q. Time Resolved Dose Evaluation in an X-and Gamma-ray-Irradiated Silver-Activated Glass Detector for Three-Dimensional Imaging Applications. Nucl. Instrum. Methods Phys. Res. A 2015, 793, 6–11. [Google Scholar] [CrossRef] [Green Version]
  26. Miyamoto, Y.; Ohno, T.; Takei, Y.; Nanto, H.; Kurobori, T.; Yanagida, T.; Yoshikawa, A.; Nagashima, Y.; Yamamoto, T. Optical properties in Ag+ Doped Phosphate Glass Irradiated with X-rays and α particles. Radiat. Meas. 2013, 55, 72–74. [Google Scholar] [CrossRef]
  27. Marquestaut, N.; Petit, Y.; Royon, A.; Mounaix, P.; Cardinal, T.; Canioni, L. Three-Dimensional Silver Nanoparticle Formation Using Femtosecond Laser Irradiation in Phosphate Glasses: Analogy with Photography. Adv. Funct. Mater. 2014, 24, 5824–5832. [Google Scholar] [CrossRef] [Green Version]
  28. Bellec, M.; Royon, A.; Bousquet, B.; Bourhis, K.; Treguer, M.; Cardinal, T.; Richardson, M.; Canioni, L. Beat the Diffraction Limit in 3D Direct Laser Writing in Photosensitive Glass. Opt. Express 2009, 17, 10305. [Google Scholar] [CrossRef]
  29. Abou Khalil, A. Direct Laser Writing of a New Type of Optical Waveguides and Components in Silver Containing Glasses. Ph.D. Thesis, Bordeaux University, Bordeaux, France, 2018. [Google Scholar]
  30. Bellec, M.; Royon, A.; Bourhis, K.; Choi, J.; Bousquet, B.; Treguer, M.; Cardinal, T.; Videau, J.J.; Richardson, M.; Canioni, L. 3D Patterning at the Nanoscale of Fluorescent Emitters in Glass. J. Phys. Chem. C 2010, 114, 15584–15588. [Google Scholar] [CrossRef]
  31. De Cremer, G.; Coutino-Gonzalez, E.; Roeffaers, M.B.J.; De Vos, D.E.; Hofkens, J.; Vosch, T.; Sels, B.F. In Situ Observation of the Emission Characteristics of Zeolite-Hosted Silver Species During Heat Treatment. Chem. Phys. Chem. 2010, 11, 1627–1631. [Google Scholar] [CrossRef]
  32. De Cremer, G.; Coutino-Gonzalez, E.; Roeffaers, M.B.J.; Moens, B.; Ollevier, J.; Vander Auweraer, M.; Schoonheydt, R.; Jacobs, P.A.; De Schryver, F.C.; Hofkens, J.; et al. Characterization of Fluorescence in Heat-Treated Silver-Exchanged Zeolites. Chem. Soc. 2009, 131, 3049–3056. [Google Scholar] [CrossRef]
  33. Velázquez, J.J.; Tikhomirov, V.K.; Chibotaru, L.F.; Cuong, N.T.; Kuznetsov, A.S.; Rodríguez, V.D.; Nguyen, M.T.; Moshchalkov, V.V. Energy Level Diagram and Kinetics of Luminescence of Ag Nanoclusters Dispersed in a Glass Host. Opt. Express 2012, 20, 13582–13591. [Google Scholar] [CrossRef]
  34. Abou Khalil, A.; Lalanne, P.; Bérubé, J.P.; Petit, Y.; Vallée, R.; Canioni, L. Femtosecond Laser Writing of Near-Surface Waveguides for Refractive-Index Sensing. Opt. Express 2019, 27, 31130–31143. [Google Scholar] [CrossRef]
  35. Abou Khalil, A.; Bérubé, J.P.; Danto, S.; Desmoulin, J.C.; Cardinal, T.; Petit, Y.; Vallée, R.; Canioni, L. Direct Laser Writing of a New Type of Waveguides in Silver Containing Glasses. Sci. Rep. 2017, 7, 11124. [Google Scholar] [CrossRef] [PubMed] [Green Version]
  36. Petit, Y.; Danto, S.; Guérineau, T.; Abou Khalil, A.; Le Camus, A.; Fargin, E.; Duchateau, G.; Bérubé, J.P.; Vallée, R.; Messaddeq, Y.; et al. On the Femtosecond Laser-Induced Photochemistry in Silver-Containing Oxide Glasses: Mechanisms, Related Optical and Physico-Chemical Properties, and Technological Applications. Adv. Opt. Technol. 2018, 7, 291–309. [Google Scholar] [CrossRef] [Green Version]
  37. Gautier, P. Nanostructuration des Propriétés Optiques Linéaires et Non-Linéaires d’Un Verre Photosensible Par Laser Femtoseconde. Ph.D. Thesis, Bordeaux University, Bordeaux, France, 2012. [Google Scholar]
  38. Royon, A.; Bourhis, K.; Béchou, L.; Cardinal, T.; Canioni, L.; Deshayes, Y. Durability Study of a Fluorescent Optical Memory in Glass Studied by Luminescence Spectroscopy. Microelectron. Reliab. 2013, 53, 1514–1518. [Google Scholar] [CrossRef] [Green Version]
  39. Guérineau, T.; Cova, F.; Petit, Y.; Abou Khalil, A.; Fargues, A.; Dussauze, M.; Danto, S.; Vedda, A.; Canioni, L.; Cardinal, T. Silver Centers Luminescence in Phosphate Glasses Subjected to X-rays or Combined X-rays and Femtosecond Laser Exposure. Int. J. Appl. Glass Sci. 2019, 11, 15–26. [Google Scholar] [CrossRef] [Green Version]
  40. Guérineau, T.; Loi, L.; Petit, Y.; Danto, S.; Fargues, A.; Canioni, L.; Cardinal, T. Structural Influence on the Femtosecond Laser Ability to Create Fluorescent Patterns in Silvercontaining Sodium-Gallium Phosphate Glasses. Opt. Mater. Express 2018, 8, 3748–3760. [Google Scholar] [CrossRef]
  41. Bourhis, K. Photostructuration Par Laser Infrarouge Femtoseconde de Verres Photosensible de Phosphate de Zinc, d’Argent et de Gallium. Ph.D. Thesis, Bordeaux University, Bordeaux, France, 2011. [Google Scholar]
  42. Desmoulin, J.C.; Petit, Y.; Canioni, L.; Dussauze, M.; Lahaye, M.; Magallanes Gonzalez, H.; Brasselet, E.; Cardinal, T. Femtosecond Laser Structuring of Silver-Containing Glass: Silver Redistribution, Selective Etching, and Surface Topology Engineering. J. Appl. Phys. 2015, 118, 213104. [Google Scholar] [CrossRef] [Green Version]
  43. Royon, A.; Bourhis, K.; Bellec, M.; Papon, G.; Bousquet, B.; Deshayes, Y.; Cardinal, T.; Canioni, L. Silver Clusters Embedded in Glass as a Perennial High Capacity Optical Recording Medium. Adv. Mater. 2010, 22, 5282–5286. [Google Scholar] [CrossRef]
  44. Ershov, B.G.; Ionova, G.V.; Kiseleva, A.A. Silver Clusters: Calculations of Optical Transmissions and of the Formation and Properties of “Magic” Positively Charged Clusters. Rus. J. Phys. Chem. 1995, 69, 239. [Google Scholar]
  45. Harb, J.; Petit, Y.; Guérineau, T.; Cardinal, T.; Canioni, L. Direct Laser Writing in Photosensitive Glasses: Application to Optical Systems for the Creation of High-Sensitivity Dosimeters. In Proceedings of the OPAL 2021 Conference, Corfu, Greece, 13–15 October 2021. [Google Scholar]
  46. Alhelou, N. Etude de Verres Pour La Dosimétrie Fibrée de Rayonnements Ionisants. Ph.D. Thesis, Lille University, Lille, France, 2018. [Google Scholar]
  47. Kahan, T. Discussion de Formules et Courbes Theoriques Relatives Aux Rayons. J. Phys. Radium 1939, 10, 430–434. [Google Scholar] [CrossRef] [Green Version]
  48. Poludniowski, G.; Omar, A.; Bujila, R.; Pedro, A. Technical Note: SpekPy v2.0—A Software Toolkit for Modeling X-ray Tube Spectra. Med. Phys. 2021, 48, 3630–3637. [Google Scholar] [CrossRef]
  49. Bujila, R.; Artur, O.; Poludniowski, G. A Validation of SpekPy: A Software Toolkit for Modelling X-ray Tube Spectra. Phys. Med. 2020, 75, 44–54. [Google Scholar] [CrossRef]
  50. Allison, J.; Amako, K.; Apostolakis, J.; Arce, P.; Asai, M.; Aso, T.; Bagli, E.; Bagulya, A.; Banerjee, S.; Barrand, G.; et al. Recent Developments in GEANT4. Nucl. Instrum. Methods Phys. Res. A 2016, 835, 186–225. [Google Scholar] [CrossRef]
  51. Streltsov, A.M.; Borrelli, N.F. Study of Femtosecond-Laser-Written Waveguides in Glasses. J. Opt. Soc. Am. B 2002, 19, 2496–2504. [Google Scholar] [CrossRef]
Figure 1. Microscopy fluorescence image of ARGOi glass sample (excitation at 365 nm) of laser-inscribed structures for the different writing irradiances at two different depths: (a) structures at 150 µm below the glass front surface, (b) structures at 550 µm below the glass front surface, and at 150 µm from the glass rear surface.
Chemosensors 10 00110 g001
Figure 2. (a) Transparent color before irradiation (ARGO glass sample), (b) yellow color after X-ray irradiation with 222 Gy (ARGO* glass sample).
Chemosensors 10 00110 g002
Figure 3. (a) Absorption spectra of the ARGO and ARGO* glass sample after various X-ray doses and the difference absorption coefficient spectrum for 222 Gy vs. pristine. (b) Fit of the radiation-induced spectrum (difference between 222 Gy and pristine) considering Gaussian energy contributions for ARGO and ARGO*. (c) Absorption spectra for the GPN and GPN* glasses for X-ray doses from 5 mGy to 3 kGy [39]. (d) The difference absorption coefficient spectra between different doses conditions for GPN and GPN* [39].
Chemosensors 10 00110 g003
Figure 4. Micro-luminescence of GPN* glass performed on the optically polished glass side: (a) integrated fluorescence intensity at different depths, (b) normalized spectrum evolution with depth for the 500 Gy dose [39].
Chemosensors 10 00110 g004
Figure 5. Estimated depth-dependent profiles in absolute values of the linear absorption coefficient at 405 nm.
Chemosensors 10 00110 g005
Figure 6. (a) X-ray energy spectra simulated by SpekPy for each irradiation facility, normalized by integral. (b) Geant4-simulated dose inside each sample, normalized by the surface dose; filled areas show uncertainties at 95% confidence.
Chemosensors 10 00110 g006
Figure 7. Radio-photoluminescence measurement of the GPNi* glass for the inscribed structure [39].
Chemosensors 10 00110 g007
Figure 8. Normalized RPL spectra excited at 325 nm: (a) for the ARGO (pristine—right axis) and ARGO* (X-ray irradiation at 222 Gy—left axis) glasses collected around 150 µm below the surface, (b,c) for the highest DLW irradiance structure for ARGOi and ARGOi* in the front- and the rear-inscribed surfaces, respectively.
Chemosensors 10 00110 g008
Figure 9. (a) Differential linear absorption coefficient of the laser-inscribed structures (11 TW/cm2) for the two planes after irradiation at 222 Gy X-ray dose in the ARGOi* glass sample. (b) Average differential absorption of the inscribed structures for all DLW irradiance (as from Figure 9a).
Chemosensors 10 00110 g009
Figure 10. (a) Phase image under white light illumination of the laser inscribed structure (11 TW/cm2) before irradiation. (b) Optical path difference determined from the phase image. (c) The refractive index modification Δ n as a function of laser irradiance before/after 222 Gy-dose for the two planes in ARGOi, ARGOi* glass sample.
Chemosensors 10 00110 g010
Figure 11. Comparison between calculated and measured Δ n ^ after irradiation for a decrease in the initial value of N α 3 by 0.48%: (a,c) the real part Δ n for the front and rear surfaces, respectively; (b,d) their imaginary counterparts Δ κ , respectively.
Chemosensors 10 00110 g011
Figure 12. Integrated measure of the amplitude of fluorescence intensity for the different laser irradiance before and after 222 Gy-dose for the two planes in ARGOi and ARGOi* glass sample.
Chemosensors 10 00110 g012
Figure 13. (a) Composite FLIM and fluorescence intensity microscopy images of the laser-induced structure (11 TW/cm2) before and after irradiation for an emission at 425 nm from the front surface; the color-code represents the mean lifetime obtained by FAST-FLIM algorithm (color scale from 0 to 31 ns); inset: luminescence intensity only (grey-scale from 0 to 45 counts). (b) Same composite FLIM and luminescence intensity images for an emission at 510 nm. (c) Luminescence decays in arbitrary units for the emission at 425 nm of the same structure before and after irradiation for the two surfaces, and fitting curves thereof using three exponential decay functions.
Chemosensors 10 00110 g013
Figure 14. Dose-dependent evolution of the amplitude ratio of extracted spectral bands for (a) the GPNi* glass sample for DLW irradiance of 13.4 TW/cm2 at 160 µm below the glass surface, (b) the ARGOi and ARGOi* glass sample for DLW irradiance of 11 TW/cm2 at 550 µm below the glass surface (rear surface).
Chemosensors 10 00110 g014
Table 1. The different properties of the two glass samples.
AcronymNominal Cationic Composition (mol %)n589 (±0.002)Temperature of Glass Transition
Tg (°C)
ARGO39.0P2O5-53.8ZnO-5.8Ag2O-1Ga2O3 *1.611375
GPN56.0P2O5-28.0Ga2O3-14.0Na2O-2.0Ag2O1.566497
* For the ARGO glass sample, the company does not provide the glass composition. Indeed, we have measured this composition and our finding is similar within the measurement error bar to reference [37] with a small addition of Al2O3 replacing Ga2O3 and with the same volumetric silver oxide concentration.
Table 2. Refractive index of the glass before and after irradiation with 222 Gy.
λ (nm)Refractive Index
Before irradiationFront irradiated surfaceRear irradiated surface
5891.611 ± 0.0021.608 ± 0.0021.608 ± 0.002
Table 3. Deposited doses for each considered silver clusters.
Glass SampleMaximum Dose at SurfaceSilver Clusters Depth [µm]Maximum Dose in Silver Clusters [Gy (Material)]
ARGOi*222 Gy ± 10% (H2O)150 (Front)57 ± 10%
550 (Rear)18 ± 10%
GPNi*357 Gy ± 10% (quartz)160 (Front)76 ± 10%
Table 4. Fitting parameters with a three exponential decay time model for all DLW irradiance.
Fluorescence Decay
τ ¯ i ;   σ τ i   ( ns )
Associated Amplitude
A i ¯ ; σ A i (%)
λemissionARGOi τ ¯ 1 ;   σ τ 1 τ ¯ 2 ;   σ τ 2 τ ¯ 3 ; σ τ 3 A 1 ¯ ; σ A 1 A 2 ¯ ; σ A 2 A 3 ¯ ; σ A 3
425 ± 25 nmBefore
Irradiation *
0.9; 0.12.9; 0. 25.1; 0. 528; 256; 416; 3
After irradiation, Front surface *0.9; 0.12.8; 0.165.2; 0.532; 452; 12 16; 8
After irradiation, Rear surface *0.9; 0.12.8; 0.25.0; 0.634; 351; 315; 7
510 ± 40 nmBefore Irradiation *1.8; 0.24.3; 0.27.5; 0.528; 357; 315; 3
After irradiation, Front surface *1.9; 0.2 4.5; 0.2 7.7; 0.4 29; 356; 315; 3
After irradiation, Rear surface *1.9; 0.34.4; 0.37.4; 0.530; 553; 517; 5
* Average statistical error over all measurements.
Publisher’s Note: MDPI stays neutral with regard to jurisdictional claims in published maps and institutional affiliations.

