Article

A Surface-Scattering-Based Composite Optical Waveguide Sensor for Aerosol Deposition Detection

1
State Key Laboratory of Transducer Technology, Aerospace Information Research Institute Chinese Academy of Sciences, Beijing 100190, China
2
University of Chinese Academy of Sciences, Beijing 100049, China
3
State Key Laboratory of NBC Protection for Civilian, Beijing 102205, China
*
Author to whom correspondence should be addressed.
Chemosensors 2022, 10(12), 535; https://doi.org/10.3390/chemosensors10120535
Submission received: 7 November 2022 / Revised: 6 December 2022 / Accepted: 13 December 2022 / Published: 15 December 2022
(This article belongs to the Collection Optical Chemosensors and Biosensors)

Abstract

:
Aerosol is a suspension of fine chemical or biological particles in the air, and it is harmful, easily causing air pollution, respiratory diseases, infrastructure corrosion, and poor visibility. Therefore, the development of advanced optical sensors for real-time detection of aerosol deposition is of great significance. In this work, a prism-coupled composite optical waveguide (COWG) sensor for aerosol deposition detection based on surface scattering is proposed and demonstrated theoretically and experimentally. The COWG consists of a single-mode slab glass waveguide locally covered with a tapered thin film of high-index metal oxide. The tapered film can greatly enhance the evanescent field through the adiabatic transition of the fundamental transverse electric (TE0) mode between the uncovered and film-covered regions, thereby enabling the COWG to serve as a simple yet highly sensitive evanescent-wave scattering sensor for sensitive detection of aerosol deposition. The COWG with a tapered layer of Ta2O5 was prepared by masked sputtering, aerosol salt particle deposition on the COWG was successfully detected, and the influence of surface water droplets on the COWG sensor performance was analyzed. The experimental results indicate that the sensitivity of the COWG is 30 times higher than that of the bare glass waveguide.

1. Introduction

Aerosols are multiphase mixtures composed of fine solid particles and/or liquid droplets suspended in a gas medium, usually air. Most aerosols are harmful and can cause air pollution, infrastructure corrosion, respiratory diseases, and reduced visibility [1,2,3,4,5]. Even global warming has something to do with aerosols [6]. It is virus aerosol transmission that is mainly responsible for the recent outbreak of the COVID-19 pandemic [2]. In the aerosol family, sea-salt aerosol is one of the most abundant aerosols, and it has a strong influence on the marine atmosphere and can also cause coastal infrastructure corrosion [3,4]. Due to the above-mentioned negative effects of aerosols, the detection and monitoring of aerosol particle deposition have attracted much attention. The most used technique for detecting aerosols is free-space light scattering monitoring using a digital CCD camera [7,8]. Although the data processing of CCD images allows for aerosol particle counting, this method has limited sensitivity and thus cannot be used for accurate detection, especially in the case of low-concentration aerosols.
In addition to conventional optical particle counting and gravimetry [9,10,11,12], some cutting-edge optical sensing techniques, such as whispering gallery mode (WGM) microresonators [13,14,15,16], have been used for aerosol deposition detection. A WGM microresonator is an ultrasensitive evanescent-wave sensor capable of detecting single particle deposition, but its structure is complicated, and the fabricating process is cumbersome. Moreover, the WGM microresonator is difficult to operate and inconvenient to use. In contrast, slab optical waveguides fabricated on glass substrates are suitable for practical application as aerosol deposition detectors. This is because slab glass waveguides are simple to fabricate, chemically robust, and cost-effective [17,18,19]. The only disadvantage of slab glass waveguide sensors is a low sensitivity due to a weak evanescent field. In this work, a slab-glass-waveguide-based evanescent-wave scattering sensor with significant sensitivity enhancement is proposed for aerosol deposition detection. The sensitivity enhancement is realized using the composite optical waveguide (COWG) structure, which can yield a locally enhanced evanescent field.
The COWG consists of a single-mode slab glass waveguide locally covered with a tapered high-index film, which is a perfect combination of a graded-index glass waveguide and a step-index thin-film waveguide and possesses all the advantages of these two waveguides, such as low loss and ease of prism coupling for glass waveguides and strong evanescent field for thin-film waveguides. The COWG allows for the adiabatic transition of the fundamental modes (TE0 and TM0) between the uncovered and film-covered regions based on the tapered velocity coupling theory [20]. For sensor applications, the COWG utilizes the tapered high-index film as the sensing layer and the uncovered areas of ion-exchanged glass for input and output optical coupling with prism couplers. The strong evanescent field penetrating out of the high-index film can interact with the chemical and biological measurands on the film surface to improve the sensitivity and detection limit. In our previous work, the COWG was used as a polarimetric interferometer for sensitive chemical and biological detection [21,22,23]. This work reports on the first application of the COWG as an evanescent-wave scattering sensor for the detection of aerosol particle deposition. The COWG characteristics and the sensor performance are investigated below.

2. Theory and Simulation

We first studied the modal properties of the ion-exchanged slab glass waveguide. The ion-exchanged glass layer has a graded index profile that can be expressed as a Gaussian function of the distance away from the surface (x):
n ( x ) = n s + ( n s u r f n s ) exp [ ( x / D ) 2 ]
where n s and n s u r f are the refractive indices of the glass substrate and the waveguide surface (x = 0), respectively; D represents the effective ion-diffusion depth and is determined by the ion-exchange temperature and ion-exchange time. The equation indicates that the refractive index of the ion-exchanged layer gradually decreases from n s u r f down to n s with increasing depth. Simulations were carried out based on the multilayer waveguide model where the ion-exchanged core layer is divided into 100 layers of equal thickness and different refractive indices. The parameters used in the calculation process include n s = 1.52 , n s u r f = 1.528 , D = 2 μm, λ = 633 nm, and n c = 1 (air cladding). Figure 1 shows the calculated effective refractive index profiles for both the TE and TM modes with different mode order numbers. The simulation results indicate that the ion-exchanged glass waveguide with an effective ion-diffusion depth of D = 2 μm is a single-mode waveguide.
In this work, we chose tantalum pentoxide thin film to prepare the COWG, because it is a high-quality optical film with high refractive index of n = 2.1 (with negligible imaginary part k) [24], high optical transmission, and good thermal and chemical stability. Figure 2a shows the COWG structure with a tapered thin film of Ta2O5. When the TE0 mode excited in the ion-exchanged core layer propagates into the Ta2O5 film-covered area of the COWG, it gradually lifts toward the surface with increasing film thickness, resulting in evanescent field enhancement in the film-covered region. For this reason, the Ta2O5 film was used as the evanescent-wave sensing layer of the COWG sensor. For straightforward understanding of the evanescent field enhancement with the COWG structure, we calculated the field distribution of the TE0 mode in the waveguide consisting of the glass substrate, the ion-exchanged core layer, the thin film of Ta2O5, and the air cladding. In the calculation process, the ion-exchanged core layer with D = 2 μm was still divided into 100 layers of equal thickness and different indices. The waveguide structure involved in the above calculation is referred to as the COWG model. The calculated results are shown in Figure 2b. As the thickness of Ta2O5 film gradually increases from 0 nm to 50 nm, the maximum field of the TE0 mode moves step-by-step toward the interface between the ion-exchanged layer and Ta2O5 film and finally enters the film. The upward shift of the TE0 mode greatly boosts the evanescent field.
Aerosol deposition on the sensing layer of the COWG would increase the surface roughness of the layer, consequently increasing the evanescent-wave scattering loss. This scattering loss can be simulated based on Tien’s theory, which indicates that the surface scattering loss (αS) in dB per unit length for a three-layer slab waveguide can be expressed as Equation (2) [25]:
α S = 8.686 K 0 2 ( σ 12 2 + σ 13 2 ) ( n f 2 N 2 ) 3 / 2 ( N T e f f ) 1
where K0 = 2π/λ (λ is the wavelength in vacuum), σ12 and σ13 are the root mean square roughness values of the lower and upper surfaces of the core layer, nf is the refractive index of the core layer, N is the effective refractive index of the guided mode, and Teff is the effective thickness of the waveguide. When aerosol deposition occurs on the COWG surface, σ13 changes, and αS also changes according to the following equation:
d α s / d σ 13 = 17.372 K 0 2 ( n f 2 N 2 ) 3 / 2 ( N T e f f ) 1 σ 13
To understand the surface-scattering-based COWG sensing mechanism and to optimize the COWG design, we first calculated N and Teff based on the COWG model, and we then carried out simulations of αs and dαS/dσ13 at different thicknesses (T) of the Ta2O5 film by using Equations (2) and (3). Prior to the calculations, we measured the surface roughness of ion-exchanged glass (σ12) and sputtered Ta2O5 film (σ13) by atomic force microscopy (AFM). As shown in Figure 3, the AFM images with 5 μm × 5 μm scanning areas indicate that the root mean square roughness is σ12 = 0.5 nm for the ion-exchanged glass and σ13 = 1.5 nm for the sputtered Ta2O5 film. Figure 4a–d show the four calculated curves, N(T), Teff(T), αs(T), and S/13(T). They have a common feature in that they contain a slow-to-fast transition in the thickness range from T = 0 to 60 nm. The transition point is at T = 46 nm, which is the cut-off thickness for the TE0 mode in the Ta2O5 waveguide. Both αs and dαS/dσ13 have their peak values at T = 81 nm. αS rapidly increases up to 100 dB/cm with increasing T from 46 nm to 81 nm. A combination of Figure 4c,d indicates that although a large thickness of the Ta2O5 film can result in an enhanced sensitivity, the surface scattering loss also increases. If the initial surface scattering loss is large, then the output light of the COWG sensor is weak, which is not conducive to aerosol deposition detection with a high signal-to-noise ratio over a wide dynamic range. To balance the performance of the COWG scattering sensor and its initial scattering loss, the maximum thickness of the tapered Ta2O5 film was controlled to be T ≤ 50 nm in this work.
The above Equations (2) and (3) apply to uniform waveguides. The COWG with a tapered film of Ta2O5 is a non-uniform slab waveguide that can be divided into a series of short segments of equal length. Each segment is approximately a uniform waveguide with different Ta2O5 film thickness; thus, its attenuation αS(z) can be derived from Equation (2). As a result, the total attenuation (α) and its variation (Δα) for the COWG can be expressed as Equations (4) and (5):
α = z = 0 z = L α s ( z ) dz
Δ α = z = 0 z = L Δ α s ( z ) dz
where L is the length of the tapered Ta2O5 film along the mode-propagating direction z (see Figure 2a). In our experiments using the COWG for aerosol deposition detection, changes in total attenuation (Δα) caused by aerosol deposition are determined using the following formula:
Δ α = 10 log ( I t / I 0 )
where I0 and It are the output light intensities of the COWG measured before and after aerosol deposition.

3. Materials and Methods

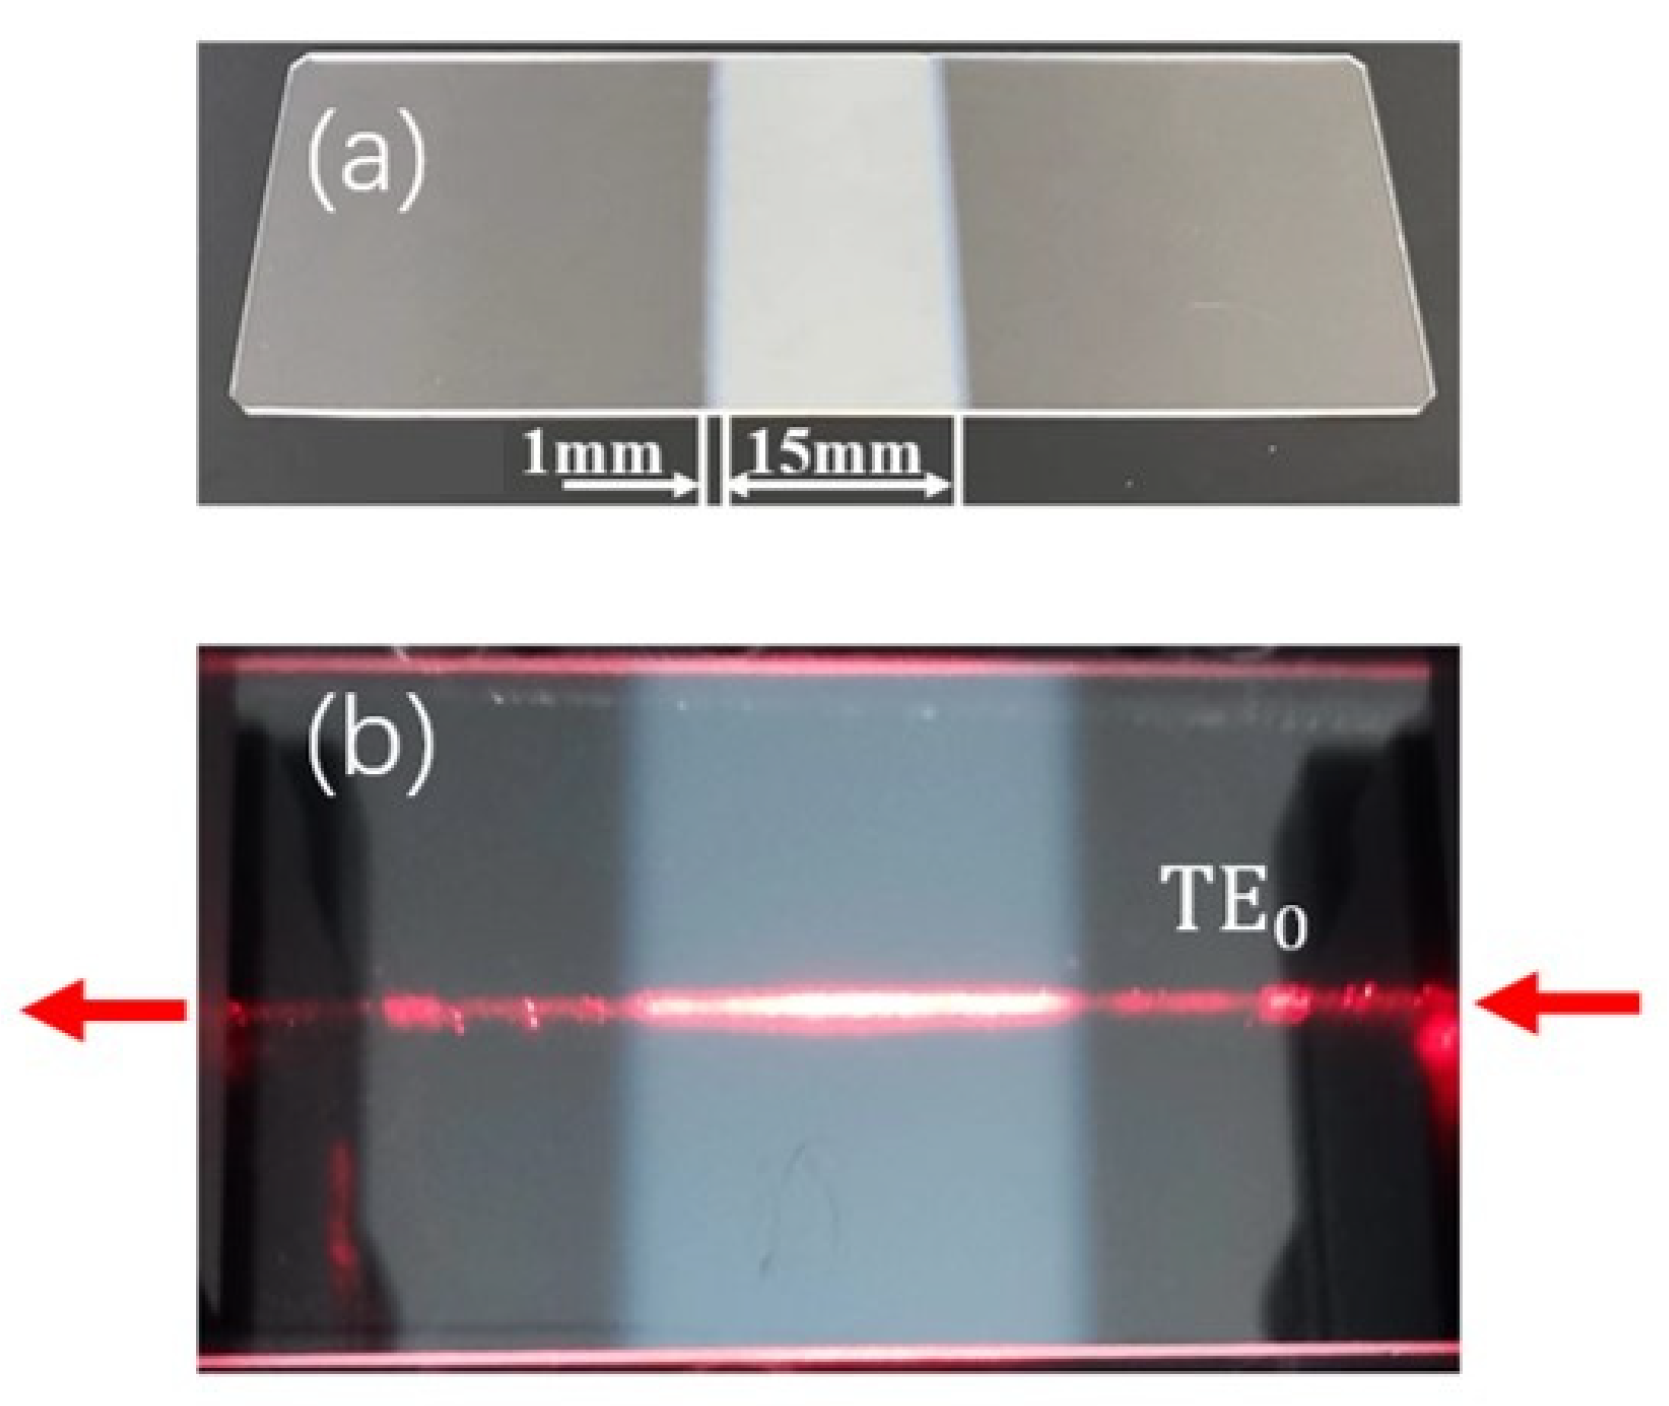
3.1. Fabrication of the COWG

The COWGs were fabricated in two steps. The first step was preparing single-mode slab waveguides on a soda-lime slide glass substrate (76 mm × 26 mm × 1 mm) by the ion-exchange method. The ion-exchange process was performed by immersing glass substrates into molten KNO3 at 400 °C for 30 min, which resulted in the formation of a potassium ion-exchanged layer about 2 μm thick on the glass substrate. The simulation results in Figure 1 show that a 2 μm thick potassium ion-exchanged layer is a single-mode waveguide capable of propagating both the TE0 and TM0 modes at 633 nm wavelength; the second step was sputtering Ta2O5 thin film onto the single-mode slab glass waveguide. To taper the two ends of the film, a steel mask containing a rectangular window in its mid-area was used to shield the slab glass waveguide during the sputtering process. By controlling the sputtering time, the thickness of the Ta2O5 films was controlled to not be below 50 nm. The resulting film had a length of L = 15 mm, including two tapered ends approximately 1 mm long. A photograph of the as-prepared COWG chip is shown in Figure 5a. From the photograph shown in Figure 5b, the surface-scattering-induced bright streak is clearly seen along the propagation path of the TE0 mode in the COWG.

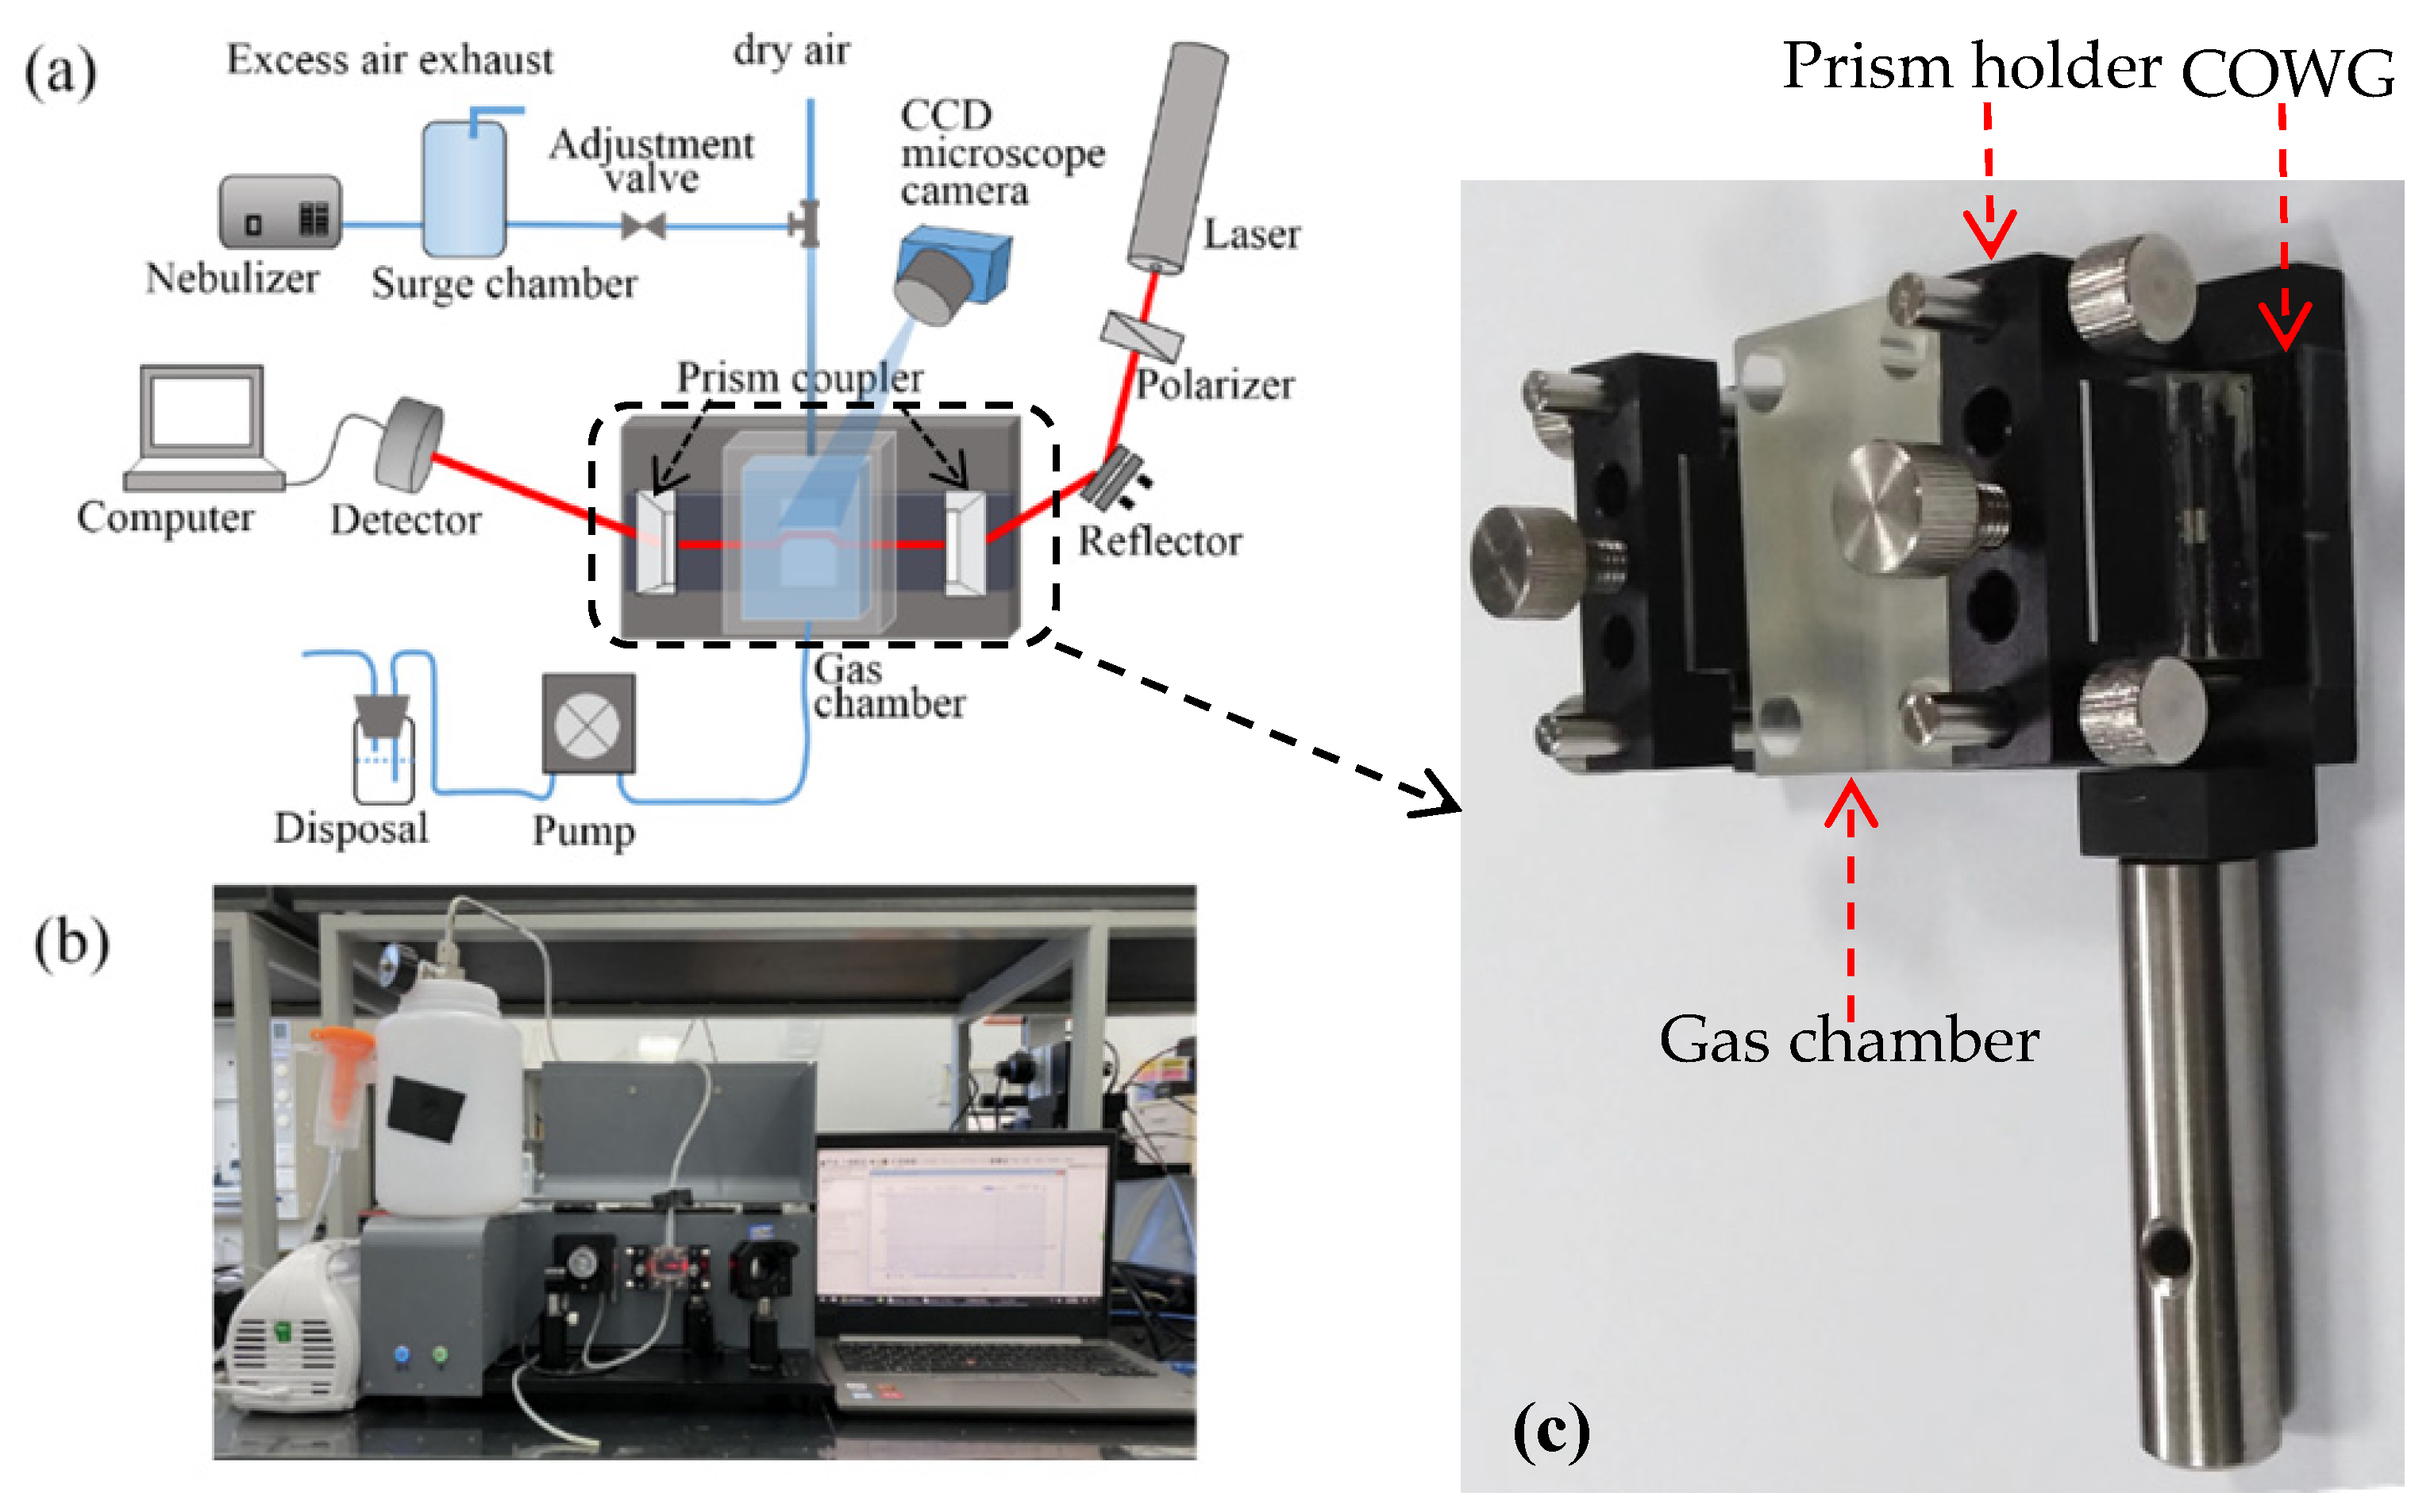
3.2. Construction of the Experimental Setup

Figure 6a schematically shows the surface scattering based COWG sensor with the aerosol generation and delivery system, and Figure 6b displays the corresponding actual sensor prototype. Figure 6c show the laboratory-made multipurpose holder, which contains a waveguide supporter and a pair of prism holder and can be used to assemble the COWG, the gas chamber, and the prism couplers together to form a stable integrated optical gas-sensing element. This multipurpose holder as the key component of the sensor prototype guarantees the long-time stable operation of the system. The aerosol generation was realized using a commercial nebulizer (operating pressure of 80 kPa–150 kPa, number of particles with a diameter of 6 μm accounting for 60%, and a gas flow rate of 7 L/min). A gas chamber with an open port was attached to the COWG, exposing the tapered Ta2O5 thin film to the chamber. Using a gas pump, aerosol flow was delivered at a flow rate of ~0.2 m/s into the chamber to surround the Ta2O5 film. Excess aerosol spontaneously escaped from the gas chamber, keeping the pressure inside the chamber at 1 atm. The aerosol flow could be switched on and off with a valve. Experimental testing of aerosol deposition detection using the COWG scattering sensor was performed by generating wet salt aerosol from a series of aqueous saline solutions with different salt concentrations. According to the literature [26], in the case of a fixed flow rate, the rate of salt deposition on the COWG surface is a function of the salt concentration of the aerosol samples and increases with the salt concentration. We measured salt concentrations of multiple aerosol samples by gravimetry, and we thus obtained a quasi-linear relationship between the aerosol concentration and the solution concentration, as shown in Figure 7.
Using the prism coupling method, an s-polarized laser beam with a wavelength of λ = 633 nm was coupled into the COWG to excite the TE0 mode of the ion-exchanged core layer. The output light intensity of the COWG was monitored over time using a photodetector, and the scattered light from the Ta2O5 film-covered region of the COWG was also simultaneously monitored using a CCD digital camera equipped with an optical magnifier. By processing the grayscale image data obtained with the CCD camera, the time course of the scattered light intensity was obtained and then compared with the detected time course of the output light intensity. It is worth noting that the slab COWG mounted on a specially designed holder was perpendicular to the tabletop to prevent the presence of large water droplets on the COWG surface. All measurements in this work were carried out at room temperature (~20 °C).

4. Results and Discussion

4.1. Methodology Validation

To demonstrate the applicability of the COWG scattering sensor for aerosol deposition detection, wet salt aerosol flow (1.41 mg/L) as the analyte sample was generated. After the output light intensity of the COWG was observed to be stable with time, the COWG was exposed to aerosol flow, and its response was measured continuously. In addition, the scattered light streak on the COWG surface was simultaneously recorded using a digital camera in video mode. During the measurement, the influence of on/off switching of the aerosol flow on the COWG response was also considered. As shown in Figure 8a, the surface streak became brighter with increasing exposure time. To obtain the time course of scattered light intensity, the image data of each frame of the video were processed, giving the normalized intensities of scattered light at different time points. As shown in Figure 8b, the scattered light intensity increased stepwise, attributed to the step-by-step exposure of the COWG to the wet salt aerosol. For comparison, the time course of output light intensity is also included in Figure 8b. The comparison of the two time courses of scattered light intensity and output light intensity obtained in the same process indicates that the output light decay results from the increased surface scattering due to salt particle deposition. The combination of scattered light detection and output light detection confirmed that the COWG scattering sensor can be used for aerosol deposition detection.
As shown in Figure 8c, the water contact angle of the Ta2O5 film was measured to be θ = 75°. Such a hydrophilic surface can lower the dynamic interfacial tension when aerosol particles collide with it [27], which is beneficial to wet aerosol deposition and sensitivity enhancement. A hydrophobic surface is not conducive to water droplet adhesion and, thus, to aerosol deposition. On the hand, a super-hydrophilic surface is also not conducive to aerosol deposition detection because it allows a continuous water film with low surface roughness to easily form. Therefore, we suggest that the tapered high-index film of the COWG should have an appropriate water contact angle between 50° and 90° to allow as many aerosol particles as possible to be detected.

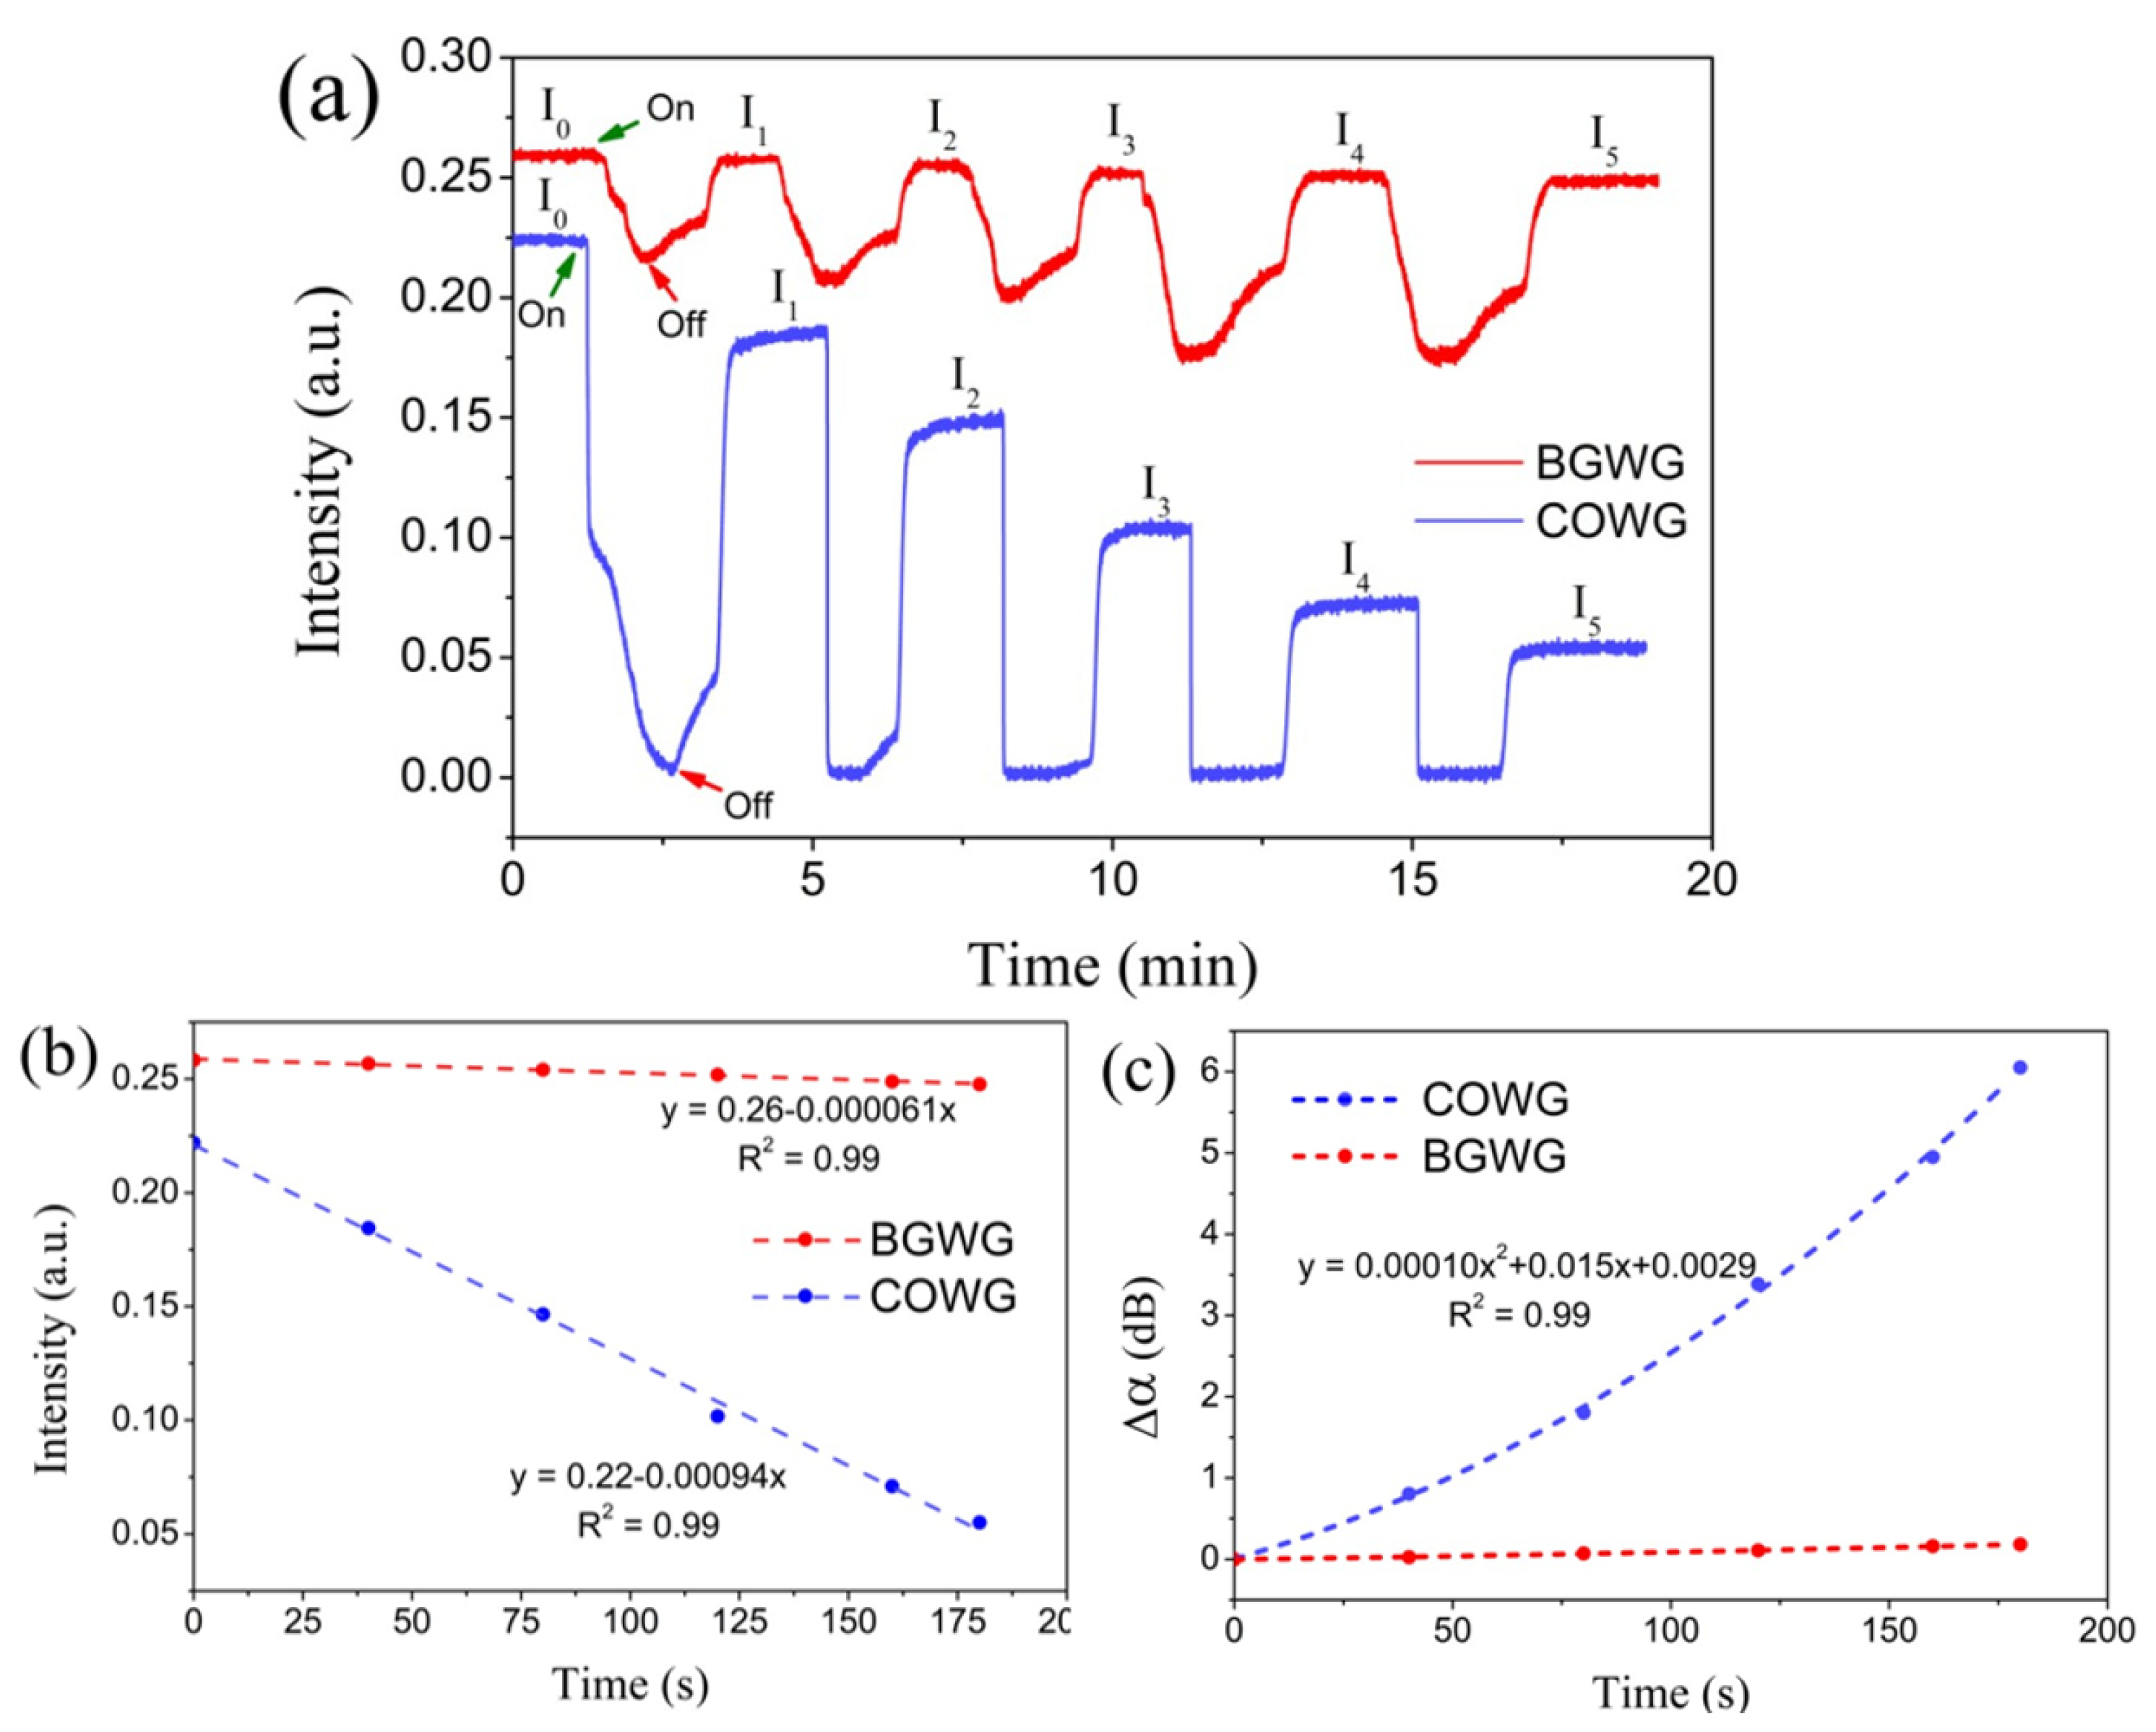
4.2. Effect of Water Droplet Deposition

Because salt deposition from wet aerosol is inevitably accompanied by water droplet deposition, the influence of surface water droplets on the COWG’s sensitivity to salt deposition should be considered. To investigate the effect of water droplet deposition, an aerosol flow of pure water droplets was generated and delivered to the gas chamber, and the output light intensity of the COWG was measured with time. Figure 9 shows the measured results. As the COWG was exposed to the water droplet aerosol, the output light intensity rapidly decreased to a minimum and then barely changed with time. Injection of dry airflow into the gas chamber to replace the water droplet aerosol inside caused the output light intensity to recover to the initial level within 1 min. The recovery process of output light intensity includes two steps of slow increase and fast increase, implying that the water droplet evaporation from the COWG surface undergoes two stages: the early stage is a change in droplet size from large to small, and the latter stage is a rapid reduction in the number of droplets. The same results as above were obtained with three repeated measurements, as shown in Figure 9. These findings indicate that water droplet deposition and subsequent evaporation is a fully reversible cyclic process. With this conclusion, the influence of water droplet deposition on the sensitivity of the COWG to salt deposition can be completely eliminated. Therefore, the surface scattering based COWG sensor can be used for accurate detection of solid-state particle deposition from wet aerosols.

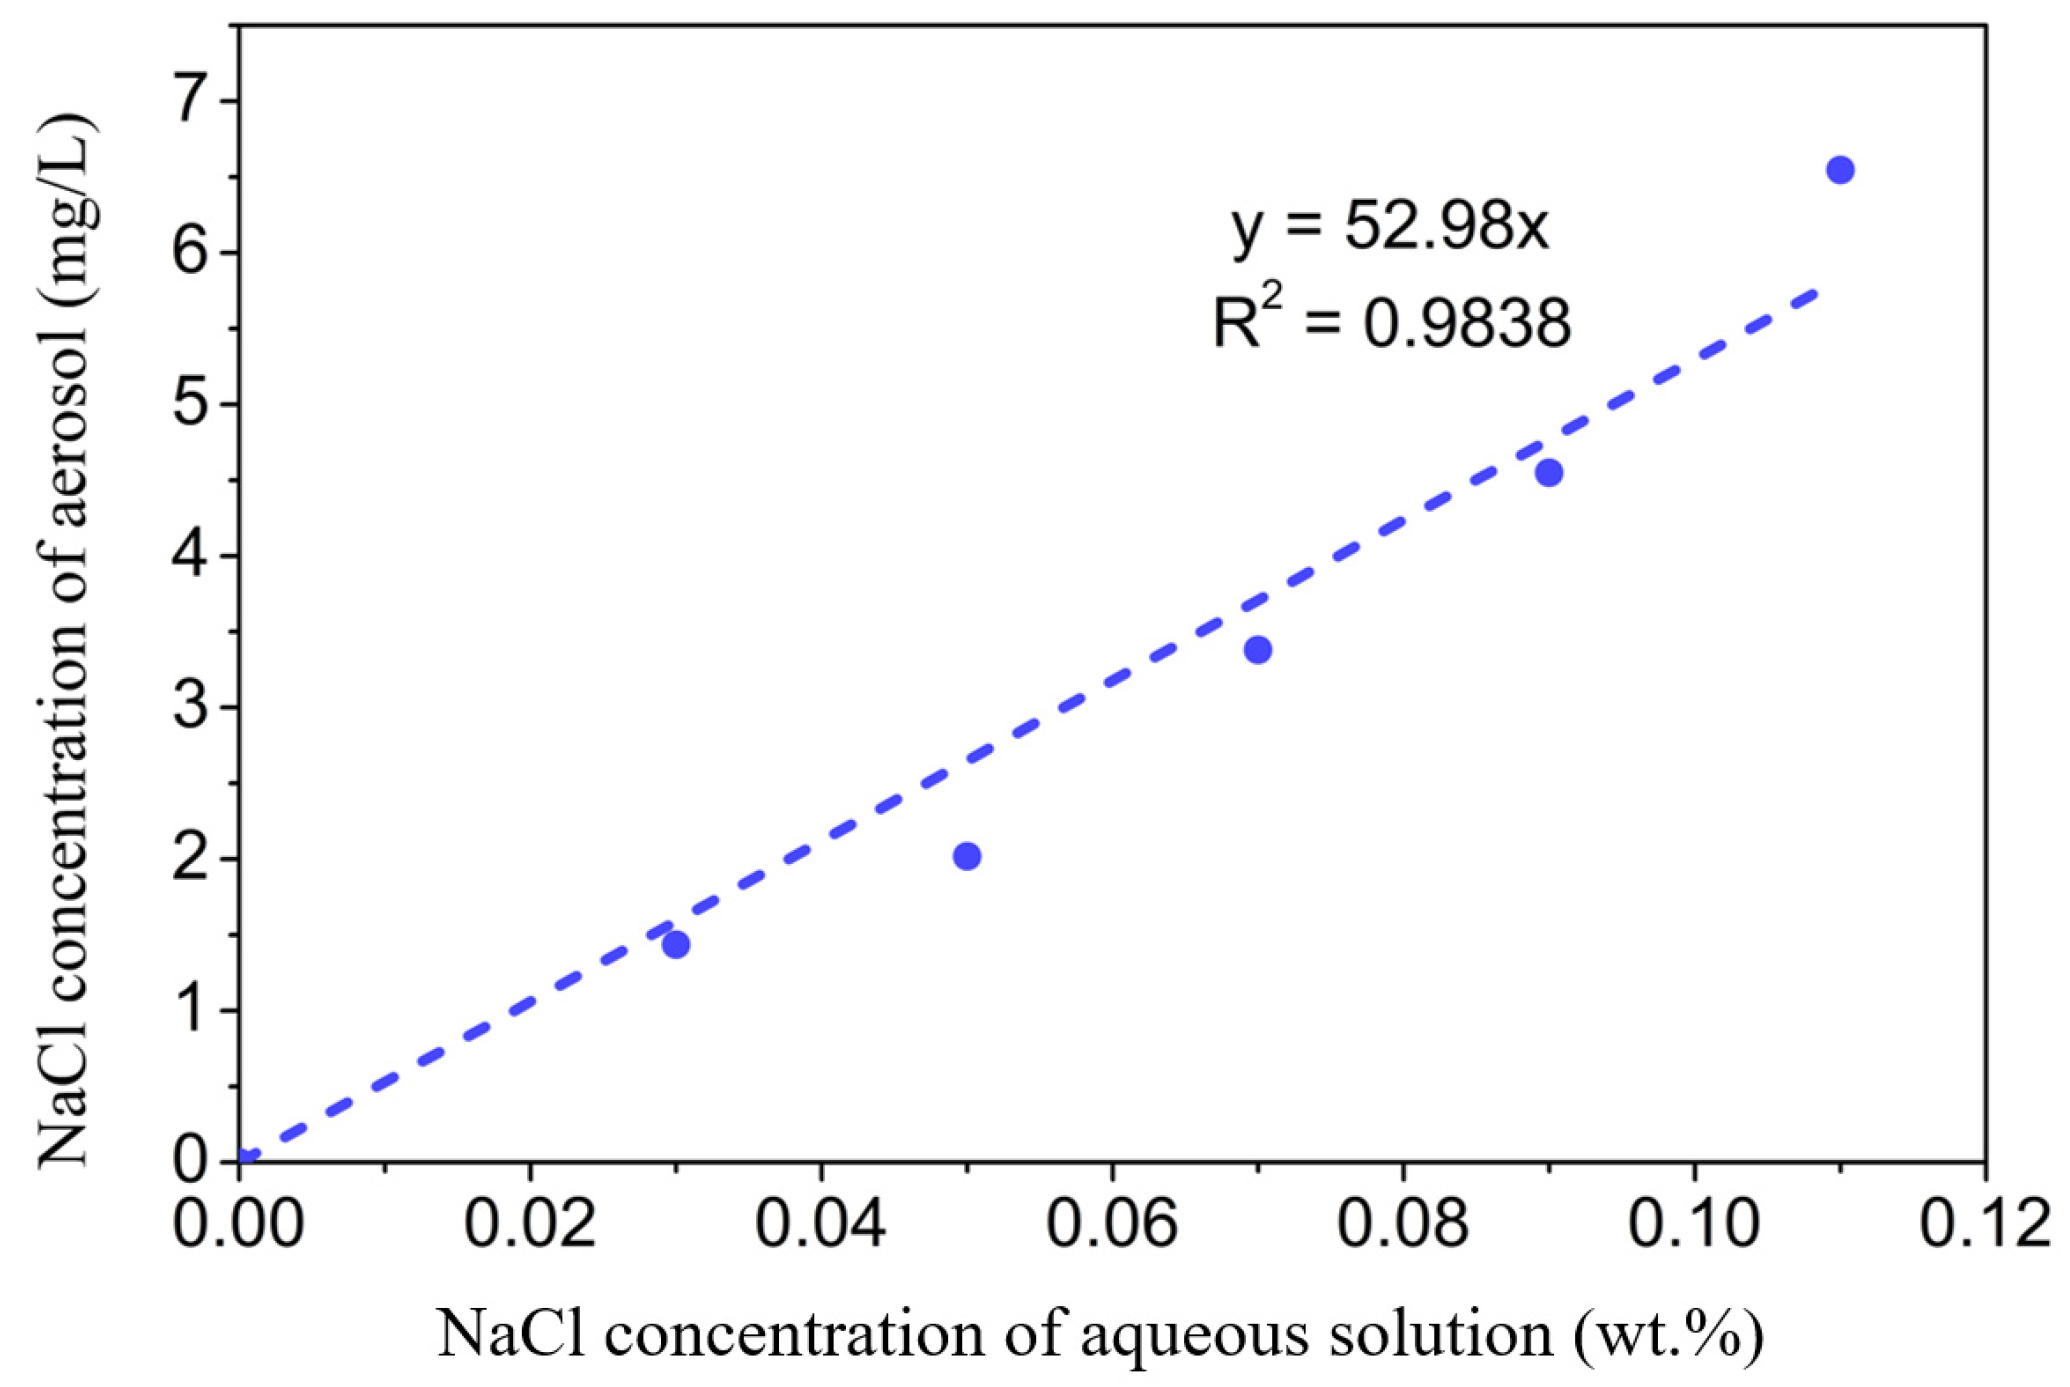
4.3. Responses of the COWG Scattering Sensor to Aerosol Salt Deposition

To investigate the time dependence of the COWG response to aerosol salt deposition, a 3.5 wt.% saline solution was prepared, which was then used to generate a salt aerosol flow with a constant flow rate. After the COWG’s output light intensity was observed to be stable, the salt aerosol flow was delivered into the gas chamber for salt deposition for 40 s, and then the aerosol flow was directly switched to dry airflow to evaporate the water droplets formed on the Ta2O5 film of the COWG. This deposition–evaporation cycle was repeated five times in succession, during which the COWG’s output light intensity was continuously monitored. Figure 10a shows the temporal responses of the COWG to the five successive deposition–evaporation cycles. Each aerosol delivery resulted in a rapid and large reduction in output light intensity, and switching the aerosol flow to dry airflow caused the light intensity to recover to a certain value below the initial intensity before aerosol exposure. An initially abrupt drop in light intensity followed by a relatively slow drop was observed in the first cycle; the abrupt intensity drop results from the fast co-deposition of salt and water droplets, and the relatively slow intensity drop is attributable to the surface infiltration of the COWG. Water droplet evaporation led to a partial recovery of the light intensity. The net reduction in output light intensity (e.g., ΔI = I0–I1 for the first cycle), corresponding to the scattered light increment, is the contribution of the salt deposition. Figure 10b displays a plot of the output light intensities (I0~I5) against the accumulated aerosol deposition time duration, which presents a good linear relationship. The accumulated changes (Δα) in the COWG attenuation after every deposition–evaporation cycle were calculated using Equation (6) with the initial light intensity I0 as the reference. Figure 10c shows the calculated results. Δα nonlinearly increased with the deposition time, being a quadratic function of time. According to Equation (3), Δα is directly proportional to Δσ13; this means that the COWG surface roughness also nonlinearly changes with the salt deposition time. For comparison, a bare glass waveguide (BGWG) was also used to detect aerosol salt deposition under the same conditions as above. The results obtained with the BGWG are included in Figure 10a–c. During aerosol salt deposition, the BGWG showed a similar response to that of the COWG, except that the response amplitude of the COWG was 30 times larger than that of the BGWG. This comparison result verifies that the COWG structure can indeed greatly enhance the evanescent field and consequently improve the detection sensitivity.
To study the concentration dependence of the COWG response to aerosol salt deposition, five saline solutions with different concentrations were prepared and used to generate five aerosol flows with equal flow rates but different concentrations. According to Figure 7, the salt concentration of aerosol was proportional to that of the saline solution. The temporal response of the COWG to salt deposition from each aerosol was measured within a deposition time of 15 s. The above five aerosols were successively delivered into the gas chamber in order from low concentration to high concentration, resulting in five deposition–evaporation cycles. Figure 11a shows the temporal responses of the COWG to the five deposition–evaporation cycles. Similar to Figure 10a, in each deposition–evaporation cycle, the salt and water droplet co-deposition resulted in a sharp drop in light intensity, and the water evaporation caused a partial recovery of light intensity. The net reduction in output light intensity increased with the salt concentration of aerosol. The attenuation variation Δα induced in each deposition–evaporation cycle was calculated using Equation (6). Figure 11b shows the calculated results. Δα is a nonlinear function of the NaCl concentration of the aerosol. Δα = 0 obtained at a concentration of 1.44 mg/L indicates that in the case of the salt concentration not exceeding this value, the COWG sensor is unable to produce a measurable response within 15 s. According to the findings shown in Figure 10, a longer exposure time is required for the COWG sensor to make a measurable response to salt deposition from a low-concentration aerosol. Since aerosol salt deposition is an irreversible process, exposure of the COWG to one aerosol sample can affect the accuracy of detection of the next aerosol sample unless the COWG surface is sufficiently cleaned with water before the next measurement. Such negative influence is smaller for successive measurements from low concentration to high concentration than for those in the reverse order.

5. Conclusions

An optical method for aerosol deposition detection based on the evanescent-wave scattering of a COWG was proposed and demonstrated for the first time in this paper. A COWG with a tapered high-index dielectric layer as the surface sensing region was prepared and characterized theoretically and experimentally. The maximum thickness of the tapered layer of Ta2O5 was optimized under the guidance of simulations of the trade-off between the surface sensitivity and the propagation loss of the COWG. Wet salt aerosol was generated using a laboratory-made aerosol generator, and the detection of aerosol salt deposition on the COWG was then performed by monitoring the COWG output light intensity in real time. Salt and water droplet co-deposition on the COWG surface resulted in a large and rapid change in the output light intensity, and water droplet deposition is a fully reversible process. The sensitivity of the COWG scattering sensor to salt depositions can be obtained via deposition–evaporation cycles. The sensitivity in terms of the attenuation variation was demonstrated to be nonlinearly dependent on the deposition time at a given salt concentration and on the salt concentration at a fixed deposition time. The experimental results obtained in the laboratory reveal that the sensitivity of the COWG is 30 times higher than that of a bare glass waveguide under the same test conditions. This work demonstrated the first application of COWG enhanced surface scattering for the direct detection of aerosol particle deposition. The COWG sensor prototype prepared in this work is a portable instrument with high stability and low power consumption, and it has a great potential for field detection of aerosol salt deposition.

Author Contributions

Conceptualization, Z.Q.; Data curation, M.Z. and H.T.; Methodology, M.Z. and Z.L.; Writing—original draft, M.Z.; Writing—review and editing, H.T., Z.T. and Z.Q. All authors have read and agreed to the published version of the manuscript.

Funding

This research was funded by the National Natural Science Foundation of China (62121003, 61931018, 61871365) and the National Key R&D Program of China (2021YFB3200100).

Institutional Review Board Statement

Not applicable.

Informed Consent Statement

Not applicable.

Data Availability Statement

Not applicable.

Conflicts of Interest

The authors declare no conflict of interest.

References

  1. Kabir, E.; Azzouz, A.; Raza, N.; Bhardwaj, S.K.; Kim, K.; Tabatabaei, M.; Kukkar, D. Recent advances in monitoring, sampling, and sensing techniques for bioaerosols in the atmosphere. ACS Sens. 2020, 5, 1254–1267. [Google Scholar] [CrossRef]
  2. Gupta, D.; Eom, H.-J.; Cho, H.-R.; Ro, C.-U. Hygroscopic behavior of NaCl–MgCl2 mixture particles as nascent sea-spray aerosol surrogates and observation of efflorescence during humidification. Atmos. Chem. Phys. 2015, 15, 11273–11290. [Google Scholar] [CrossRef] [Green Version]
  3. Guo, L.; Gu, W.; Peng, C.; Wang, W.; Li, Y.J.; Zong, T.; Tang, Y.; Wu, Z.; Lin, Q.; Ge, M.; et al. A comprehensive study of hygroscopic properties of calcium-and magnesium-containing salts: Implication for hygroscopicity of mineral dust and sea salt aerosols. Atmos. Chem. Phys. 2019, 19, 2115–2133. [Google Scholar] [CrossRef] [Green Version]
  4. Farghadan, A.; Poorbahrami, K.; Jalal, S.; Oakes, J.M.; Coletti, F.; Arzani, A. Particle transport and deposition correlation with near-wall flow characteristic under inspiratory airflow in lung airways. Comput. Biol. Med. 2020, 120, 103703. [Google Scholar] [CrossRef] [PubMed]
  5. Yu, S.; Wang, J.-Z.; Sun, X.-Z.; Liu, Y.-X. Numerical analysis on deposition of particulate matters in respiratory tract. J. Med. Biomech. 2016, 31, 193–198. [Google Scholar]
  6. Maierhofer, P.; Buchberger, A.; Breitegger, P.; Bergman, A. Optical aerosol sensing-from air quality to global warming. Appl. Ind. Opt. 2019, 7, 8–10. [Google Scholar]
  7. Chavez, R.; Orea, D.; Choi, B.; Nguyen, T.D.; Anand, N.K.; Hassan, Y.; Sabharwall, P. An experimental study of solid and liquid aerosol transport in a horizontal square channel. Aerosol Sci. Technol. 2020, 54, 1399–1423. [Google Scholar] [CrossRef]
  8. Fischer, F.; Andris, A.; Lippmann, W.; Hurtado, A. Particle deposition by thermophoresis under high-temperature conditions in a helium flow. J. Nucl. Eng. Radiat. Sci. 2018, 4, 41020. [Google Scholar] [CrossRef]
  9. Sousan, S.; Koehler, K.; Hallett, L.; Peters, T.M. Evaluation of the Alphasense optical particle counter (OPC-N2) and the Grimm portable aerosol spectrometer (PAS-1.108). Aerosol Sci. Technol. 2016, 50, 1352–1365. [Google Scholar] [CrossRef]
  10. Grgic, B.; Finlay, W.H.; Heenan, A.F. Regional aerosol deposition and flow measurements in an idealized mouth and throat. J. Aerosol Sci. 2004, 35, 21–32. [Google Scholar] [CrossRef]
  11. Cena, L.G.; Anthony, T.R.; Peters, T.M. A personal nanoparticle respiratory deposition (NRD) sampler. Environ. Sci. Technol. 2011, 45, 6483–6490. [Google Scholar] [CrossRef] [PubMed] [Green Version]
  12. Tsai, C.-J.; Liu, C.-N.; Hung, S.-M.; Chen, S.-C.; Uang, S.-N.; Cheng, Y.-S.; Zhou, Y. Novel active personal nanoparticle sampler for the exposure assessment of nanoparticles in workplaces. Environ. Sci. Technol. 2012, 46, 4546–4552. [Google Scholar] [CrossRef] [PubMed]
  13. Lee, A.; Mills, T.; Xu, Y. Nanoscale welding aerosol sensing based on whispering gallery modes in a cylindrical. silica resonator. Opt. Express 2015, 23, 7351–7365. [Google Scholar] [CrossRef] [PubMed] [Green Version]
  14. Wang, D.; Wang, Z.H.; Lee, A.; Marr, L.C.; Heflin, J.R.; Xu, Y. Highly sensitive nano-aerosol detection based on the whispering-gallery-mode in cylindrical optical fiber resonators. Aerosol Sci. Technol. 2016, 50, 1366–1374. [Google Scholar] [CrossRef] [Green Version]
  15. Signh, R.; Ma, D.; Kimerling, L.; Agarwal, A.M.; Anthony, B.W. Chemical characterization of aerosol particles using on-chip photonic cavity enhanced spectroscopy. ACS Sens. 2019, 4, 571–577. [Google Scholar]
  16. Singh, R.; Su, P.; Kimerling, L.; Agarwal, A.; Anthony, B.W. Towards on-chip mid infrared photonic aerosol spectroscopy. Appl. Phys. Lett. 2018, 113, 231107. [Google Scholar] [CrossRef] [Green Version]
  17. Lu, D.-F.; Qi, Z.-M. Glass/Ta2O5 composite waveguides for application as an integrated polarimetric interferometer. Chin. Phys. Lett. 2010, 27, 104206. [Google Scholar]
  18. Lu, D.-F.; Qi, Z.-M. Determination of surface protein coverage by composite waveguide based polarimetric interferometry. Analyst 2011, 136, 5277. [Google Scholar] [CrossRef]
  19. Du, B.; Tong, Z.; Mu, X.; Liu, S.; Xu, J.; Liu, Z.; Qi, Z.; Ding, Z. Detection of diethyl chlorophosphate using a composite optical waveguide sensor. Anal. Methods 2019, 11, 1208–1213. [Google Scholar] [CrossRef]
  20. Qi, Z.-M.; Honma, I.; Zhou, H.S. Tin-diffused glass slab waveguides locally covered with tapered thin TiO2 films for application as a polarimetric interference sensor with an improved performance. Anal. Chem. 2005, 77, 1163–1166. [Google Scholar] [CrossRef]
  21. Yimit, A.; Rossberg, A.G.; Amemiya, T.; Itoh, K. Thin film composite optical waveguides for sensor applications: A review. Talanta 2005, 65, 1102–1109. [Google Scholar] [CrossRef] [PubMed]
  22. Qi, Z.-M.; Matsuda, N.; Itoh, K.; Qing, D.-K. Characterization of an optical waveguide with a composite structure. J. Light. Technol. 2002, 20, 1598–1603. [Google Scholar]
  23. Qi, Z.-M.; Matsuda, N.; Santos, J.H.; Takatsu, A.; Kato, K. Prism-coupled multimode waveguide refractometer. Opt. Lett. 2002, 27, 689–691. [Google Scholar] [CrossRef] [PubMed]
  24. Bright, T.J.; Watjen, J.I.; Zhang, Z.M.; Muratore, C.; Voevodin, A.A.; Koukis, D.I.; Tanner, D.B.; Arenas, D.J. Infrared optical properties of amorphous and nanocrystalline Ta2O5 thin films. J. Appl. Phys. 2013, 114, 083515. [Google Scholar] [CrossRef]
  25. Tien, K. Light waves in thin films and integrated optics. Appl. Opt. 1971, 10, 2395–2413. [Google Scholar] [CrossRef]
  26. Zhang, Y.; Finlay, W.H.; Matida, E.A. Particle deposition measurements and numerical simulation in a highly idealized mouth–throat. J. Aerosol Sci. 2004, 35, 789–803. [Google Scholar] [CrossRef]
  27. Yu, Z.; Kadir, M.; Liu, Y.; Huang, J. Droplet-capturing coatings on environmental surfaces based on cosmetic ingredients. Chemistry 2021, 7, 2201–2211. [Google Scholar] [CrossRef]
Figure 1. Effective refractive indices of the TE modes in the ion-exchanged glass waveguide as a function of the thickness of the ion-exchanged layer.
Chemosensors 10 00535 g001
Figure 2. Simulation of the local TE0 modes in the COWG: (a) schematic diagram of the COWG with a tapered layer of Ta2O5 (the arrowed lines show the mode propagation path); (b) simulated field profiles of the local TE0 modes at different positions of the COWG.
Chemosensors 10 00535 g002
Figure 3. AFM images of slab waveguides: (a) an ion-exchanged glass waveguide with the exposed surface; (b) an ion-exchanged glass waveguide covered with the sputtered Ta2O5 film.
Chemosensors 10 00535 g003
Figure 4. Simulation results for the TE0 mode in the COWG with a tapered film of Ta2O5: (a) Neff, (b) Teff, (c) αS, and (d) sensitivity versus the film thickness.
Chemosensors 10 00535 g004
Figure 5. Photographs of the COWG with a tapered Ta2O5 layer: (a) the freshly fabricated COWG; (b) the COWG with a scattered light streak along the propagation path of the TE0 mode.
Chemosensors 10 00535 g005
Figure 6. Experimental setup for aerosol deposition detection: (a) schematic diagram of the setup; (b) photograph of the setup; (c) photograph of the laboratory-made multipurpose holder contained in the setup.
Chemosensors 10 00535 g006
Figure 7. Measured NaCl concentration of the aerosol as a function of salt concentration of the aqueous solution.
Chemosensors 10 00535 g007
Figure 8. Experimental results: (a) the scattering-induced bright streaks on the COWG surface observed before (t = 0 s) and at different times after exposure to wet salt aerosol; (b) the time courses of the scattered light intensity and the output light intensity of the COWG obtained during alternate opening and closing of the aerosol flow; (c) the water contact angle (75°) measured with the Ta2O5 thin film of the COWG.
Chemosensors 10 00535 g008
Figure 9. Changes in output light intensity measured upon step-by-step exposure of the COWG to the aerosol generated with pure water (with dry airflow injected for water droplet evaporation from the COWG after each exposure).
Chemosensors 10 00535 g009
Figure 10. Experimental results: (a) temporal responses of the COWG and BGWG to step-by-step aerosol salt deposition with the same salt aerosol (deposition time 40 s each step); (b) output light intensities of the COWG and BGWG versus the accumulated deposition time; (c) the attenuation variation Δα for the COWG and BGWG versus the accumulated deposition time.
Chemosensors 10 00535 g010
Figure 11. Experimental results: (a) temporal responses of the COWG to step-by-step aerosol salt deposition with 5 different salt concentrations of saline solution (deposition time of 15 s for each concentration); (b) attenuation variations Δα as a function of the salt concentration of saline solution.
Chemosensors 10 00535 g011
Publisher’s Note: MDPI stays neutral with regard to jurisdictional claims in published maps and institutional affiliations.

