Article

In Situ Growth of Dopamine on QCM for Humidity Detection

1
School of Information Science and Engineering, Zhejiang Sci-Tech University, Hangzhou 310018, China
2
State Key Laboratory of Integrated Optoelectronics, College of Electronic Science and Engineering, Jilin University, Changchun 130012, China
*
Author to whom correspondence should be addressed.
Chemosensors 2022, 10(12), 522; https://doi.org/10.3390/chemosensors10120522
Submission received: 8 November 2022 / Revised: 3 December 2022 / Accepted: 7 December 2022 / Published: 8 December 2022

Abstract

:
Polydopamine (PDA) films were successfully prepared on quartz crystal microbalance (QCM) by in-situ growth method, and the obtained QCM sensor was used for humidity detection. Fourier transform infrared spectroscopy (FT-IR) and scanning electron microscopy (SEM) were used to study the chemical composition and microstructure of the in-situ grown PDA sensitive films. The experimental results showed that the PDA-QCM humidity sensor with 2 h polymerization growth times (2-PDA-QCM) owned high sensitivity (20.77 Hz/% RH), good selectivity, short response/recovery time (5 s/11 s) and acceptable long-term stability. In addition, the energy loss of the sensors fabricated under different conditions was investigated by impedance analysis. Based on all the test results, it is concluded that the combination of in-situ growth method and QCM can produce a room temperature humidity sensor with excellent performance.

1. Introduction

Currently, humidity levels not only affect the production and development of industrial manufacturing, agricultural planting, power transmission, medical care and other fields, but also affects the quality of a person’s living environment [1,2,3,4]. Common resistive or capacitive humidity sensors put forward higher requirements for the electrical properties of humidity sensitive materials, resulting in some materials with strong hydrophilicity, but weak conductive properties [5,6,7,8,9]. As a kind of mass-sensitive sensor, the working principle of quartz crystal microbalance (QCM) is to obtain the output frequency shift of the device by using the mass change caused by the adsorption of water molecules on the sensitive film to realize the function of the sensor. This means that the electrical properties of the sensitive material have little influence on the QCM sensor, and the sensor performance is more dependent on the adsorption capacity of the material for target molecules [10,11]. In addition, QCM sensors have attracted much attention in the field of sensor applications due to their nanogram-level high accuracy, low power consumption, digital output, and real-time and room temperature detection [12,13,14,15,16].
It is well known that the selective adsorption capacity of sensitive materials is the key factor for the performance of QCM sensors. Various hydrophilic materials such as metal oxides, polymers, carbon-based materials, etc. were used to detect humidity [17,18,19,20,21,22]. For example, Tai et al. deposited a composite film based on graphene oxide (GO) and polyethylene imine (PEI) on the QCM electrode through a simple immersion technique. The response of the prepared sensor per relative humidity (RH) was 19 Hz, and the detection range was 11.3~97.3% RH. The results also proved that increasing the number of GO layers could enhance the frequency shift of the sensor. However, the increase in the number of layers would reduce the quality factor of the sensor [23]. Furthermore, Xu et al. used the in situ growth method to grow a layer of super hydrophilic zinc oxide (ZnO) nanoneedle array on the surface of the QCM electrode. Through this ingenious design, a novel and fast response humidity sensor was fabricated. The research results proved that while the ZnO material had poor hydrophilicity, the ZnO nanoneedle array possessed high hydrophilicity. This phenomenon could be attributed to the morphology-dependent sensor characteristics. The surface energy of the material was decreased by the unique structure, which facilitated the adsorption of water molecules [19]. Lomas et al. coated a polyaniline (PANI) nanoscale film made of micro-nano dots on a QCM sensor by electrospinning technology [24]. These studies demonstrated that QCM humidity sensors with excellent performance could be achieved through sophisticated design. Among many potential materials, polydopamine (PDA), as a self-polymerizing biomolecular material, contained a variety of hydrophilic groups (such as hydroxyl, amino, etc.), so it had a strong adsorption capacity for water molecules. However, it should not be ignored that the electrical conductivity of PDA film in general environments was weak, which led to many difficulties when it was used in combination with resistance or capacitance sensor [25]. Therefore, PDA materials were used to load on QCM sensors to prepare high-performance humidity sensors [26,27,28]. For example, Zhang et al. proposed a method to cover QCM with PDA-GO nanocomposite membrane to achieve accurate humidity detection, which was even expected to be applied to human respiration and health monitoring [29]. Wang et al. prepared a fast response QCM humidity sensor by crosslinking PDA and PEI to form N-rich functional polymer (PDA-PEI) and uniformly modifying porous polypropylene microfiltration membrane (PPMM) [19]. It has been noted that PDA was rarely employed as a single sensitive material and was typically used as a secondary reaction platform or composite with other materials. This might be due to the poor performance of pure PDA modified QCM sensors made by conventional drip or spin coating. In this work, we sought to build a highly sensitive and quick response QCM humidity sensor using in situ growing technology and pure PDA sensing film in order to preserve the remarkable properties of PDA.

2. Experimental

2.1. Materials and Detection System

Hydrochloric acid (HCL, 36.0–38.0%), acetone (99.5%) and ethanol (99.8%) were purchased from China National Pharmaceutical Group Co., Ltd (Beijing, China). 3-Hydroxytyramine hydrochloride (98%) was purchased from Aladdin (Shanghai, China). Tri(Hydroxymethyl) Amino Methane Hydrochloride (Tris, >99.9%) was purchased from Beijing Mengyimei Biotechnology Co., Ltd. All the experimental reagents were analytical grade and used as received. Moreover, deionized water was used in all experiments.
QCM sensor substrates were purchased from CHENJING Electronics Beijing Co., Ltd (Beijing, China). The substrate was made up of a round AT-cut piezoelectric crystal with two pre-deposited silver electrodes on either side. All QCM sensor substrates had a working frequency of 10 MHz. The QCM sensor substrates should be sequentially cleaned for 10 min in an ultrasonic bath using ethanol, acetone, and deionized water, then placed in a container of discolored silica gel and dried overnight at room temperature.
The schematic diagram of the QCM sensor humidity detection system was shown in Figure 1. Different RH conditions in the detection system were set up by using different kinds of supersaturated salt solutions [30,31]. One end of the self-made vibration starting circuit was connected to the modified QCM humidity sensor, and the other end was connected to the high precision frequency meter (53131A, Agilent) to monitor the oscillation frequency of QCM in real time. In addition, QCM sensor was also connected with an impedance analyzer (4294A, Agilent), and the admittance spectrum of QCM in the resonant range was recorded by frequency sweep to obtain the electroacoustic parameters of the sensor.

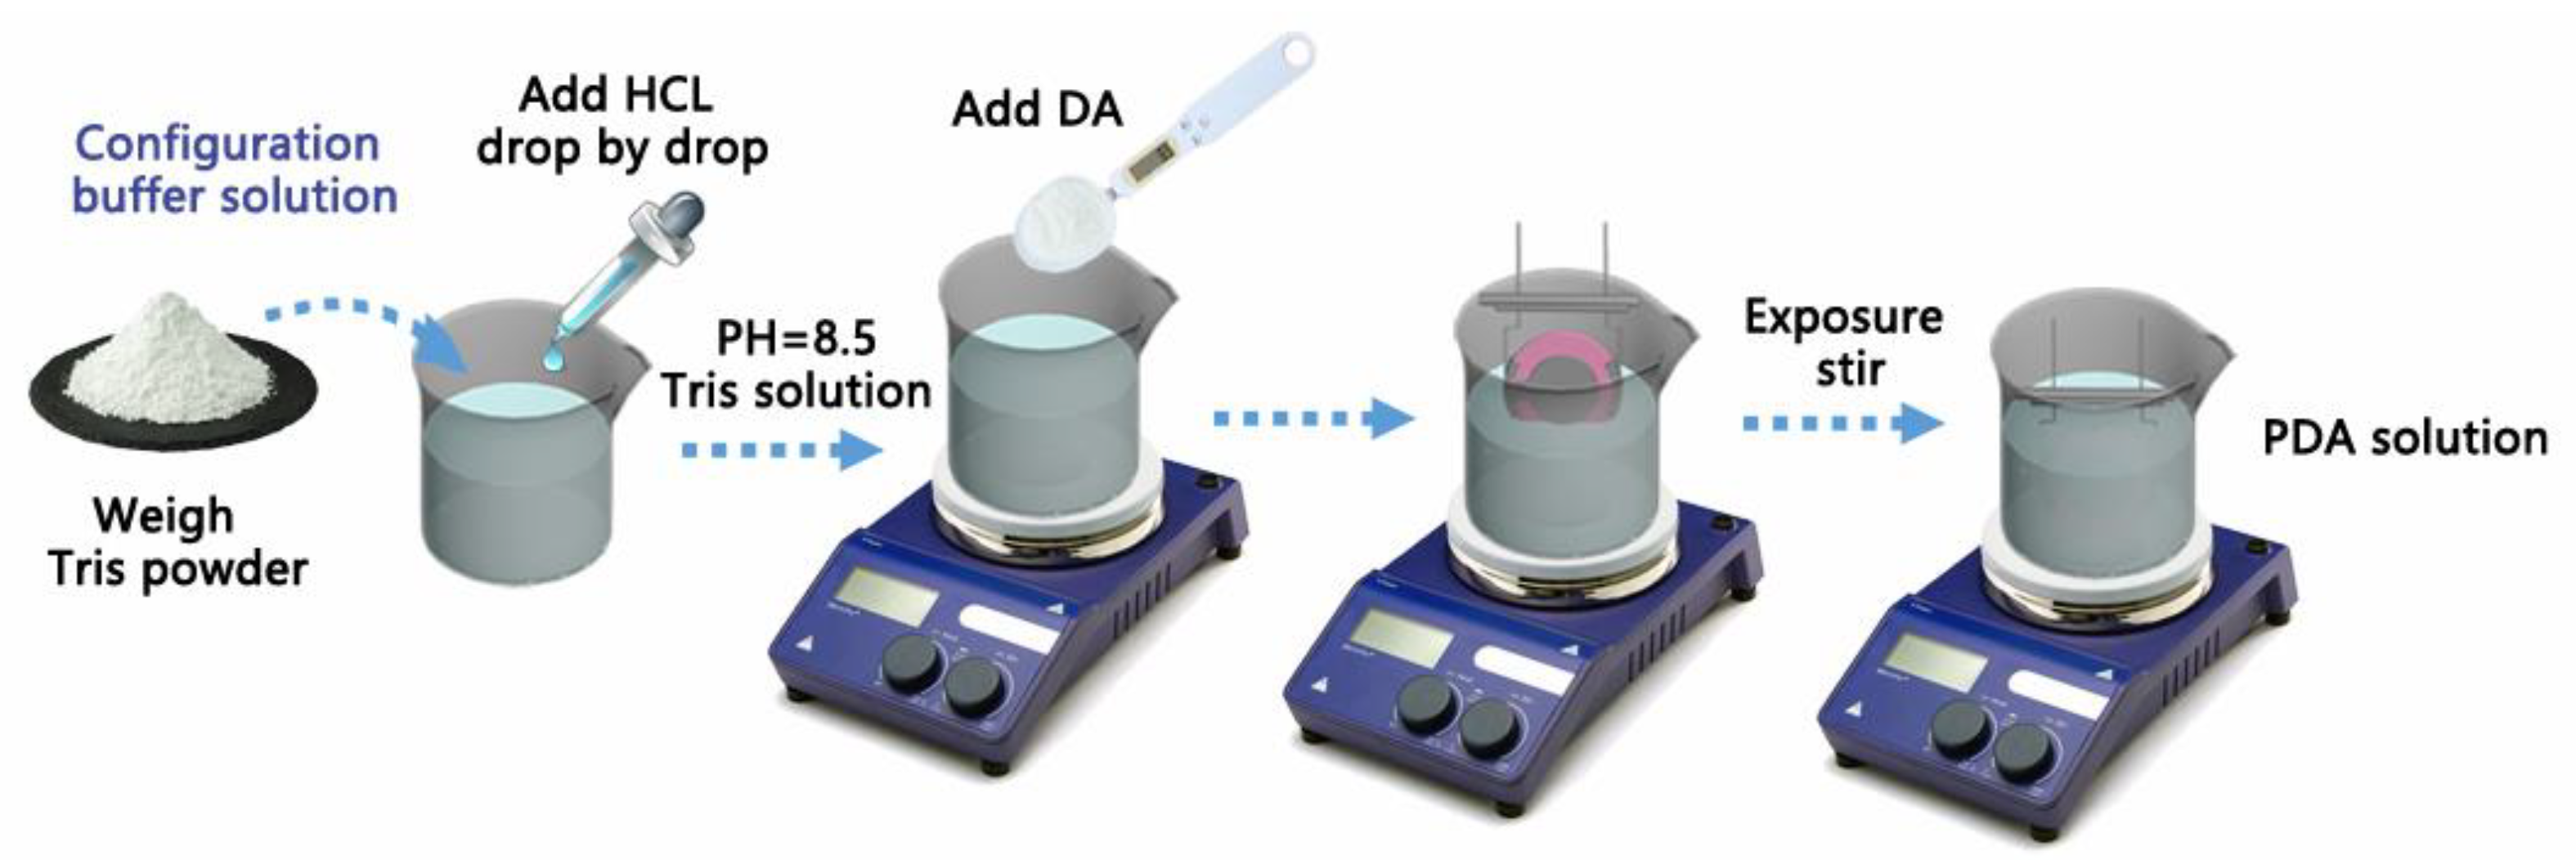
2.2. Material Synthesis and Sensor Preparation

The synthesis of polydopamine (PDA) was a kind of polymer which was self-polymerized by using dopamine hydrochloride (DA) as a polymeric monomer in buffer solution [32]. The detailed material synthesis and sensor fabrication steps were shown in Figure 2.
Firstly, 0.1211 g of tris powder was dissolved in 100 mL of deionized water. Then, HCL was added drop-by-drop until the pH value of the mixed solution reached 8.5 to obtain 10 mmol/L Tris-HCl buffer solution which was most suitable for DA oxidation polymerization. Further, 200 mg of DA powder was weighed and slowly added to the buffer. Finally, the PDA material can be obtained by placing it on the electronic stirring table. During the stirring process, the pre-treated blank QCM sensor substrate was immersed in the buffer solution, and PDA was continuously deposited on the surface of QCM with the polymerization process. It is important to notice that the stirring speed at this time should not be too fast. On the one hand, because the QCM sensor was made by in situ polymerization (as illustrated in Figure 2), an excessive stirring speed would create a vortex in the solution center, thus exposing a portion of the sensor. On the other hand, a mixing speed that is too fast would make the mixing magnet jump or vibrate, which might cause it to collide with the sensor and lose its mixing effect. Furthermore, excessively quick stirring might speed up the polymerization process or raise the temperature of the reaction [33]. After the reaction, the QCM was removed from the reaction solution, and the excess sensitive material outside the electrode was wiped off with alcohol. Then, the QCM with sensing materials was placed in a drying oven and allowed to dry overnight at room temperature. This step was necessary to ensure that the sensor was in the best possible condition before being tested, and that it would not be overly disturbed by external environmental influences (such as the inevitable ambient humidity). According to the different reaction times, the PDA-QCM humidity sensors with polymerization growth times of 1 h, 1.5 h, 2 h, 2.5 h, 3 h, 3.5 h and 4 h were obtained and named 1-PDA-QCM, 1.5-PDA-QCM, 2-PDA-QCM, 2.5-PDA-QCM, 3-PDA-QCM, 3.5-PDA-QCM and 4-PDA-QCM, respectively.

2.3. Characterization

The field emission scanning electron microscopy (FESEM) images of the prepared materials were taken by a JEOL JSM-6700F microscope (Tokyo, Japan) which operated at 15 kV. The Fourier transform infrared (FT-IR) spectra of the prepared materials were obtained on a WQF-510AFTIR spectrometer. The KBr pellet was used as reference and scanned in the range of 400–4000 cm−1.

3. Results and Discussion

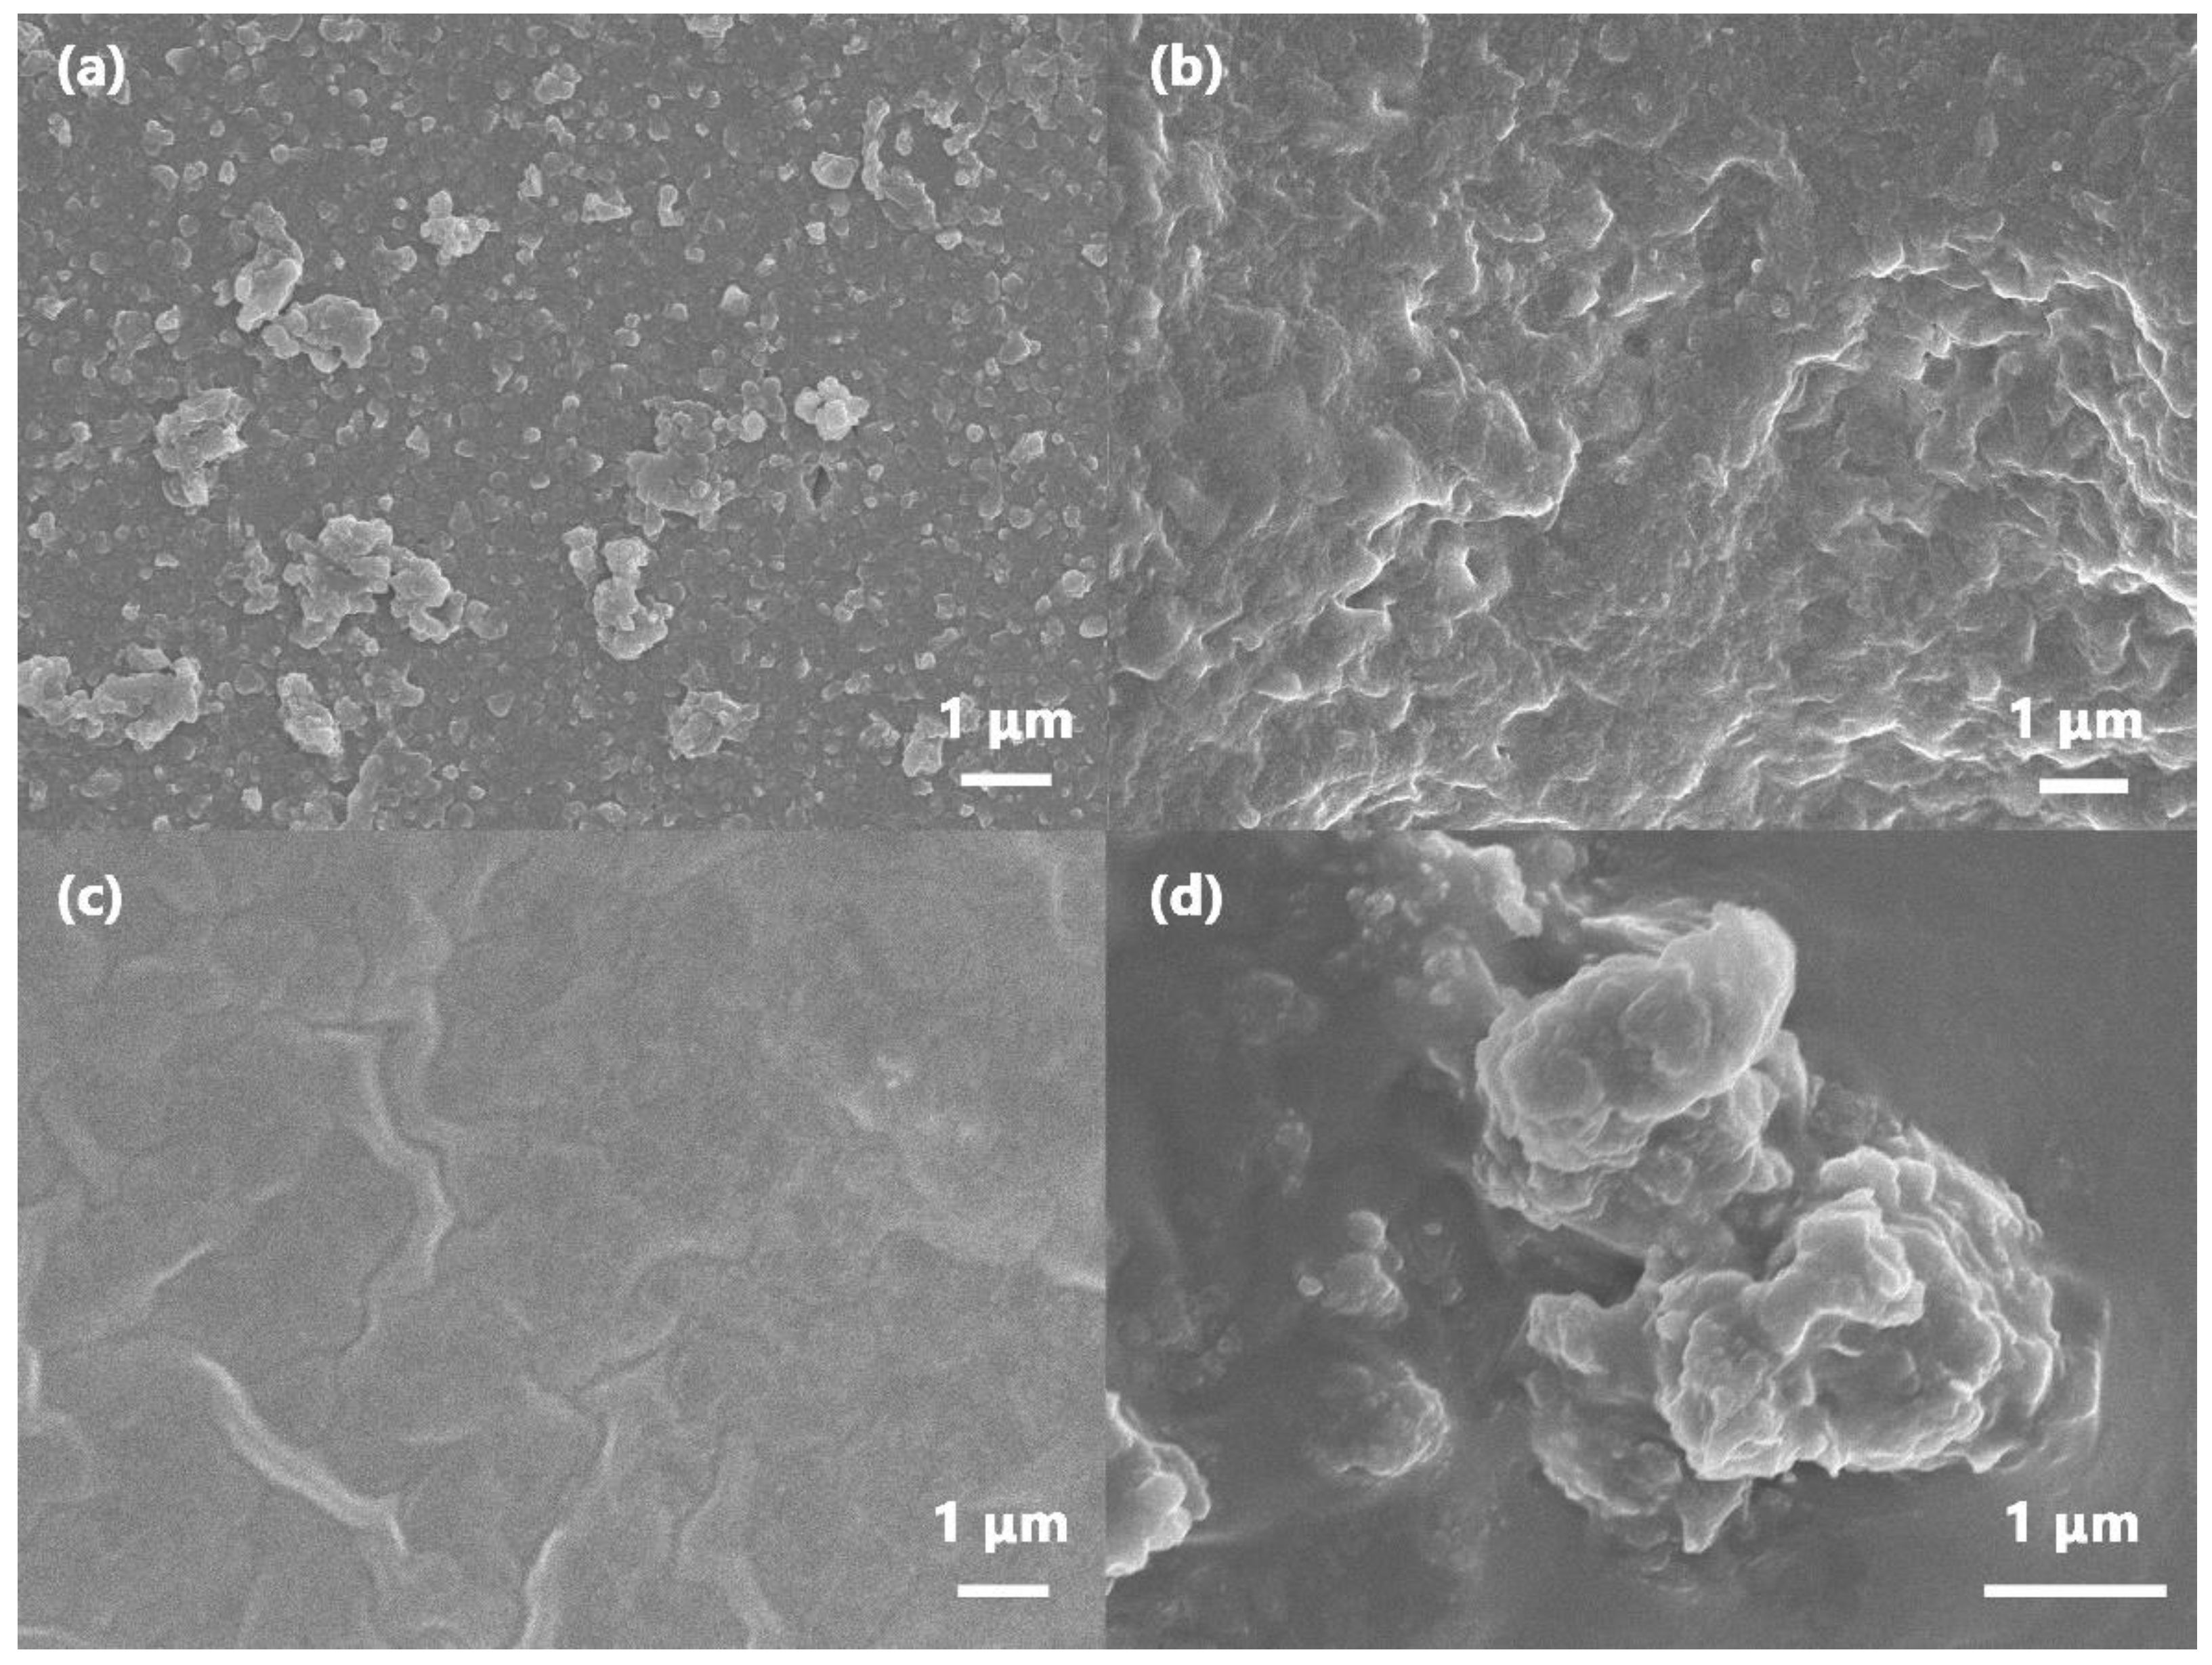
3.1. Structural and Morphological Characteristics

The synthesized PDA material was tested by FT-IR to identify the surface functional groups. As shown in Figure 3, the slightly wider band located around 3400 cm−1 corresponds to the stretching vibration of hydroxyl (O-H) and amino (N-H) groups. The bands nearing 1602 cm−1 and 1500 cm−1 correspond to the skeleton vibration of the aromatic ring carried by the PDA and the vibration between N-H within the -NH2 group. The absorption peak at 1268 cm−1 corresponds to C-O stretching vibration. The above results were basically consistent with the previous reports [34], which indicated that we have successfully synthesized PDA materials, and no other impurities were mixed in the reaction process.
The SEM images of PDA polymerized with different reaction times were shown in Figure 4. It can be found that when the polymerization time was about 0.5 h, the obtained material was mainly composed of particles of different sizes, which were nearly round in size and different in size. When the reaction time gradually increased, the existence of single particles gradually decreased, and the material particles began to stack gradually. When the reaction time reached 2 h, the surface of the sensitive film tended to be smooth, and the material accumulation was relatively flat. When the polymerization time reached 4 h, the surface of the film became no longer uniform, and a large number of particles accumulated on PDA due to agglomeration, which was detrimental to the uniform distribution of sensitive materials. Because the QCM sensor was worked in vibration mode, the non-uniform sensitive film would bring great negative impact to the sensor, and even lead to non-vibration of the QCM sensor [35].

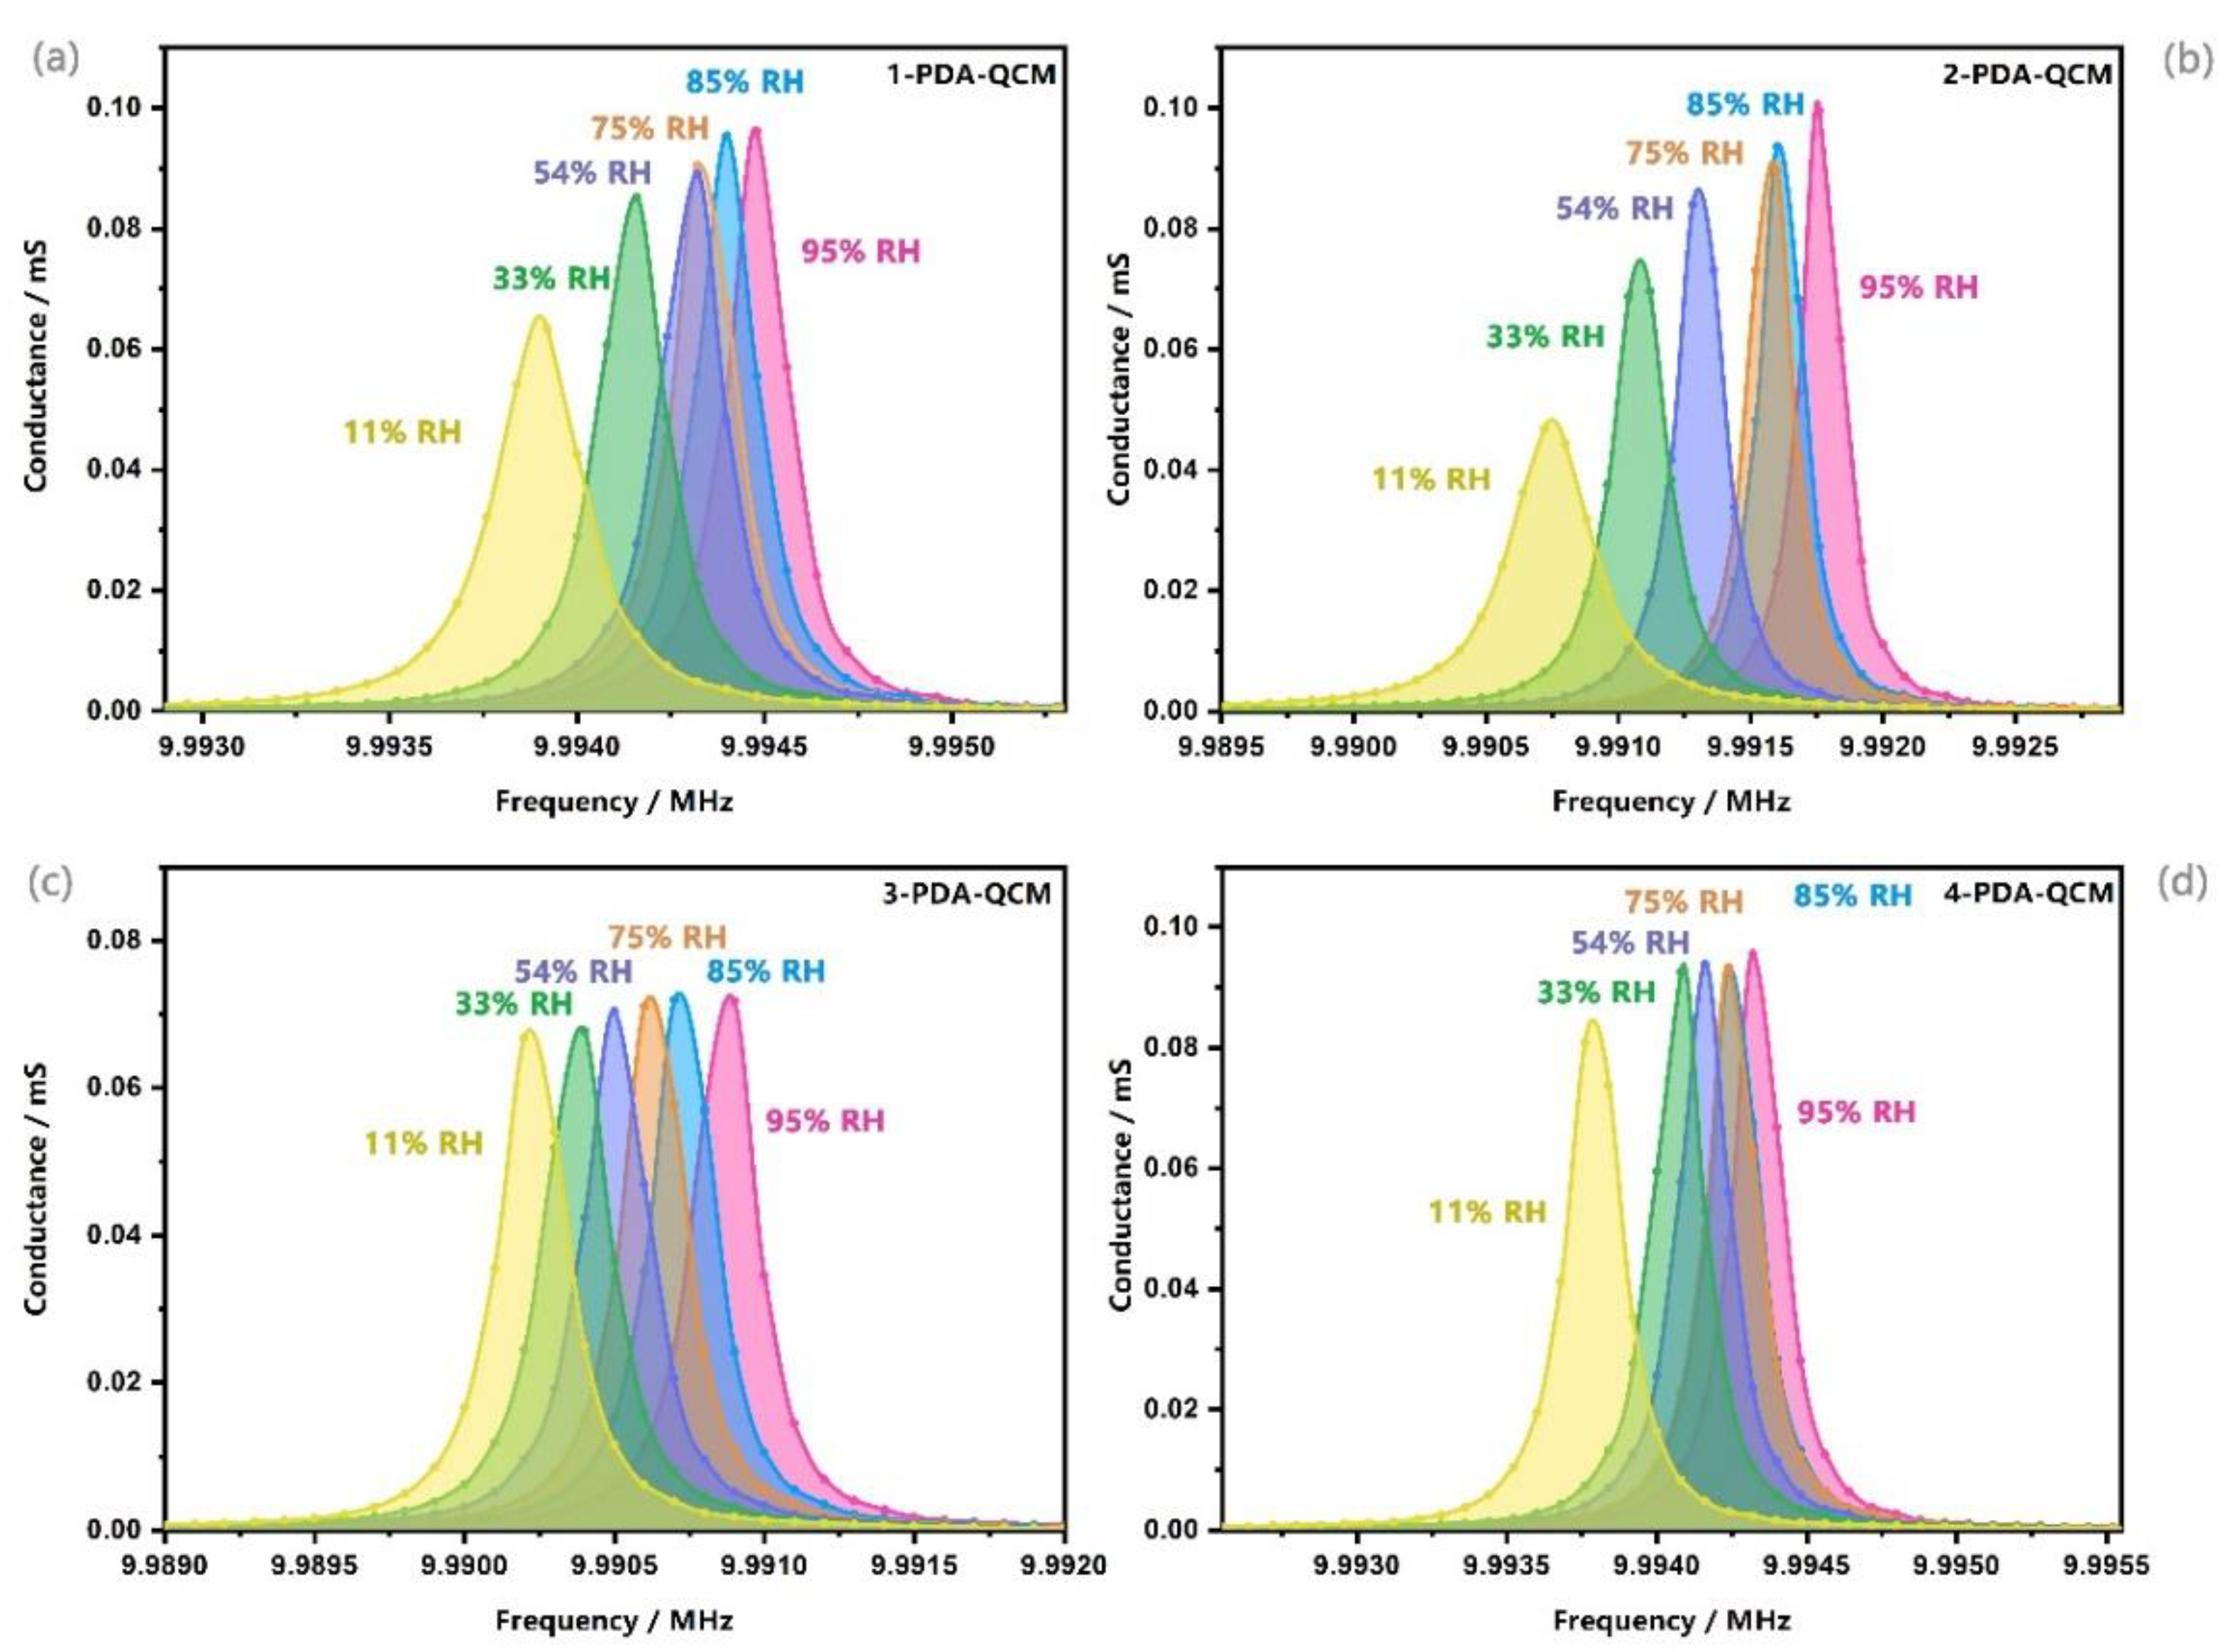
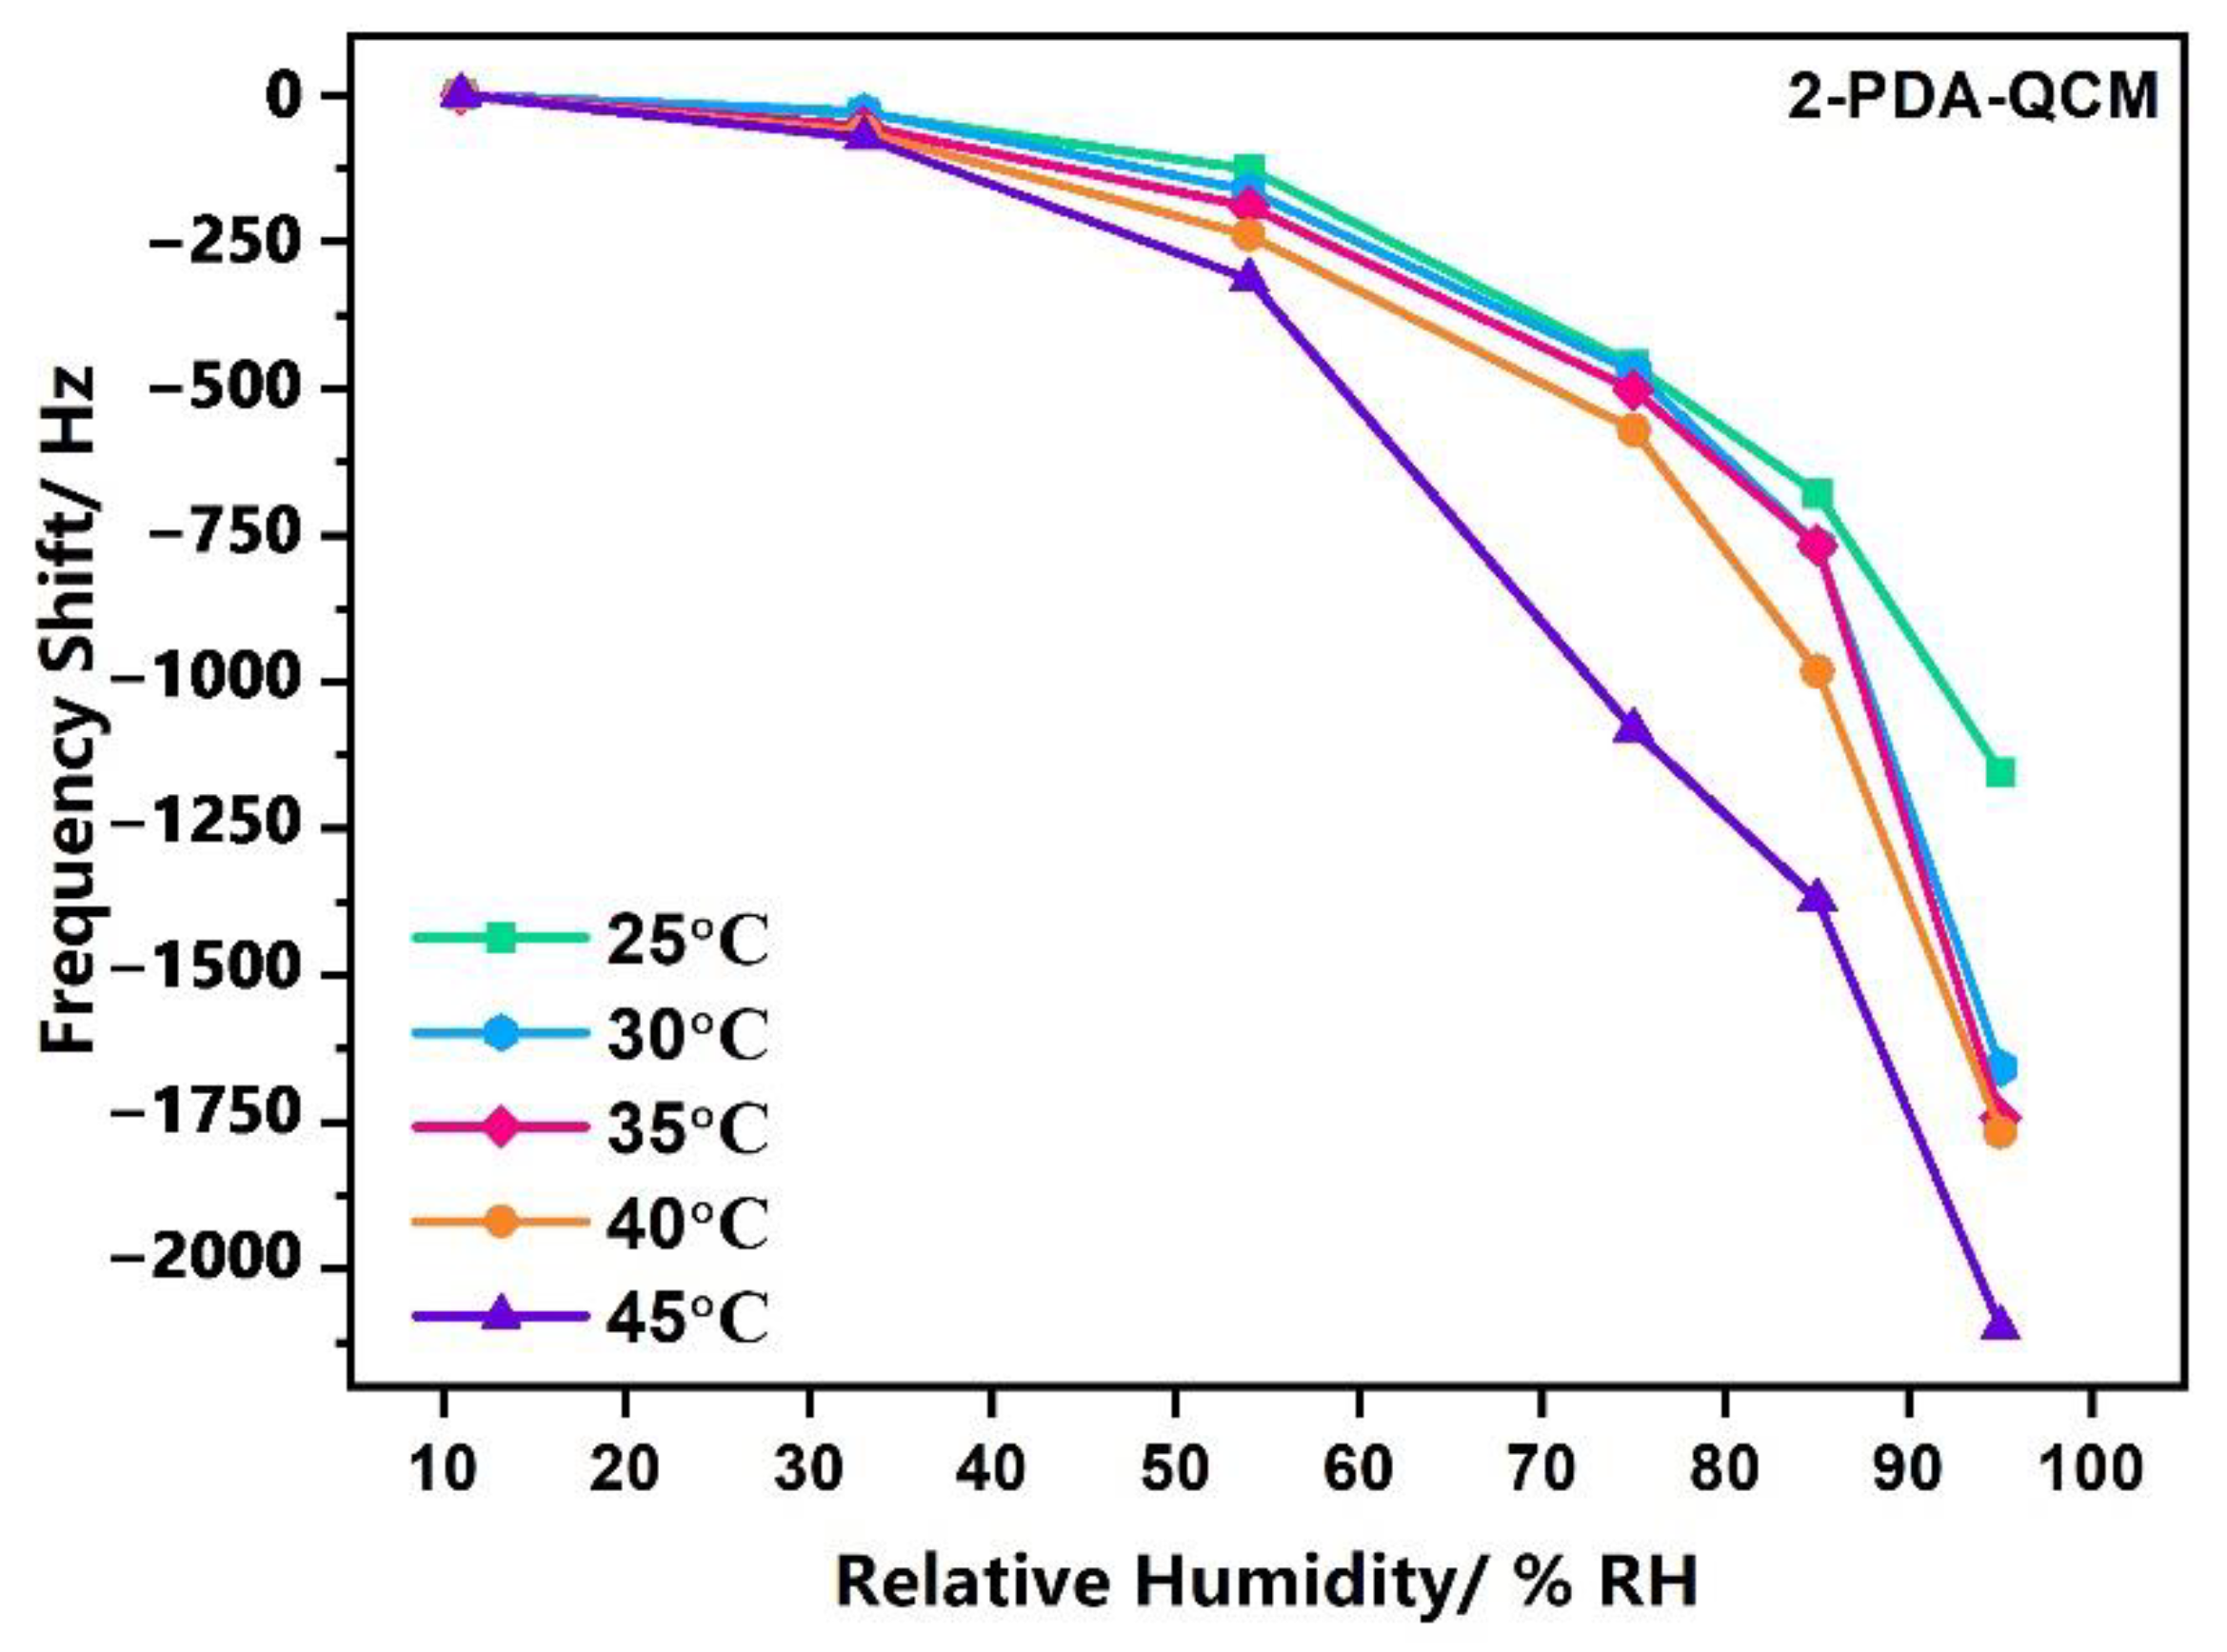
3.2. Humidity Sensing Properties of the QCM Humidity Sensors

The frequency response curves of different PDA-QCM humidity sensors with in situ growth time from 1 h to 4 h were tested in the range of 11% RH to 95% RH. The test results were shown in Figure 5.
Firstly, the tested sensor was placed in the 11% RH condition, and the test was officially started when the output frequency was stable and unchanged. When the test curve at 11% RH was relatively stable, we quickly transferred the tested sensor to the other humidity bottle. When the test curve stabilized again, it needed to be quickly restored to 11% RH. The humidity bottles were replaced one by one until each humidity condition was detected. It can be seen from the detection results that when the ambient RH gradually increased, more and more water molecules would be absorbed by the sensitive film, which led to an increase in the overall quality of the sensor, so the frequency shift of the sensor would change accordingly. In addition, when the humidity was changed under test conditions to 11% RH, all sensors showed good desorption performance. It was found that the frequency shift of the sensor increased first and then decreased with the film preparation time. Among all the sensors, 2-PDA-QCM owned the highest frequency shift in all humidity conditions, and the optimal response was 20.77 Hz/% RH. The above test results were consistent with the SEM characterization results. The time of DA polymerization had a great influence on the morphology of the sensitive film, so it directly affected the humidity sensitive characteristics of the sensor. Polymerization time was not better with a longer processing time. Rather, the appropriate polymerization time could result in the best performance from the sensitive film, so as to obtain the best QCM sensor.
Next, the response/recovery times of the humidity sensors at different in situ growth times were tested when conditions were changed from 11% RH to 95% RH. Each sensor was tested several times and the average value was taken. The final results were summarized in Table 1. It can be found that both the response and recovery times of 2-PDA-QCM humidity sensor were significantly shorter than others, which indicates that faster response and recovery speeds are conducive to the actual detection application. In addition, the deposition mass of PDA on QCM sensor electrode at different growth times was calculated according to Sauerbrey equation and is shown in Table 1 [36].
After all the sensors were tested by oscillatory circuit method, the impedance characteristics of the sensors were also tested and analyzed. In this work, the admittance (GB) curve of the sensor was obtained by impedance analyzer. In an impure resistance circuit, due to the presence of nonlinear elements, the admittance Y will have virtual and real parts: Y = G + jB, where G was the conductance and constituted the real part value; B was the susceptance and constituted the imaginary part value. Admittance analysis was also a common analysis spectrum in electrical analysis. The G-B spectra of the PDA-QCM humidity sensors in situ grown for different times in the experiment were shown in Figure 6.
It can be found that with an increase in RH, the central frequency value f0 (the abscissa corresponded to the highest point of the curve) of the curve decreased continuously, which indicates that the output frequency of the QCM humidity sensor decreased continuously. This result was consistent with the variation trend of the frequency response curve measured by the circuit method. During the test, the instrument could calculate the corresponding half band width (HBW), quality factor (Q) and equivalent resistance value (R0) in real time. Where HBW was the difference of the abscissa corresponded to half of the maximum ordinate value in each G-B curve, and the unit was Hz. The ratio between f0 and HBW was Q, which represented the performance of the sensor during operation. The stability and performance of the sensor will be impacted by the diminished Q value because it indicated the energy loss of QCM sensor. On the contrary, a larger value of Q indicated a smaller sensor loss. R0 was the equivalent resistance value calculated during QCM operation. The smaller R0 was, the smaller power consumption required by the sensor, which was more conducive to practical application [37,38].
The relevant test values of PDA-QCM humidity sensors in situ grown at different times were summarized in Table 2. Through the observation of the four sensors, it could be found that with the RH increased, their HBW gradually broadened, Q value gradually decreased, and R0 continuously increased. The Q value of the same QCM sensor decreased with the increase in RH, which meant that more and more water molecules were adsorbed on the surface of the QCM sensor, accompanied by inevitable mechanical loss. However, such was a normal phenomenon and would not affect the detection of QCM sensor within a reasonable range. The changing of 2-PDA-QCM humidity sensor was obvious, which because it had the strongest interaction with water molecules and better humidity sensitivity.
Based on the above test results, it can be concluded that the comprehensive performance of the PDA-based QCM humidity sensor grown in situ for 2 h was the best. The results of SEM characterization and film mass showed that the polymerization time of PDA had a great influence on the film performance. When the polymerization time was too short, the monomer material had not been completely polymerized, and the film formed on the surface of QCM electrode was not uniform and smooth enough. However, when the reaction time was too long, the polymeric materials would stack and form aggregates, and the over-thick sensitive film was easy to be out of sync with the vibration of QCM during the vibration process, thus affected the performance of the sensor [22,23,24]. In conclusion, 2 h was the appropriate growth time for QCM humidity sensor. Next, the 2-PDA-QCM humidity sensor was further tested for sensing performance to humidity.
The frequency response curves of the 2-PDA-QCM humidity sensor from 11% RH to 95% RH in the temperature range from 25 °C to 45 °C were tested, and the results were shown in Figure 7. The results showed that the frequency shifts of the sensor increased with the increase in temperature. When the temperature has risen to 45 °C, the frequency shift of the sensor would increase significantly, and the change of the frequency shift of the sensor was not very big when the temperature around 25 °C. Therefore, although the high temperature resistance of the sensor still needs to be further improved, the output frequency shift of the QCM humidity sensor was relatively stable for common humidity detection at room temperature.
In the actual use of the sensor, the presence of other interfering gases might affect the test results. In this experiment, ethanol, ammonia, acetone, methanol, formaldehyde and benzene with a concentration of 500 PPM were selected as interference gases. Figure 8 compared the frequency shifts of 2-PDA-QCM humidity sensor to several interfering gases, 33% RH and 95% RH. From the results, the frequency shift of the sensor to humidity was significantly better than other interfering gases, which indicated that the sensor owned acceptable selectivity. Because the QCM sensor could work at room temperature, it should be emphasized that the majority of the adsorption of target molecules occurred by physical adsorption. Additionally, the rate of adsorption and desorption was rather quick and could be entirely desorbed. However, because of these features, the sensor would respond to some interference targets. Therefore, it is still worthwhile to investigate the issue of sensor cross-sensitivity for future applications.
In order to evaluate the repeatability of the QCM humidity sensor, the 2-PDA-QCM was periodically and repeatedly exposed to 11% and 95% RH. As shown in Figure 9, the sensor has good repeatability in five cycles of testing.
The stability of 2-PDA-QCM humidity sensor was tested for up to 30 days. The same frequency response curve was tested on the same sensor at intervals, and the specific values were recorded in Table 3. It can be found that the humidity sensitivity of 2-PDA-QCM sensor was difficult to maintain a stable level after 30 days. Therefore, the modification of sensitive film or the preservation mode of sensor is a problem that needs to be further explored and improved.
The performance of the QCM humidity sensor in this work and reported work, which QCM modified by other materials, were summarized in Table 4 for comparison. From the comparison results, it can be seen among QCM humidity sensors modified with various monomer materials, that the device made in this work had better performance, such as superior sensitivity and short response/recovery times.

4. Discussion

The working principle of QCM humidity sensor based on PDA humidity sensitive material was mainly to use the hydrophilic groups (amino group, hydroxyl group, etc.) of the humidity sensitive material itself to adsorb water molecules reversibly. The substrate was immersed in an alkaline aqueous solution of dopamine, and PDA coating spontaneously formed on the surface of the substrate after several minutes to hours. The schematic diagram is shown in Figure 10.
Through hydrogen bonding, a large amount of water molecules were adsorbed by the humidity sensitive material in high humidity conditions, which resulted in an increase in the mass of the sensitive material and a decrease in the output frequency of the sensor. After changing to relatively low humidity conditions, the humidity sensitive material would release part of the adsorbed water molecules, the mass of the sensor load was reduced, and the output frequency of the sensor was correspondingly increased. Combining the SEM characterization results and the sensor frequency response curves, it can be found that when the polymerization time was short, only a small amount of PDA was wrapped on the QCM surface, so the sensor response was lower. The sensitive film on the QCM surface tended to be flat when the time was raised to 2 h, and the wet-sensitive characteristics of the sensor are at their best. However, the film would no longer be smooth and might even exhibit stacking phenomenon as the reaction time increases, which would have a significant negative influence on sensor performance.

5. Conclusions

In this work, the PDA-QCM humidity sensor was fabricated by in situ growth method, using dopamine (DA) as the self-polymerizing monomer, and the biomolecular material polydopamine (PDA) with strong hydrophilic and adsorptive properties was synthesized on the surface of QCM electrode. The effect of self-polymerization time on the sensor was studied by controlling in situ growth time. The results showed that the 2-PDA-QCM humidity sensor with 2 h in situ growth obtain optimal performance, such as excellent sensitivity (20.77 Hz/% RH), short response and recover time (5 s/11 s) and appreciable selectivity. Finally, our work demonstrates that PDA is a potential and suitable material for humidity detection when combined with QCM sensors. In addition, in situ growth method is a feasible method to fabricate PDA-based sensors. However, it should be noted that the time of in situ growth is the main factor which determines the characteristics of the sensor and different reaction times have a great influence on the microstructure of the sensitive films.

Author Contributions

Conceptualization, P.Q., Z.X. and T.Z.; Data curation, P.Q. and Z.X.; Formal analysis, P.Q. and Z.X.; Funding acquisition, P.Q.; Investigation, P.Q. and Z.X.; Methodology, P.Q., Z.X. and T.Z.; Resources, Z.X.; Supervision, T.Z.; Validation, P.Q. and Z.X.; Visualization, P.Q.; Writing—original draft, P.Q.; Writing—review & editing, P.Q. All authors have read and agreed to the published version of the manuscript.

Funding

This research was funded by Zhejiang Provincial Natural Science Foundation, grant number LQ22F010006 and Science Foundation of Zhejiang Sci-Tech University (ZSTU), grant number 20032311-Y.

Institutional Review Board Statement

Not applicable.

Informed Consent Statement

Not applicable.

Data Availability Statement

Please choose an option based on your paper.

Conflicts of Interest

The authors declare no competing financial interest. The manuscript is approved by all authors for publication. I would like to declare on behalf of my co-authors that the work described was original research that has not been published previously, and not under consideration for publication elsewhere, in whole or in part.

References

  1. Dessler, E.; Sherwood, S.C. A matter of humidity. Science 2009, 323, 1020–1021. [Google Scholar] [CrossRef] [PubMed]
  2. Alwis, L.; Sun, T.; Grattan, K.T.V. Optical fibre-based sensor technology for humidity and moisture measurement: Review of recent progress. Measurement 2013, 46, 4052–4074. [Google Scholar] [CrossRef]
  3. Kulwicki, B.M. Humidity sensors. J. Am. Ceram. Soc. 1991, 74, 697–708. [Google Scholar] [CrossRef]
  4. Duan, Z.; Jiang, Y.; Tai, H. Recent advances in humidity sensors for human body related humidity detection. J. Mater. Chem. C 2021, 9, 14963–14980. [Google Scholar] [CrossRef]
  5. Blank, T.A.; Eksperiandova, L.P.; Belikov, K.N. Recent trends of ceramic humidity sensors development: A review. Sens. Actuators B Chem. 2016, 228, 416–442. [Google Scholar] [CrossRef]
  6. Farahani, H.; Wagiran, R.; Hamidon, M.N. Humidity sensors principle, mechanism, and fabrication technologies: A comprehensive review. Sensors 2014, 14, 7881–7939. [Google Scholar] [CrossRef] [Green Version]
  7. Najjar, R.; Nematdoust, S. A resistive-type humidity sensor based on polypyrrole and ZnO nanoparticles: Hybrid polymers visa-vis nanocomposites. RSC Adv. 2016, 6, 112129–112139. [Google Scholar] [CrossRef]
  8. Yang, T.; Yu, Y.; Zhu, L.; Wu, X.; Wang, X.; Zhang, J. Fabrication of silver interdigitated electrodes on polyimide films via surface modification and ion-exchange technique and its flexible humidity sensor application. Sens. Actuators B Chem. 2014, 208, 327–333. [Google Scholar] [CrossRef]
  9. Duan, Z.H.; Zhao, Q.N.; Wang, S.; Huang, Q.; Yuan, Z.; Zhang, Y.J.; Jiang, Y.D.; Tai, H.L. Halloysite nanotubes: Natural, envi-ronmental-friendly and low-cost nanomaterials for high-performance humidity sensor. Sensor Actuators B Chem. 2020, 317, 128204. [Google Scholar] [CrossRef]
  10. Qi, P.J.; Xu, Z.W.; Zhou, T.T.; Zhang, T.; Zhao, H.R. Study on a quartz crystal microbalance sensor based on chitosan-functionalized mesoporous silica for humidity detection. J. Colloid Interf. Sci. 2021, 583, 340–350. [Google Scholar] [CrossRef]
  11. Wang, L.; Xu, J.; Wang, X.; Cheng, Z.; Xu, J. Facile preparation of N-rich functional polymer with porous framework as QCM sensing material for rapid humidity detection. Sens. Actuators B Chem. 2019, 288, 289–297. [Google Scholar] [CrossRef]
  12. Rianjanu, A.; Fauzi, F.; Triyana, K.; Wasisto, H.S. Electrospun Nanofibers for Quartz Crystal Microbalance Gas Sensors: A Review. ACS Appl. Nano Mater. 2021, 10, 9957–9975. [Google Scholar] [CrossRef]
  13. Ayankojo, A.G.; Reut, J.; Boroznjak, R.; Öpik, A.; Syritski, V. Molecularly imprinted poly(meta-phenylenediamine) based QCM sensor for detecting Amoxicillin. Sens. Actuators B Chem. 2018, 258, 766–774. [Google Scholar] [CrossRef]
  14. Li, Z.J.; Teng, M.Z.; Yang, R.H.; Lin, F.Y.; Fu, Y.; Lin, W.Q.; Zheng, J.D.; Zhong, X.P.; Chen, X.D.; Yang, B.; et al. Sb-doped WO3 based QCM humidity sensor with self-recovery ability for real-time monitoring of respiration and wound. Sensor Actuators B Chem. 2022, 361, 131691. [Google Scholar] [CrossRef]
  15. Addabbo, T.; Fort, A.; Mugnaini, M.; Vignoli, V.; Baldi, A.; Bruzzi, M. Quartz-Crystal Microbalance Gas Sensors Based on TiO2Nanoparticles. IEEE Trans. Instrum. Meas. 2018, 67, 722–730. [Google Scholar] [CrossRef]
  16. Fauzi, F.; Rianjanu, A.; Santoso, I.; Triyana, K. Gas and humidity sensing with quartz crystal microbalance (QCM) coated with graphene-based materials–A mini review. Sens. Actuators A Phys. 2021, 330, 112837. [Google Scholar] [CrossRef]
  17. Xie, J.; Wang, H.; Lin, Y.; Zhou, Y.; Wu, Y. Highly sensitive humidity sensor based on quartz crystal microbalance coated with ZnO colloid spheres. Sens. Actuators B Chem. 2012, 177, 1083–1088. [Google Scholar] [CrossRef]
  18. Zhu, Y.; Chen, J.; Li, H.; Zhu, Y.; Xu, J. Synthesis of mesoporous SnO2–SiO2 composites and their application as quartz crystal microbalance humidity sensor. Sens. Actuators B Chem. 2014, 193, 320–325. [Google Scholar] [CrossRef]
  19. Cha, X.; Yu, F.F.; Fan, Y.; Chen, J.F.; Wang, L.Y.; Xiang, Q.; Duan, Z.M.; Xu, J.Q. Superhydrophilic ZnO nanoneedle array: Controllable in situ growth on QCM Transducer and enhanced humidity sensing properties and mechanism. Sensor Actuators B Chem. 2018, 263, 436–444. [Google Scholar] [CrossRef]
  20. Wang, S.; Xie, G.; Su, Y.; Su, L.; Zhang, Q.; Du, H.; Tai, H.; Jiang, Y. Reduced graphene oxide-polyethylene oxide composite films for humidity sensing via quartz crystal microbalance. Sens. Actuators B Chem. 2018, 255, 2203–2210. [Google Scholar] [CrossRef]
  21. Li, X.; Chen, X.; Yao, Y.; Li, N.; Chen, X.; Bi, X. Multi-Walled Carbon Nanotubes/Graphene Oxide Composites for Humidity Sensing. IEEE Sens. J. 2013, 13, 4749–4756. [Google Scholar] [CrossRef]
  22. Yao, Y.; Chen, X.; Li, X.; Chen, X.; Li, N. Investigation of the stability of QCM humidity sensor using graphene oxide as sensing films. Sens. Actuators B Chem. 2014, 191, 779–783. [Google Scholar] [CrossRef]
  23. Yuan, Z.; Tai, H.L.; Ye, Z.B.; Liu, C.H.; Xie, G.Z.; Du, X.S.; Jiang, Y.D. Novel highly sensitive QCM humidity sensor with low hysteresis based on graphene oxide (GO)/poly(ethyleneimine) layered film. Sens. Actuators B Chem. 2016, 234, 145–154. [Google Scholar] [CrossRef]
  24. Jaruwongrungsee, K.; Tuantranont, A.; Wanna, Y.; Wisitsoraat, A.; Lomas, T. Quartz Crystal Microbalance humidity sensor using electrospun PANI micro/nano dots. IEEE Int. Conf. Nanotechnol. 2007, 7, 316–319. [Google Scholar]
  25. Wang, L.; Gao, J.; Xu, J. QCM formaldehyde sensing materials: Design and sensing mechanism. Sens. Actuators B Chem. 2019, 293, 71–82. [Google Scholar] [CrossRef]
  26. Tang, L.; Chen, W.; Chen, B.; Lv, R.; Zheng, X.; Rong, C.; Lu, B.; Huang, B. Sensitive and renewable quartz crystal microbalance humidity sensor based on nitrocellulose nanocrystals. Sens. Actuators B Chem. 2020, 327, 128944. [Google Scholar] [CrossRef]
  27. Chen, W.X.; Chen, B.; Lv, R.X.; Wu, M.L.; Zhou, J.; Lu, B.L.; Huang, B.; Lu, Q.L.; Tang, L.R. Fabrication of quartz crystal microbalance humidity sensors based on super-hydrophilic cellulose nanocrystals. Cellulose 2021, 28, 3409–3421. [Google Scholar] [CrossRef]
  28. Yao, Y.; Huang, X.; Chen, Q.; Zhang, Z.; Ling, W. High Sensitivity and High Stability QCM Humidity Sensors Based on Polydopamine Coated Cellulose Nanocrystals/Graphene Oxide Nanocomposite. Nanomaterials 2020, 10, 2210. [Google Scholar] [CrossRef]
  29. Zhang, D.; Song, X.; Wang, Z.; Chen, H. Ultra-highly sensitive humidity sensing by polydopamine/graphene oxide nanostructure on quartz crystal microbalance. Appl. Surf. Sci. 2020, 538, 147816. [Google Scholar] [CrossRef]
  30. Jiang, H.; Tang, L. Uniformization of QCM’s mass sensitivity distribution by optimizing its metal electrode configurations. IEEE Sens. J. 2021, 21, 9008–9015. [Google Scholar] [CrossRef]
  31. Zhao, H.; Zhang, T.; Qi, R.; Dai, J.; Liu, S.; Fei, T.; Lu, G. Development of solution processible organic-inorganic hybrid materials with core-shell framework for humidity monitoring. Sens. Actuators B Chem. 2018, 255, 2878–2885. [Google Scholar] [CrossRef]
  32. Qi, P.; Zhao, C.; Wang, R.; Fei, T.; Zhang, T. High-Performance QCM Humidity Sensors Using Acidized-Multiwalled Carbon Nanotubes as Sensing Film. IEEE Sens. J. 2018, 18, 5278–5283. [Google Scholar] [CrossRef]
  33. Ho, C.C.; Ding, S.J. The pH-controlled nanoparticles size of polydopamine for anti-cancer drug delivery. J. Mater. Sci-Mater. M. 2013, 24, 2381–2390. [Google Scholar] [CrossRef] [PubMed]
  34. Lee, H.; Dellatore, S.M.; Miller, W.M.; Messersmith, P.B. Mussel-Inspired Surface Chemistry for Multifunctional Coatings. Science 2007, 5849, 426–430. [Google Scholar] [CrossRef] [PubMed] [Green Version]
  35. Chen, F.; Xing, Y.X.; Wang, Z.Q.; Zheng, X.Y.; Zhang, J.X.; Cai, K.Y. Nanoscale polydopamine (PDA) meets pi-pi interactions: An interface-directed coassembly approach for mesoporous nanoparticles. Langmuir 2016, 46, 12119–12128. [Google Scholar] [CrossRef]
  36. Sauerbrey, G. The use of quartz oscillators for weighing thin layers and for microweighing. Z. Phys. 1959, 155, 206–222. [Google Scholar] [CrossRef]
  37. Hlavay, J.; Guilbault, G.G. Applications of the piezoelectric crystal detector in analytical chemistry. Ion-Sel. Electrode Rev. 1977, 13, 3–16. [Google Scholar] [CrossRef]
  38. Buck, R.P.; Lindner, E.; Kutner, W. Piezoelectric chemical sensors. Pure Appl. Chem. 2004, 6, 1139–1160. [Google Scholar] [CrossRef]
  39. Farzaneh, A.; Mohammadzadeh, A.; Esrafili, M.D.; Mermer, O. Experimental and theoretical study of TiO2 based nanostructured semiconducting humidity sensor. Ceram. Int. 2019, 7, 8362–8369. [Google Scholar] [CrossRef]
  40. Li, R.; Fan, Y.; Ma, Z.; Zhang, D.; Liu, Y.; Xu, J. Controllable preparation of ultrathin MXene nanosheets and their excellent QCM humidity sensing properties enhanced by fluoride doping. Microchim. Acta 2021, 188, 81. [Google Scholar] [CrossRef]
  41. Zhang, Y.; Yu, K.; Xu, R.; Jiang, D.; Luo, L.; Zhu, Z. Quartz crystal microbalance coated with carbon nanotube films used as humidity sensor. Sens. Actuators A Phys. 2005, 120, 142–146. [Google Scholar] [CrossRef]
  42. Havar, A.K.; Okur, S. Humidity sensing properties of chitosan by using quartz crystal microbalance method. Sens. Lett. 2012, 10, 906–910. [Google Scholar] [CrossRef]
Figure 1. The schematic diagram of QCM sensor humidity detection system.
Chemosensors 10 00522 g001
Figure 2. The schematic diagram of material synthesis and QCM humidity sensor fabrication by in situ method.
Chemosensors 10 00522 g002
Figure 3. FT-IR spectra of PDA.
Chemosensors 10 00522 g003
Figure 4. The SEM images of PDA materials after (a) 0.5 h, (b) 1 h, (c) 2 h and (d) 4 h reaction.
Chemosensors 10 00522 g004
Figure 5. The response-recover curves of 1-PDA-QCM, 1.5-PDA-QCM, 2-PDA-QCM, 2.5-PDA-QCM, 3-PDA-QCM, 3.5-PDA-QCM, 4-PDA-QCM at the relative humidity between 11% and 95%.
Chemosensors 10 00522 g005
Figure 6. Admittance curves of (a) 1-PDA-QCM, (b) 2-PDA-QCM, (c) 3-PDA-QCM, and (d) 4-PDA-QCM humidity sensors in the range of 11% RH to 95% RH.
Chemosensors 10 00522 g006
Figure 7. The frequency shifts of 2-PDA-QCM at different temperatures.
Chemosensors 10 00522 g007
Figure 8. The selectivity histogram of 2-PDA-QCM.
Chemosensors 10 00522 g008
Figure 9. The repeatability of 2-PDA-QCM at the relative humidity between 11% and 95% for five cycles.
Chemosensors 10 00522 g009
Figure 10. The schematic diagram of adsorption principle.
Chemosensors 10 00522 g010
Table 1. Summary table of response/recovery times and film mass of PDA-QCM humidity sensors with different growth times.
QCM SensorResponse Time (s)Recover Time (s)Film Mass (ng)
1-PDA-QCM1872111016
2-PDA-QCM5113278
3-PDA-QCM24164299
4-PDA-QCM163645155
Table 2. Half-band widths, equivalent resistance values, and quality factors of PDA-QCM humidity sensors measured in the range of 11% RH to 95% RH with different in situ growth times.
QCM SensorRelative HumidityHBWR0Q
1-PDA-QCM11% RH197.0810.0250,712
33% RH199.1310.2850,190
54% RH205.3910.4848,660
75% RH211.0510.7347,355
85% RH223.6311.4144,690
95% RH286.6714.9734,842
2-PDA-QCM11% RH194.069.8051,489
33% RH206.2910.0048,433
54% RH211.1210.2847,326
75% RH223.1510.9544,775
85% RH265.9312.6037,570
95% RH384.8520.4325,960
3-PDA-QCM11% RH261.9212.4538,144
33% RH262.0312.6338,128
54% RH263.7113.0037,885
75% RH274.8013.7036,355
85% RH278.8413.8835,829
95% RH282.5514.1635,357
4-PDA-QCM11% RH199.7810.0450,026
33% RH203.3010.1249,160
54% RH205.4810.1848,640
75% RH209.2610.4647,761
85% RH211.0910.5547,346
95% RH232.2711.2943,026
Table 3. The long-term stability test values of 2-PDA-QCM.
Relative
Condition
Storage Day 1Storage Day 3Storage Day 7Storage Day 30
Frequency Shift (Hz)
33% RH42.5350.0941.5874.89
54% RH187.24135.49120.45109.01
75% RH751.17359.67313.87296.30
85% RH1081.28639.81566.40496.12
95% RH1950.511433.73948.26883.25
Table 4. Comparison between QCM humidity sensor in this work and reported works.
MaterialsFabrication MethodRangeSensitivityRes./Rec. TimeRef.
TiO2Spin coating30%~70% RH2 Hz/% RH~/~[39]
S-Ti3C2Drop casting11%~97% RH12.8 Hz/% RH6 s/2 s[40]
CNTSpin coating5%~97% RH12.5 Hz/% RH60 s/70 s[41]
ChitosanSpin coating11%~94% RH7.5 Hz/% RH~/~[42]
PANIElectrospinning20%~80% RH3.0 Hz/% RH5 s/20 s[24]
PDAIn situ growth11%~95% RH20.77 Hz/% RH5 s/11 sThis work
Publisher’s Note: MDPI stays neutral with regard to jurisdictional claims in published maps and institutional affiliations.

