
Quantitative Estimation of COD Values from an Array of Metal Nanoparticle Modified Electrodes and Artificial Neural Networks †


Abstract

1. Introduction
2. Experimental
2.1. Chemicals and Reagents
2.2. Apparatus
2.3. Electrode Fabrication
2.4. Data Analysis
2.5. Samples under Study
3. Results and Discussion
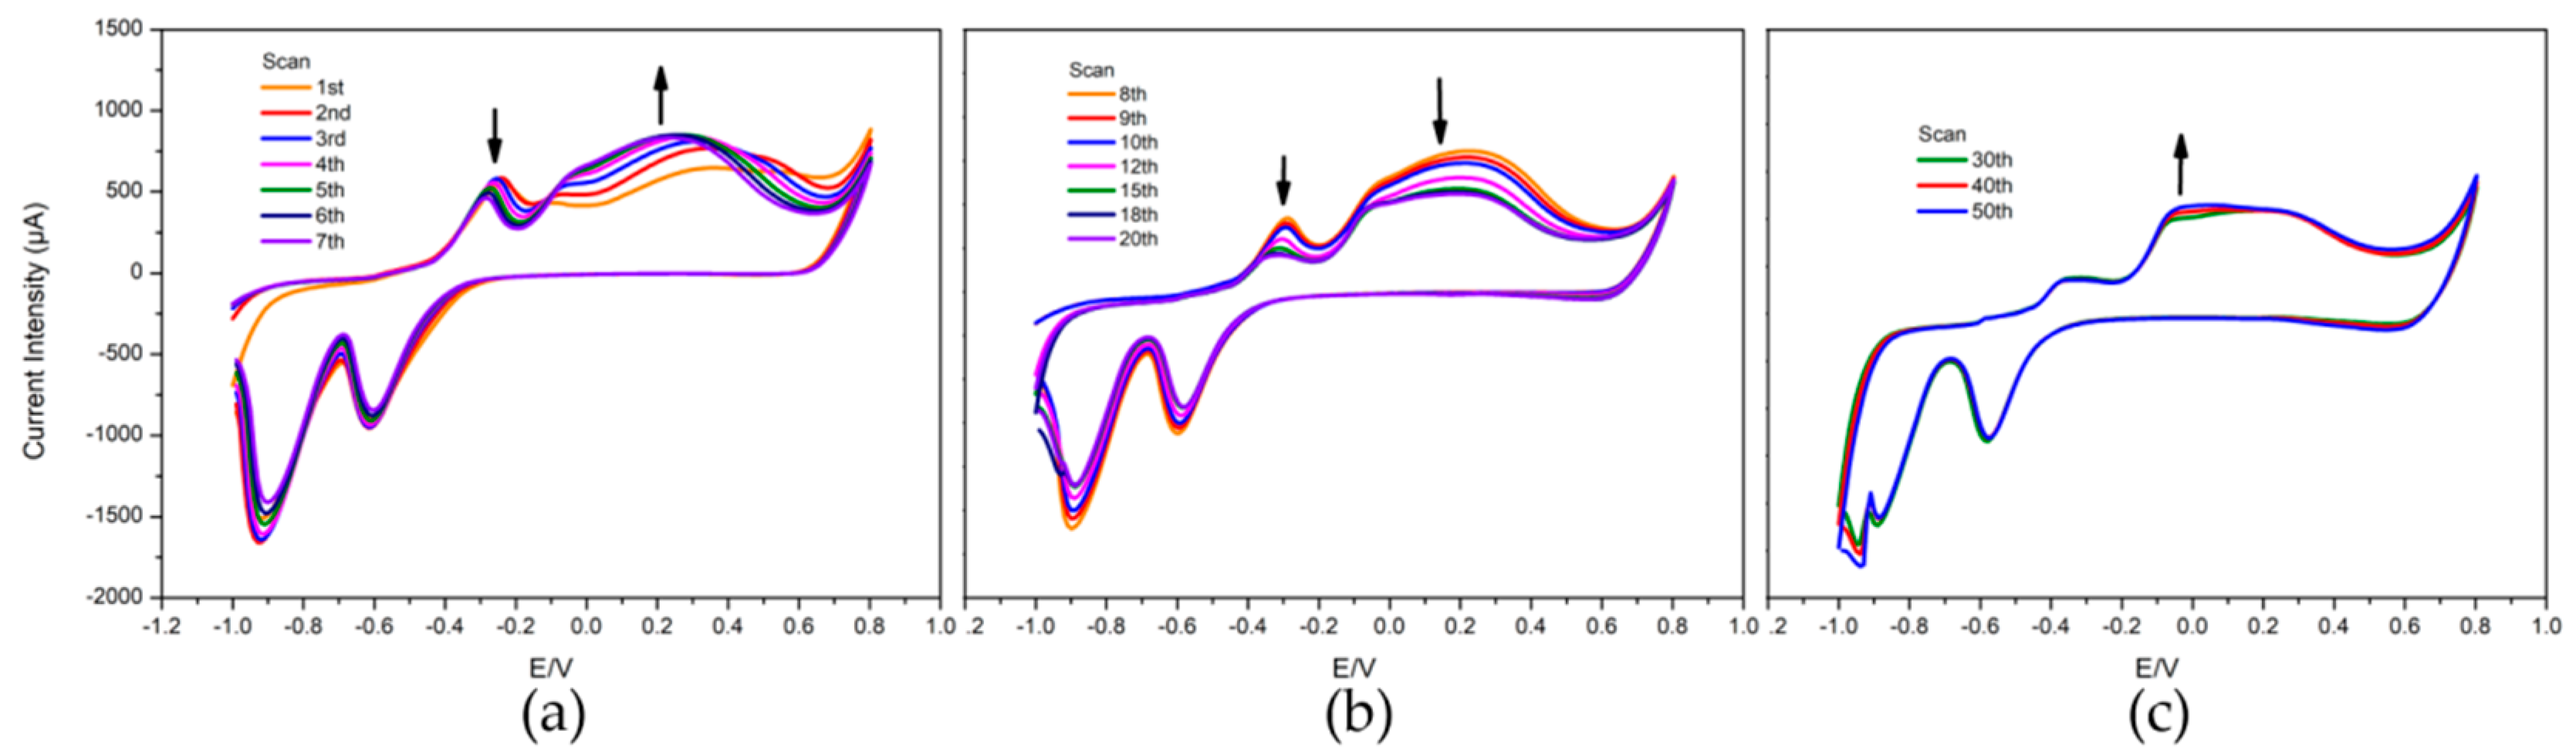
3.1. Preparation of the CuO/Cu Electrode
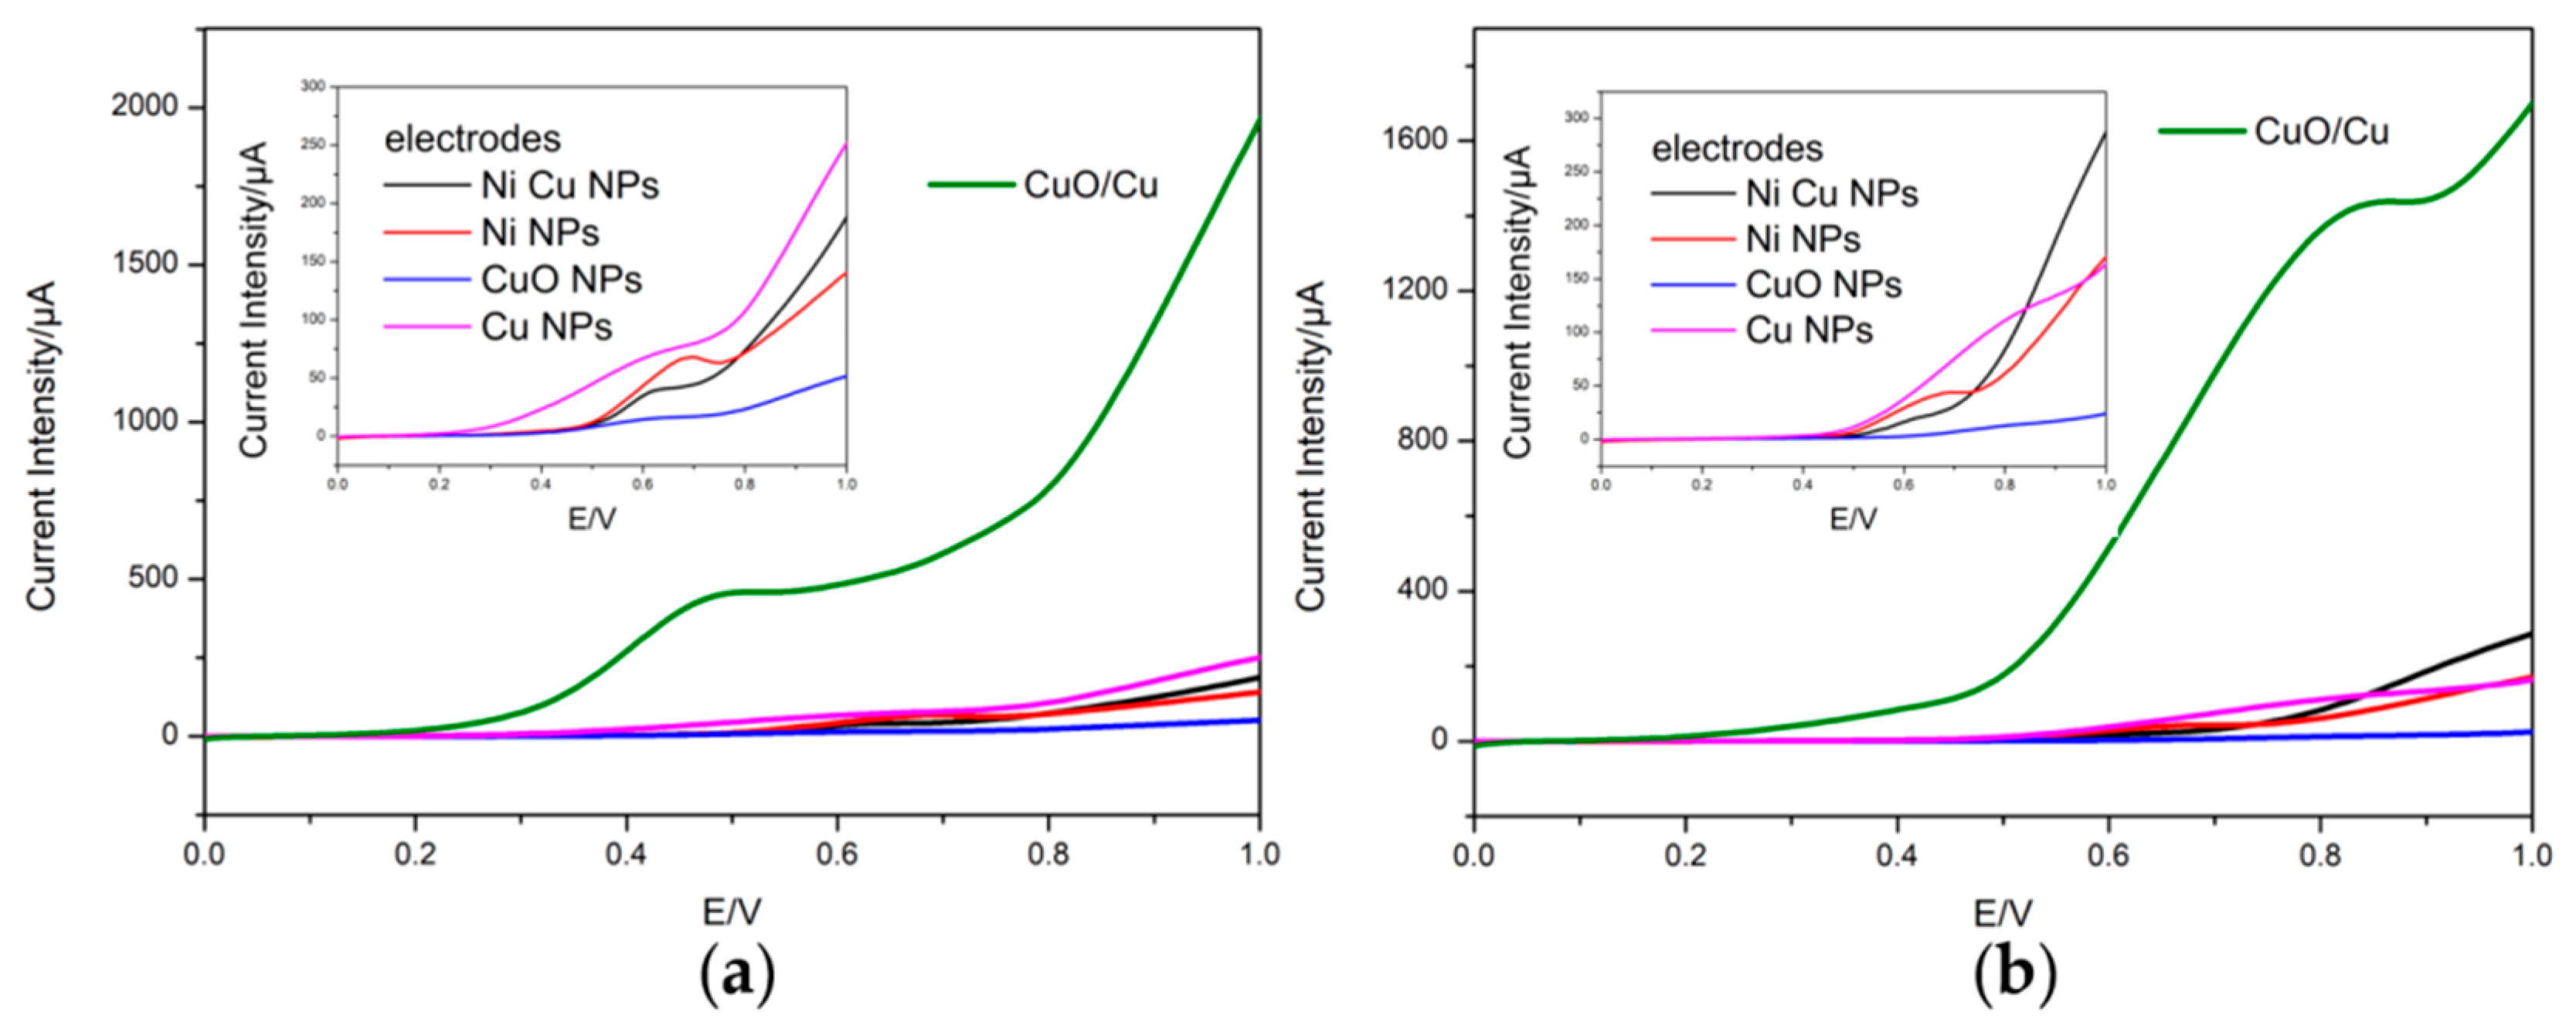
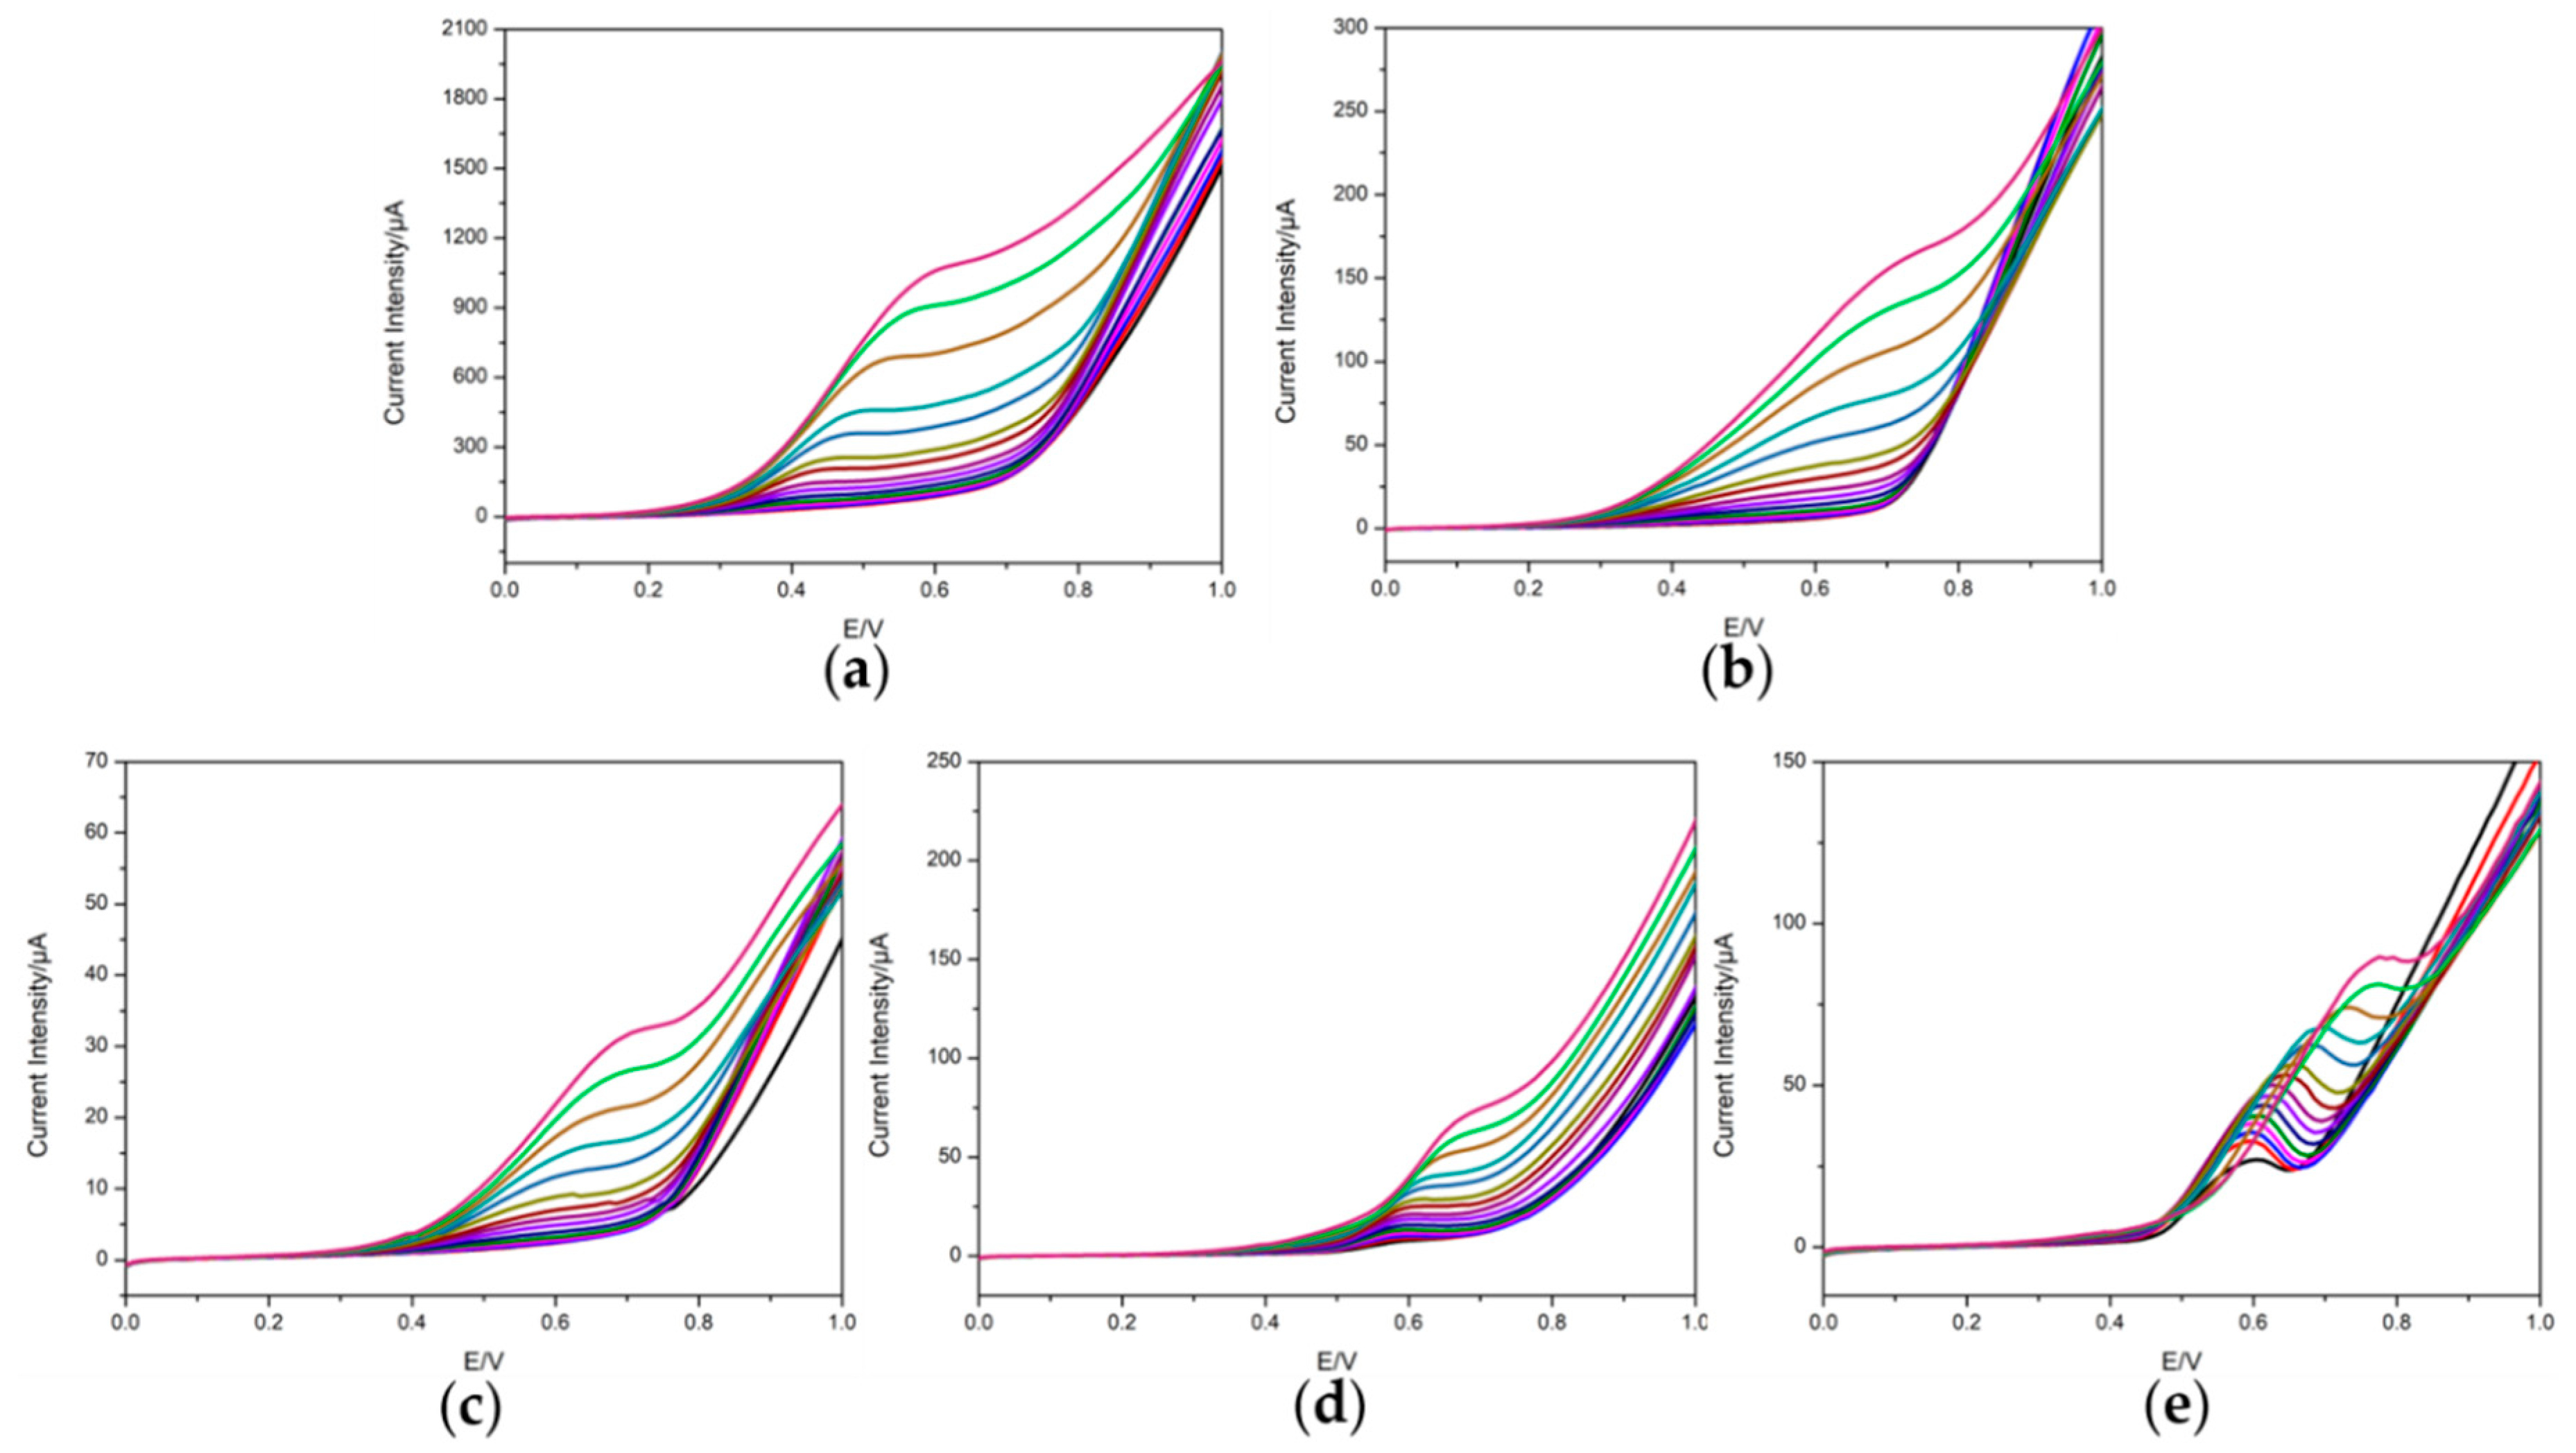
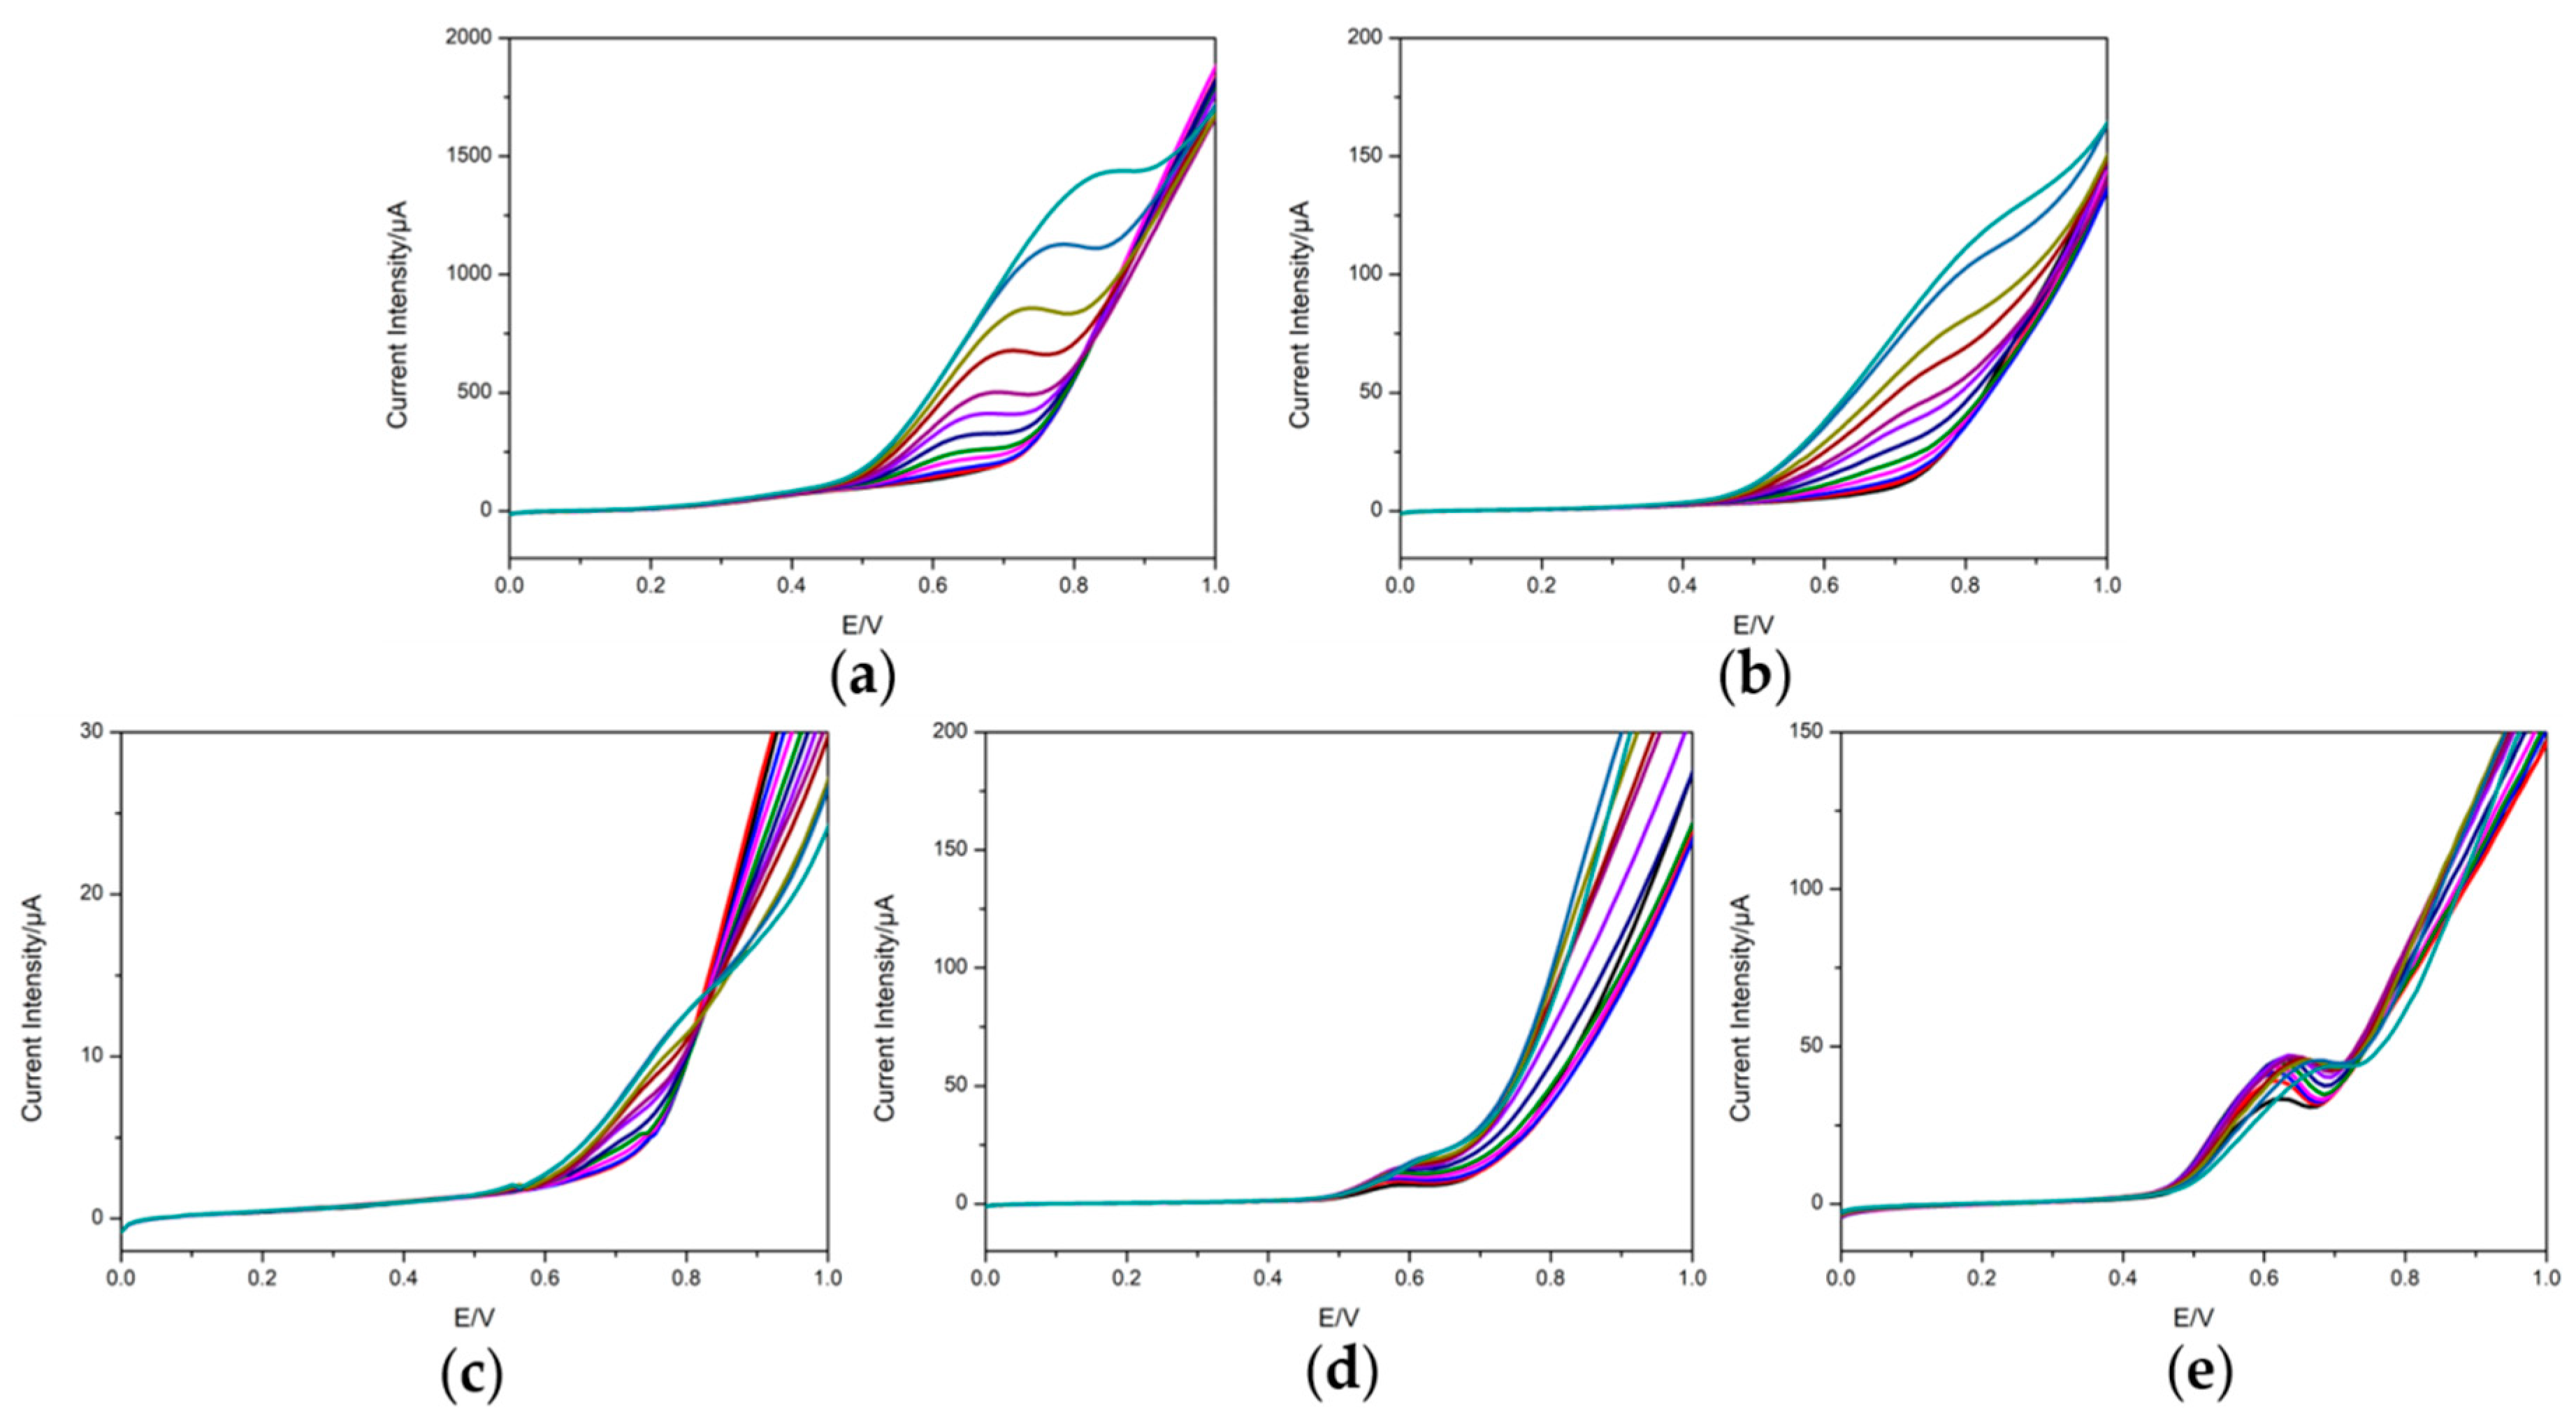
3.2. Voltammetric Response of the Electrodes
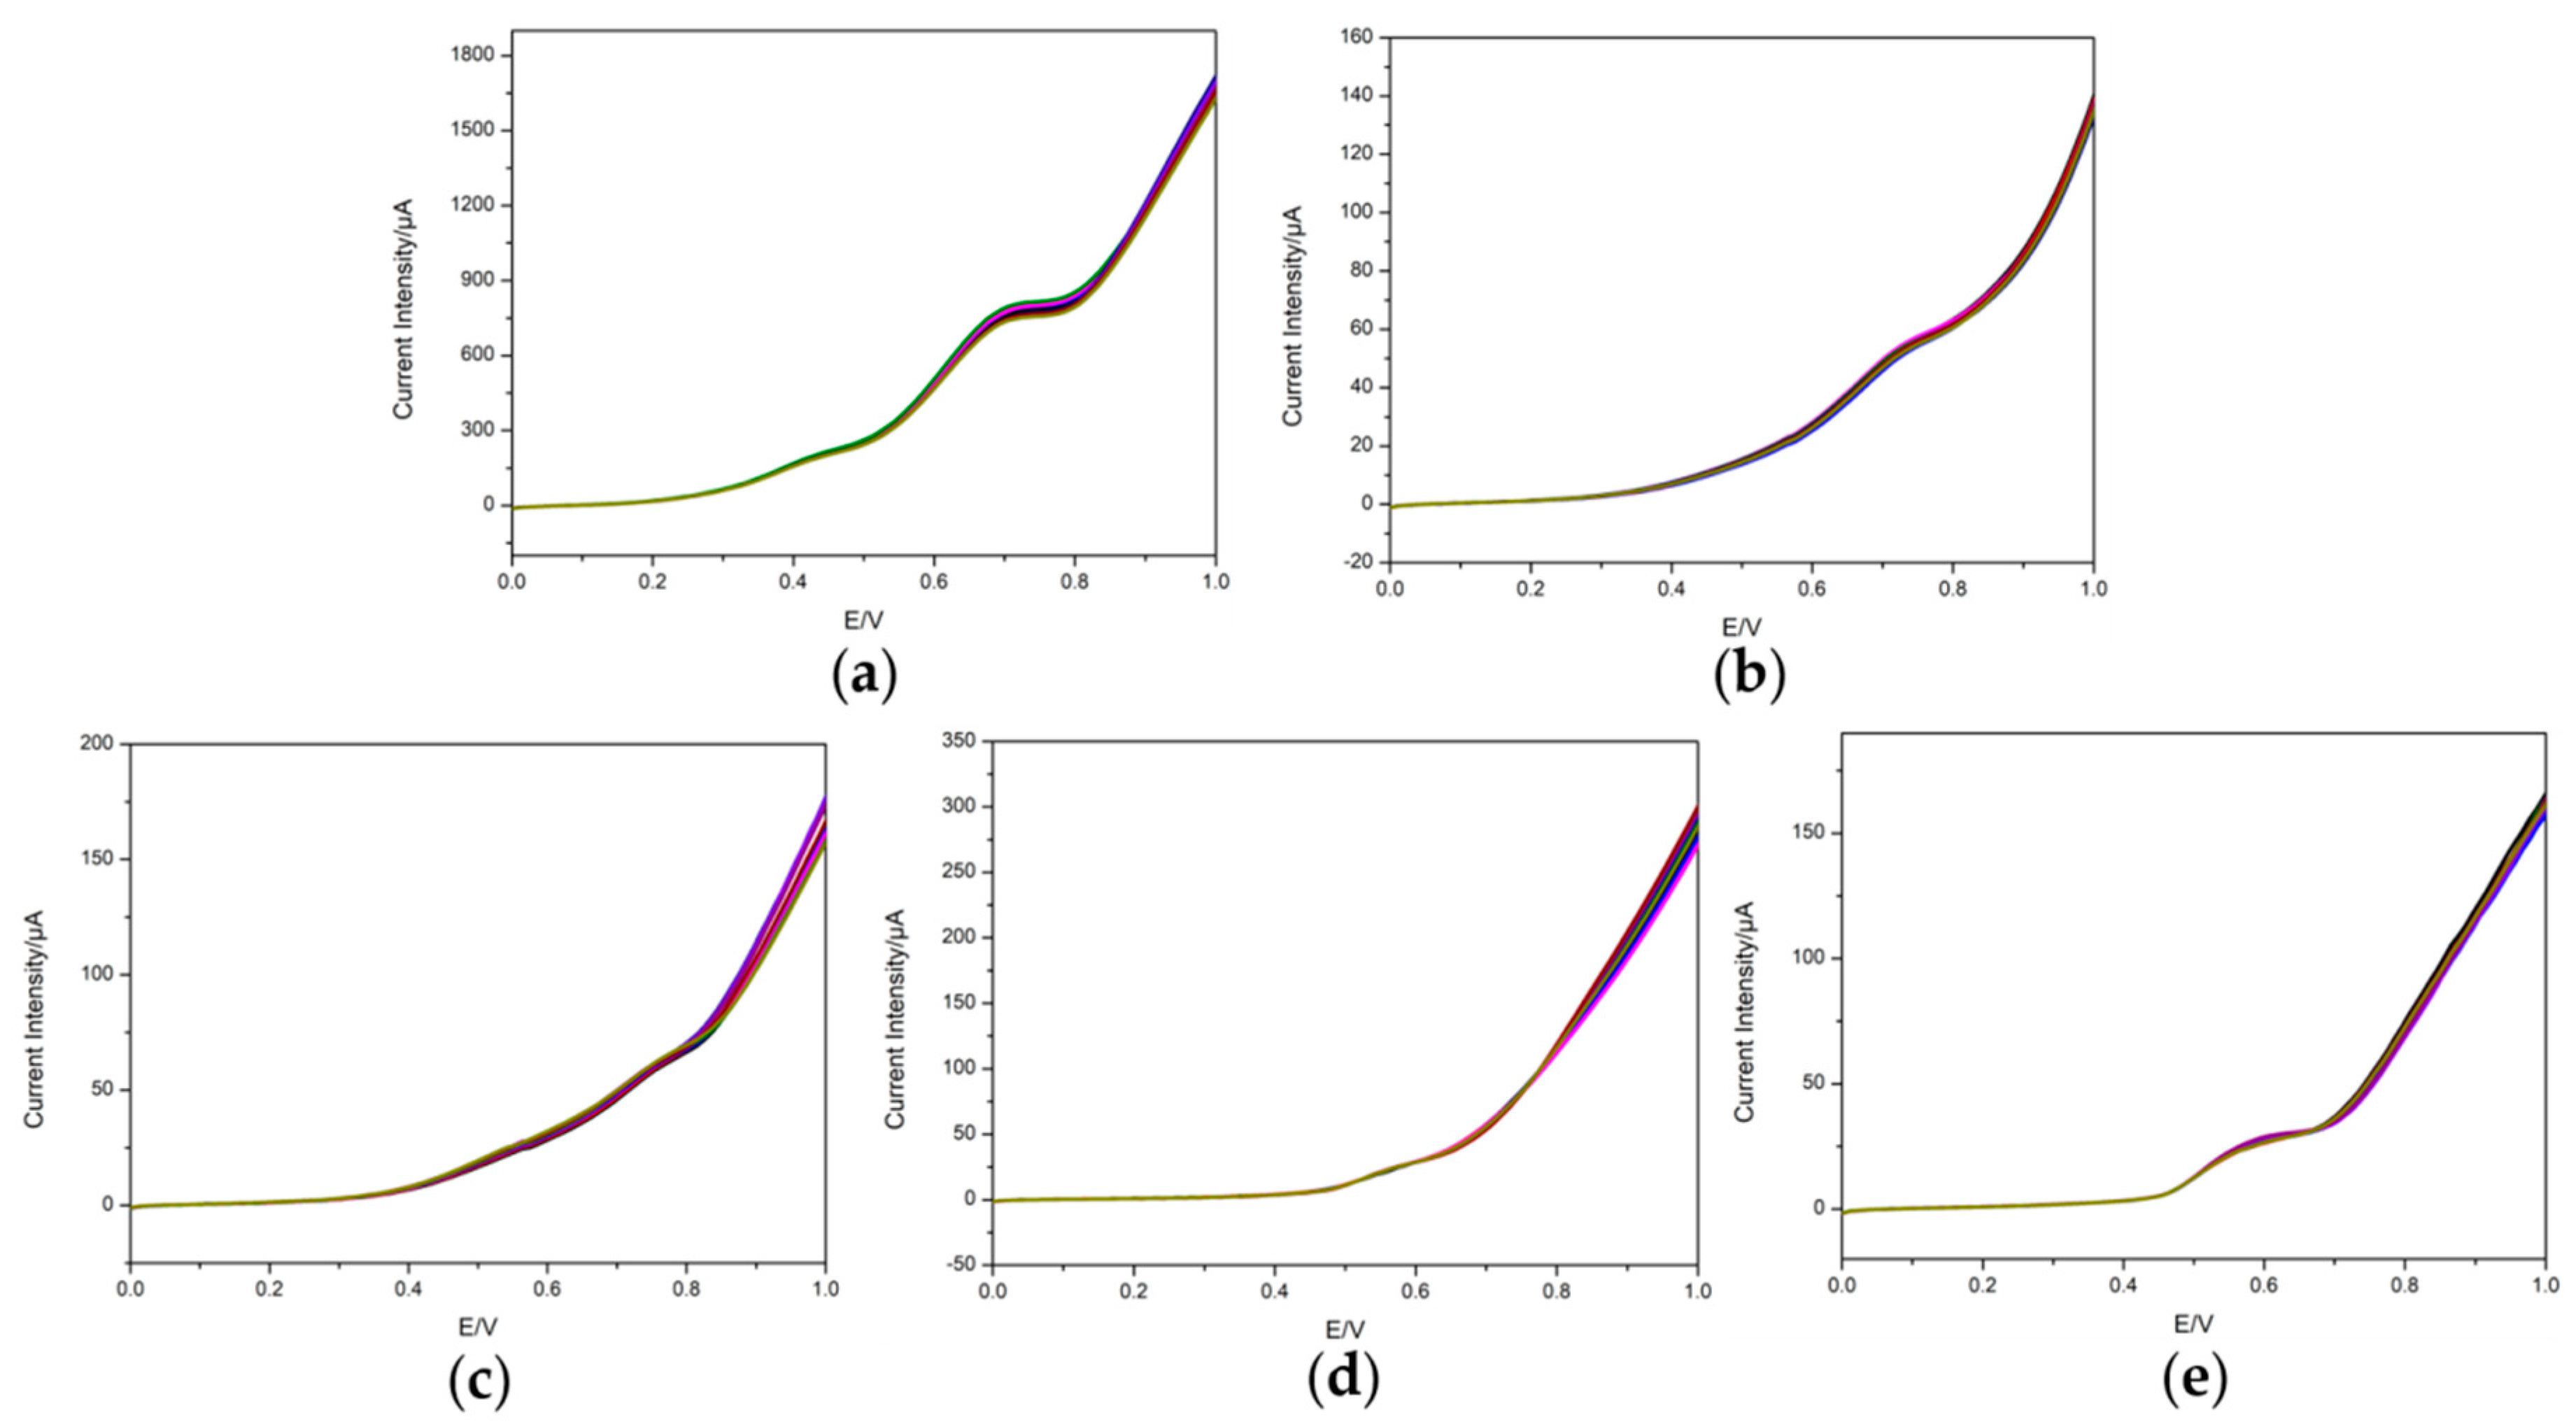
3.3. Repeatability
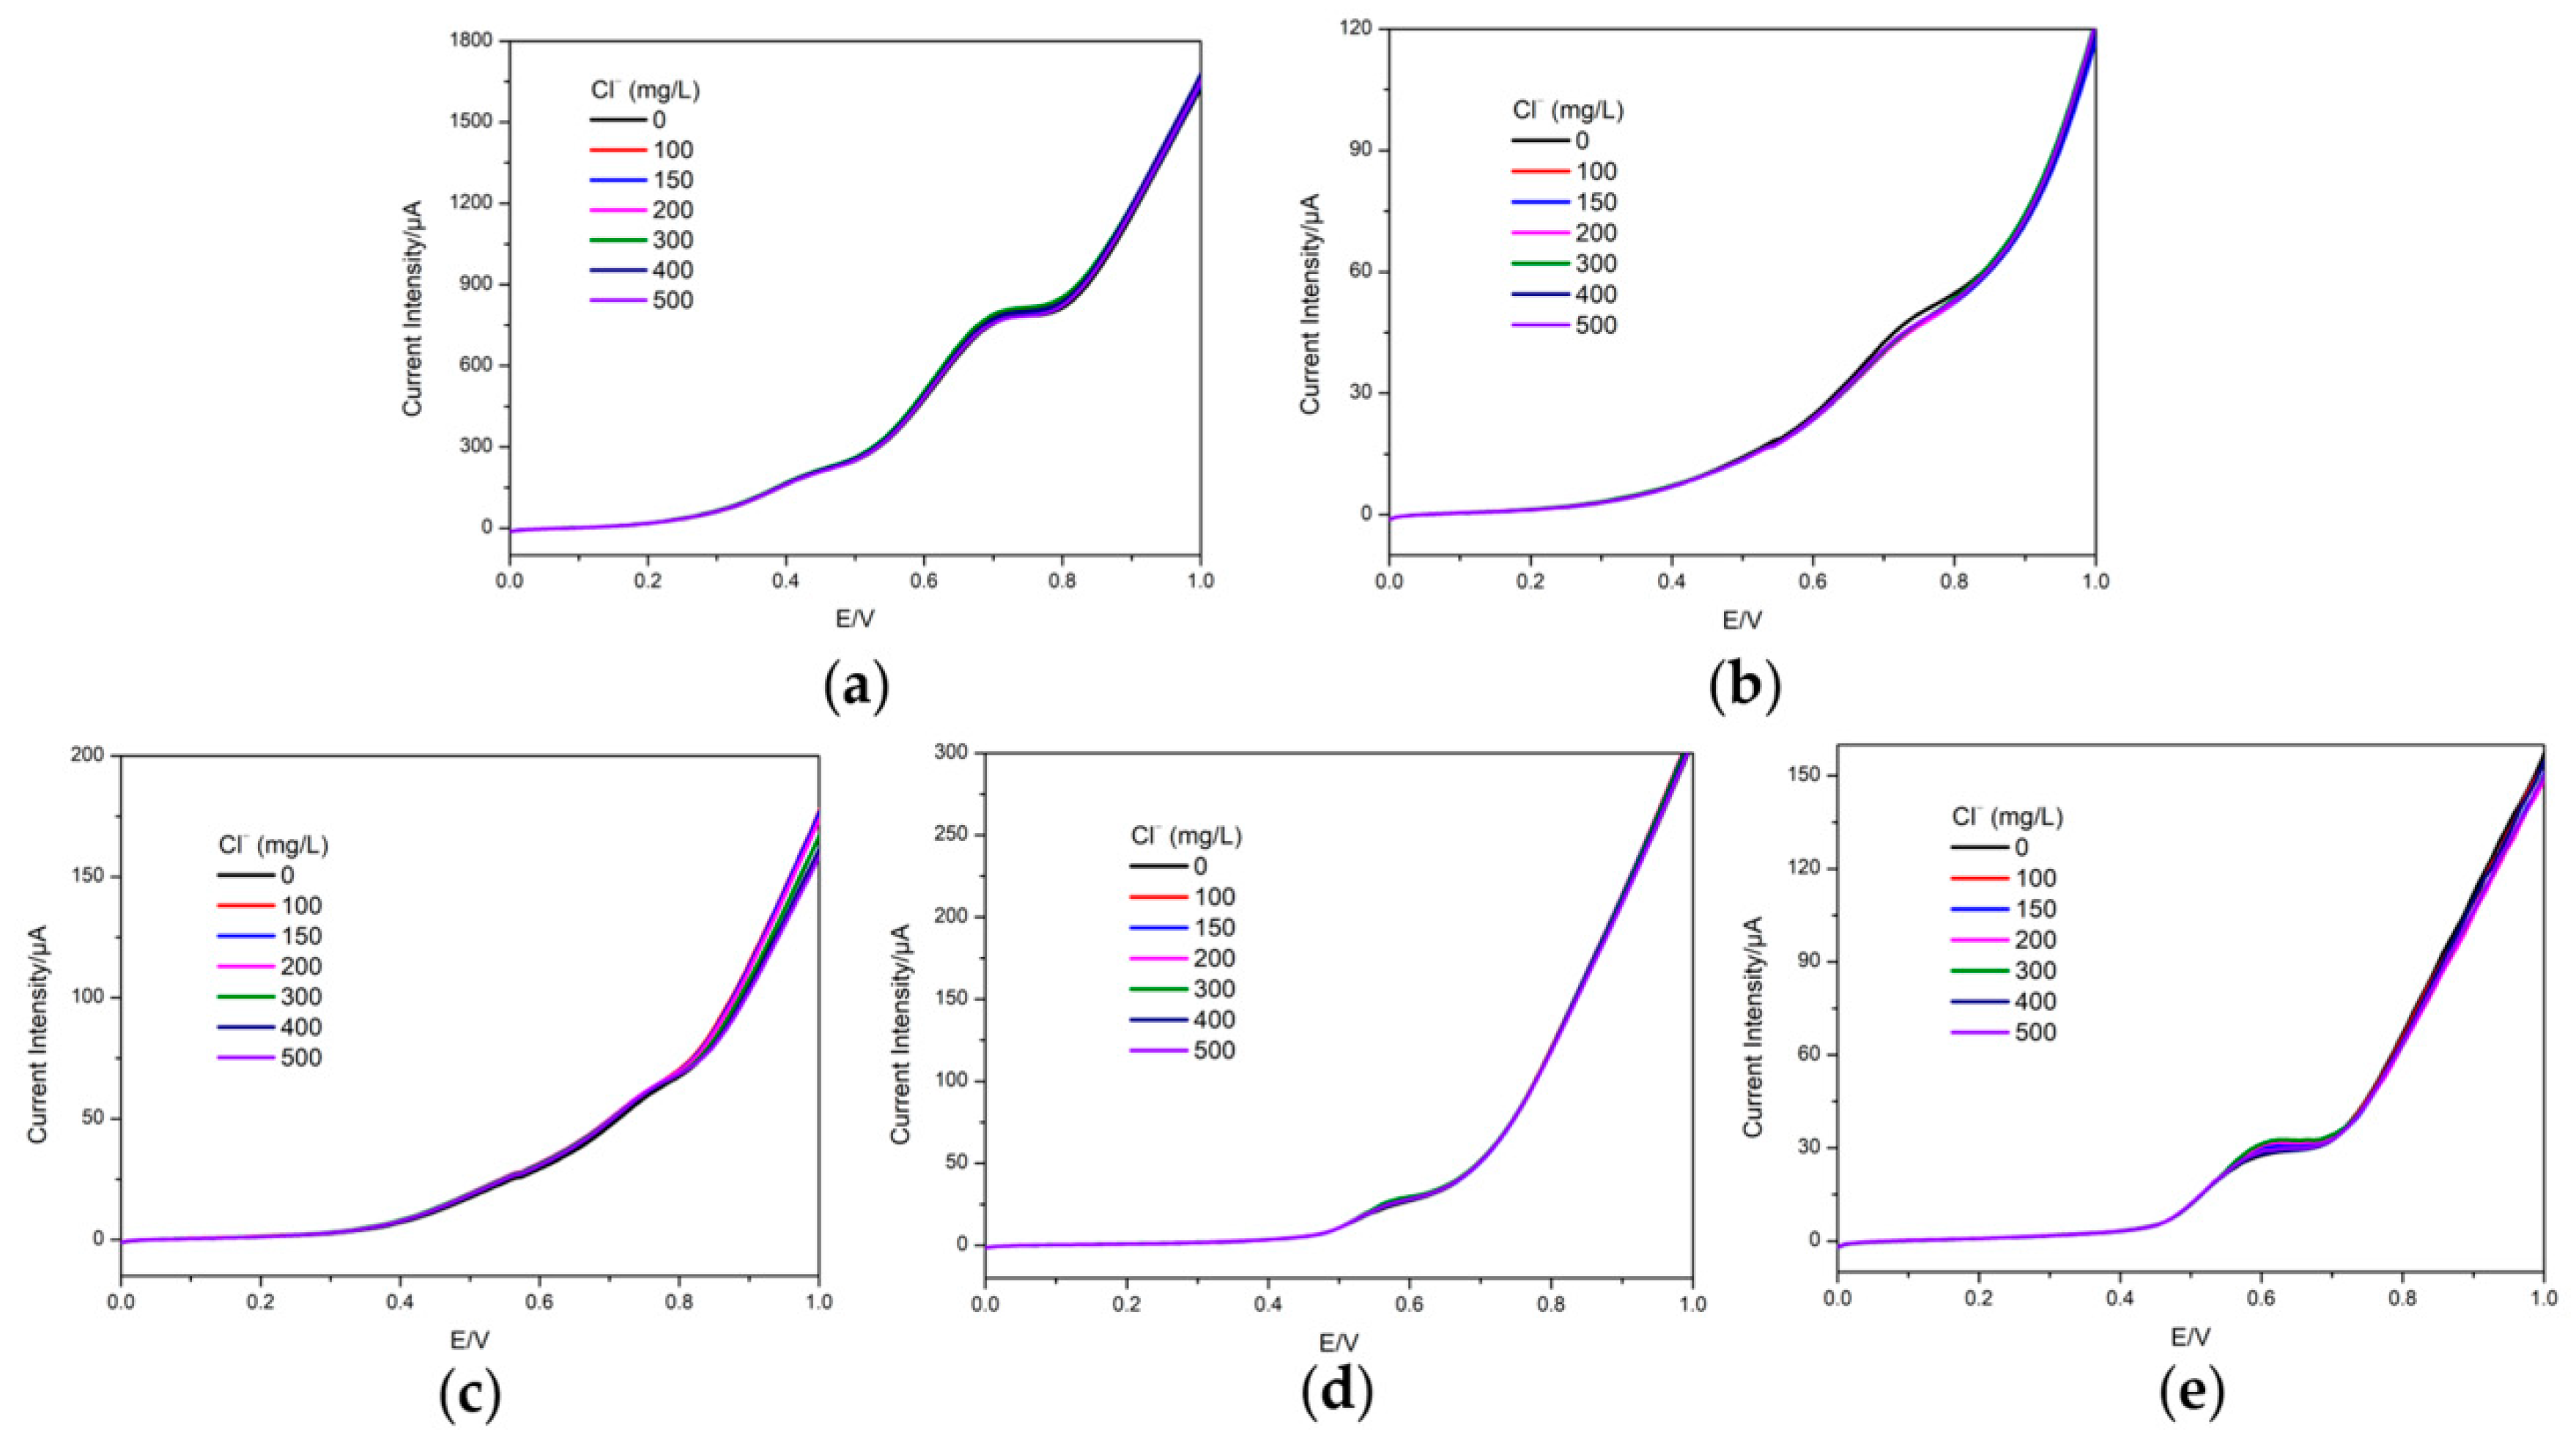
3.4. Interference of Chloride Ions
3.5. Quantitative Analysis of Real Samples
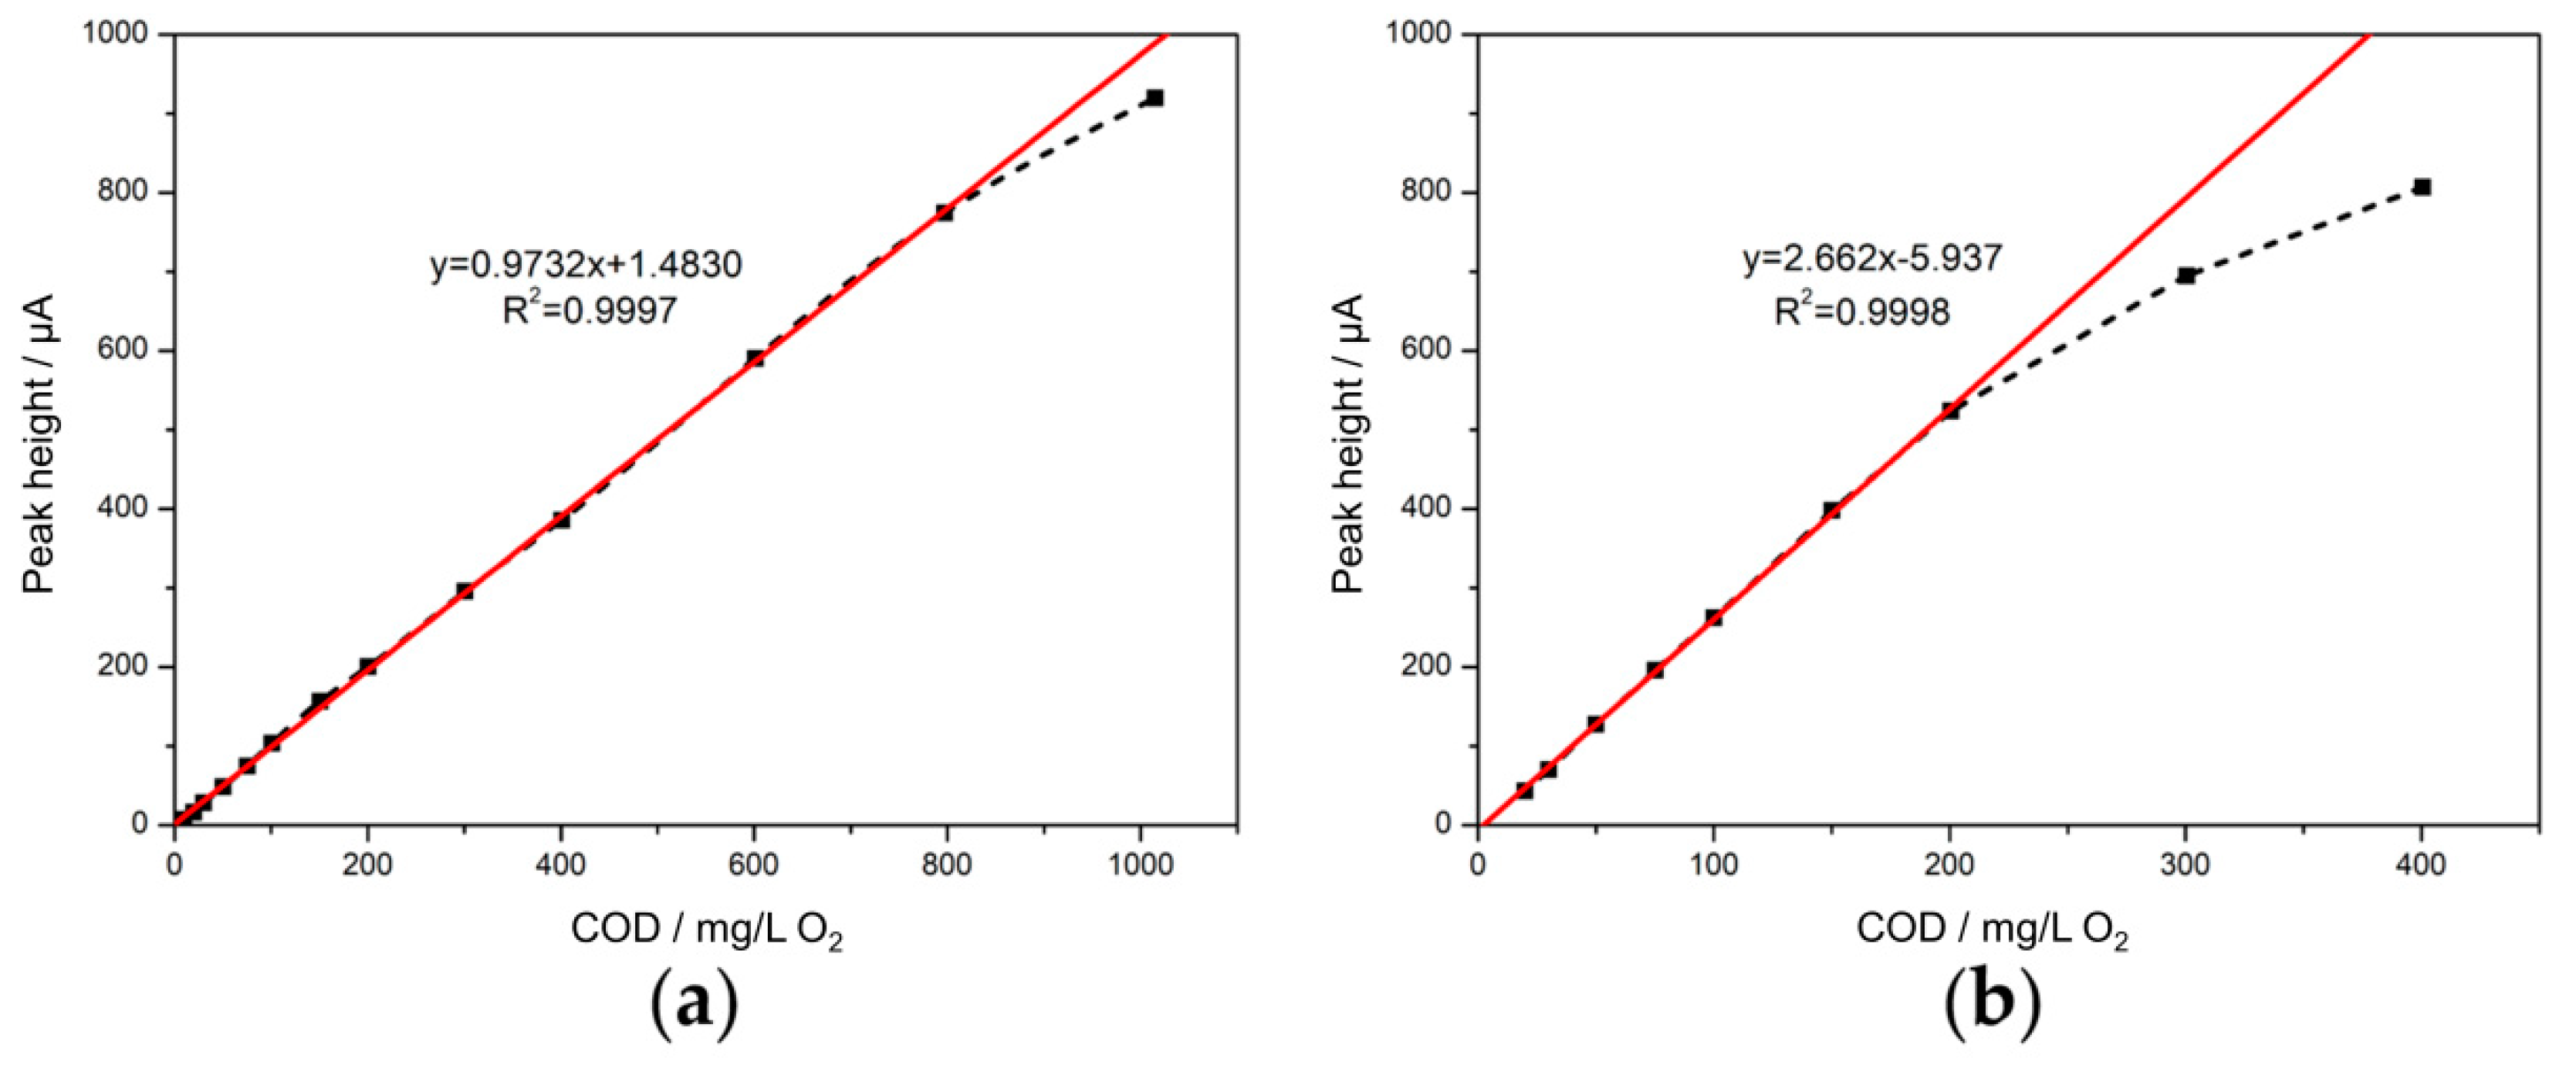
3.5.1. Calibration Curve
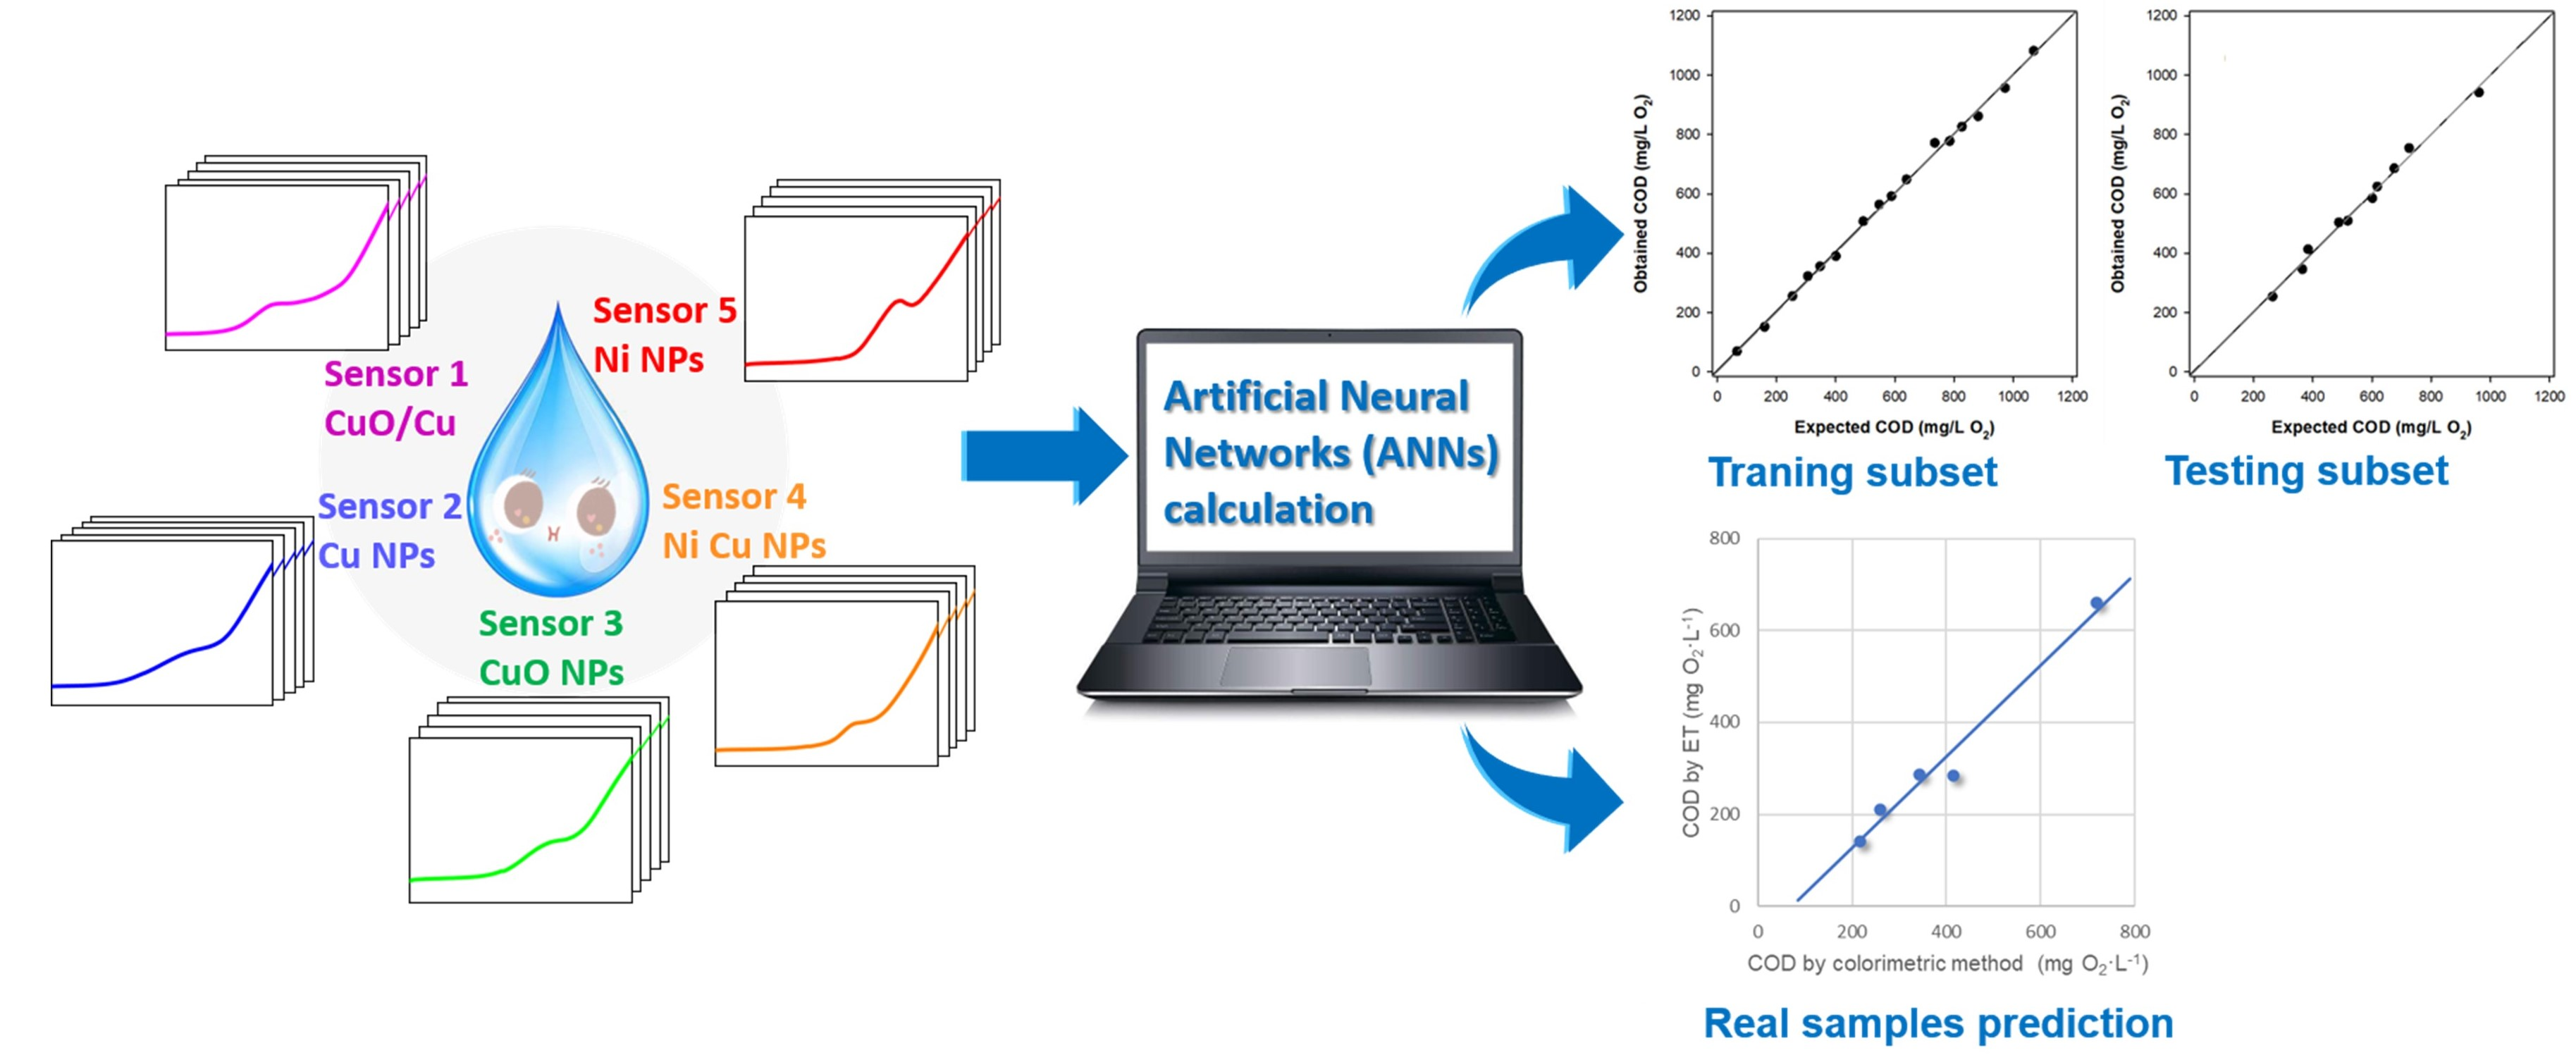
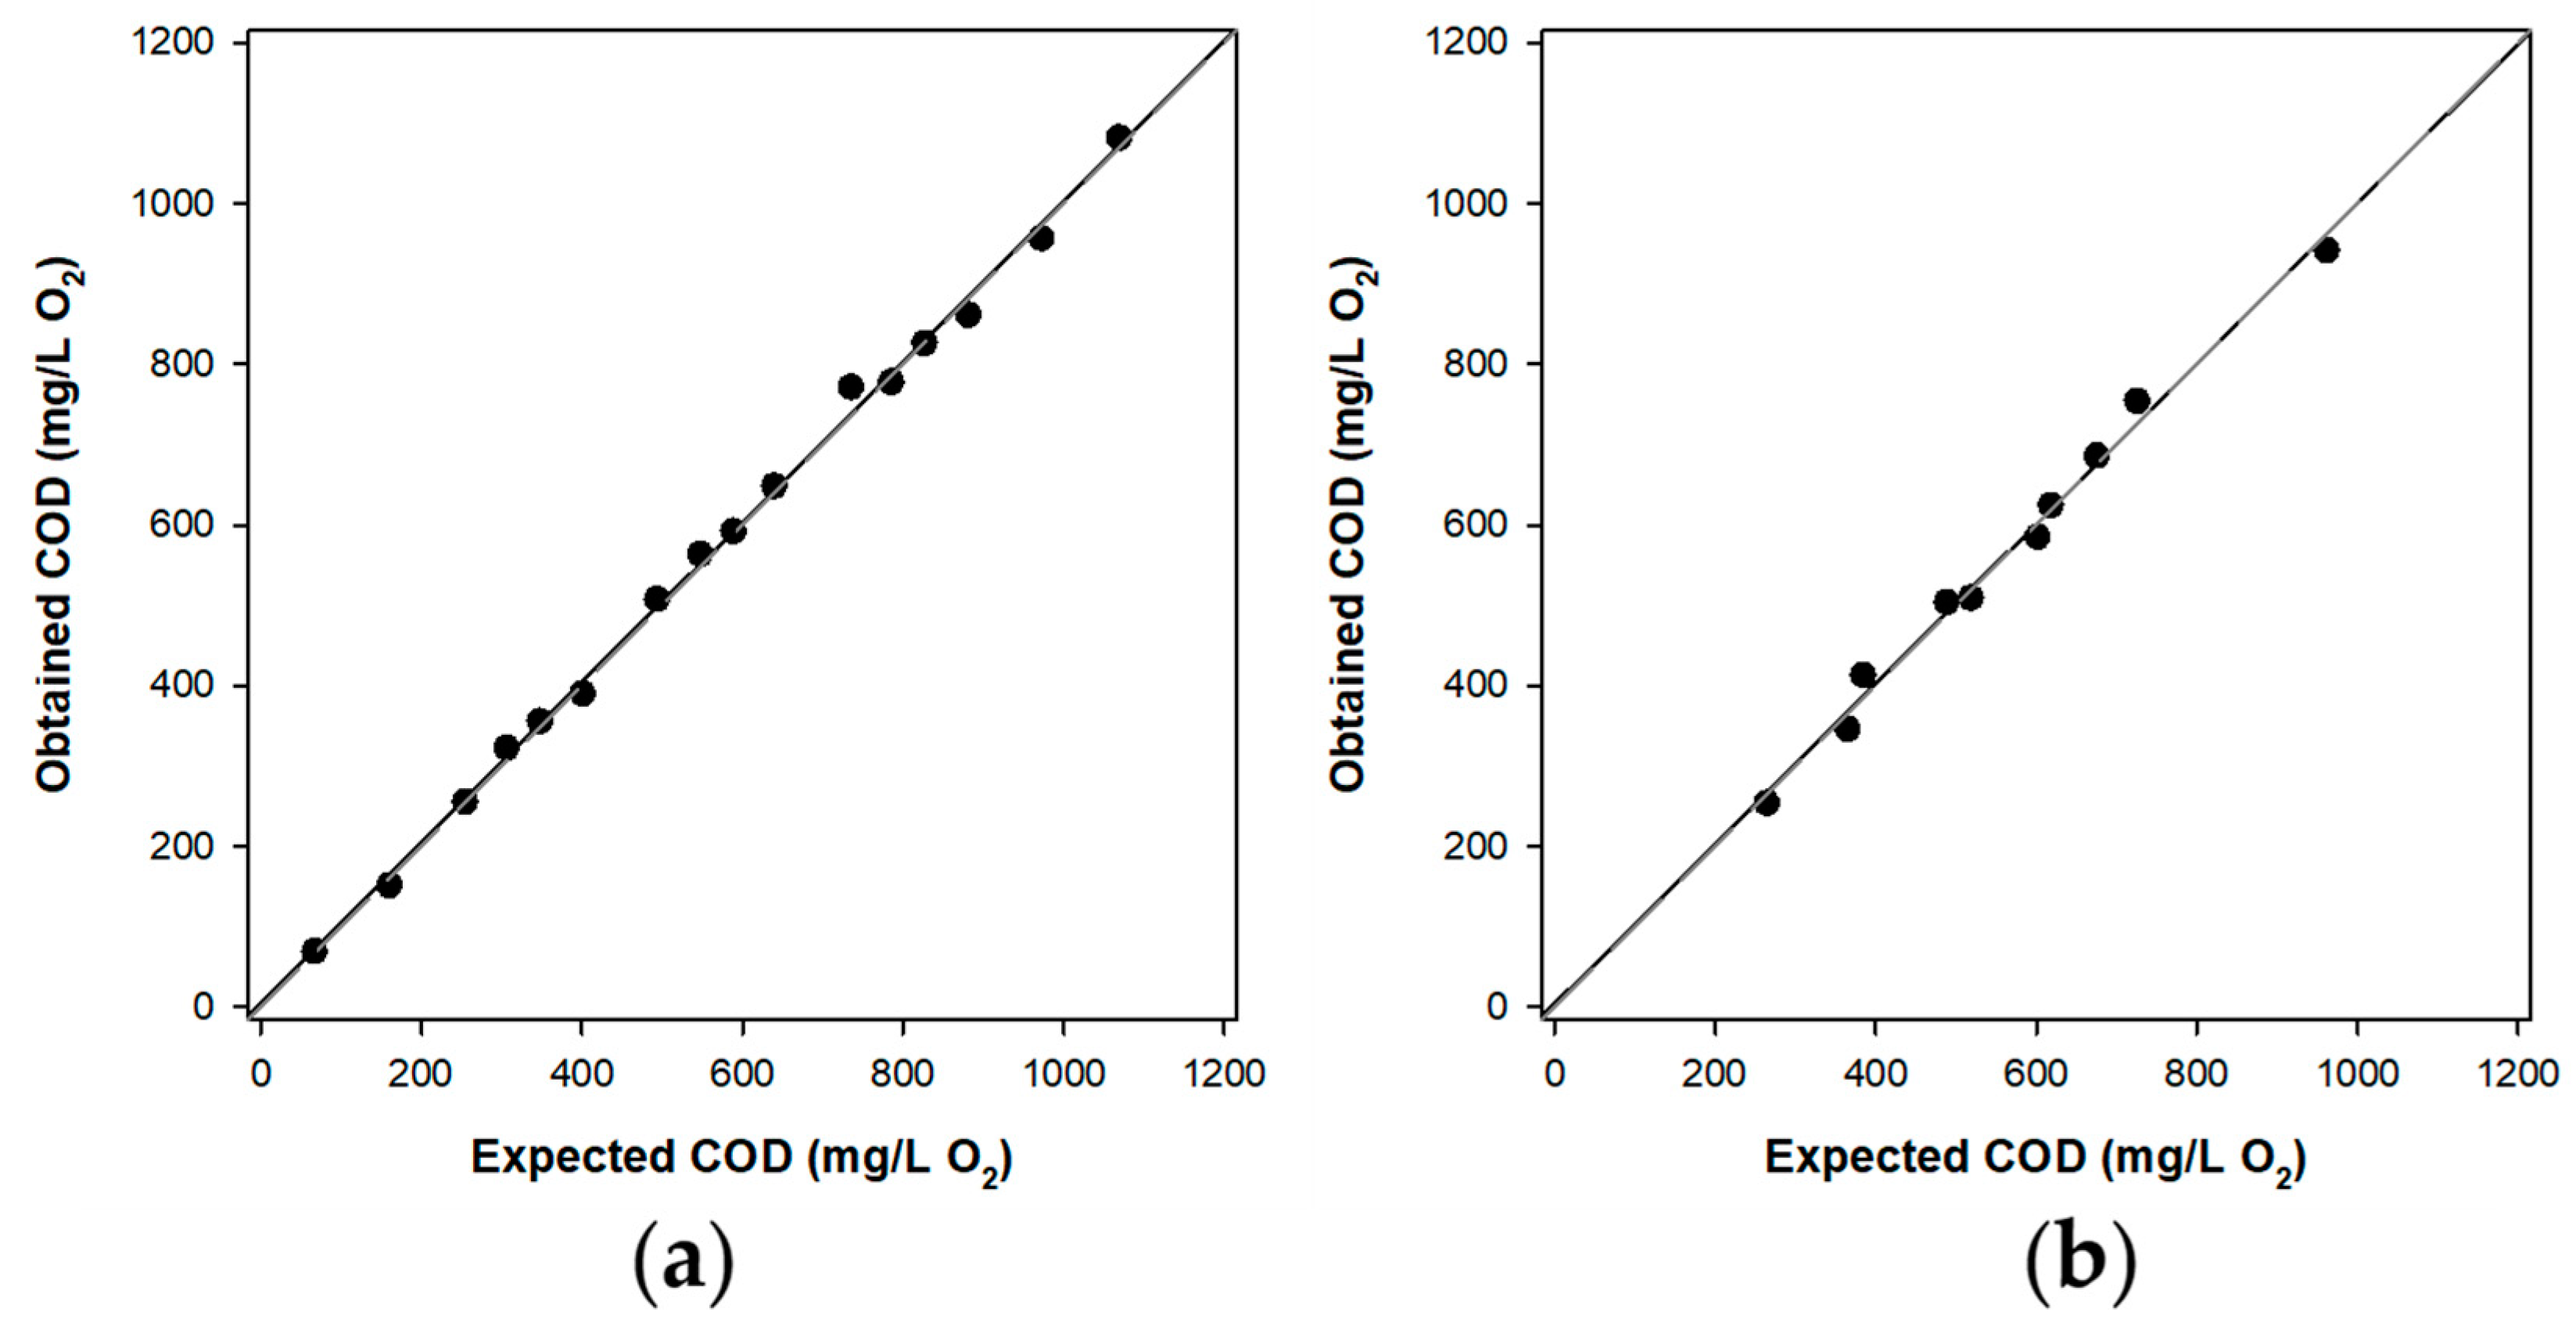
3.5.2. Artificial Neural Network Method
4. Conclusions
Author Contributions
Funding
Institutional Review Board Statement
Informed Consent Statement
Data Availability Statement
Acknowledgments
Conflicts of Interest
References
- Alves, N.A.; Olean-Oliveira, A.; Cardoso, C.X.; Teixeira, M.F.S. Photochemiresistor sensor development based on a bismuth vanadate type semiconductor for determination of chemical oxygen demand. ACS Appl. Mater. Interfaces 2020, 12, 18723–18729. [Google Scholar] [CrossRef] [PubMed]
- Hao, N.; Dai, Z.; Xiong, M.; Han, X.; Zuo, Y.; Qian, J.; Wang, K. Rapid potentiometric detection of chemical oxygen demand using a portable self-powered sensor chip. Anal. Chem. 2021, 93, 8393–8398. [Google Scholar] [CrossRef] [PubMed]
- Ramon, R.; Valero, F.; del Valle, M. Rapid determination of chemical oxygen demand using a focused microwave heating system featuring temperature control. Anal. Chim. Acta 2003, 491, 99–109. [Google Scholar] [CrossRef]
- Huang, X.; Zhu, Y.; Yang, W.; Jiang, A.; Jin, X.; Zhang, Y.; Yan, L.; Zhang, G.; Liu, Z. A self-supported CuO/Cu nanowire electrode as highly efficient sensor for COD measurement. Molecules 2019, 24, 3132. [Google Scholar] [CrossRef]
- Gutiérrez-Capitán, M.; Baldi, A.; Gómez, R.; García, V.; Jiménez-Jorquera, C.; Fernández-Sánchez, C. Electrochemical nanocomposite-derived sensor for the analysis of chemical oxygen demand in urban wastewaters. Anal. Chem. 2015, 87, 2152–2160. [Google Scholar] [CrossRef]
- Sawyer, C.N.; McCarty, P.L.; Parkin, G.F. Chemistry for Environmental Engineering and Science, 5th ed.; McGraw-Hill Education: New York, NY, USA, 2002; pp. 625–626. [Google Scholar]
- Yu, H.; Ma, C.; Quan, X.; Chen, S.; Zhao, H. Flow injection analysis of chemical oxygen demand (COD) by using a boron-doped diamond (BDD) electrode. Environ. Sci. Technol. 2009, 43, 1935–1939. [Google Scholar] [CrossRef]
- Diksy, Y.; Rahmawati, I.; Jiwanti, P.K.; Ivandini, T.A. Nano-Cu modified Cu and nano-Cu modified graphite electrodes for chemical oxygen demand sensors. Anal. Sci. 2020, 36, 1323–1330. [Google Scholar] [CrossRef]
- Zhou, Y.; Jing, T.; Hao, Q.; Zhou, Y.; Mei, S. A sensitive and environmentally friendly method for determination of chemical oxygen demand using NiCu alloy electrode. Electrochim. Acta. 2012, 74, 165–170. [Google Scholar] [CrossRef]
- Zhang, Z.; Chang, X.; Chen, A. Determination of chemical oxygen demand based on photoelectrocatalysis of nanoporous TiO2 electrodes. Sens. Actuators B Chem. 2016, 223, 664–670. [Google Scholar] [CrossRef]
- Jin, W.; Maduraiveeran, G. Electrochemical detection of chemical pollutants based on gold nanomaterials. Trends Environ. Anal. Chem. 2017, 14, 28–36. [Google Scholar] [CrossRef]
- Orozco, J.; Fernández-Sánchez, C.; Mendoza, E.; Baeza, M.; Céspedes, F.; Jiménez-Jorquera, C. Composite planar electrode for sensing electrochemical oxygen demand. Anal. Chim. Acta 2008, 607, 176–182. [Google Scholar] [CrossRef] [PubMed]
- Cheng, Q.; Wu, C.; Chen, J.; Zhou, Y.; Wu, K. Electrochemical tuning the activity of nickel nanoparticle and application in sensitive detection of chemical oxygen demand. J. Phys. Chem. C 2011, 115, 22845–22850. [Google Scholar] [CrossRef]
- Wang, Q.; del Valle, M. Determination of chemical oxygen semand (COD) using nanoparticle-modified voltammetric sensors and electronic tongue principles. Chemosensors 2021, 9, 46. [Google Scholar] [CrossRef]
- Duan, W.; Gunes, M.; Baldi, A.; Gich, M.; Fernández-Sánchez, C. Compact fluidic electrochemical sensor platform for on-line monitoring of chemical oxygen demand in urban wastewater. Chem. Eng. J. 2022, 449, 137837. [Google Scholar] [CrossRef]
- Hou, Y.; Hu, J.; Liu, L.; Zhang, J.; Cao, C. Effect of calcination temperature on electrocatalytic activities of Ti/IrO2 electrodes in methanol aqueous solutions. Electrochim. Acta 2006, 51, 6258–6267. [Google Scholar] [CrossRef]
- Wang, J.Q.; Wu, C.; Wu, K.B.; Cheng, Q.; Zhou, Y.K. Electrochemical sensing chemical oxygen demand based on the catalytic activity of cobalt oxide film. Anal. Chim. Acta 2012, 736, 55–61. [Google Scholar] [CrossRef]
- Ai, S.; Gao, M.; Yang, Y.; Li, J.; Jin, L. Electrocatalytic sensor for the determination of chemical oxygen demand using a lead dioxide modified electrode. Electroanalysis 2004, 16, 404–409. [Google Scholar] [CrossRef]
- Li, J.; Li, L.; Zheng, L.; Xian, Y.; Jin, L. Rh2O3/Ti electrode preparation using laser anneal and its application to the determination of chemical oxygen demand. Meas. Sci. Technol. 2006, 17, 1995–2000. [Google Scholar] [CrossRef]
- Ma, C.; Tan, F.; Zhao, H.; Chen, S.; Quan, X. Sensitive amperometric determination of chemical oxygen demand using Ti/Sb–SnO2/PbO2 composite electrode. Sens. Actuators B Chem. 2011, 155, 114–119. [Google Scholar] [CrossRef]
- Silva, C.R.; Conceição, C.D.C.; Bonifácio, V.G.; Fatibelho Filho, O.; Teixeira, M.F.S. Determination of the chemical oxygen demand (COD) using a copper electrode: A clean alternative method. J. Solid State Electrochem. 2009, 13, 665–669. [Google Scholar] [CrossRef]
- Carchi, T.; Lapo, B.; Alvarado, J.; Montero, P.J.E.; Llorca, J.; Fernández, L. A nafion film cover to enhance the analytical performance of the CuO/Cu electrochemical sensor for determination of chemical oxygen demand. Sensors 2019, 19, 669. [Google Scholar] [CrossRef] [PubMed]
- Hassan, H.H.; Badr, I.H.A.; Abdel-Fatah, H.T.M.; Elfeky, E.M.S.; Abdel-Aziz, A.M. Low cost chemical oxygen demand sensor based on electrodeposited nano-copper film. Arab. J. Chem. 2018, 11, 171–180. [Google Scholar] [CrossRef]
- Hanrahan, G. Computational neural networks driving complex analytical problem solving. Anal. Chem. 2010, 82, 4307–4313. [Google Scholar] [CrossRef]
- Liu, J.; Xu, Y.; Liu, S.; Yu, S.; Yu, Z.; Low, S.S. Application and progress of chemometrics in voltammetric biosensing. Biosensors 2022, 12, 494. [Google Scholar] [CrossRef] [PubMed]
- Aroca-Santos, R.; Cancilla, J.C.; Matute, G.; Torrecilla, J.S. Identifying and quantifying adulterants in extra virgin olive oil of the picual varietal by absorption spectroscopy and nonlinear modeling. J. Agric. Food Chem. 2015, 63, 5646–5652. [Google Scholar] [CrossRef]
- Gutés, A.; Calvo, D.; Céspedes, F.; del Valle, M. Automatic sequential injection analysis electronic tongue with integrated reference electrode for the determination of ascorbic acid, uric acid and paracetamol. Microchim. Acta 2007, 157, 1–6. [Google Scholar] [CrossRef]
- Cetó, X.; Gonzalez-Calabuig, A.; Capdevila, J.; Puig-Pujol, A.; del Valle, M. Instrumental measurement of wine sensory descriptors using a voltammetric electronic tongue. Sens. Actuators B Chem. 2015, 207, 1053–1059. [Google Scholar] [CrossRef]
- González-Calabuig, A.; del Valle, M. Voltammetric electronic tongue to identify Brett character in wines. On-site quantification of its ethylphenol metabolites. Talanta 2018, 179, 70–74. [Google Scholar] [CrossRef]
- Serrano, N.; González-Calabuig, A.; del Valle, M. Crown ether-modified electrodes for the simultaneous stripping voltammetric determination of Cd(II), Pb(II) and Cu(II). Talanta 2015, 138, 130–137. [Google Scholar] [CrossRef]
- del Valle, M. Sensor arrays and electronic tongue systems. Int. J. Electrochem. 2012, 2012, 986025. [Google Scholar] [CrossRef]
- Cetó, X.; Céspedes, F.; del Valle, M. Comparison of methods for the processing of voltammetric electronic tongues data. Microchim. Acta 2013, 180, 319–330. [Google Scholar] [CrossRef]
- Dhara, K.; Mahapatra, D.R. Electrochemical nonenzymatic sensing of glucose using advanced nanomaterials. Microchim. Acta 2018, 185, 49. [Google Scholar]
- American Public Health Association; American Water Works Association; Water Environment Federation. Standard Methods for the Examination of Water and Wastewater, 23rd ed.; American Public Health Association: Washington, DC, USA; American Water Works Association: Washington, DC, USA; Water Environment Federation: Washington, DC, USA, 2017. [Google Scholar]
- Cetó, X.; del Valle, M. Electronic tongue applications for wastewater and soil analysis. iScience 2022, 25, 104304. [Google Scholar] [CrossRef] [PubMed]
- Tønning, E.; Sapelnikova, S.; Christensen, J.; Carlsson, C.; Winther-Nielsen, M.; Dock, E.; Solna, R.; Skladal, P.; Nørgaard, L.; Ruzgas, T.; et al. Chemometric exploration of an amperometric biosensor array for fast determination of wastewater quality. Biosens. Bioelectron. 2005, 21, 608–617. [Google Scholar] [CrossRef]
- Gutés, A.; Cespedes, F.; del Valle, M.; Louthander, D.; Krantz-Rülcker, C.; Winquist, F. A flow injection voltammetric electronic tongue applied to paper mill industrial waters. Sens. Actuators B Chem. 2006, 115, 390–395. [Google Scholar] [CrossRef]
- Campos, I.; Alcañiz, M.; Aguado, D.; Barat, R.; Ferrer, J.; Gil, L.; Marrakchi, M.; Martínez-Mañez, R.; Soto, J.; Vivancos, J.-L. A voltammetric electronic tongue as tool for water quality monitoring in wastewater treatment plants. Water Res. 2012, 46, 2605–2614. [Google Scholar] [CrossRef]
- Czolkos, I.; Dock, E.; Tønning, E.; Christensen, J.; Winther-Nielsen, M.; Carlsson, C.; Mojzíková, R.; Skládal, P.; Wollenberger, U.; Nørgaard, L.; et al. Prediction of wastewater quality using amperometric bioelectronic tongues. Biosens. Bioelectron. 2016, 75, 375–382. [Google Scholar] [CrossRef]
- Legin, E.; Zadorozhnaya, O.; Khaydukova, M.; Kirsanov, D.; Rybakin, V.; Zagrebin, A.; Ignatyeva, N.; Ashina, J.; Sarkar, S.; Mukherjee, S.; et al. Rapid evaluation of integral quality and safety of surface and waste waters by a multisensor system (electronic tongue). Sensors 2019, 19, 2019. [Google Scholar] [CrossRef]
- Bui, H.M.; Bui, H.N.; Le, T.M.; Karri, R.R. Application of artificial neural networks on water and wastewater prediction: A review. In Soft Computing Techniques in Solid Waste and Wastewater Management; Karri, R.R., Ravindran, G., Dehghani, M.H., Eds.; Elsevier: Amsterdam, The Netherlands, 2021; pp. 95–109. [Google Scholar]


| Compound | Equation | Linear Range | Limit of Detection |
|---|---|---|---|
| Glucose | y = 1.0281x + 85.90, R² = 0.9996 | 30~800 mg/L O2 | 15.7 mg/L O2 |
| Glycine | y = 3.3315x + 167.19, R² = 0.9991 | 10~180 mg/L O2 | 4.6 mg/L O2 |
| Sensor | RSD% 1 | RSD% 2 |
|---|---|---|
| CuO/Cu | 2.91% | 2.64% |
| Cu NPs | 3.60% | 2.21% |
| CuO NPs | 3.95% | 2.69% |
| Ni Cu NPs | 0.69% | 2.88% |
| Ni NPs | 3.19% | 2.80% |
| Sensor | RSD% 1 | RSD% 2 |
|---|---|---|
| CuO/Cu | 1.82% | 1.43% |
| Cu NPs | 1.63% | 2.22% |
| CuO NPs | 2.84% | 1.97% |
| Ni Cu NPs | 2.94% | 1.00% |
| Ni NPs | 4.58% | 1.55% |
| Compound | Sensitivity (μA/mg/L O2) | Intercept (μA) | R2 | Linear Range (mg/L O2) | Limit of Detection (mg/L O2) |
|---|---|---|---|---|---|
| Glucose | 0.9732 | 1.48 | 0.9997 | 20–800 | 13.6 |
| Glycine | 2.662 | 5.94 | 0.9998 | 20–200 | 4.1 |
| Data Set | Slope | Intercept (mg/L O2) | R2 | RMSE (mg/L O2) |
|---|---|---|---|---|
| Training | 0.997 ± 0.027 | 6 ± 18 | 0.998 | 11.3 |
| Testing | 0.996 ± 0.077 | 4 ± 45 | 0.991 | 16.6 |
| Sample | Spiked COD (mg/L O2) | y = 0.9732x + 1.4830 a COD (mg/L O2) | y = 2.662x − 5.937 b COD (mg/L O2) | ANN COD (mg/L O2) | Colorimetric COD (mg/L O2) |
|---|---|---|---|---|---|
| R1 | -- | 99.32 | 41.88 | -- | 12.10 |
| R2 | -- | 102.7 | 43.12 | -- | 15.10 |
| R3 | -- | 98.06 | 41.43 | -- | 9.21 |
| R4 | -- | 100.8 | 42.43 | -- | 5.24 |
| R5 | -- | 105.6 | 44.18 | -- | 11.70 |
| S1 | 187.3 (glycine) | 481.8 | 178.9 | 141.9 | 216.0 |
| S2 | 376.5 (glucose) | 402.1 | 149.8 | 284.7 | 416.0 |
| S3 | 320.0 (glucose + glycine) | 361.1 | 134.8 | 286.7 | 342.0 |
| S4 | 234.4 (glucose + glycine) | 466.7 | 173.4 | 211.0 | 260.0 |
| S5 | 686.5 (glucose + glycine) | 868.3 | 320.2 | 659.7 | 719.0 |
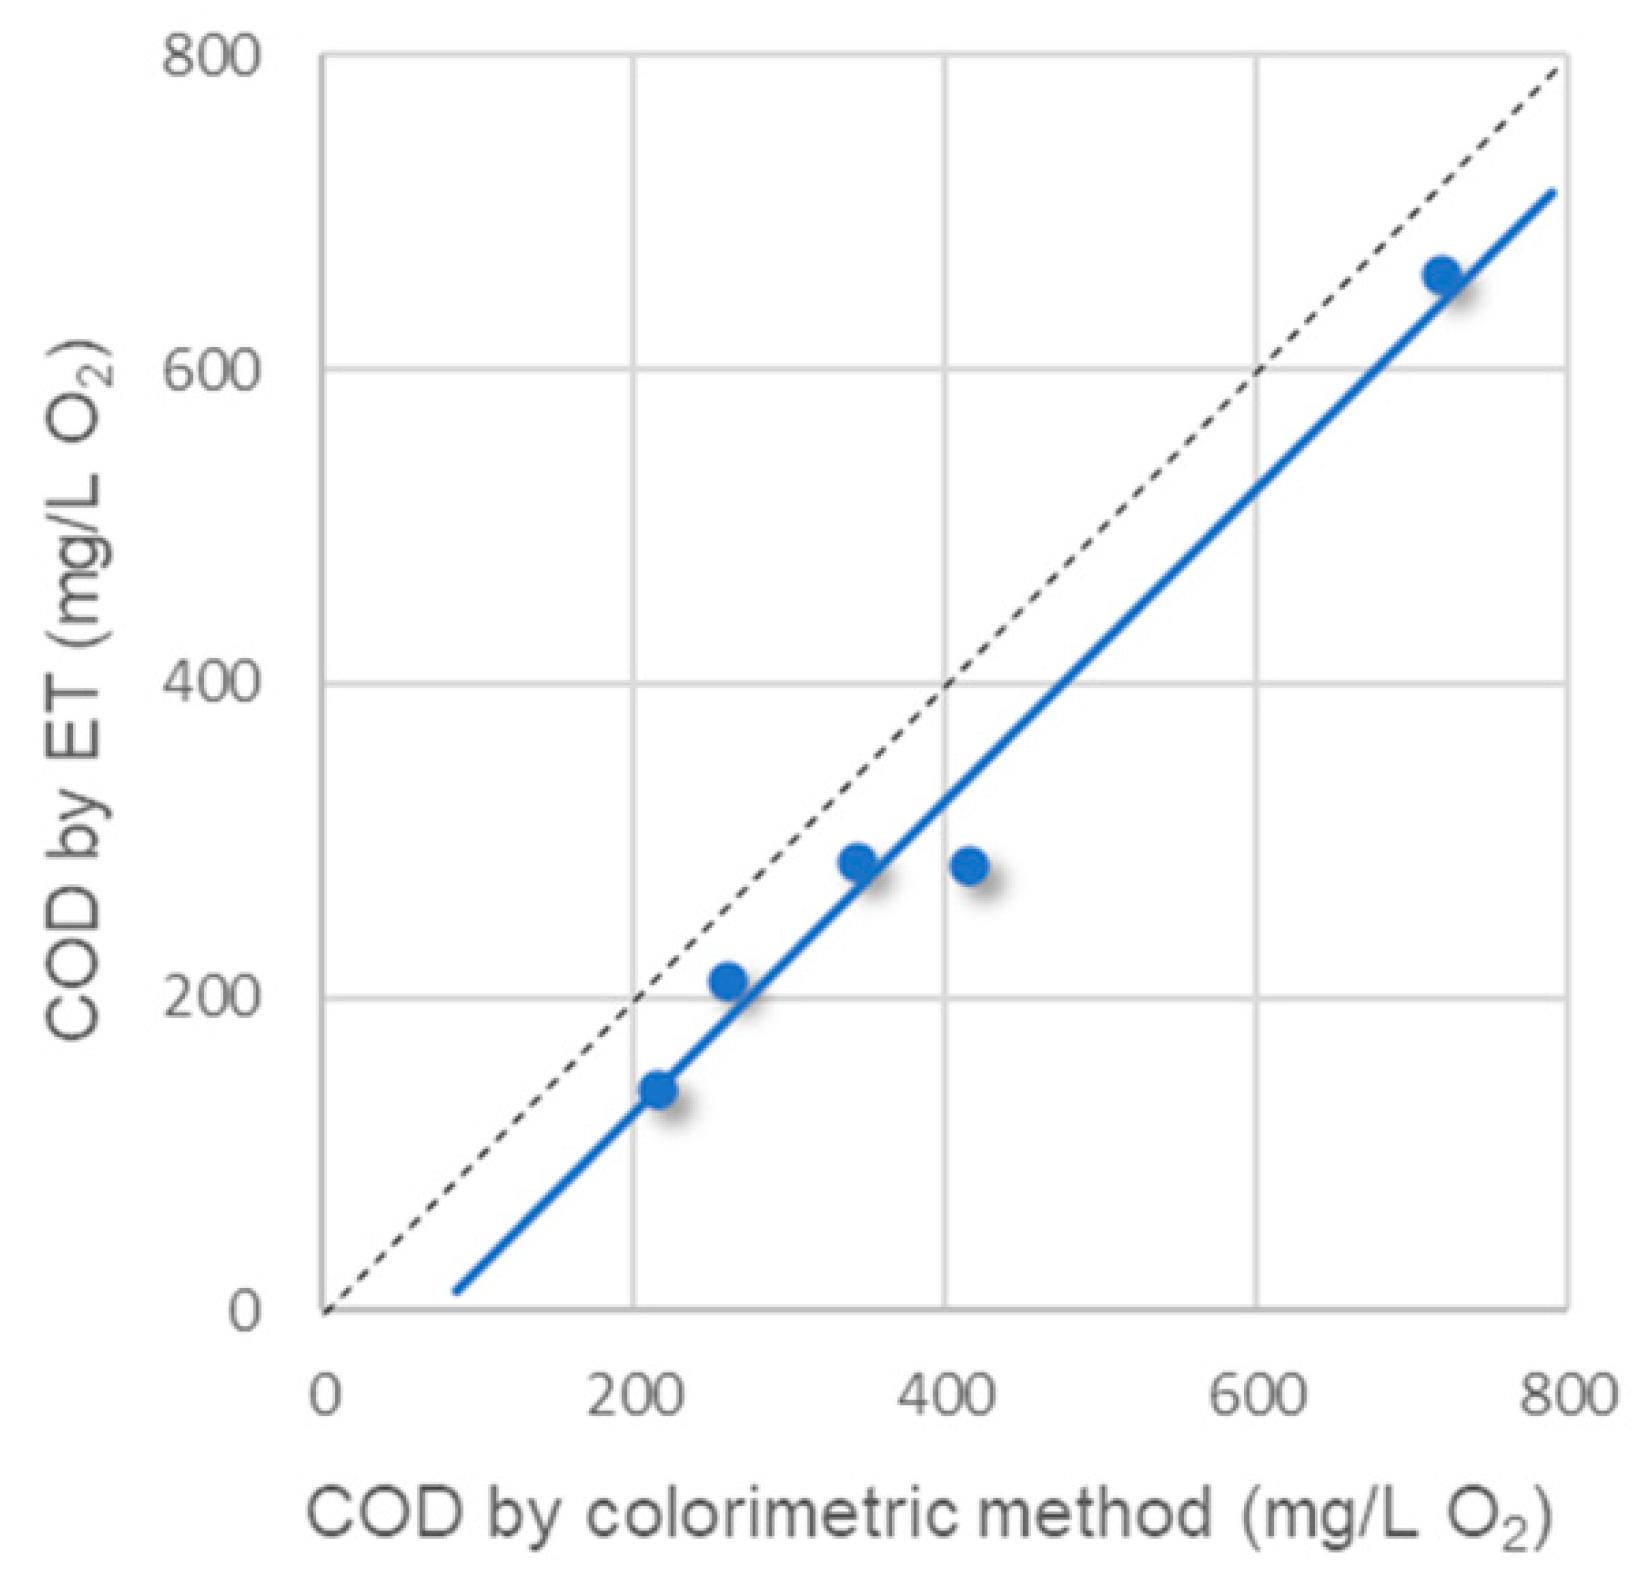
| Results Compared | Comparison Line | R2 (n = 5) |
|---|---|---|
| ET vs. Spiked | Y = 1.0132 × X − 48.9 | 0.9383 |
| Colorimetric vs. Spiked | Y = 1.0134 × X + 24.8 | 0.9553 |
| Volt 1 a vs. Spiked | Y = 0.8532 × X + 208 | 0.5384 |
| Volt 2 b vs. Spiked | Y = 0.8701 × X + 240 | 0.7413 |
| ET vs. Colorimetric | Y = 0.9949 × X − 71.9 | 0.9723 c |
| Volt 1 a vs. Colorimetric | Y = 0.3119 × X + 78.8 | 0.5385 |
| Volt 2 b vs. Colorimetric | Y = 0.3181 × X + 90.7 | 0.7414 |
Publisher’s Note: MDPI stays neutral with regard to jurisdictional claims in published maps and institutional affiliations. |
© 2022 by the authors. Licensee MDPI, Basel, Switzerland. This article is an open access article distributed under the terms and conditions of the Creative Commons Attribution (CC BY) license (https://creativecommons.org/licenses/by/4.0/).
Share and Cite
Wang, Q.; Cetó, X.; Valle, M.d. Quantitative Estimation of COD Values from an Array of Metal Nanoparticle Modified Electrodes and Artificial Neural Networks. Chemosensors 2022, 10, 504. https://doi.org/10.3390/chemosensors10120504
Wang Q, Cetó X, Valle Md. Quantitative Estimation of COD Values from an Array of Metal Nanoparticle Modified Electrodes and Artificial Neural Networks. Chemosensors. 2022; 10(12):504. https://doi.org/10.3390/chemosensors10120504
Chicago/Turabian StyleWang, Qing, Xavier Cetó, and Manel del Valle. 2022. "Quantitative Estimation of COD Values from an Array of Metal Nanoparticle Modified Electrodes and Artificial Neural Networks" Chemosensors 10, no. 12: 504. https://doi.org/10.3390/chemosensors10120504
APA StyleWang, Q., Cetó, X., & Valle, M. d. (2022). Quantitative Estimation of COD Values from an Array of Metal Nanoparticle Modified Electrodes and Artificial Neural Networks. Chemosensors, 10(12), 504. https://doi.org/10.3390/chemosensors10120504