Abstract
We present a colorimetric sensor based on functionalized silver nanoparticles for the detection of metal ions in aqueous solutions. The interaction between the target metal ion and the functionalizing agent triggers the aggregation of these nanoparticles, and the consequent change in optical properties allows the detection/quantification of the analyte. In detail, this work describes the synthesis of AgNPs by a chemical reduction method, and the production of mercaptoundecanoic acid functionalized NPs with different surface densities (multi-, full-, and two partial layers). UV-Vis spectroscopy was used to monitor the functionalization processes, and to investigate the aggregation behavior of each AgNPs@11MUA sensor upon titration with the metal ions of interest, namely Ni2+, Zn2+, Co2+, Cd2+, Mn2+, and Cu2+. The resulting UV-Vis raw data obtained for each layer density were submitted to principal component analysis to dissect the role of the metal ions in NP aggregation and in establishing the sensitivity and selectivity of the AgNPs@11MUA sensor. Interestingly, we observed an increase in sensor sensitivity and selectivity at a lower density of the functionalizing agent on the AgNPs’ surface, which results in characteristic colors of the NP suspension upon titration with each metal ion.
1. Introduction
The progressive development of anthropic activities has contributed to an increase in the environmental levels of several toxic pollutants, such as heavy metal ions, anions, organic compounds, dyes, drugs, pesticides, bacteria, viruses, and gases [1], with hazardous consequences to human health [2]. Great efforts have been devoted to developing analytical methods for their rapid, real-time, sensitive, and selective determination [3]. In this context, recent advances in nanotechnology and materials science have prompted the use of nanoparticles (NPs) [4], quantum dots [5,6,7], carbon nanotubes [8], graphene [9,10,11], nano-sheets [12] and other two-dimensional nanomaterials in the field of sensors [10].
In particular, nanoparticle-based colorimetric sensors exhibited promising results in the detection of metallic ions [13], organic dyes [14], drugs [15], pesticides [16], and viruses [17], with their sensing mechanism mainly relying on NP aggregation [18,19,20]. Their popularity is also growing rapidly due to their ease of fabrication, rapid detection, high sensitivity, and naked-eye sensing [21].
Gold, silver, and copper NPs are the most widely used metallic NPs [22] with unique optical properties due to strong surface plasmon resonance (SPR) [23,24,25], which is generated by the collective oscillation of electrons at the interface between metal and dielectric [26].
Among these, silver nanoparticles (AgNPs) are largely used as optical sensing materials [27,28] due to their cost-effective properties compared with AuNPs and broader range of applications compared with CuNPs (which cannot be used in aqueous solvents [29]). Most importantly, AgNPs display high values in the molar extinction coefficients in the range 108–1011 M−1 cm−1 in their absorption band [30], also known as the surface plasmon absorption band (SPAB), which lies in the range 390–600 nm depending on the shape, dimension, composition, and dielectric constant [31], resulting in an unambiguous color of the colloidal suspension [32,33].
In these aggregation-based sensors, the chromatic variation in the colloidal suspension is triggered by the interaction of the NPs with the analyte of interest [20], which is accompanied by the appearance of a second SPAB at a higher wavelength [34]. In fact, the decrease in the interparticle distance (induced by the nanoparticle aggregation) leads to a strong plasmon coupling between the nearby particles, which in turn causes changes in the plasmon bands and a consequent change in the color of the colloidal solution [35,36].
Although several research articles focus on the identification of the optimal functionalizing agent for the detection/quantification of a given analyte, no studies on the correlation between the sensor behavior and the density of the functionalized layer are currently available. To fill this gap, in this work we report on the synthesis and characterization of AgNPs and the functionalization thereof with different levels of 11MUA. Most importantly, AgNPs@11MUA at different layer densities were individually titrated with a panel of the most common heavy metals ions (namely Ni2+, Zn2+, Co2+, Cd2+, Mn2+, and Cu2+) [37], and the corresponding changes in SPAB were discussed. To further dissect spectral features associated with each AgNPs@11MUA’s density layer, a multivariate approach was exploited to compare the effect of the different metal ions, relying on principal component analysis (PCA) directly applied to the SPAB, which could be considered the “chemical fingerprint” of the samples under investigation [38].
2. Materials and Methods
2.1. Materials
Silver nitrate (AgNO3), sodium borohydride (NaBH4), mercaptoundecanoic acid (11MUA), NiCl2, CoCl2, ZnCl2, CuCl2, MnCl2, and CdCl2 were purchased from Sigma-Aldrich (St. Louis, MO, USA). All these chemicals were used as received without further purification. Aqua regia was used to wash all the glassware before being used. Ultrapure water (18.2 µS/cm) produced by Milli-Q® Advantage A10, Merk, was used to prepare all the solutions.
2.2. Synthesis and Surface Functionalization of AgNPs
Functionalized AgNPs were obtained with the same procedure reported in our previous work [13]. Briefly, AgNPs were synthesized by adding 1 mL of freshly prepared water solution of NaBH4 (0.25 M) to 50 mL of AgNO3-containing water solution (0.001 M) and stirred for 30 min. For the functionalization, a specific amount of a stock solution of 11MUA in NaOH-solution (0.6 M, pH = 9) was added to the particle suspension and stirred for 24 h. The exact amount of 11MUA added to each AgNP suspension is reported in Table 1.

Table 1.
The number of moles of 11MUA added to the AgNP suspension for the functionalization, corresponding number of 11MUA molecules per nanoparticle, and % of saturation for ML = multi-layer, FL = full-layer, and PL1,2 = partial layers, respectively.
2.3. Characterization of Bare and Functionalized AgNPs
UV-Vis spectra of AgNPs and AgNPs@11MUA at different layer densities and the SPABs observed at each step of the titration were acquired with a Cary 8454 Diode Array System spectrophotometer (Agilent Technologies, Santa Clara, CA, USA).
X-ray diffraction (XRD) of AgNPs was carried out using a custom horizontal Debye–Scherrer diffractometer as described elsewhere [39].
2.4. Colorimetric Response Investigation
The colorimetric response of the AgNPs@11MUA sensor was investigated upon stepwise additions of 10 µL of each metal stock solution (0.1 mM) to the AgNPs@11MUA suspension. SPAB was acquired at each step of titration to build the dose/response curves.
2.5. Morphological Analysis by Scanning Electron Microscopy (SEM)
Field emission scanning electron microscopy (FE-SEM, Sigma 300, Zeiss, Germany) operating at 7 kV, equipped with energy dispersive X-ray spectroscopy (EDX, Quantax, EDS, Bruker, Billerica, MA, USA), was used to evaluate the morphology of AgNPs and AgNPs@11MUA. Samples were prepared as described elsewhere [13].
2.6. Multivariate Data Treatment
UV-Vis spectra were collected at each step of the titration of 11MUA-coated AgNPs with all the metal ions of interest, and the overall dataset was submitted to PCA, applying autoscaling as column pretreatment. This procedure was individually repeated for each layer density. Only the region from 300 to 800 nm was considered, since it was the most informative portion of the spectrum for this investigation. The multivariate data treatment was performed using the open-source software CAT [40].
3. Results and Discussions
3.1. Scanning Electron Microscopy Characterization
AgNPs morphology was revealed by SEM characterization; the particles displayed a spherical distribution, characteristic of AgNPs that possess a SPAB in the range 350–450 nm [41]. Size analysis was performed by ImageJ software on 200 nanoparticles and data were fitted by normal distribution, revealing an average diameter of ~23.07 ± 5.12 nm (Figure 1). The absence of stabilizers, which was necessary to ensure that only 11MUA was bonded on the surface of the particles, caused polydispersity in the NPs’ distribution. Upon functionalization, AgNPs retained the same morphology as demonstrated in our previous work [13].
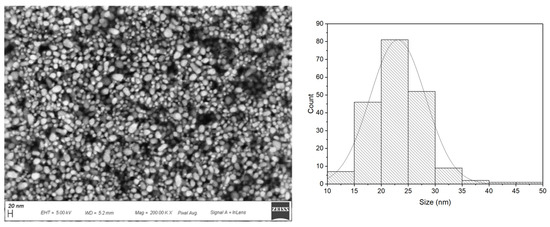
Figure 1.
SEM image of AgNPs 11MUA at Mag = 200.00 K× (left panel). Particle size distribution (~ 23.07 ± 5.12 nm) obtained by size analysis with ImageJ software (right panel).
3.2. Functionalization of AgNPs with Different Layer Densities
The number of 11MUA molecules necessary to form one monolayer functionalization was calculated on the assumption that a maximum of 3 ± 1 molecules of 11MUA can be packed in 1 nm2 [42]. The surface of the nanoparticles was calculated by size distribution analysis of AgNPs, as described in the Experimental Section. Assuming that all the Ag-ions react to form AgNPs, the number of particles in the colloidal suspension was calculated by Equation (1) [43]:
where “” is the density of the face-centered cubic (fcc) silver (=10.5 g/cm3), “” is the mean radius of the particles (11.5 nm = 11.5 × 10⁻⁷ cm), and “” is the mass of silver (0.0054 g). Postulating a spherical distribution of NPs, the surface area of the particles was calculated by Equation (2):
where is the number of NPs previously obtained, and “” is the surface of NPs obtained by considering the mean radius of NPs in cm2. Therefore, the amount of 11MUA to obtain a monolayer functionalization can be easily obtained (Sa × 3 × MUA/nm2). Table 1 reports the number of 11MUA molecules per nanoparticle in the different synthesized layers. Specifically, in the full-layer functionalization (FL), 2.42 × 10¹⁴ molecules of 11MUA were present on a single nanoparticle, whereas in the multi-layer (ML), the number of 11MUA molecules increased 100-fold. Two different partial layers (PL1,2) were synthesized using 2.42 × 10¹² and 2.42 × 10⁸ molecules of 11MUA per NP, respectively.
3.3. Spectrophotometer Characterization of Bare AgNPs and AgNPs@11MUA
The colorless to pale-yellow change after the addition of a reducing agent to the solution containing Ag+ confirmed the formation of bare silver nanoparticles. The successful formation of AgNPs was further verified by XRD (Figure S5). The addition of a functionalizing agent caused the increase in the color intensity of the AgNP suspension. The SPAB of bare AgNPs showed a strong absorption at 392 nm, characteristic of spherical AgNPs, whereas AgNPs functionalized with different concentrations of 11MUA (Table 1) resulted in a red shift (393–440 nm) of the SPAB due to the interaction between thiol group on the surface of the NPs (Figure 2) [44,45,46].
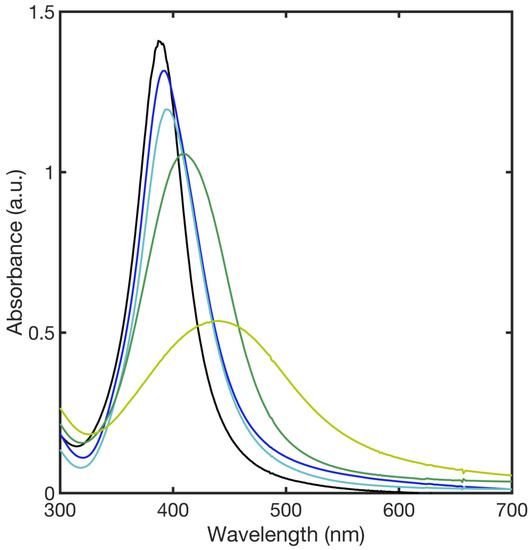
Figure 2.
SPAB of the bare AgNPs (black line), and SPABs of AgNPs after the functionalization with a multi-layer (blue line), full layer (cyan line), and two different partial layers, PL1 (green line) and PL2 (yellow line), respectively.
3.4. Spectrophotometric Characterization of 11MUA–Metal-Ion Interactions
The interactions between free mercaptoundecanoic acid and different metal ions were investigated by UV-Vis spectroscopy to rule out possible interferences of the metal–ligand complex with the SPAB of AgNP@11MUA. UV-Vis spectra (Figure 3) showed absorption bands at wavelengths below 290 nm for all the investigated metal ions. Interaction between Cu2+ and Mn2+, with 11MUA also showing a broad and low-intensity absorbance at 400 nm. Therefore, we could reasonably argue that the individual second SPAB generated upon the interaction between AgNPs@11MUA and the metal ions of interest (M) is mainly attributable to the formation of the AgNPs@11MUA-M lattice.
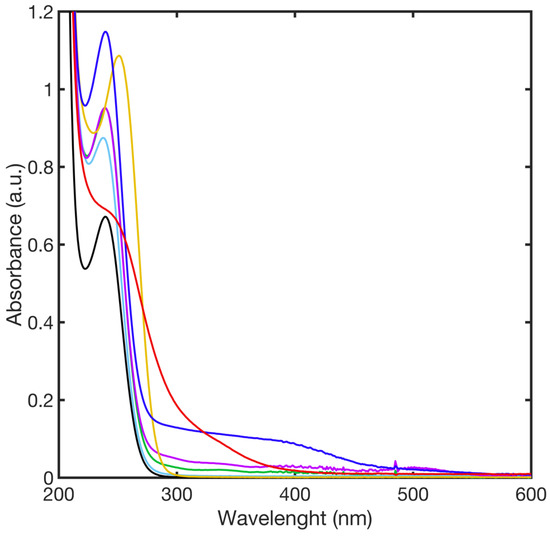
Figure 3.
UV-Vis spectra of complexes formed upon the addition of metal ions to the 11MUA in NaOH solution; 11MUA (black line), Ni2+ (green line), Mn2+ (blue line), Cu2+ (red line), Zn2+ (cyan line), Co2+ (purple line), and Cd2+ (yellow line).
3.5. Titration of AgNPs@11MUA with Metal Ions
Specifically, different AgNPs colloidal suspensions with different surface densities (ML, FL, PL1, and PL2) were titrated with each metal-ion solution (Ni2+, Zn2+, Cu2+, Cd2+, Co2+, Cr2+) and the consequent aggregation was evaluated by UV-Vis spectroscopy.
3.5.1. ML–AgNPs@11MUA
Upon titration of ML–AgNPs@11MUA with metal ions, the corresponding UV-Vis spectra did not show the appearance of the second SPAB, characteristic of aggregated NPs. Figure 4 shows a representative superimposition of spectra obtained at the highest concentration of tested metal ions and the relationship between absorbance ratio (Abs550/Abs420) and metal-ion concentration.
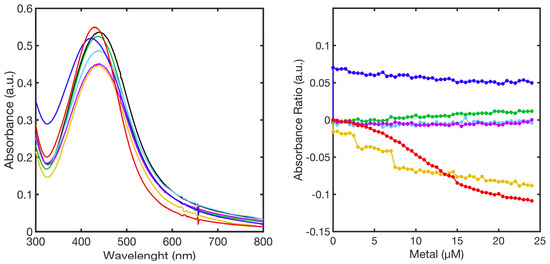
Figure 4.
SPABs of ML–AgNPs@11MUA (black line) obtained at the highest concentration of metal ions (left-panel); calibration curve showing the relationship between absorbance ratio and metal ion concentration used in the titrations (right-panel). Ni2+ (green line), Mn2+ (blue line), Cu2+ (red line), Zn2+ (cyan line), Co2+ (purple line), and Cd2+ (yellow line).
Additional information was obtained by submitting the entire dataset to principal component analysis. In this case, PC1 and PC2 together accounted for 95.70% of the percentage variance. The loadings plot (Figure S1) clearly showed that PC1 represented 85.32% of the spectra variation for the entire region (300–800 nm) whereas PC2 represented 10.38% of variance, which allowed us to distinguish samples with signals in the region below 500 nm, located in the positive part of the axis, from those reporting signals above 500 nm, placed in the negative part of the axes.
In the scores plot (Figure 5), no clear distinction among the different metal ions was observed alongside PC1 or PC2. Nevertheless, when considering metal ions individually, PC1 revealed variations in the UV-Vis spectra upon titration even in the absence of the second SPAB, with a resulting decrease in the score value. The highest effect was observed when Cu2+ and Cd2+ were added to ML–AgNPs@11MUA, whereas no variation was observed for Mn2+.
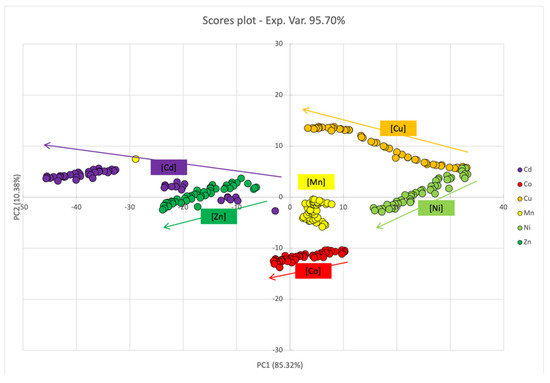
Figure 5.
PCA score plot for PC1 and PC2 components upon titration of SPABs of ML–AgNPs@11MUA with each metal ion.
The blue shift observed for the SPAB can be rationalized by hypothesizing that, at concentrations of 11MUA far greater than in the FL, the functionalizing agent can form a multilayer due to the formation of either secondary interactions (even layers) or disulfide bonds (odd layers) between the surface-bound 11MUA and free 11MUA [47,48]. The formation of this multilayer was confirmed by the strong change in the SPAB observed upon functionalization, as previously demonstrated for analogous functionalized NPs [49,50].
Based on this assumption, the titration of ML–AgNPs@11MUA with metal ions could promote the formation of Met2+-SH and Met2+-COOH coordination complexes and disrupt the secondary MUA–MUA interactions that stabilize the multilayer, eventually reversing the red shift of the SPAB associated with the formation of the multilayer (Figure 6) [51,52,53].

Figure 6.
Schematic representation of the multi-layer arrangement for ML–AgNPs@11MUA on the surface of the NPs.  indicates the metal ions that could disrupt MUA–MUA secondary interactions.
 indicates the metal ions that could disrupt MUA–MUA secondary interactions.
3.5.2. FL–AgNPs@11MUA
The analysis of the SPABs upon titration of FL–AgNPs@11MUA with metal ions revealed a metal-type-dependent aggregation behavior. The comparison of the spectra obtained at the highest concentration of each metal ion showed that FL–AgNPs@11MUA fully aggregated after the addition of 10µM Ni2+ and 17 µM of Mn2+ and Cd2+. Differently, Zn2+, Cu2+, and Co2+ were extremely inactive, as the aggregation of FL–AgNPs@11MUA was not triggered upon additions in the same concentration range (Figure 7, left panel).
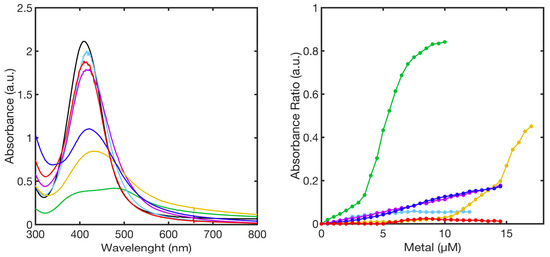
Figure 7.
SPABs of FL–AgNPs@11MUA (black line) obtained at the highest concentration of metal ions (left-panel); calibration curve showing the relationship between absorbance ratio and metal ion concentration used in the titrations (right-panel). Ni2+ (green line), Mn2+ (blue line), Cu2+ (red line), Zn2+ (cyan line), Co2+ (purple line), and Cd2+ (yellow line).
The superimposition of titration curves (Abs550/Abs414 vs metal concentration) reported in Figure 7, right panel, is representative of the sensor sensitivity to each metal.
In this case too, submitting the entire dataset to PCA, PC1 and PC2 together accounted for an high percentage of variance (90.11%). Specifically, the analysis of the loadings plot (Figure S2), showed that the separation alongside PC1 (62.89%) was mainly attributed to the region of the spectra above 500 nm, with a positive contribution, and to the region between 350 and 450 nm, with a negative contribution; on the other hand, the separation along PC2 was associated with changes in the SPAB at 350 and 450 nm, with a positive contribution.
The scores plot (Figure 8) revealed no significative change in the UV-Vis spectra upon titration with Cu2+ and Zn2+. Conversely, PC1 and (only to a minor extent) PC2 score values increased with Co2+, Mn2+, and Cd2+ concentrations; this behavior was likely dependent upon the simultaneous decrease in the intensity of the SPABs characteristic of dispersed ML–AgNPs@11MUA, and the broadening of the SPABs (no well-defined second SPAB was observed). Conversely, a different trend was observed for Ni2+, since it was clearly separated alongside PC1, due to a decrease in the signal intensity of dispersed ML–AgNPS@11MUA at increasing concentrations, and alongside PC2, due to the formation of a second well-defined SPAB [13].
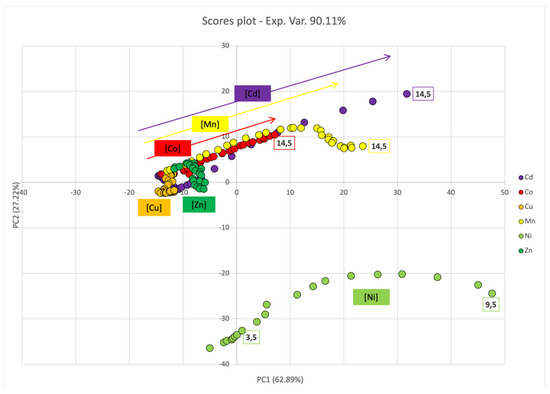
Figure 8.
PCA score plot for PC1 and PC2 components upon titration of SPABs of FL–AgNPs@11MUA with each metal ion.
3.5.3. PL1,2–AgNPs@11MUA
The interaction between metal ions and partially functionalized AgNPs, namely PL1 and PL2 (2 × 10¹² and 2 × 10⁸ molecules of 11MUA per NP, respectively), was investigated by UV-Vis spectroscopy upon titrations with each metal ion. Generally, a second SPAB was observed at a higher wavelength, indicating the aggregation of AgNPs. Table 2 summarizes the position of the second SPABs, identified by the deconvolution of the spectra with a lognormal function, for each metal for PL1 and PL2, respectively [54,55].

Table 2.
Wavelength position of the second SPABs in nm obtained by spectra deconvolution using a lognormal distribution.
The UV-Vis titration spectra of PL1-AgNPs@11MUA with each metal ion at the highest concentration, and the corresponding titration curves (Abs2ndSPAB/Abs397 vs concentration) showed that all metal ions caused the full aggregation of the PL1-AgNPS@11MUA at ~20 µM of metal ion (Figure 9).
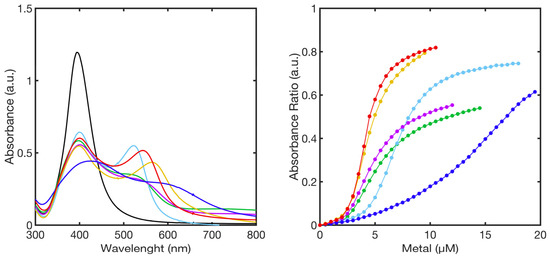
Figure 9.
Superimposition of UV-Vis spectra of PL1-AgNPs@11MUA (black line) obtained at the highest concentration of metal ions (left-panel), calibration curve showing the relationship between absorbance ratio and metal concentration used in the titrations (right-panel). Ni2+ (green line), Mn2+ (blue line), Cu2+ (red line), Zn2+ (cyan line), Co2+ (purple line), and Cd2+ (yellow line).
All the titration curves showed three major regions: an “initial zone”, in which only a few clusters of PL1-AgNPS@11MUA-M are formed; an “intermediate zone”, in which the addition of metal ions caused a strong change in the SPAB resulting in the formation of a superlattice of previously formed PL1-AgNPS@11MUA-M clusters [56]; and a “pre-saturation zone” in which the superlattice reaches a critical size and collapses. Interestingly, upon individual titration, particular colors were observed for each metal ion (Figure 10).
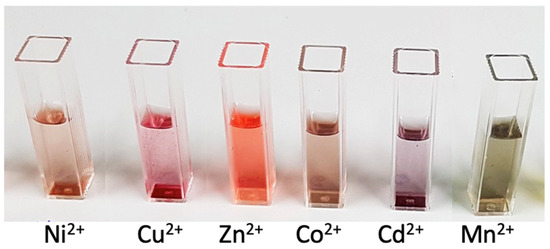
Figure 10.
PL1-AgNPs@11MUA upon the addition of each metal ion at the highest concentration of metal ion added before the collapse.
Considering the multivariate analysis in the case of partial monolayer, PC1 and PC2 accounted for 80.6% of the experimental variance (see loading plot Figure S3). Analyzing the loading plot in Figure S3, alongside PC1 (60.26%), 450 nm emerged as the discriminating wavelength between positive (>450 nm) and negative contributions (<450 nm), whereas PC2 (20.20%) was associated with SPAB broadening (local maxima at approximately 350 nm and 435 nm) and the appearance of signals between 450 and 600. Peak shift and background had a positive contribution, whereas the 450–600 zone had a negative contribution.
The scores plot (Figure 11) showed a shift for all metal ions towards higher PC1 score values by increasing the concentration, due to the decrease and increase in the first and second SPAB, respectively. The shift along the PC1 axis also reflected the behavior of the titration curves reported in Figure 9 (right panel), since it followed the same trend with a higher shift in the “intermediate zone”. Additionally, the PC1 score also evidenced that the optimal sensing zone depended on the type of metal ion added to the PL1-AgNPS@11MUA. PC2 instead discriminated the metal ions mainly on the position of the second SPAB; in fact, those metal ions that generate secondary well-resolved SPABs (and do not cause a high enlargement of the first SPAB), were placed in the bottom part of the score plot. This behavior was found for Zn2+, Cd2+, and Cu2+. Conversely, those metals that did not show a second well-resolved SPAB, such as Ni2+, Mn2+ and, to a lesser extent, Co2+, were in the top part of the plot.
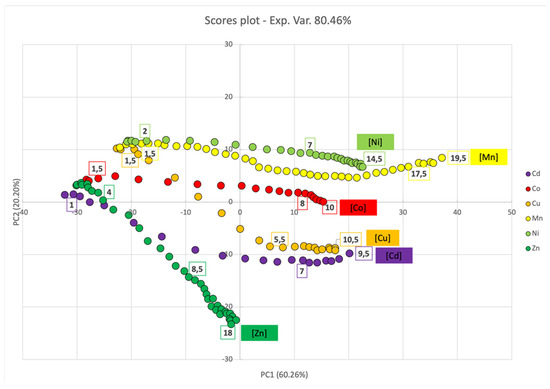
Figure 11.
PCA score plot for PC1 and PC2 components upon titration of SPABs of PL1-AgNPs@11MUA with each metal ion.
At further lower layer density (2 × 10⁸ molecules of 11MUA per NP, PL2-AgNPS@11MUA), a shift toward higher wavelengths of the second SPAB was observed with respect to PL1 (Table 2). As for the other partial layer, the formation of a second well-distinguished SPAB was observed (Figure 12) upon the titration, due to the aggregation of PL2-AgNPS@11MUA; again, the titration curves (Abs2ndSPAB/Abs394 vs. concentration) were characterized by three different parts, with the intermediate zones presenting higher slope values.
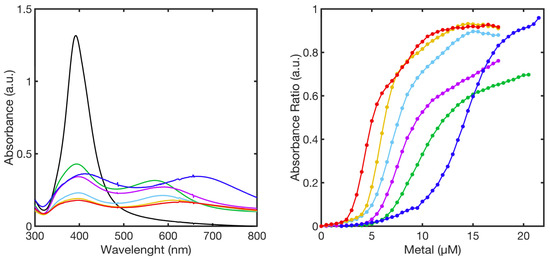
Figure 12.
SPABs of PL2-AgNPs@11MUA (black line) obtained at the highest concentration of metal ions (left-panel), calibration curve showing the relationship between absorbance ratio and metal ions concentration used in the titrations (right-panel). Ni2+ (green line), Mn2+ (blue line), Cu2+ (red line), Zn2+ (cyan line), Co2+ (purple line), and Cd2+ (yellow line).
In the case of PL2-AgNPs@11MUA, PCA analysis revealed a general behavior similar to PL1-AgNPs@11MUA. The scores plot (Figure 13) showed that all metal ions underwent a shift towards higher values, alongside PC1, with increasing metal ion concentrations, due to the decrease in the main SPAB (400 nm) and the appearance of a second SPAB upon aggregation. In line with the titration curves, the shift alongside PC1 was higher in the central zone and its extension was metal-ion dependent. Sample separation alongside PC2 was not so evident, with the sole exclusion of Mn2+, which was unequivocally separated from the other metal ions; this peculiar behavior was likely related to the red shift in the first SPAB at 400 nm (Figure 12, left panel).
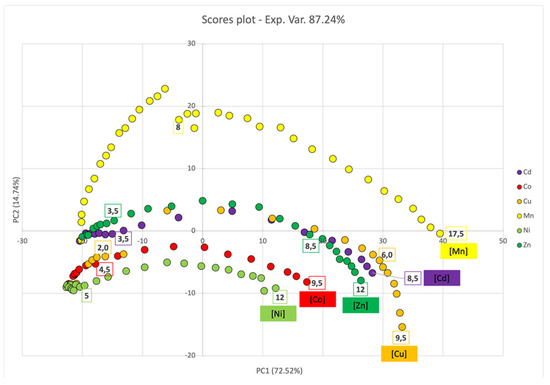
Figure 13.
PCA score plot for PC1 and PC2 components upon titration of SPABs of PL2-AgNPs@11MUA with each metal ion.
4. Conclusions
To dissect the role of coating density in tuning the sensing properties of AgNPs, we produced functionalized silver nanoparticles with different amounts of 11MUA, eventually obtaining multi-layer (ML), full layer (FL), and two partial layers (PL1 and PL2) NPs.
Next, the resulting colloidal suspensions were individually titrated with a selection of the most common metal ions present in wastewater (namely, Ni2+, Zn2+, Co2+, Cd2+, Mn2+, and Cu2+) and the consequent variation in SPABs was followed using UV-Vis spectroscopy.
The differently coated AgNPs displayed major differences in their sensing properties. Specifically, multi-layered ML–AgNPs@11MUA did not undergo aggregation upon titration with each metal ion, showing negligible sensing properties. Nevertheless, PCA analysis disclosed a change in the UV-Vis spectra upon titration with metal ions, which was attributed to the interaction between metal ions and the 11MUA on the external layers.
In the case of full-monolayered FL–AgNPs@11MUA, the aggregation of the nanoparticles was triggered upon titration with Ni2+ (0.5–10 µM), Mn2+, and Cd2+ (0.5–17 µM). Multivariate analysis discriminated metal ions both quantitively and qualitatively. Specifically, Ni2+ was evidently separated from the other metal ions, supporting the specific use of FL–AgNPs@11MUA for its detection [13].
The most interesting results in terms of aggregation were observed when the AgNPs were functionalized with partial layers. PL1-AgNPs@11MUA underwent aggregation upon titration with each metal ion, forming a superlattice of PL1-AgNPS@11MUA-M and causing characteristic colors for each metal ion. At a lower density of the layer (PL2-AgNPS@11MUA), we did not observe any substantial change in the sensor behavior; the main difference consisted in the shift of the second SPAB at higher wavelengths, indicating the formation of a different superlattice due to the lower density of functionalized molecules on the AgNP surface. Additionally, the effect of increasing metal-ion concentration and the discrimination between the metal ions was properly rationalized by PCA analysis for PL1 and PL2. The use of multivariate analysis, even when only exploiting one of its simplest tools, PCA, was extremely helpful in the interpretation of NP behavior, and could support further developments of these sensors for the simultaneous determinations of metal ions in complex mixtures.
To the best of our knowledge, this study demonstrated for the first time that the density of the functionalizing molecules on the surface of AgNPs is critical in establishing the sensor properties. In fact, by tuning the surface density of the functionalizing agent, it was possible to modulate the selectivity and the application range of the AgNPs@11MUA sensor. Given these promising results, additional studies aimed at further dissecting the role of NP coatings are currently underway.
Supplementary Materials
The following supporting information can be downloaded at: https://www.mdpi.com/article/10.3390/chemosensors10110483/s1, Figures S1–S5: Loading plots.
Author Contributions
Conceptualization, A.R., M.C., R.G. and M.A.; methodology, software, validation, investigation, data curation, A.R., L.R.M., M.Z., L.P., R.B. and M.C.; writing—original draft preparation, A.R. and M.C.; writing—review and editing, A.R., M.C. and L.R.M.; visualization, R.G., M.A., R.B. and M.Z.; supervision, R.G., M.A., R.B. and M.C. All authors have read and agreed to the published version of the manuscript.
Funding
This research received no external funding.
Institutional Review Board Statement
Not applicable.
Informed Consent Statement
Not applicable.
Data Availability Statement
The completed data of this study are available from the corresponding author, upon reasonable request.
Acknowledgments
The authors are grateful to the School of Science and Technology of the University of Camerino for the support and scientific resources such as FE-SEM equipment.
Conflicts of Interest
The authors declare no conflict of interest.
References
- Hoffman, J.B.; Hennig, B. Protective influence of healthful nutrition on mechanisms of environmental pollutant toxicity and disease risks. Ann. N. Y. Acad. Sci. 2017, 1398, 99–107. [Google Scholar] [CrossRef]
- Mitra, S.; Chakraborty, A.J.; Tareq, A.M.; Emran, T.B.; Nainu, F.; Khusro, A.; Idris, A.M.; Khandaker, M.U.; Osman, H.; Alhumaydhi, F.A.; et al. Impact of heavy metals on the environment and human health: Novel therapeutic insights to counter the toxicity. J. King Saud Univ. Sci. 2022, 34, 101865. [Google Scholar] [CrossRef]
- Thakur, A.; Kumar, A. Recent advances on rapid detection and remediation of environmental pollutants utilizing nanomaterials-based (bio)sensors. Sci. Total Environ. 2022, 834, 155219. [Google Scholar] [CrossRef] [PubMed]
- Prosposito, P.; Burratti, L.; Venditti, I. Silver Nanoparticles as Colorimetric Sensors for Water Pollutants. Chemosensors 2020, 8, 26. [Google Scholar] [CrossRef]
- Lesiak, A.; Drzozga, K.; Cabaj, J.; Bański, M.; Malecha, K.; Podhorodecki, A. Optical sensors based on II-VI quantum dots. Nanomaterials 2019, 9, 192. [Google Scholar] [CrossRef]
- Shen, L.; Chen, M.; Hu, L.; Chen, X.; Wang, J. Growth and Stabilization of Silver Nanoparticles on Carbon Dots and Sensing Application. Langmuir 2013, 29, 16135–16140. [Google Scholar] [CrossRef]
- Jiménez-López, J.; Llorent-Martínez, E.J.; Ortega-Barrales, P.; Ruiz-Medina, A. Graphene quantum dots-silver nanoparticles as a novel sensitive and selective luminescence probe for the detection of glyphosate in food samples. Talanta 2020, 207, 120344. [Google Scholar] [CrossRef]
- Zhu, L.; Feng, X.; Yang, S.; Wang, J.; Pan, Y.; Ding, J.; Li, C.; Yin, X.; Yu, Y. Colorimetric detection of immunomagnetically captured rare number CTCs using mDNA-wrapped single-walled carbon nanotubes. Biosens. Bioelectron. 2021, 172, 112780. [Google Scholar] [CrossRef]
- da Silva, A.D.; Paschoalino, W.J.; Damasceno, J.P.V.; Kubota, L.T. Structure, Properties, and Electrochemical Sensing Applications of Graphene-Based Materials. ChemElectroChem 2020, 7, 4508–4525. [Google Scholar] [CrossRef]
- Hernaez, M. Applications of graphene-based materials in sensors. Sensors 2020, 20, 3196. [Google Scholar] [CrossRef]
- Kumari, S.; Sharma, P.; Yadav, S.; Kumar, J.; Vij, A.; Rawat, P.; Kumar, S.; Sinha, C.; Bhattacharya, J.; Srivastava, C.M.; et al. A Novel Synthesis of the Graphene Oxide-Silver (GO-Ag) Nanocomposite for Unique Physiochemical Applications. ACS Omega 2020, 5, 5041–5047. [Google Scholar] [CrossRef]
- Majdoub, M.; Amedlous, A.; Anfar, Z.; Moussaoui, O. MoS2 nanosheets/silver nanoparticles anchored onto textile fabric as “dip catalyst” for synergistic p-nitrophenol hydrogenation. Environ. Sci. Pollut. Res. 2021, 28, 64674–64686. [Google Scholar] [CrossRef]
- Rossi, A.; Zannotti, M.; Cuccioloni, M.; Minicucci, M.; Petetta, L.; Angeletti, M.; Giovannetti, R. Silver Nanoparticle-Based Sensor for the Selective Detection of Nickel Ions. Nanomaterials 2021, 11, 1733. [Google Scholar] [CrossRef]
- Zannotti, M.; Rossi, A.; Giovannetti, R. SERS activity of silver nanosphere, triangular nanoplates, hexagonal nanoplates and quasi-spherical nanoparticles: Effect of shape and morphology. Coatings 2020, 10, 288. [Google Scholar] [CrossRef]
- Shaban, S.M.; Moon, B.-S.; Kim, D.-H. Selective and sensitive colorimetric detection of p-aminophenol in human urine and paracetamol drugs based on seed-mediated growth of silver nanoparticles. Environ. Technol. Innov. 2021, 22, 101517. [Google Scholar] [CrossRef]
- Sahu, B.; Kurrey, R.; Khalkho, B.R.; Deb, M.K. α-Cyclodextrin functionalized silver nanoparticles as colorimetric sensor for micro extraction and trace level detection of chlorpyrifos pesticide in fruits and vegetables. Colloids Surf. A Physicochem. Eng. Asp. 2022, 654, 129947. [Google Scholar] [CrossRef]
- Sahu, S.; Sharma, S.; Kurrey, R.; Ghosh, K.K. Recent advances on gold and silver nanoparticle-based colorimetric strategies for the detection of different substances and SARS-CoV-2: A comprehensive review. Environ. Sci. Nano 2022, 9, 3684–3710. [Google Scholar] [CrossRef]
- Sener, G.; Uzun, L.; Denizli, A. Colorimetric sensor array based on gold nanoparticles and amino acids for identification of toxic metal ions in water. ACS Appl. Mater. Interfaces 2014, 6, 18395–18400. [Google Scholar] [CrossRef] [PubMed]
- Singh, R.; Mehra, R.; Walia, A.; Gupta, S.; Chawla, P.; Kumar, H.; Thakur, A.; Kaushik, R.; Kumar, N. Colorimetric sensing approaches based on silver nanoparticles aggregation for determination of toxic metal ions in water sample: A review. Int. J. Environ. Anal. Chem. 2021, 1–16. [Google Scholar] [CrossRef]
- Vilela, D.; González, M.C.; Escarpa, A. Sensing colorimetric approaches based on gold and silver nanoparticles aggregation: Chemical creativity behind the assay. A review. Anal. Chim. Acta 2012, 751, 24–43. [Google Scholar] [CrossRef]
- Alberti, G.; Zanoni, C.; Magnaghi, L.R.; Biesuz, R. Gold and Silver Nanoparticle-Based Colorimetric Sensors: New Trends and Applications. Chemosensors 2021, 9, 305. [Google Scholar] [CrossRef]
- Chen, H.; Zhang, L.; Hu, Y.; Zhou, C.; Lan, W.; Fu, H.; She, Y. Nanomaterials as optical sensors for application in rapid detection of food contaminants, quality and authenticity. Sens. Actuators B Chem. 2021, 329, 129135. [Google Scholar] [CrossRef]
- Amendola, V.; Pilot, R.; Frasconi, M.; Maragò, O.M.; Iatì, M.A. Surface plasmon resonance in gold nanoparticles: A review. J. Phys. Condens. Matter 2017, 29, 203002. [Google Scholar] [CrossRef]
- Jain, P.K.; Huang, X.; El-Sayed, I.H.; El-Sayed, M.A. Review of some interesting surface plasmon resonance-enhanced properties of noble metal nanoparticles and their applications to biosystems. Plasmonics 2007, 2, 107–118. [Google Scholar] [CrossRef]
- Hou, W.; Cronin, S.B. A review of surface plasmon resonance-enhanced photocatalysis. Adv. Funct. Mater. 2013, 23, 1612–1619. [Google Scholar] [CrossRef]
- Kosuda, K.M.; Bingham, J.M.; Wustholz, K.L.; Van Duyne, R.P.; Groarke, R.J. 4.06—Nanostructures and Surface-Enhanced Raman Spectroscopy. In Comprehensive Nanoscience and Nanotechnology, 2nd ed.; Andrews, D.L., Lipson, R.H., Nann, T., Eds.; Academic Press: Oxford, UK, 2016; pp. 117–152. [Google Scholar]
- McFarland, A.D.; Van Duyne, R.P. Single silver nanoparticles as real-time optical sensors with zeptomole sensitivity. Nano Lett. 2003, 3, 1057–1062. [Google Scholar] [CrossRef]
- Wang, C.; Luconi, M.; Masi, A.; Fernández, L. Silver Nanoparticles as Optical Sensors; Intech: Rijeka, Croatia, 2010; Chapter 12. [Google Scholar]
- Pacioni, N.L.; Filippenko, V.; Presseau, N.; Scaiano, J.C. Oxidation of copper nanoparticles in water: Mechanistic insights revealed by oxygen uptake and spectroscopic methods. Dalton Trans. 2013, 42, 5832–5838. [Google Scholar] [CrossRef] [PubMed]
- Paramelle, D.; Sadovoy, A.; Gorelik, S.; Free, P.; Hobley, J.; Fernig, D.G. A rapid method to estimate the concentration of citrate capped silver nanoparticles from UV-visible light spectra. Analyst 2014, 139, 4855–4861. [Google Scholar] [CrossRef]
- Xu, G.; Chen, Y.; Tazawa, M.; Jin, P. Surface Plasmon Resonance of Silver Nanoparticles on Vanadium Dioxide. J. Phys. Chem. B 2006, 110, 2051–2056. [Google Scholar] [CrossRef]
- Ngamchuea, K.; Batchelor-McAuley, C.; Sokolov, S.V.; Compton, R.G. Dynamics of silver nanoparticles in aqueous solution in the presence of metal ions. Anal. Chem. 2017, 89, 10208–10215. [Google Scholar] [CrossRef]
- Loiseau, A.; Zhang, L.; Hu, D.; Salmain, M.; Mazouzi, Y.; Flack, R.; Liedberg, B.; Boujday, S. Core–Shell Gold/Silver Nanoparticles for Localized Surface Plasmon Resonance-Based Naked-Eye Toxin Biosensing. ACS Appl. Mater. Interfaces 2019, 11, 46462–46471. [Google Scholar] [CrossRef] [PubMed]
- Amirjani, A.; Haghshenas, D.F. Ag nanostructures as the surface plasmon resonance (SPR)-based sensors: A mechanistic study with an emphasis on heavy metallic ions detection. Sens. Actuators B Chem. 2018, 273, 1768–1779. [Google Scholar] [CrossRef]
- Ghosh, S.K.; Pal, T. Interparticle Coupling Effect on the Surface Plasmon Resonance of Gold Nanoparticles: From Theory to Applications. Chem. Rev. 2007, 107, 4797–4862. [Google Scholar] [CrossRef] [PubMed]
- Liu, B.; Zhuang, J.; Wei, G. Recent advances in the design of colorimetric sensors for environmental monitoring. Environ. Sci. Nano 2020, 7, 2195–2213. [Google Scholar] [CrossRef]
- Qasem, N.A.A.; Mohammed, R.H.; Lawal, D.U. Removal of heavy metal ions from wastewater: A comprehensive and critical review. Npj Clean Water 2021, 4, 36. [Google Scholar] [CrossRef]
- Bro, R.; Smilde, A.K. Principal component analysis. Anal. Methods 2014, 6, 2812–2831. [Google Scholar] [CrossRef]
- D’Amato, C.A.; Giovannetti, R.; Zannotti, M.; Rommozzi, E.; Minicucci, M.; Gunnella, R.; Di Cicco, A. Band Gap Implications on Nano-TiO2 Surface Modification with Ascorbic Acid for Visible Light-Active Polypropylene Coated Photocatalyst. Nanomaterials 2018, 8, 599. [Google Scholar] [CrossRef]
- Leardi, R.; Polotti, C.M.G. CAT (Chemometric Agile Tool) Freely. Available online: http://gruppochemiometria.it/index.php/software (accessed on 1 September 2022).
- Zannotti, M.; Vicomandi, V.; Rossi, A.; Minicucci, M.; Ferraro, S.; Petetta, L.; Giovannetti, R. Tuning of hydrogen peroxide etching during the synthesis of silver nanoparticles. An application of triangular nanoplates as plasmon sensors for Hg2+ in aqueous solution. J. Mol. Liq. 2020, 309, 113238. [Google Scholar] [CrossRef]
- Hinterwirth, H.; Kappel, S.; Waitz, T.; Prohaska, T.; Lindner, W.; Lämmerhofer, M. Quantifying thiol ligand density of self-assembled monolayers on gold nanoparticles by inductively coupled plasma–mass spectrometry. ACS Nano 2013, 7, 1129–1136. [Google Scholar] [CrossRef]
- Kalishwaralal, K.; BarathManiKanth, S.; Pandian, S.R.K.; Deepak, V.; Gurunathan, S. Silver nanoparticles impede the biofilm formation by Pseudomonas aeruginosa and Staphylococcus epidermidis. Colloids Surf. B Biointerfaces 2010, 79, 340–344. [Google Scholar] [CrossRef]
- Ivanov, M.R.; Bednar, H.R.; Haes, A.J. Investigations of the Mechanism of Gold Nanoparticle Stability and Surface Functionalization in Capillary Electrophoresis. ACS Nano 2009, 3, 386–394. [Google Scholar] [CrossRef] [PubMed]
- Tripathy, S.K.; Yu, Y.-T. Spectroscopic investigation of S–Ag interaction in ω-mercaptoundecanoic acid capped silver nanoparticles. Spectrochim. Acta Part A Mol. Biomol. Spectrosc. 2009, 72, 841–844. [Google Scholar] [CrossRef]
- Haes, A.J.; Zou, S.; Schatz, G.C.; Van Duyne, R.P. Nanoscale Optical Biosensor: Short Range Distance Dependence of the Localized Surface Plasmon Resonance of Noble Metal Nanoparticles. J. Phys. Chem. B 2004, 108, 6961–6968. [Google Scholar] [CrossRef]
- Jennings, G.K.; Laibinis, P.E. Self-Assembled n-Alkanethiolate Monolayers on Underpotentially Deposited Adlayers of Silver and Copper on Gold. J. Am. Chem. Soc. 1997, 119, 5208–5214. [Google Scholar] [CrossRef]
- Love, J.C.; Estroff, L.A.; Kriebel, J.K.; Nuzzo, R.G.; Whitesides, G.M. Self-Assembled Monolayers of Thiolates on Metals as a Form of Nanotechnology. Chem. Rev. 2005, 105, 1103–1170. [Google Scholar] [CrossRef] [PubMed]
- Heriot, S.Y.; Zhang, H.-L.; Evans, S.D.; Richardson, T.H. Multilayers of 4-methylbenzenethiol functionalized gold nanoparticles fabricated by Langmuir–Blodgett and Langmuir–Schaefer deposition. Colloids Surf. A Physicochem. Eng. Asp. 2006, 278, 98–105. [Google Scholar] [CrossRef]
- Taglietti, A.; Diaz Fernandez, Y.A.; Amato, E.; Cucca, L.; Dacarro, G.; Grisoli, P.; Necchi, V.; Pallavicini, P.; Pasotti, L.; Patrini, M. Antibacterial Activity of Glutathione-Coated Silver Nanoparticles against Gram Positive and Gram Negative Bacteria. Langmuir 2012, 28, 8140–8148. [Google Scholar] [CrossRef]
- He, W.; Luo, L.; Liu, Q.; Chen, Z. Colorimetric Sensor Array for Discrimination of Heavy Metal Ions in Aqueous Solution Based on Three Kinds of Thiols as Receptors. Anal. Chem. 2018, 90, 4770–4775. [Google Scholar] [CrossRef]
- Oliveira, C.S.; Nogara, P.A.; Lima, L.S.; Galiciolli, M.E.A.; Souza, J.V.; Aschner, M.; Rocha, J.B.T. Toxic metals that interact with thiol groups and alteration in insect behavior. Curr. Opin. Insect Sci. 2022, 52, 100923. [Google Scholar] [CrossRef]
- Bala, T.; Prasad, B.L.V.; Sastry, M.; Kahaly, M.U.; Waghmare, U.V. Interaction of Different Metal Ions with Carboxylic Acid Group: A Quantitative Study. J. Phys. Chem. A 2007, 111, 6183–6190. [Google Scholar] [CrossRef]
- Laborda, F.; Jiménez-Lamana, J.; Bolea, E.; Castillo, J.R. Selective identification, characterization and determination of dissolved silver(i) and silver nanoparticles based on single particle detection by inductively coupled plasma mass spectrometry. J. Anal. At. Spectrom. 2011, 26, 1362–1371. [Google Scholar] [CrossRef]
- Weiping, C.; Lide, Z. Synthesis and structural and optical properties of mesoporous silica containing silver nanoparticles. J. Phys. Condens. Matter 1997, 9, 7257–7267. [Google Scholar] [CrossRef]
- Si, K.J.; Chen, Y.; Shi, Q.; Cheng, W. Nanoparticle Superlattices: The Roles of Soft Ligands. Adv. Sci. 2018, 5, 1700179. [Google Scholar] [CrossRef] [PubMed]
Publisher’s Note: MDPI stays neutral with regard to jurisdictional claims in published maps and institutional affiliations. |
© 2022 by the authors. Licensee MDPI, Basel, Switzerland. This article is an open access article distributed under the terms and conditions of the Creative Commons Attribution (CC BY) license (https://creativecommons.org/licenses/by/4.0/).