Article

Prospects of Application of Ultramicroelectrode Ensembles for Voltammetric Determination of Compounds with Close Standard Electrode Potentials and Different Diffusion Coefficients

by
Andrey Yu. Arbenin
1,*,
Alexey A. Petrov
1,
Denis V. Nazarov
1,
Evgeny Serebryakov
1,
Sergey O. Kirichenko
1,
Petr S. Vlasov
1,
Elena G. Zemtsova
1,
Vladimir M. Smirnov
1,
Elena E. Danilova
1,
Sergey S. Ermakov
1,
Alexander Vorobyov
2,
Mikhail S. Mukhin
3 and
Alexey M. Mozharov
2
1
Department of Chemistry, St. Petersburg State University, 7/9 Universitetskaya nab., 199034 Saint Petersburg, Russia
2
Renewable Energy Laboratory, Alferov University, Khlopina 8/3, 194021 Saint Petersburg, Russia
3
Department of Informatics, National Research University Higher School of Economics, Kantemirovskaya 3A, 194100 Saint Petersburg, Russia
*
Author to whom correspondence should be addressed.
Chemosensors 2022, 10(10), 433; https://doi.org/10.3390/chemosensors10100433
Submission received: 12 September 2022 / Revised: 10 October 2022 / Accepted: 14 October 2022 / Published: 19 October 2022

Abstract

:
The spherical diffusion that occurs when using ultramicroelectrodes (i.e., electrodes with a characteristic size of 1–10 µm) contributes to a higher mass transfer rate. This leads to equalization of the depletion rates of the near-electrode layer due to the electrochemical reaction and to the supply of the product from the solution depth. This is the reason why, for ultramicroelectrodes, a limiting size of the spherical layer exists in which the concentration gradient is localized (diffusion layer). Thus, a stationary mass transfer mode is achieved, which is expressed in the sigmoidal CV curve’s shape. In ultramicroelectrode arrays, when the diffusion hemispheres are separated, a steady-state diffusion is realized. However, with a decrease in the interelectrode distance, which leads to the diffusion spheres intersection, a mixed regime arises, which is not fully time-independent. The resulting voltammogram’s shape change can serve as an analytical signal in the study of substances with differing diffusion coefficients, since the diffusion layer growth rate and, consequently, the area of intersection of neighboring spheres, depends on it. This work shows the applicability of voltammetry using ensembles of ultramicroelectrodes operating in the transient mode for the analysis of mixtures of electrochemically active compounds with close electrode reaction parameters, such as exchange currents and electrode potential. Ferrocenemethanol esters are used as an example. The applicability of cyclic voltammetry on the UME array for analysis of mixtures was illustrated by means of finite element modelling. The reliability of the modelling results was experimentally proved for ferrocenemethanol esters with glycine and triglycine.

1. Introduction

The use of a few microns-sized electrodes makes it possible, due to purely diffusion-based processes, to achieve a stationary CV response without special hydrodynamic conditions [1,2,3,4,5,6,7,8,9,10,11]. This is achieved due to the presence of the contribution of the radial components of diffusion, when, as the distance from the geometric center of the electrode increases, the volume of the layer of equal thickness (and, hence, the amount of the substance per this layer) increases. The area of the equidistant surface also increases. This prevents depletion of analyte in layers far from the electrode surface. In addition to the stationary response, ultramicroelectrodes are also characterized by a high ratio of the main (Faradaic) signal to the capacitive one, since their area is small, and the discharge current density of electroactive particles, on the contrary, acquires large values [12,13]. The stationary response itself is interesting due to the fact that the current in this mode is a function of the potential, and the time dependence obtained in the experiment can be considered as parametric. As a result, sensors that are extremely convenient in chronoamperometry can be fabricated on the basis of ultramicroelectrodes [14]. Despite the high current density, due to the small area, a single ultramicroelectrode has a rather low total current, which led to the beginning of an active study of ultramicroelectrode arrays, often made in the form of small sensors. To take into account the interaction of electrodes with each other, a theory of the electrochemical behavior of ensembles of ultramicroelectrodes is developed, since the overlapping of the diffusion regions of individual electrodes leads to a change in the form of the Fick’s second law equation and the method of setting its boundary conditions. In the general case, Fick’s law equalizes the time derivative of the concentration and the product of the diffusion coefficient and the result of the action of the Laplace operator on the concentration function (Equation (1)).
C t = D Δ C
The most widely used method for modeling an ensemble of ultramicroelectrodes is to allocate, for each microelectrode, a prism of semi-infinite height, the base of which is limited by a polygon formed by the intersection of the midperpendiculars of the segments connecting its center with the centers of neighboring microelectrodes (Figure 1) [15,16,17].
The flow in the system depends solely on the depletion of the near-electrode space as a result of the electrochemical process, which in turn leads to a concentration gradient (Equation (2)):
J = D C
No-flux boundary condition (Equation (3)):
C ( z ,   r ) = 0
Boundary condition of the electrode reaction (Butler–Volmer equation (4)):
C t = k ( C r e d e α F η R T C o x e ( 1 α ) F η R T )
Here, k is the exchange constant of the electrode reaction, and η is overstrain.
For hexagonally packed ultramicroelectrodes, the effective cylinder radius is (Equation (5)):
R o = L 2 3 3 2 π
The prism is approximated by a cylinder of equivalent cross-sectional area, which allows us to go from the Laplacian of a three-dimensional rectangular Cartesian coordinate system (Equation (6)) to the Laplacian, the form of which is presented in Equation (7):
C t = D ( 2 C x 2 + 2 C y 2 + 2 C z 2 )
C t = D ( 2 C z 2 + 2 C r 2 + 1 r C r )
Equation (5) is much simpler to solve, but even in this form, mathematical modeling of the response of such an ensemble using numerical methods for integrating differential equations turns out to be much less labor-intensive.
The contribution of overlapping diffusion regions is expressed in a change in the nature of the CV response, namely, in an increase in the time dependence contribution, which can be visually observed by changing the shape of the curves from a sigmoidal stationary to a wave-like dependence with a peak. Basically, the problem of modeling the current–voltage response of ensembles is associated with the need to find optimal conditions in terms of increasing the ratio of the Faradaic current to the capacitive one [13] or in terms of obtaining conditions for a stationary response [15]. In fact, not only these parameters can be optimized at the simulation stage.
Since the rate of growth of the diffusion region and the distribution of concentrations in it depend on the diffusion coefficient, it is possible to put forward a hypothesis about the different shape of the current–voltage curve of an ensemble of ultramicroelectrodes with overlapping diffusion layers for substances with different coefficients, since the region and the degree of overlap for them will be different. If this hypothesis is correct, the CV response dependence on the diffusion coefficient can be used to separate the responses of substances whose electrochemical potentials and exchange currents are close, but whose diffusion coefficients are different (e.g., cysteine and glutathione, electrochemically active polypeptides with different chain lengths). The present work is devoted to theoretical and practical testing of this hypothesis.
A CV study of compounds using microelectrode arrays is of interest for the analysis of electroactive oligomers, since different chain length in this case provides a significant difference in the diffusion coefficient [18]. Of particular interest is the analysis of oligopeptides obtained by chemical assembly [19], since multistage synthesis in the case of incomplete substitution of functional groups leads to the formation of side products with a shorter chain length. The deviation of the oligopeptide composition is very critical for such areas as pharmaceuticals, medicine, biology, and control methods, which are very expensive—these are mainly HPLC and MS. Electrochemical analysis is simpler and does not require expensive equipment. A number of oligopeptides, such as glutathione [20], carnosine [21], and felipressin [22], are studied by voltammetry, which indicates the possibility of CV studies using microelectrodes, but the use of intrinsic redox transitions does not make the analysis universal. To unify the method, it is possible to introduce electroactive labels into the oligopeptide molecule, for example, osmium complexes [23].
In the present study, transient behavior models were constructed based on data on the behavior of microelectrode ensembles: the difference in the voltampere curves can serve as an analytical signal to identify compounds with the same redox potential but different diffusion coefficients. In proof of this assumption, a series of experiments was performed to record voltammograms of electroactive derivatives on photolithographic-derived ensembles of microelectrodes.

2. Materials and Methods

2.1. Reagents

Wang resin, 1.1 mmol/g (Sigma-Aldrich, St. Louis, MO, USA), FMOC-glycine, >98% (Sigma-Aldrich), N,N,N′,N′-Tetramethyl-O-(1H-benzotriazol-1-yl)uronium hexafluorophosphate, >99% (Carl Roth GmbH, Karlsruhe, Germany), N,N′-Dicyclohexylcarbodiimide, >99% (Ferak, Berlin, Germany), 4-(Dimethylamino)pyridine, >99% (Sigma-Aldrich), Dimethylformamide, >99% (JSC LenReactiv, Moscow, Russia), Ferrocenemethanol, >97% (Sigma-Aldrich), Trifluoroacetic acid, >99% (Sigma-Aldrich), Diethyl ether, >99% (LLC Vekton, Saint Petersburg, Russia), Sodium nitrate, >99% (LLC Vekton), Sodium phosphate monobasic, >99% (LLC Vekton), Sodium phosphate dibasic, >99% (LLC Vekton), photoresist AZ MIR 701 (AZ Electronic Materials, Luxembourg), and photoresist developer AZ MIF 726 (AZ Electronic Materials).

2.2. Lithographic Production of Ultramicroelectrodes

The structures for the study were fabricated using deposition by vacuum evaporation of metals and optical lithography. The scheme is shown in Figure 2.
First, chromium and gold adhesive layers with thicknesses of 5 nm and 200 nm, respectively, were deposited on a one-sided polished single-crystal silicon wafer. We used thermal evaporation to deposit metal layers. At the next stage, point contacts’ arrays were fabricated using optical lithography. The substrate was spin-coated with an AZ MIR 701 photoresist layer. Then, a hexagonally ordered array of circles was deposited on this layer using a maskless photolithographic system Heidelberg DWL 66FS. Next, the photoresist layer was processed with a AZ 726MIF developer, which led to the opening of circular metal contacts. The interelectrode distances were determined based on the simulation and amounted to 10, 20, 50, and 100 µm. The remaining photoresist provided the dielectric layer for further electrical measurements.

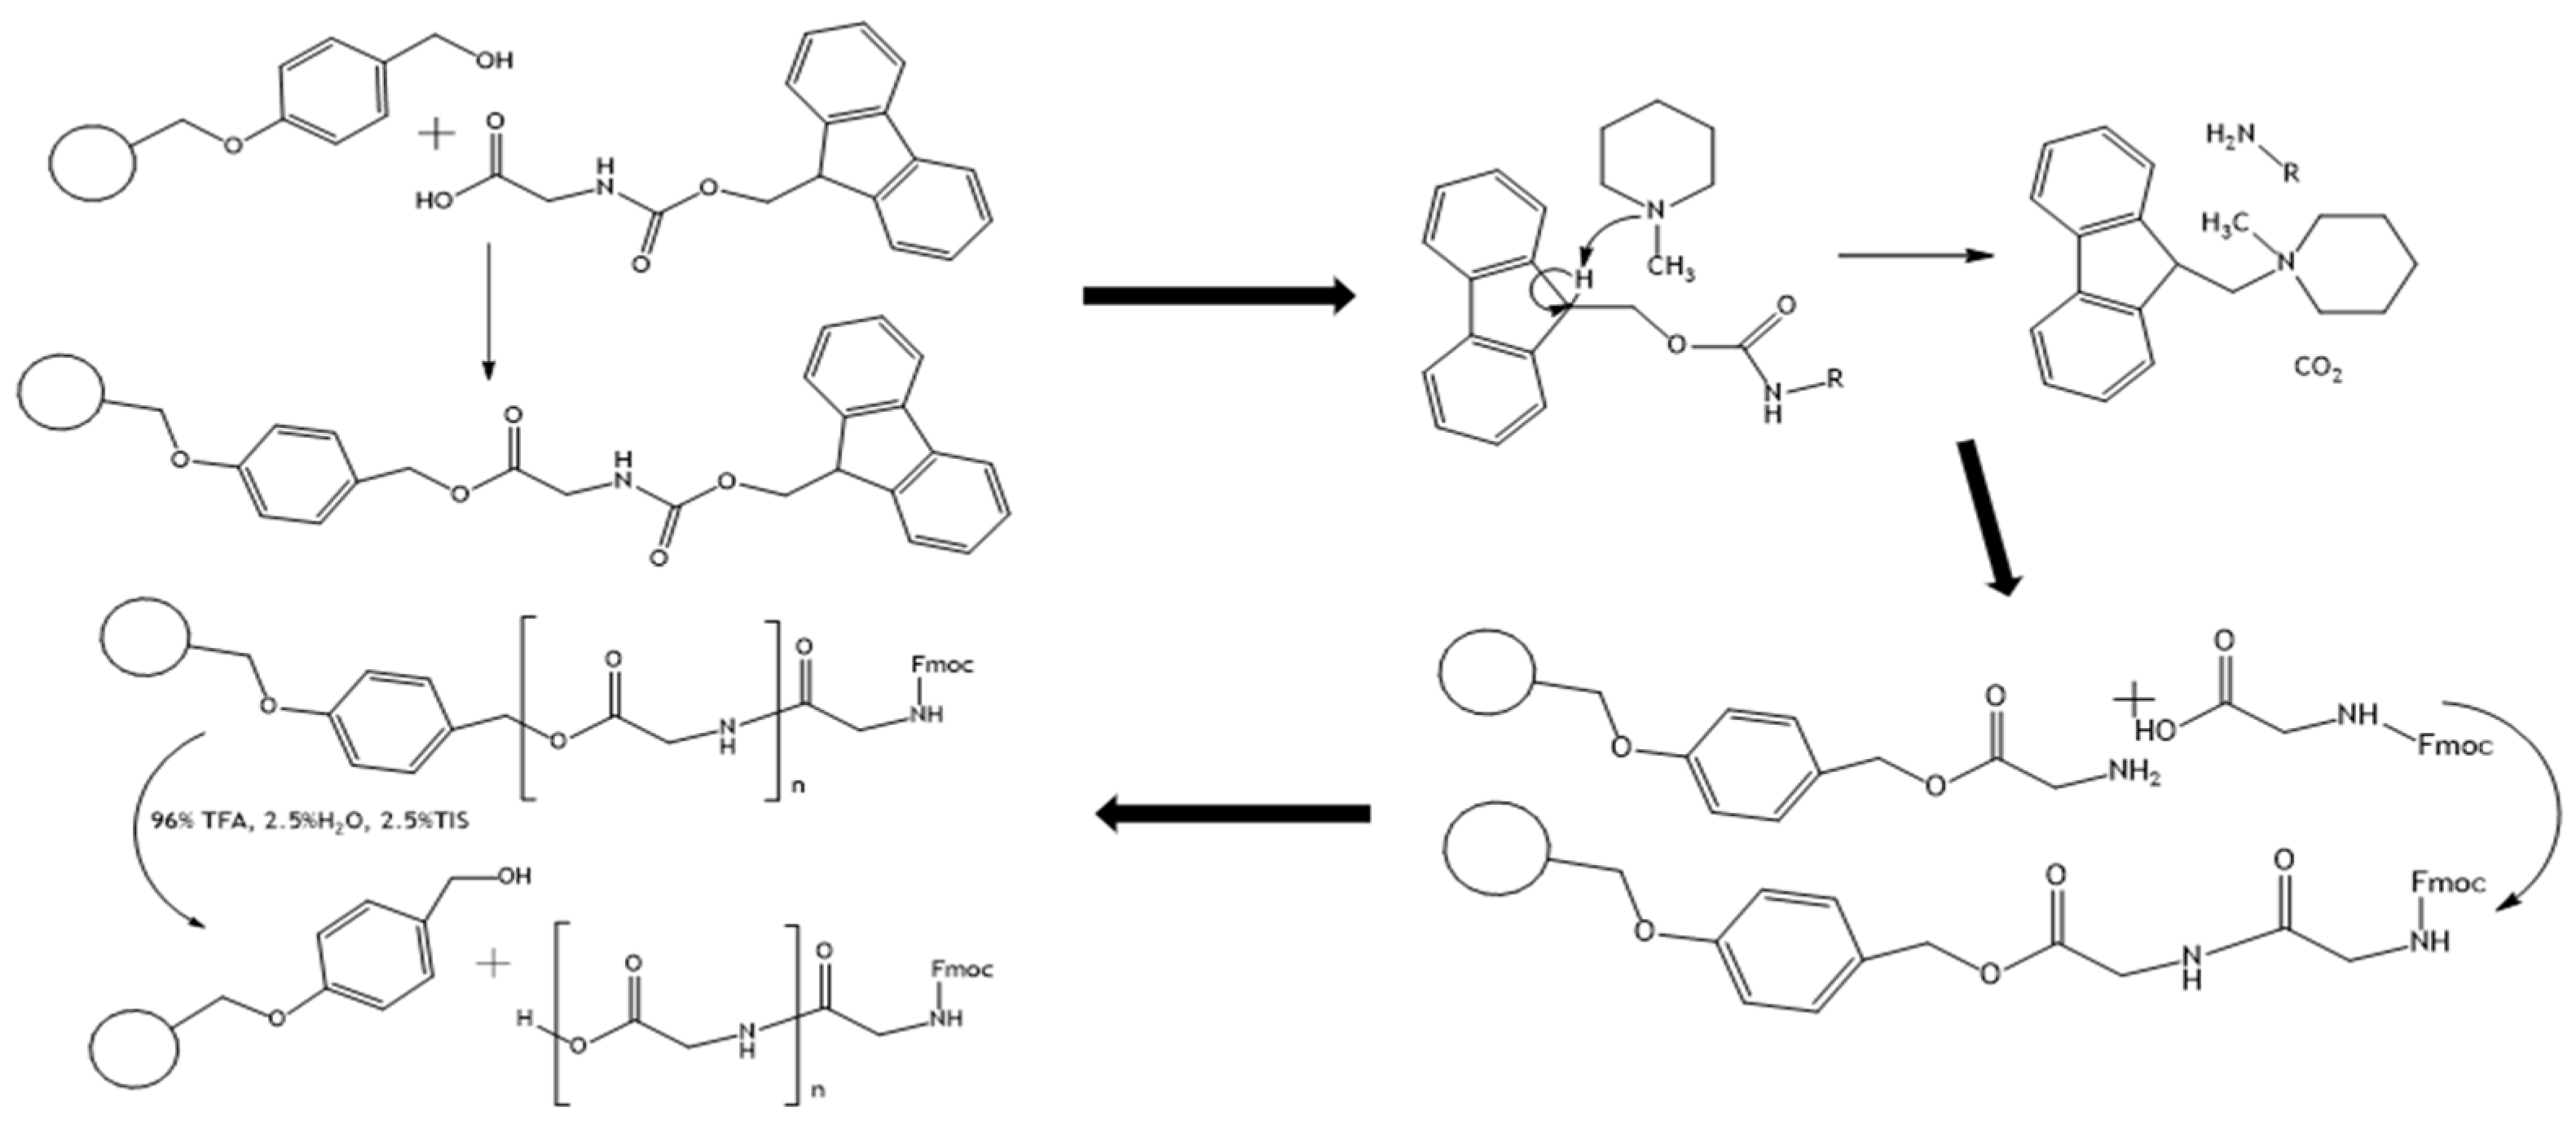
2.3. Triglycine Synthesis

Oligopeptides were synthesized by the Merrifield method. Wang resin [24] was used as a solid-phase support, to which FMOC-protected glycine [25] was covalently attached by esterification. Esterification was carried out by carbodiimide activation of the COOH group of the amino acid (its interaction with DMAP and DCC in DMF with stirring in dry argon for 10 min at 0 °C). The solution with activated amino acid was poured into a container with Wang resin (previously swollen in DMF for 1 day) at the rate of 1.1 mmol of amino acid per 1 g of dry Wang resin. The reaction was shaken for 1 hour. Subsequent chain elongation was carried out in an Endeavor AAPTEC peptide synthesizer by removing the Fmoc protection (using methylpiperidine) from glycine and sequentially adding each next amino acid fragment catalyzed by HBTU (hexafluorophosphate benzotriazole tetramethyl uronium) in the presence of DIEA. All operations in the synthesizer involve washing the amino acids-modified resin with solutions of the corresponding substances in DMF: HBTU 0.4M, DIEA 1M, MPiP 20%. The synthesis scheme is shown in Figure 3.

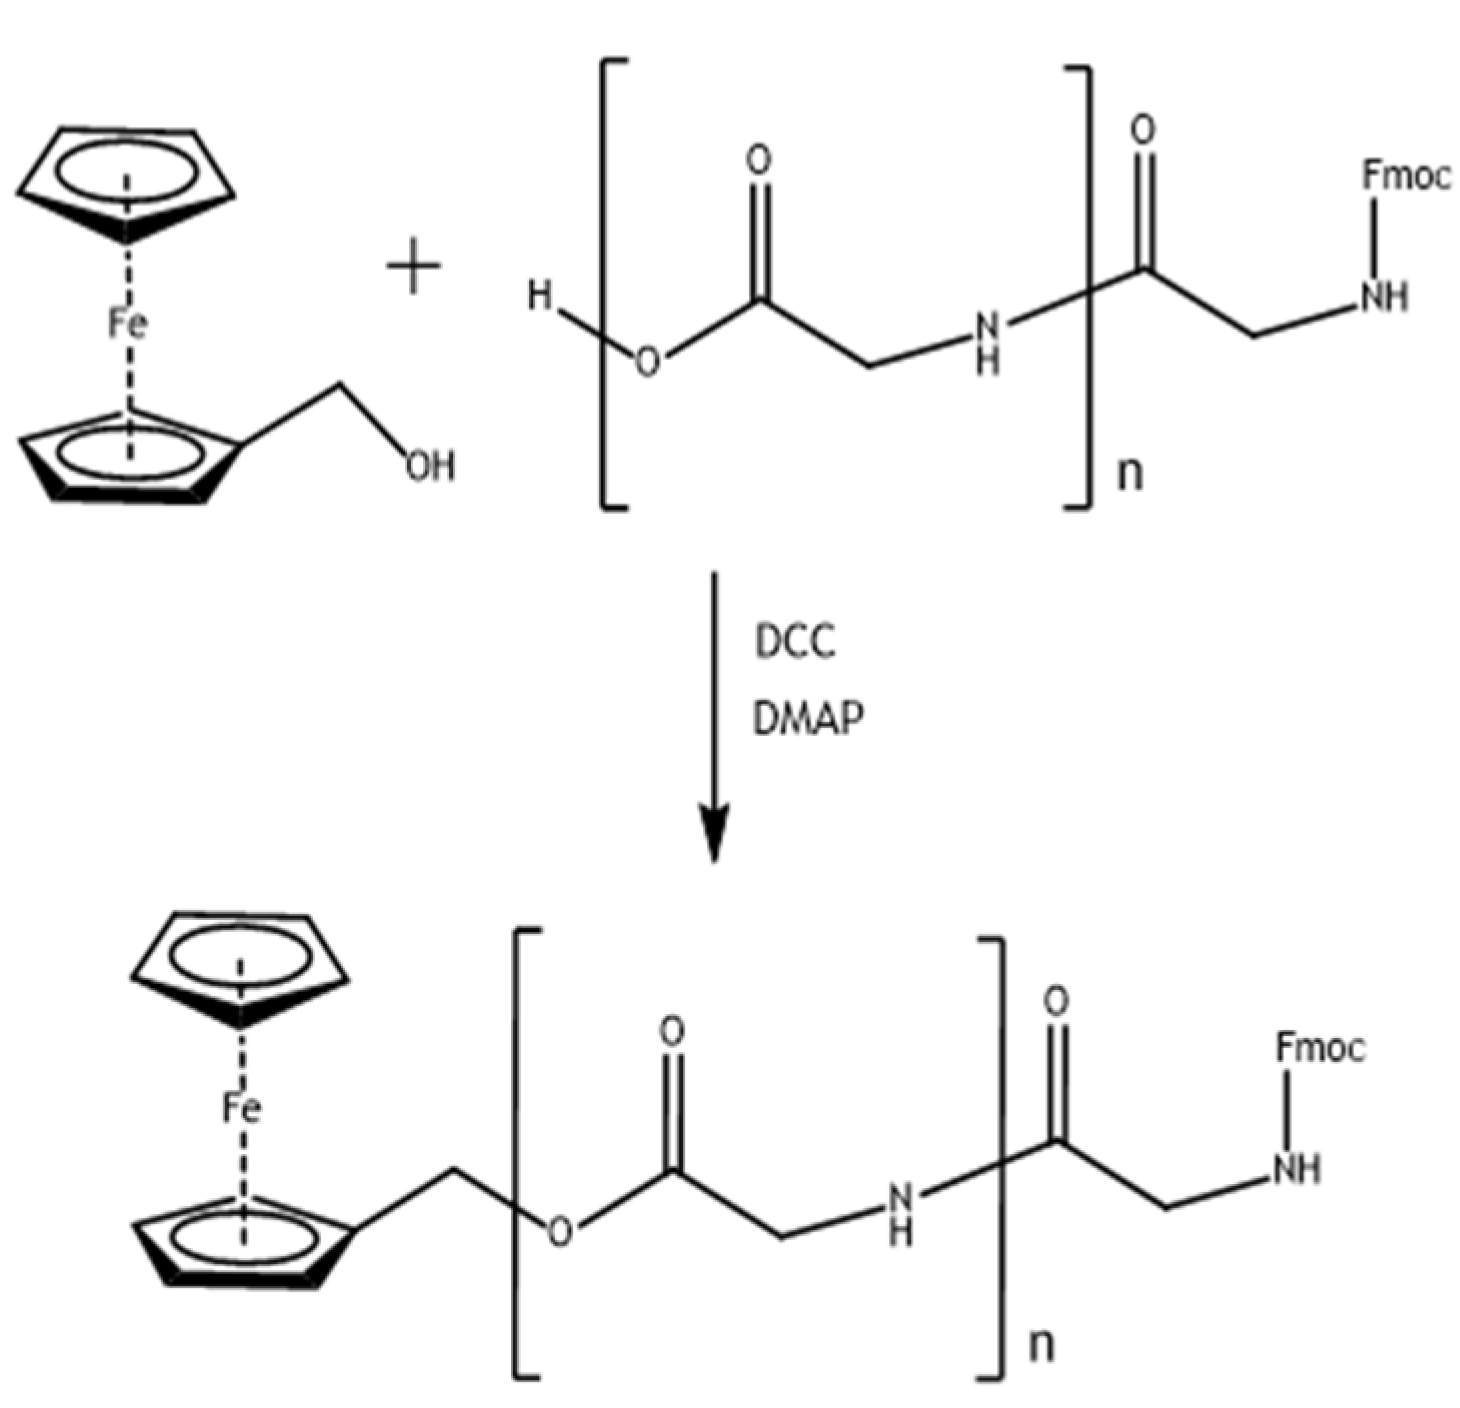
2.4. Synthesis of Glycine and Triglycine Esters of Ferrocenemethanol

Synthesis of electroactive derivatives was carried out by carbodiimide esterification between ferrocenemethanol and FMOC-protected glycine/triglycine (Figure 4).
Protection was removed in the same way as in the course of peptide synthesis.

2.5. Recording Cyclic Voltammograms

Cyclic voltammograms were recorded at sweep rates of 10, 20, 50, 100, 200, 500, and 1000 mV/s using an Elins potentiostat–galvanostat for ferrocenemethanol and electrochemically equivalent modified ferrocenes with an increased characteristic molecular size (glycine–ferrocenemethanol). The studied ultramicroelectrode ensembles were used as the working electrode, AgCl as the reference electrode, and a glassy carbon as the auxiliary electrode. We used solutions of electroactive peptides in 0.01 M phosphate buffer with the addition of 0.2 M sodium nitrate as a supporting electrolyte. The concentration of the main substance is 1 × 10⁻⁴ M.

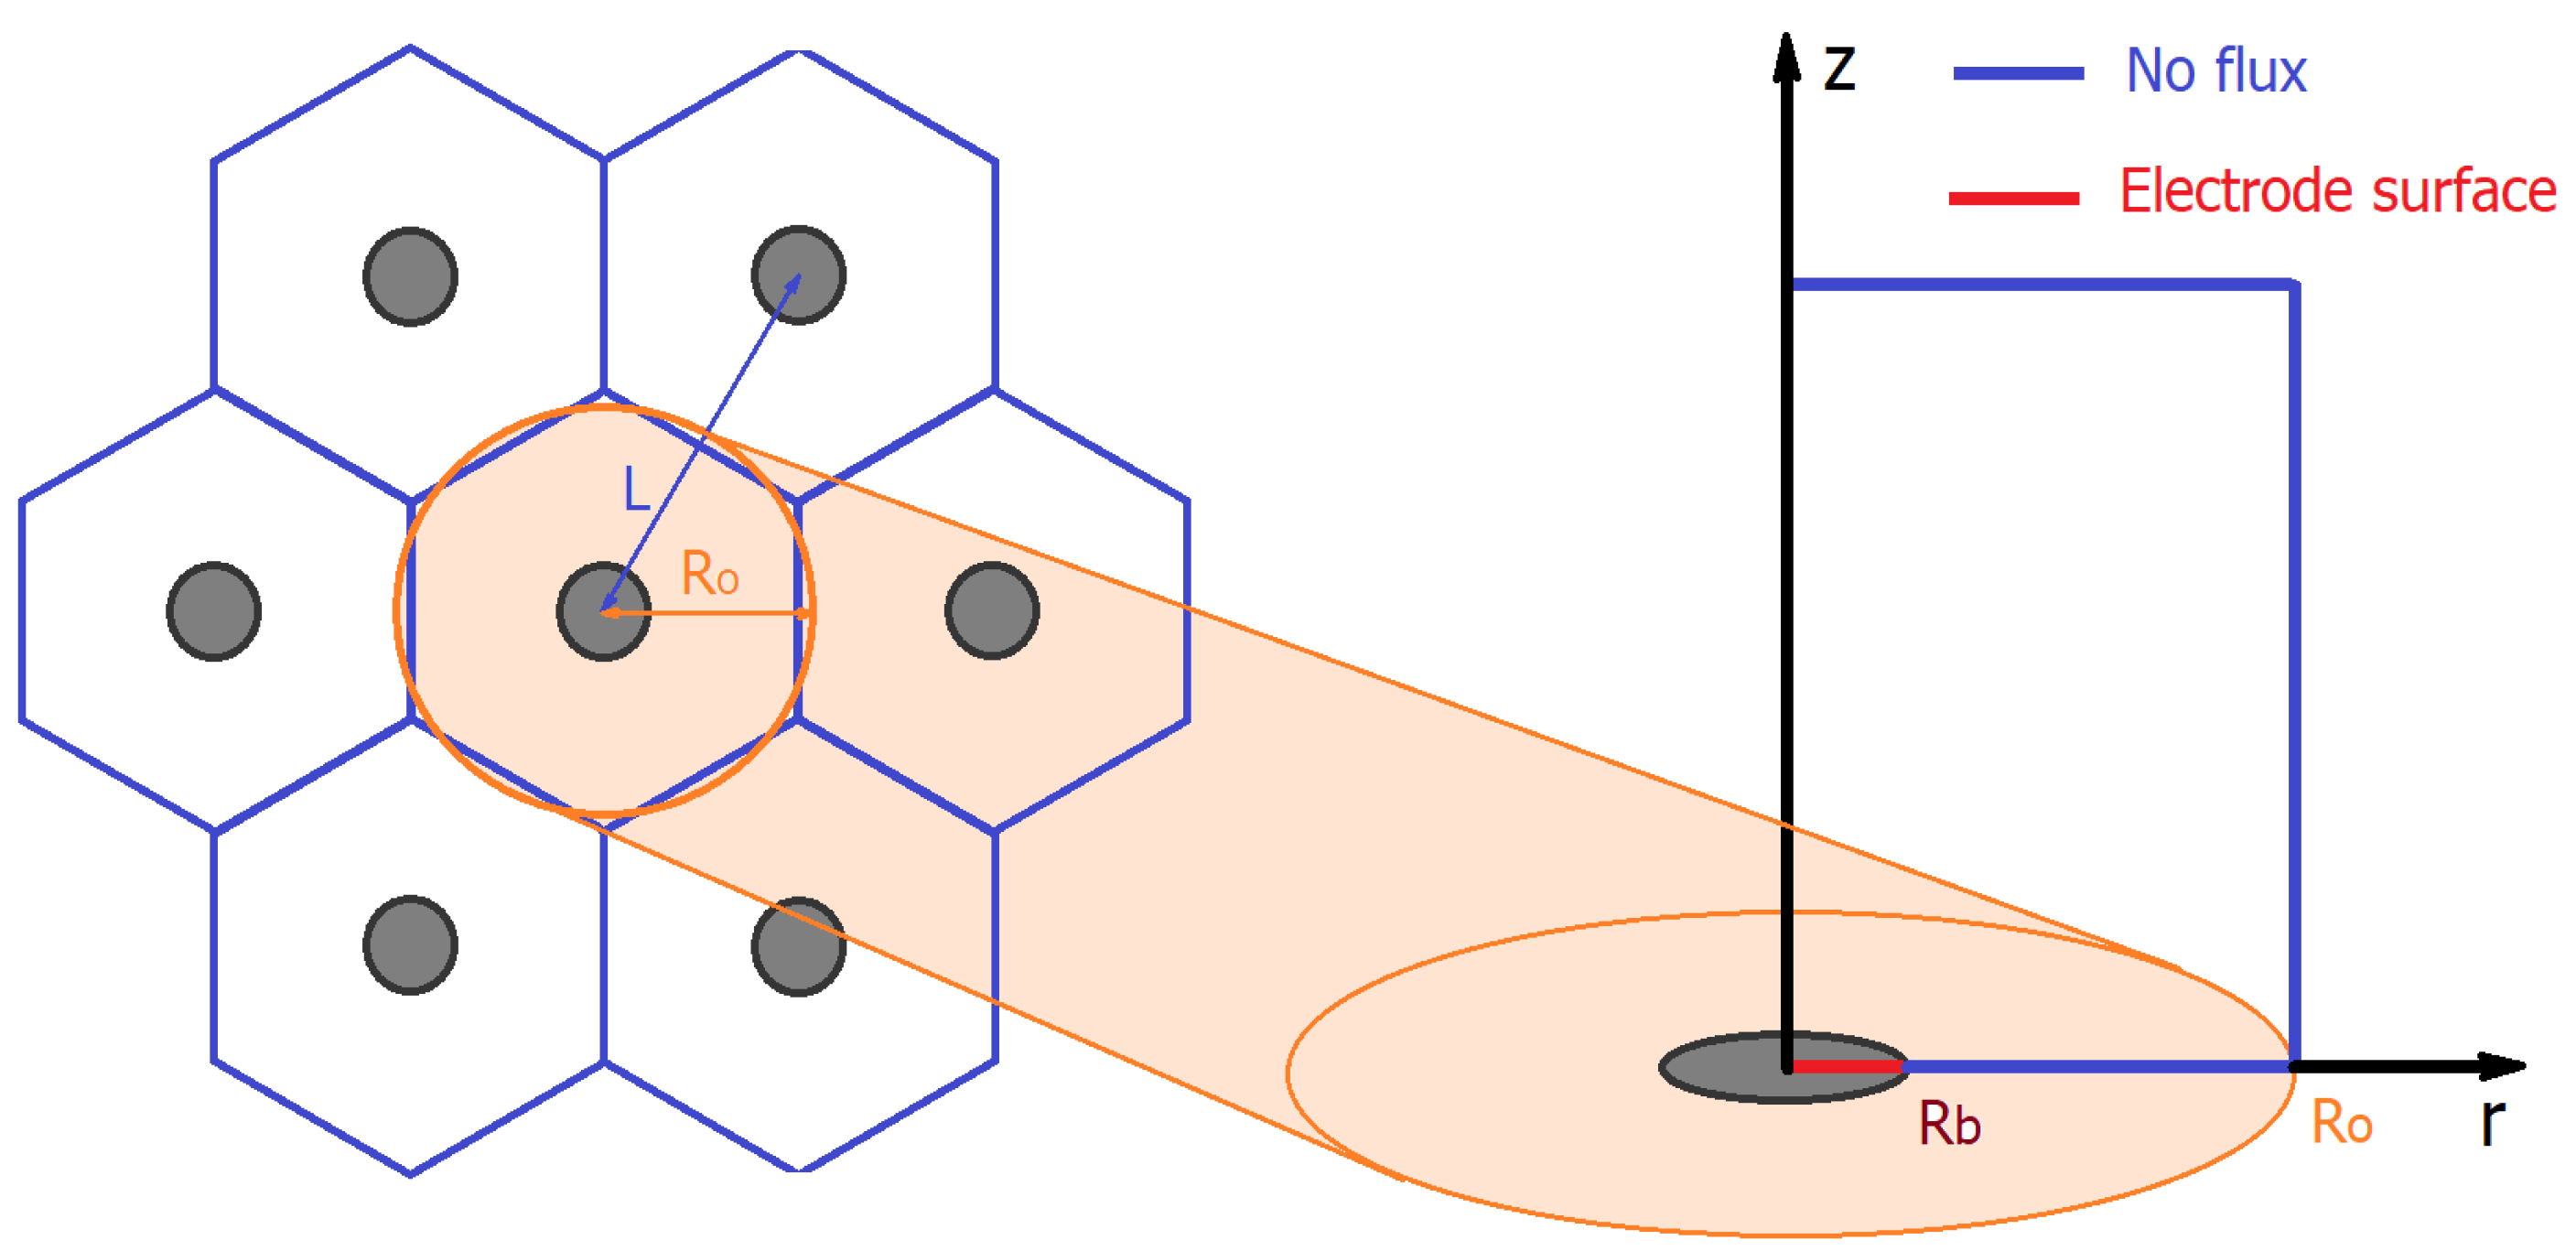
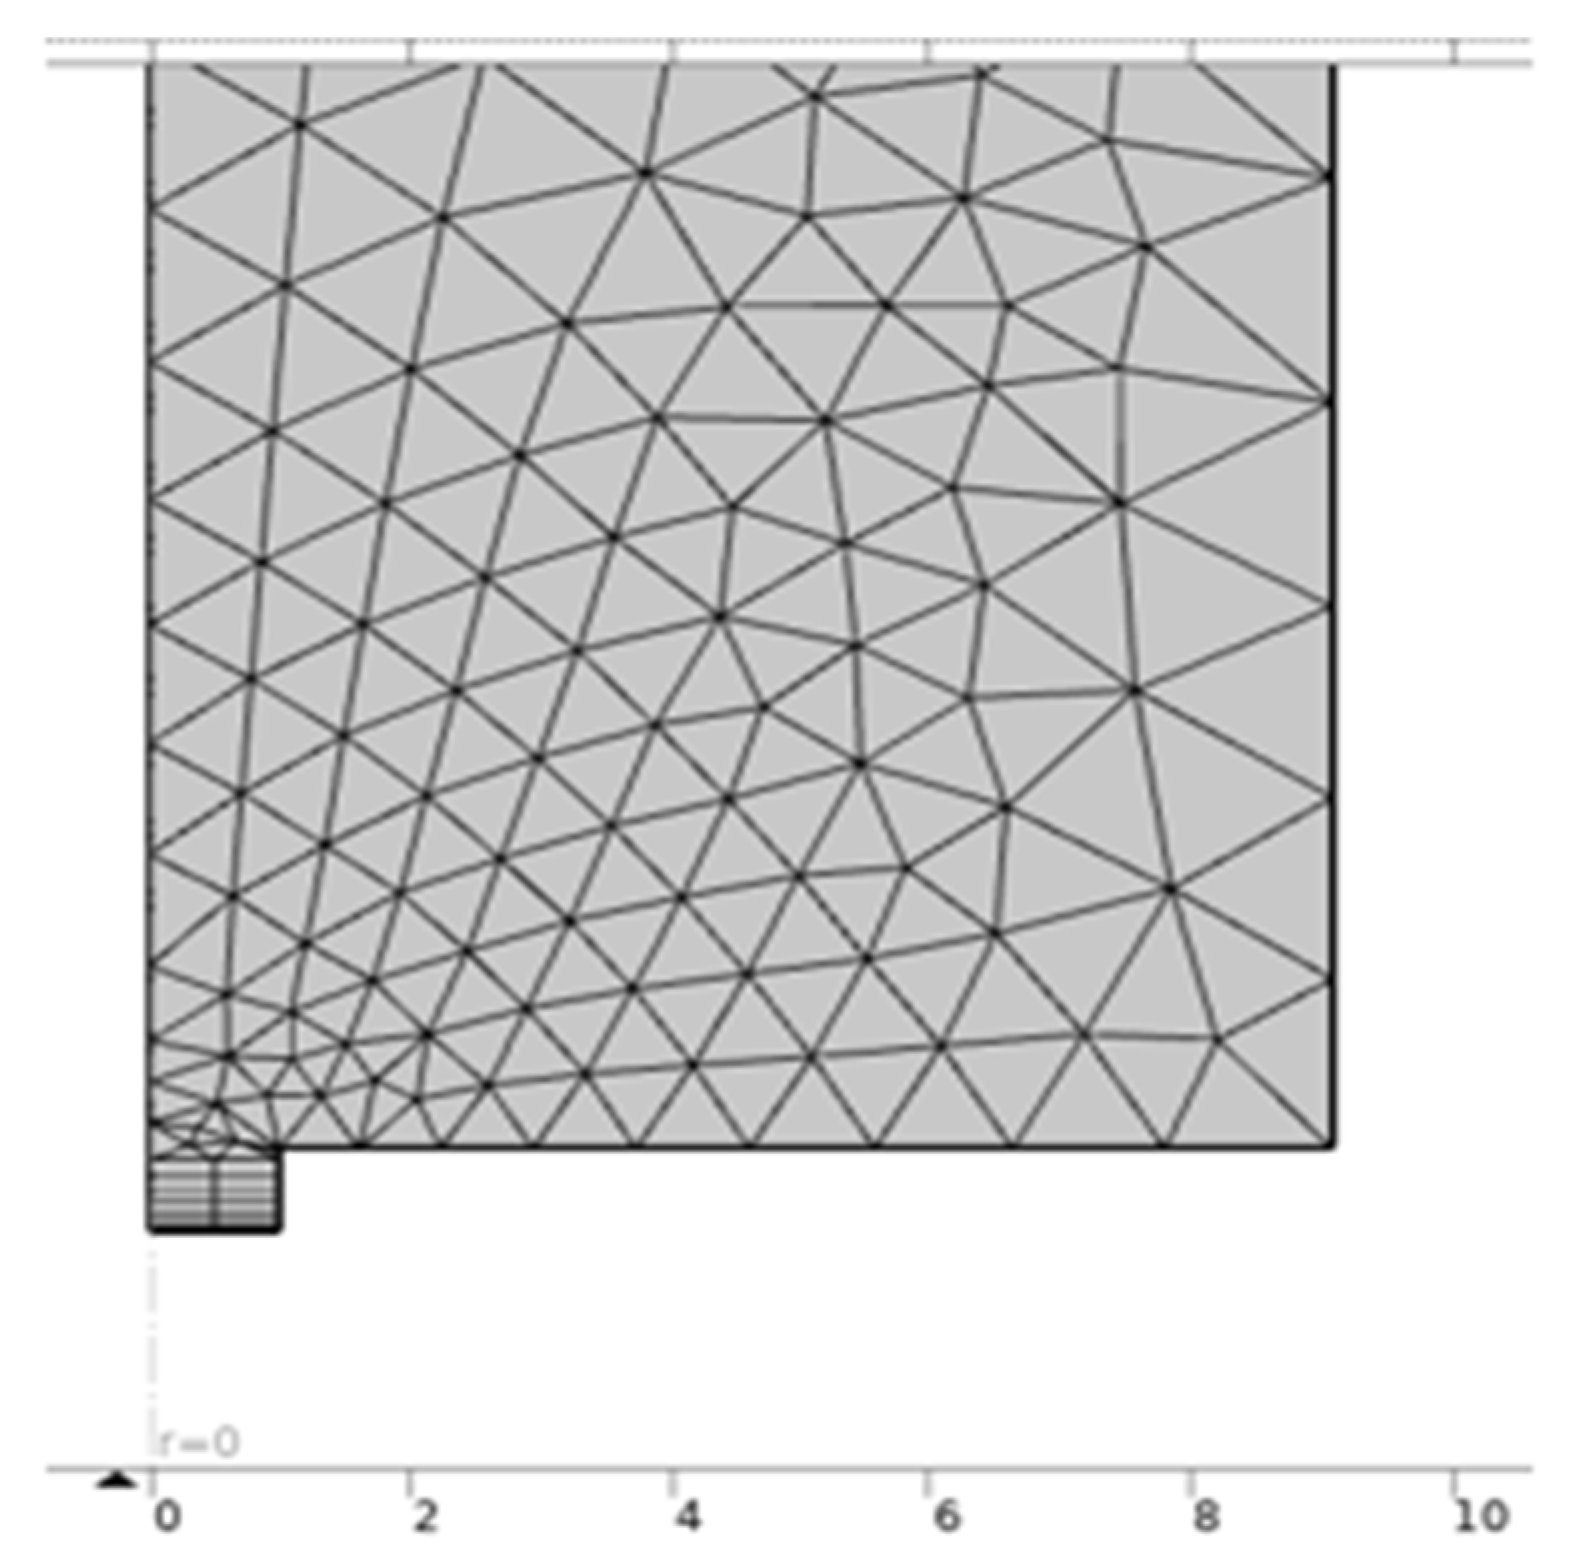
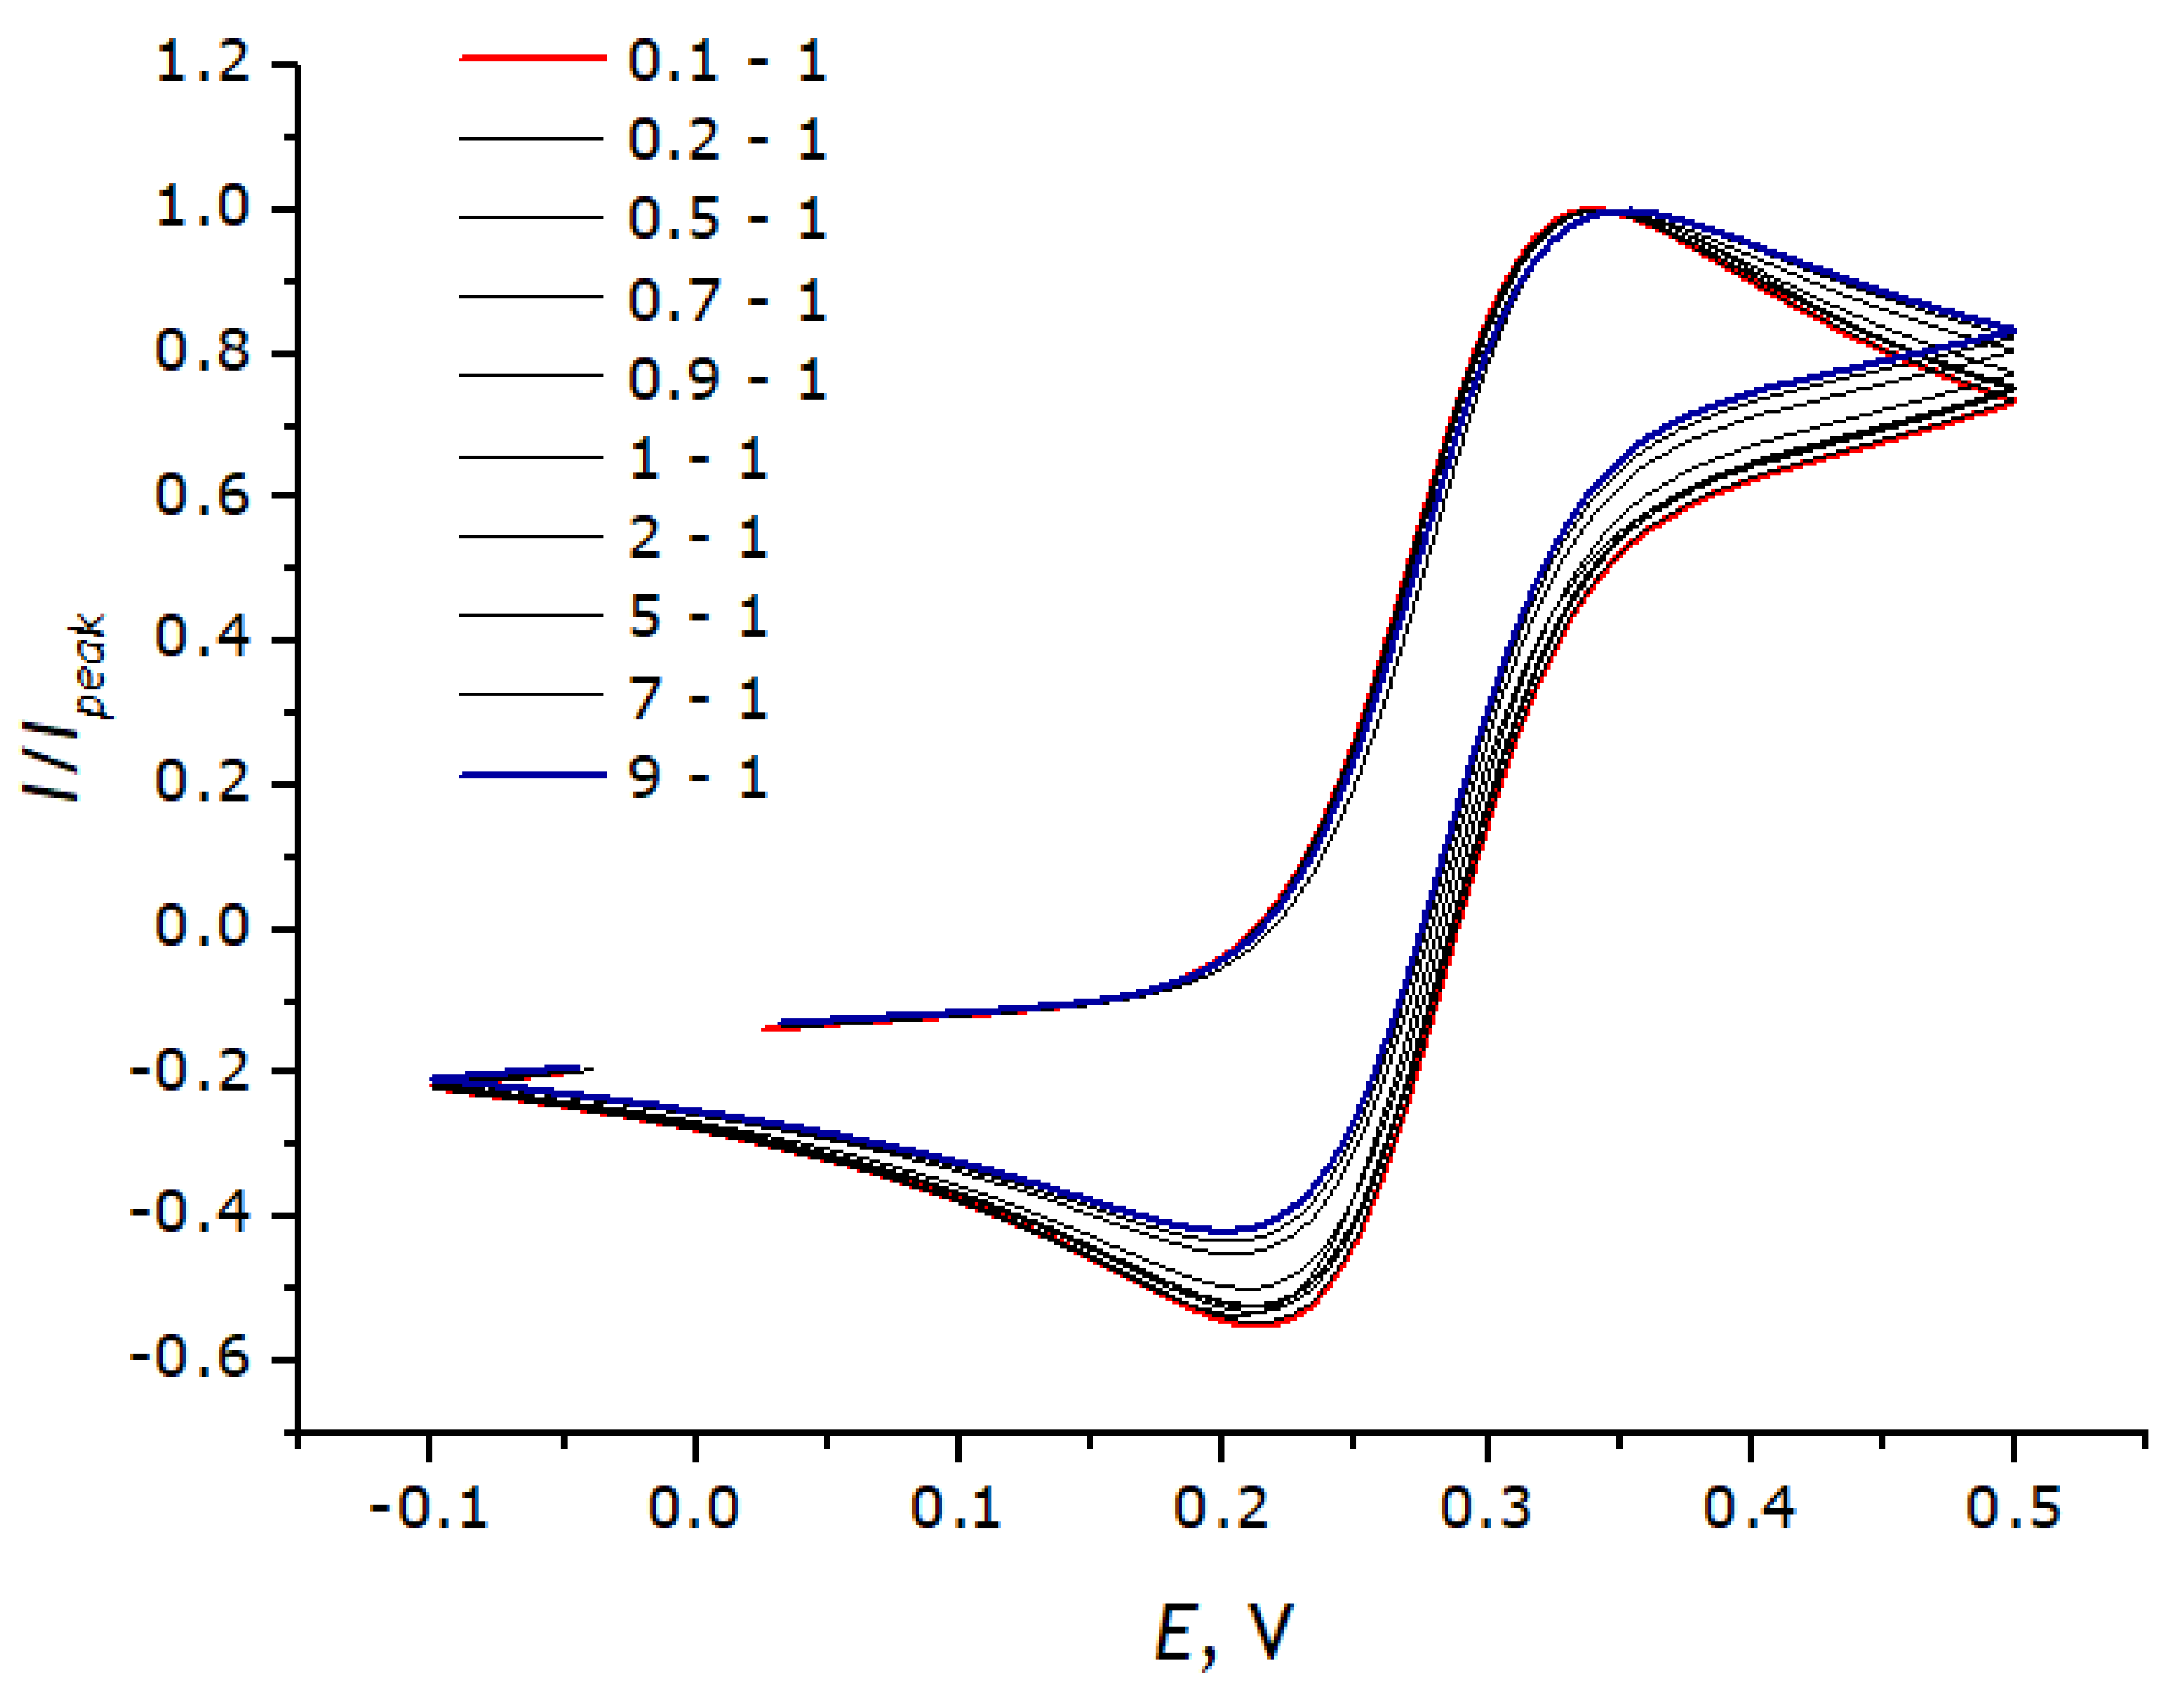
2.6. Modeling Cyclic Voltammograms

To simulate the response of an ensemble of ultramicroelectrodes, the software package COMSOL® Multiphysics was used. A method was used that involves limiting the diffusion region of the components by a cylindrical surface that is not limited in height. The base area of the cylinder is equal to the area of the polygon constructed on the median perpendiculars of the segments connecting adjacent ultramicroelectrodes.
A triangular mesh of finite element integration with automatic generation of elements was used; in the area close to the electrode surface, the grid density was increased (Figure 5).

3. Results

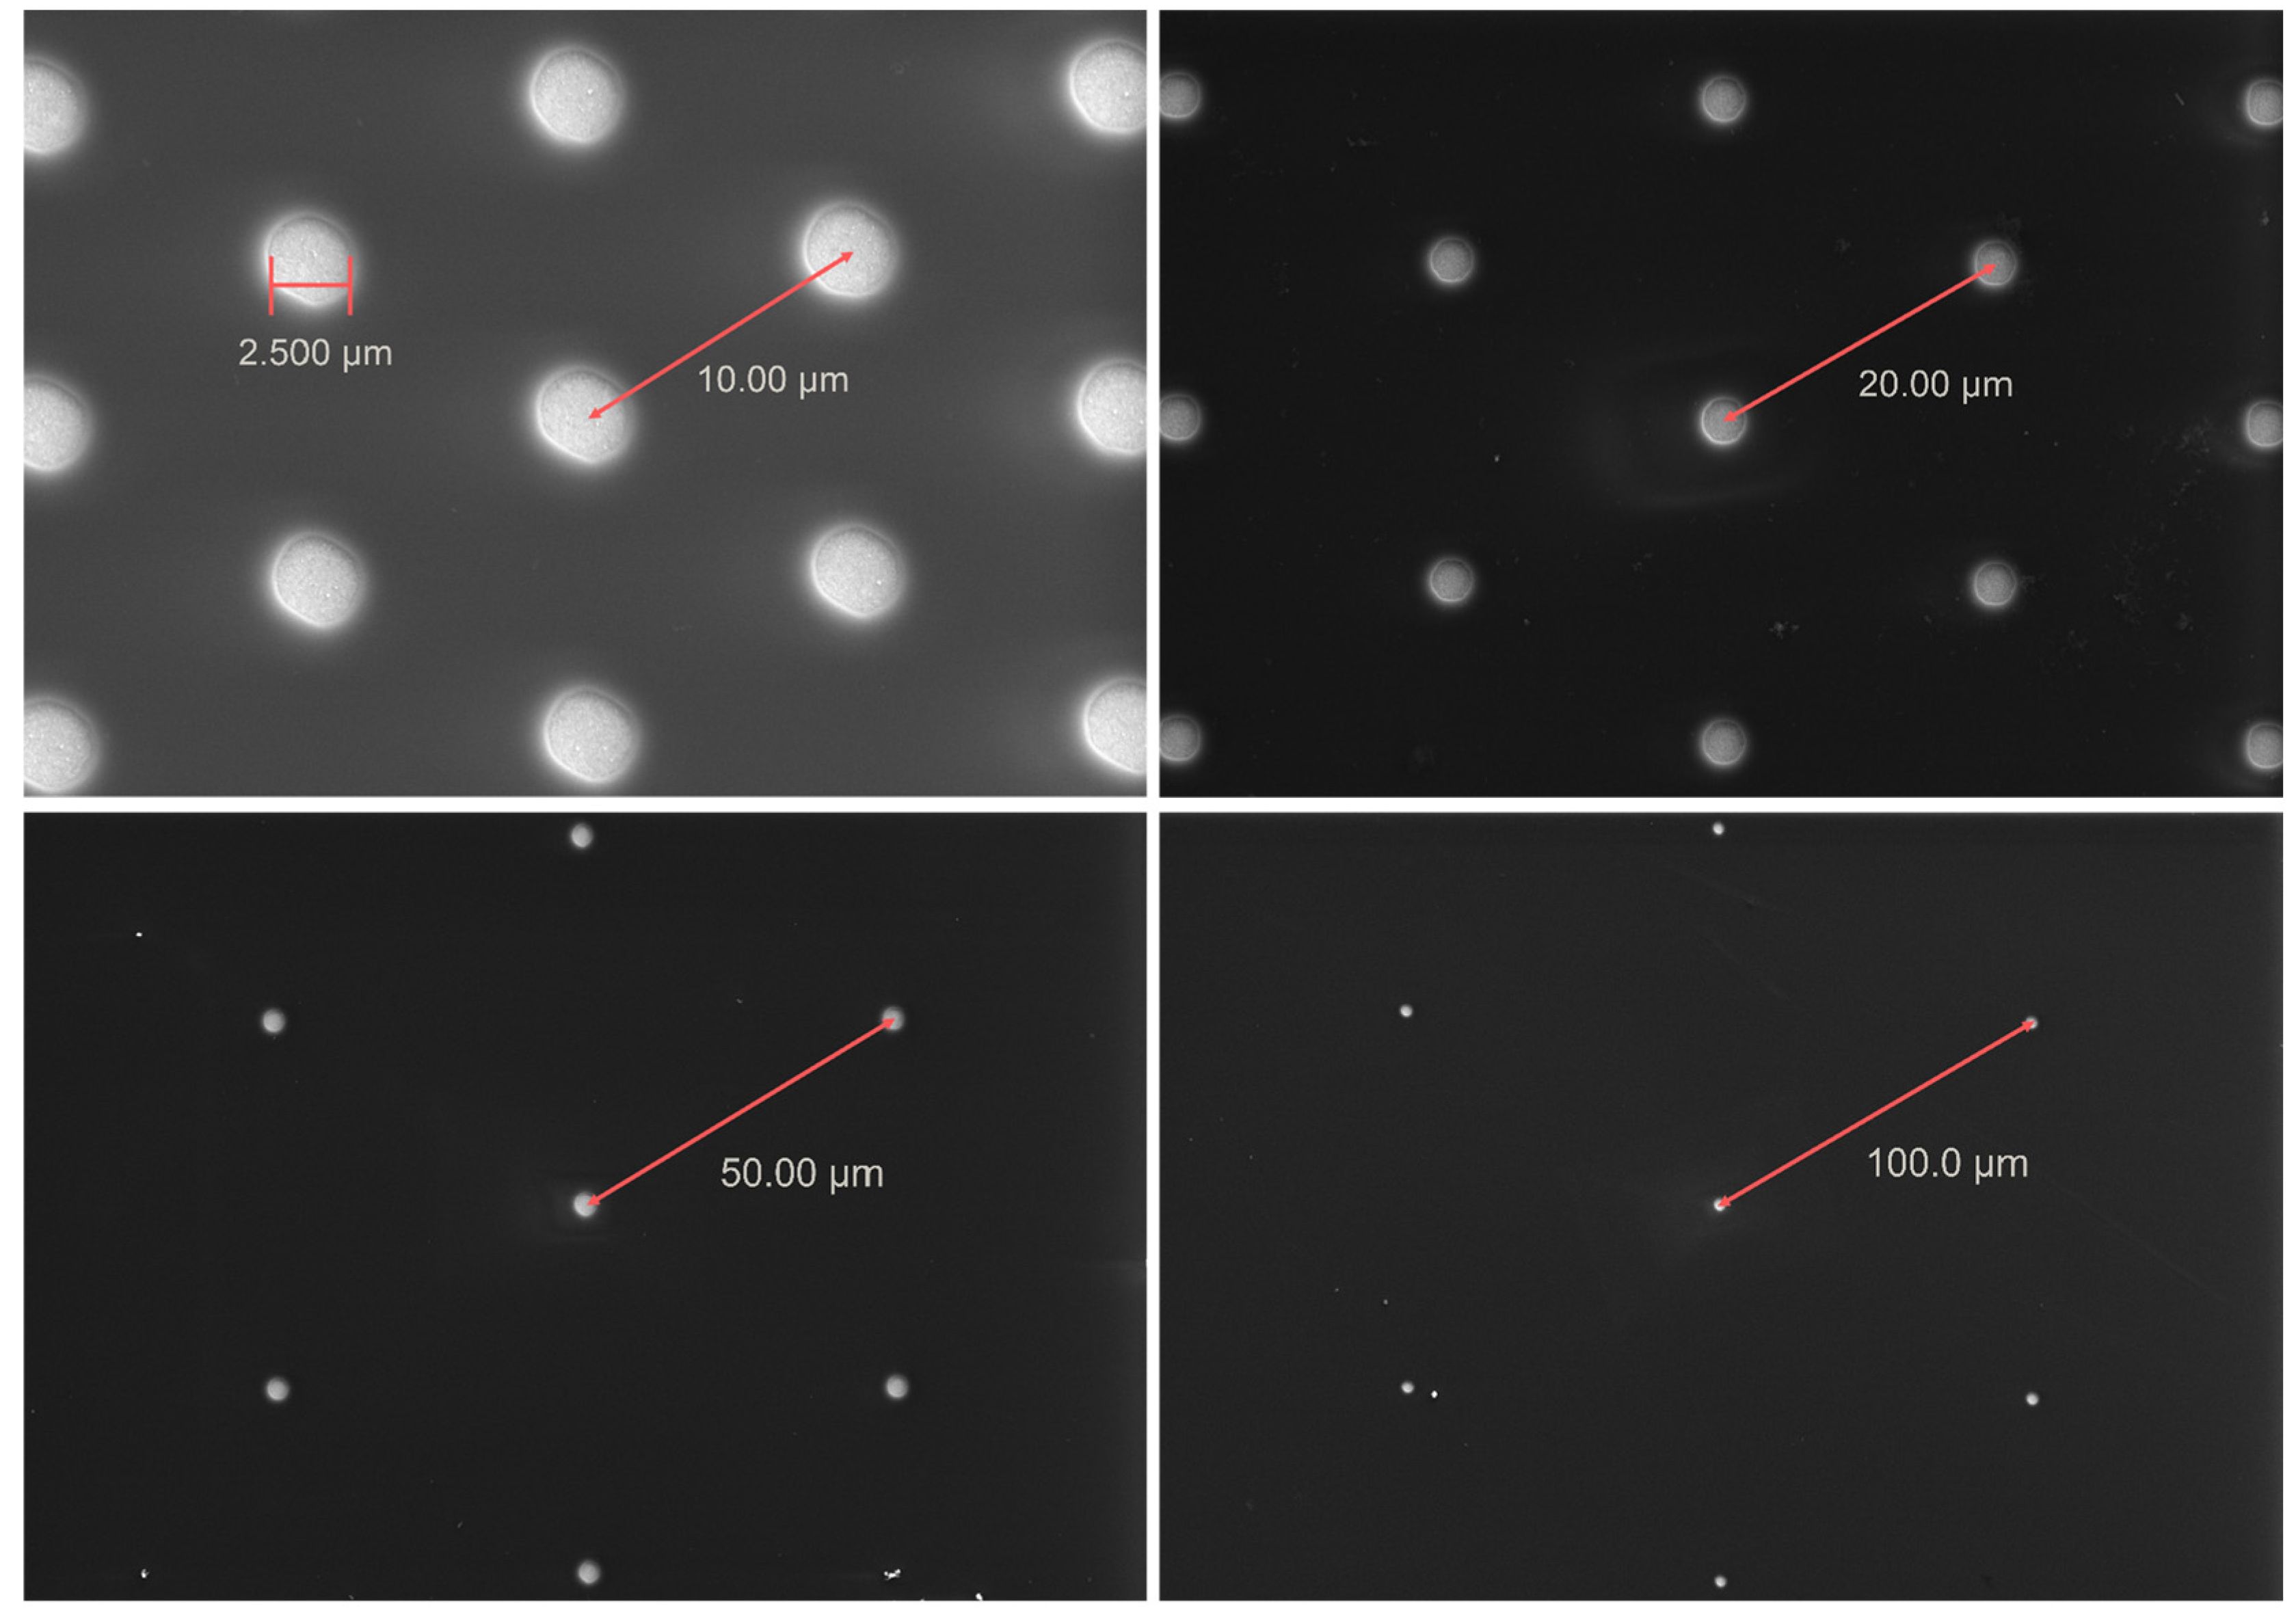
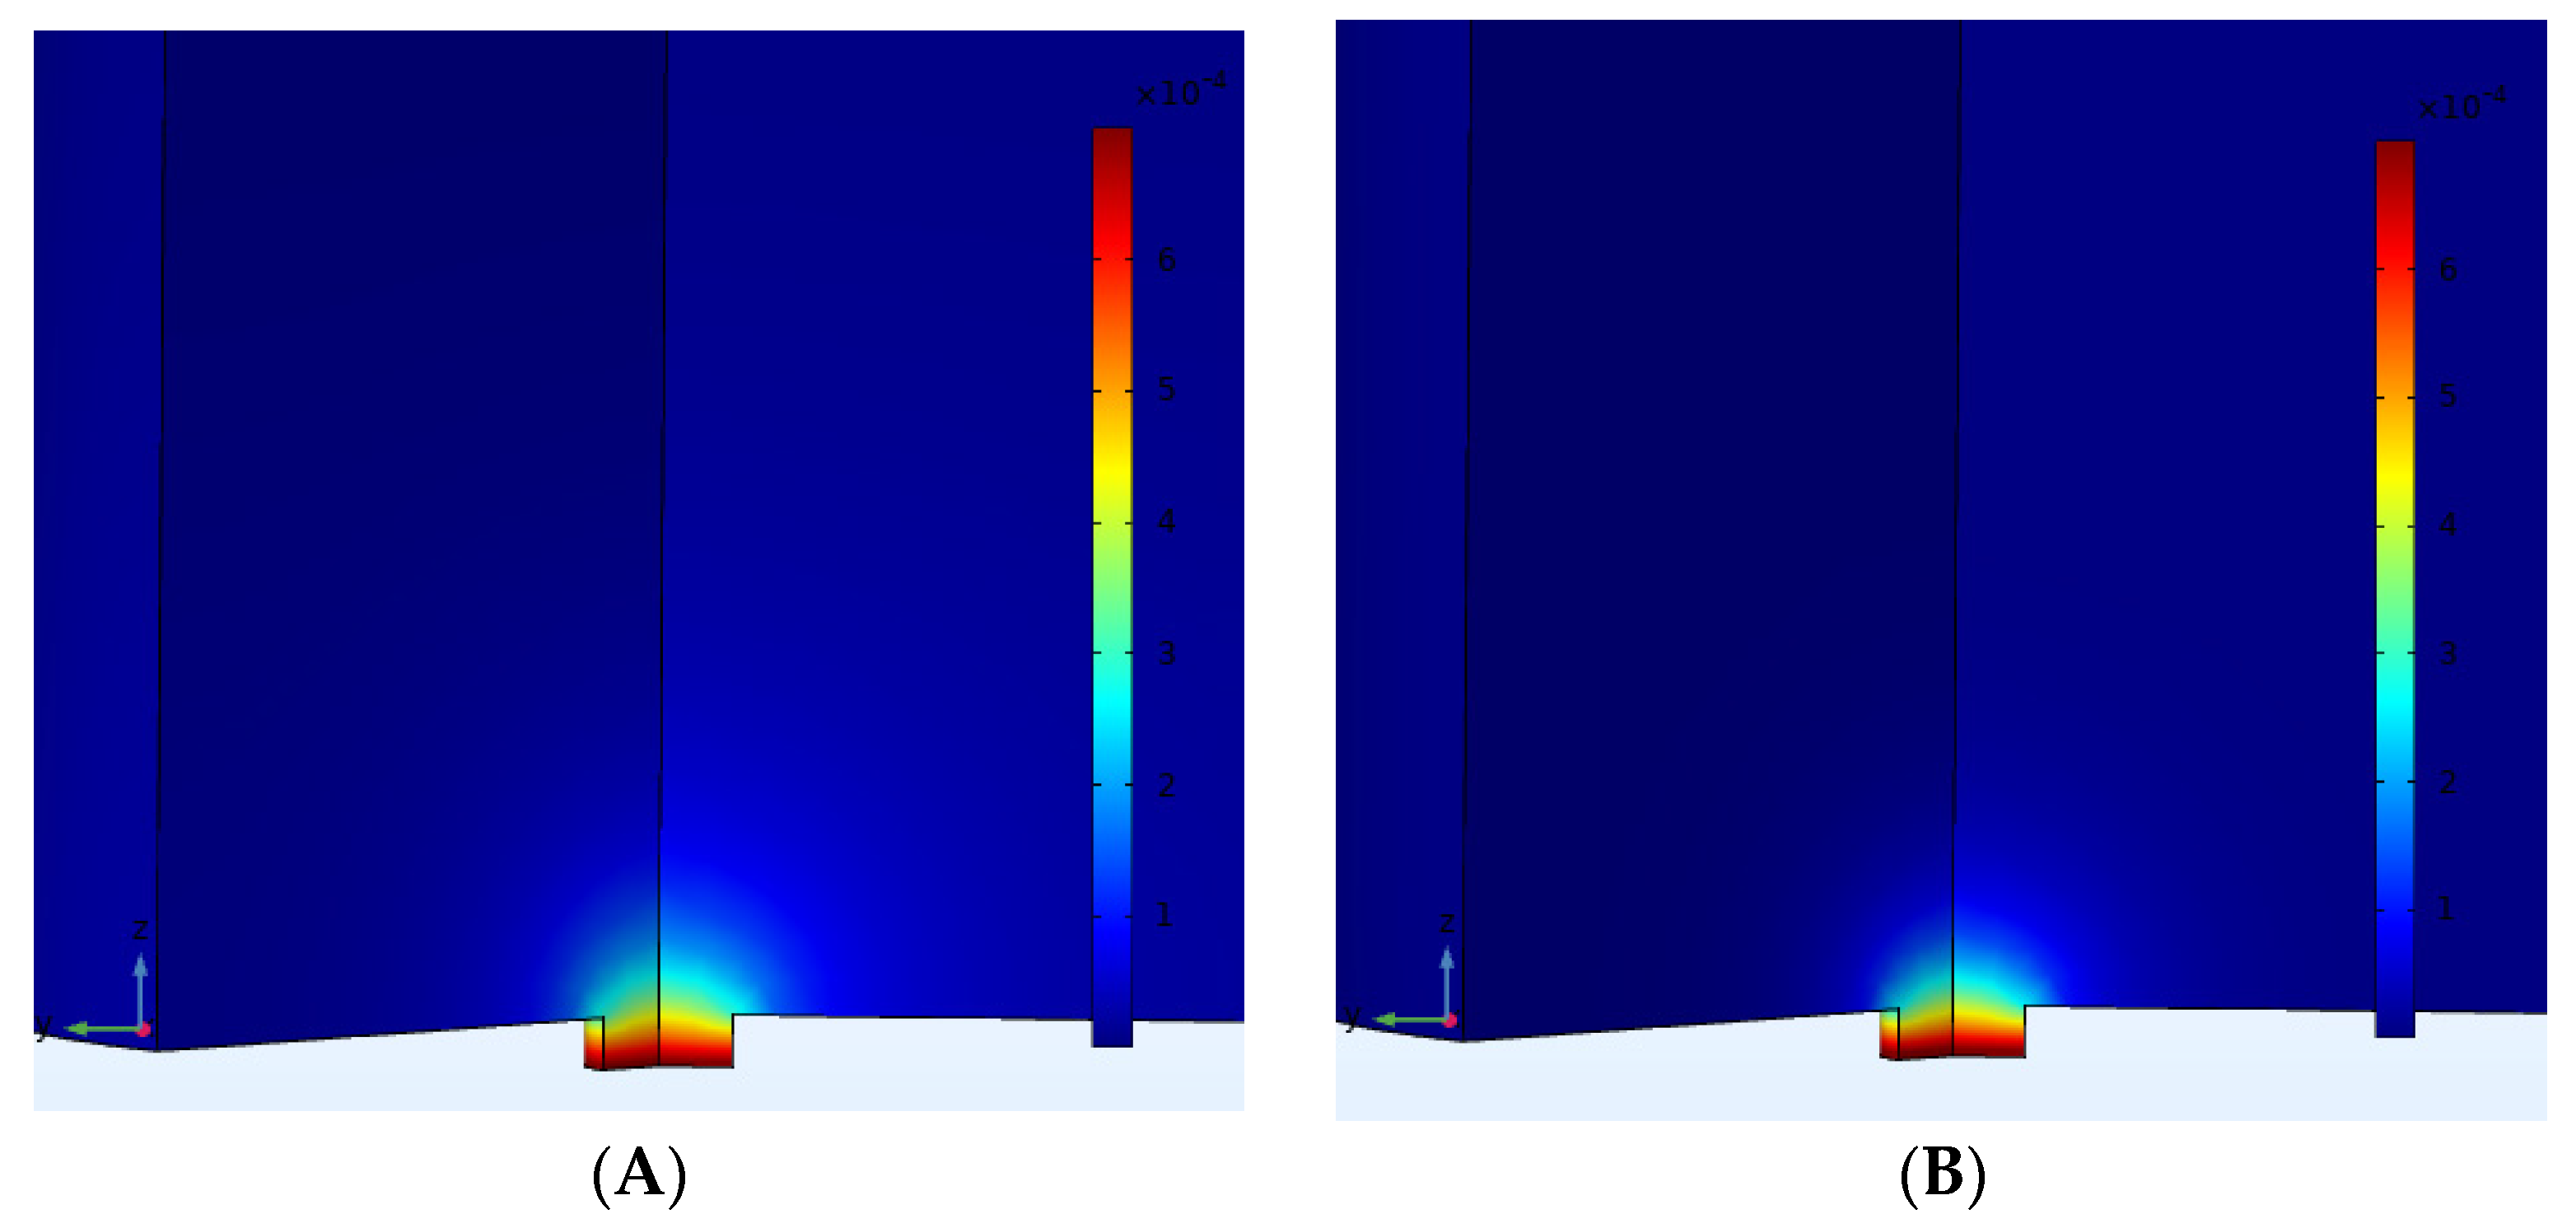
3.1. Microscopic Study of Microelectrode Arrays

Micrographs of the prepared microelectrode arrays confirm the correspondence of the resulting interelectrode distances to those established as optimal during modeling (Figure 6).
The interelectrode distance, estimated from the image in Figure 5, corresponds to 10, 20, 50, and 100 µm, declared when setting the parameters of the photomask for lithography. The surface of the photoresist is smooth except for those areas where it is contaminated with mechanical impurities. The diameter of the perforations in the photoresist layer is 2.5 µm. These perforations free the gold surface, thus producing ultramicroelectrodes.

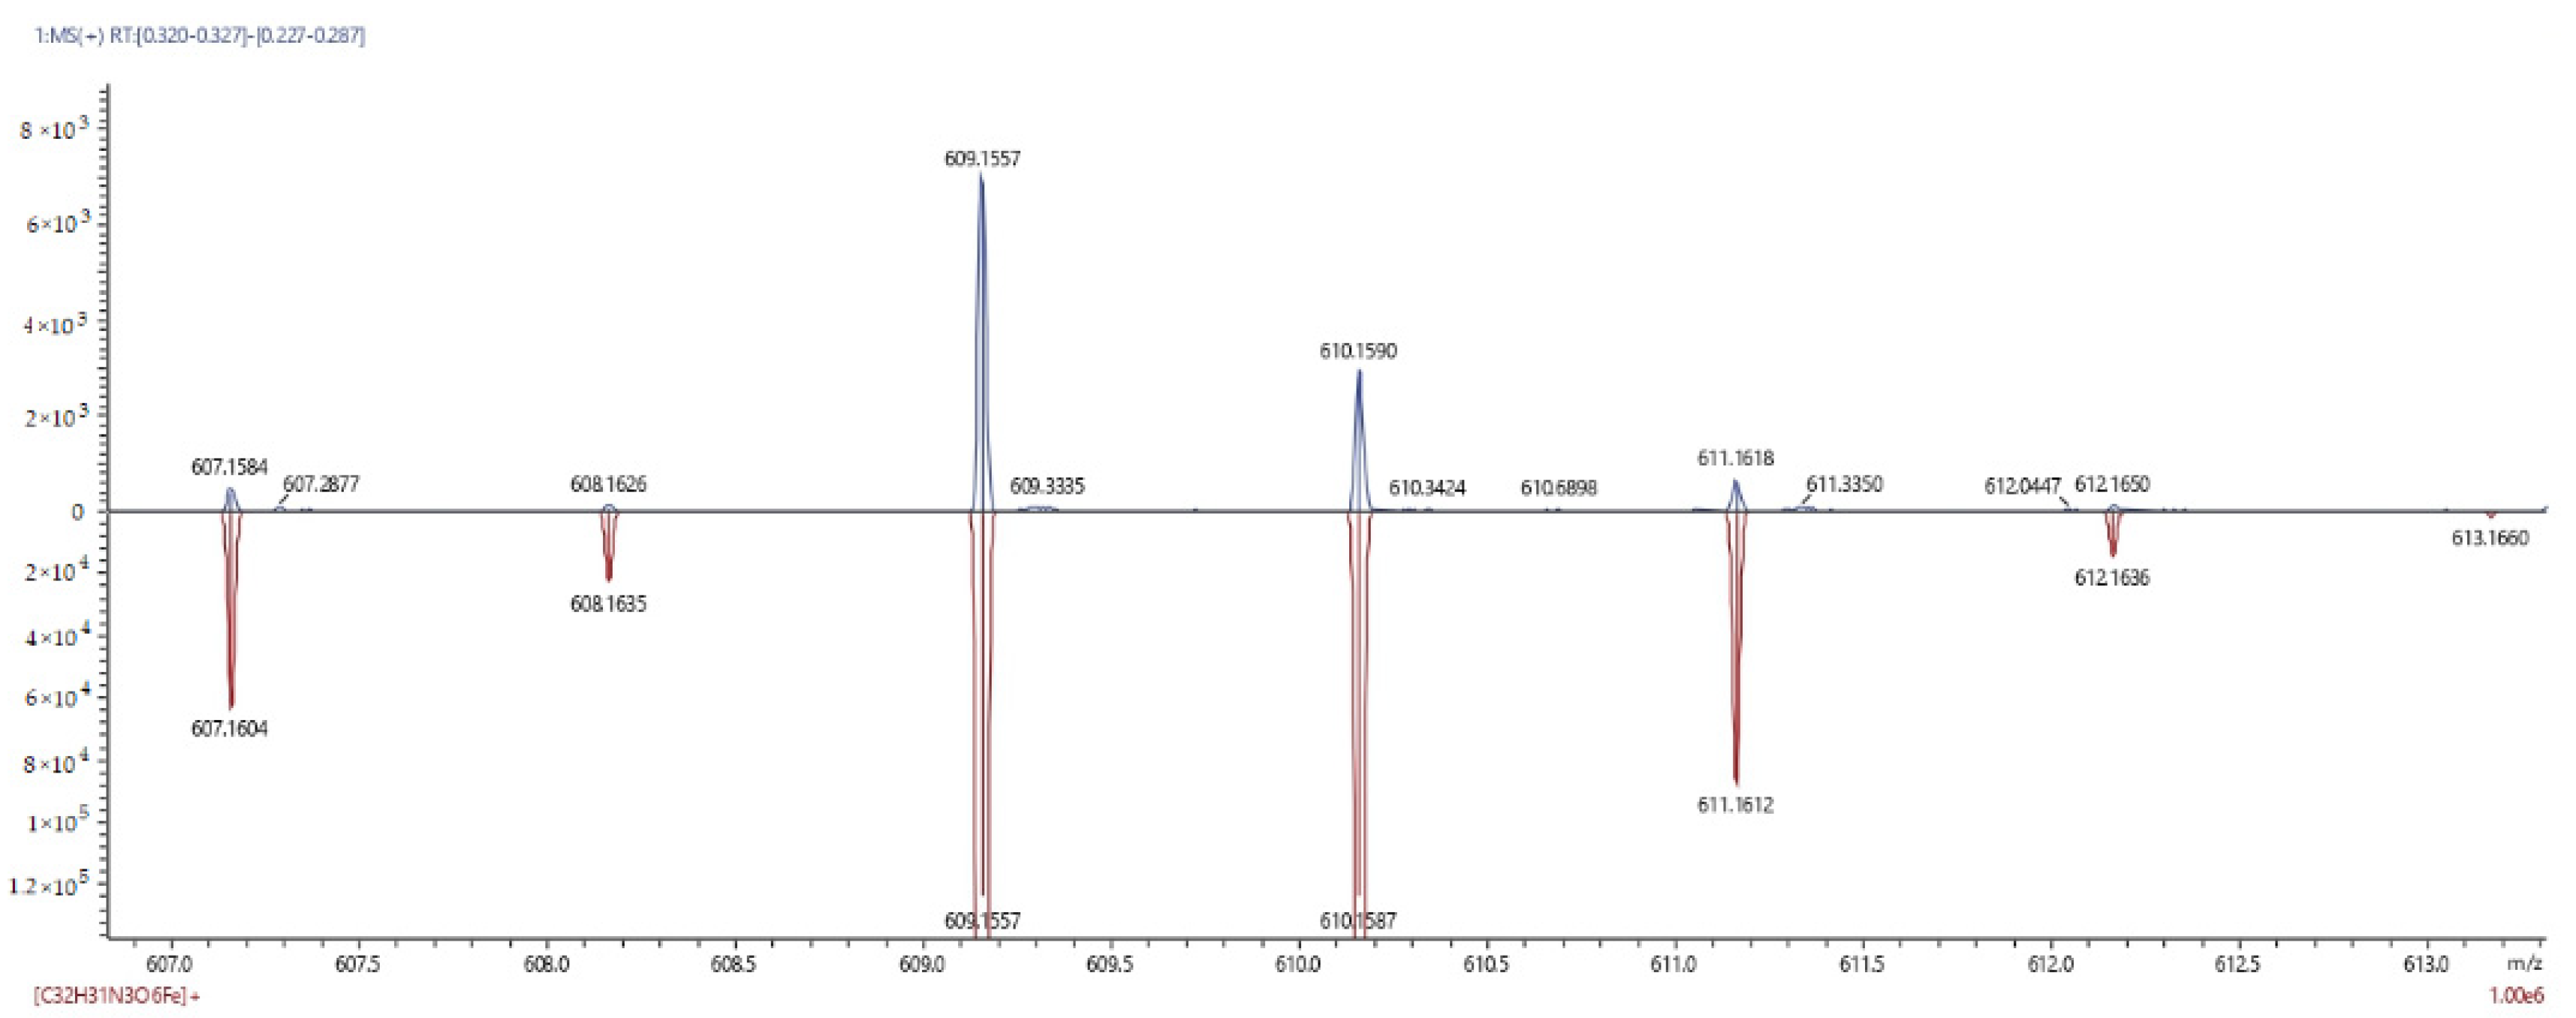
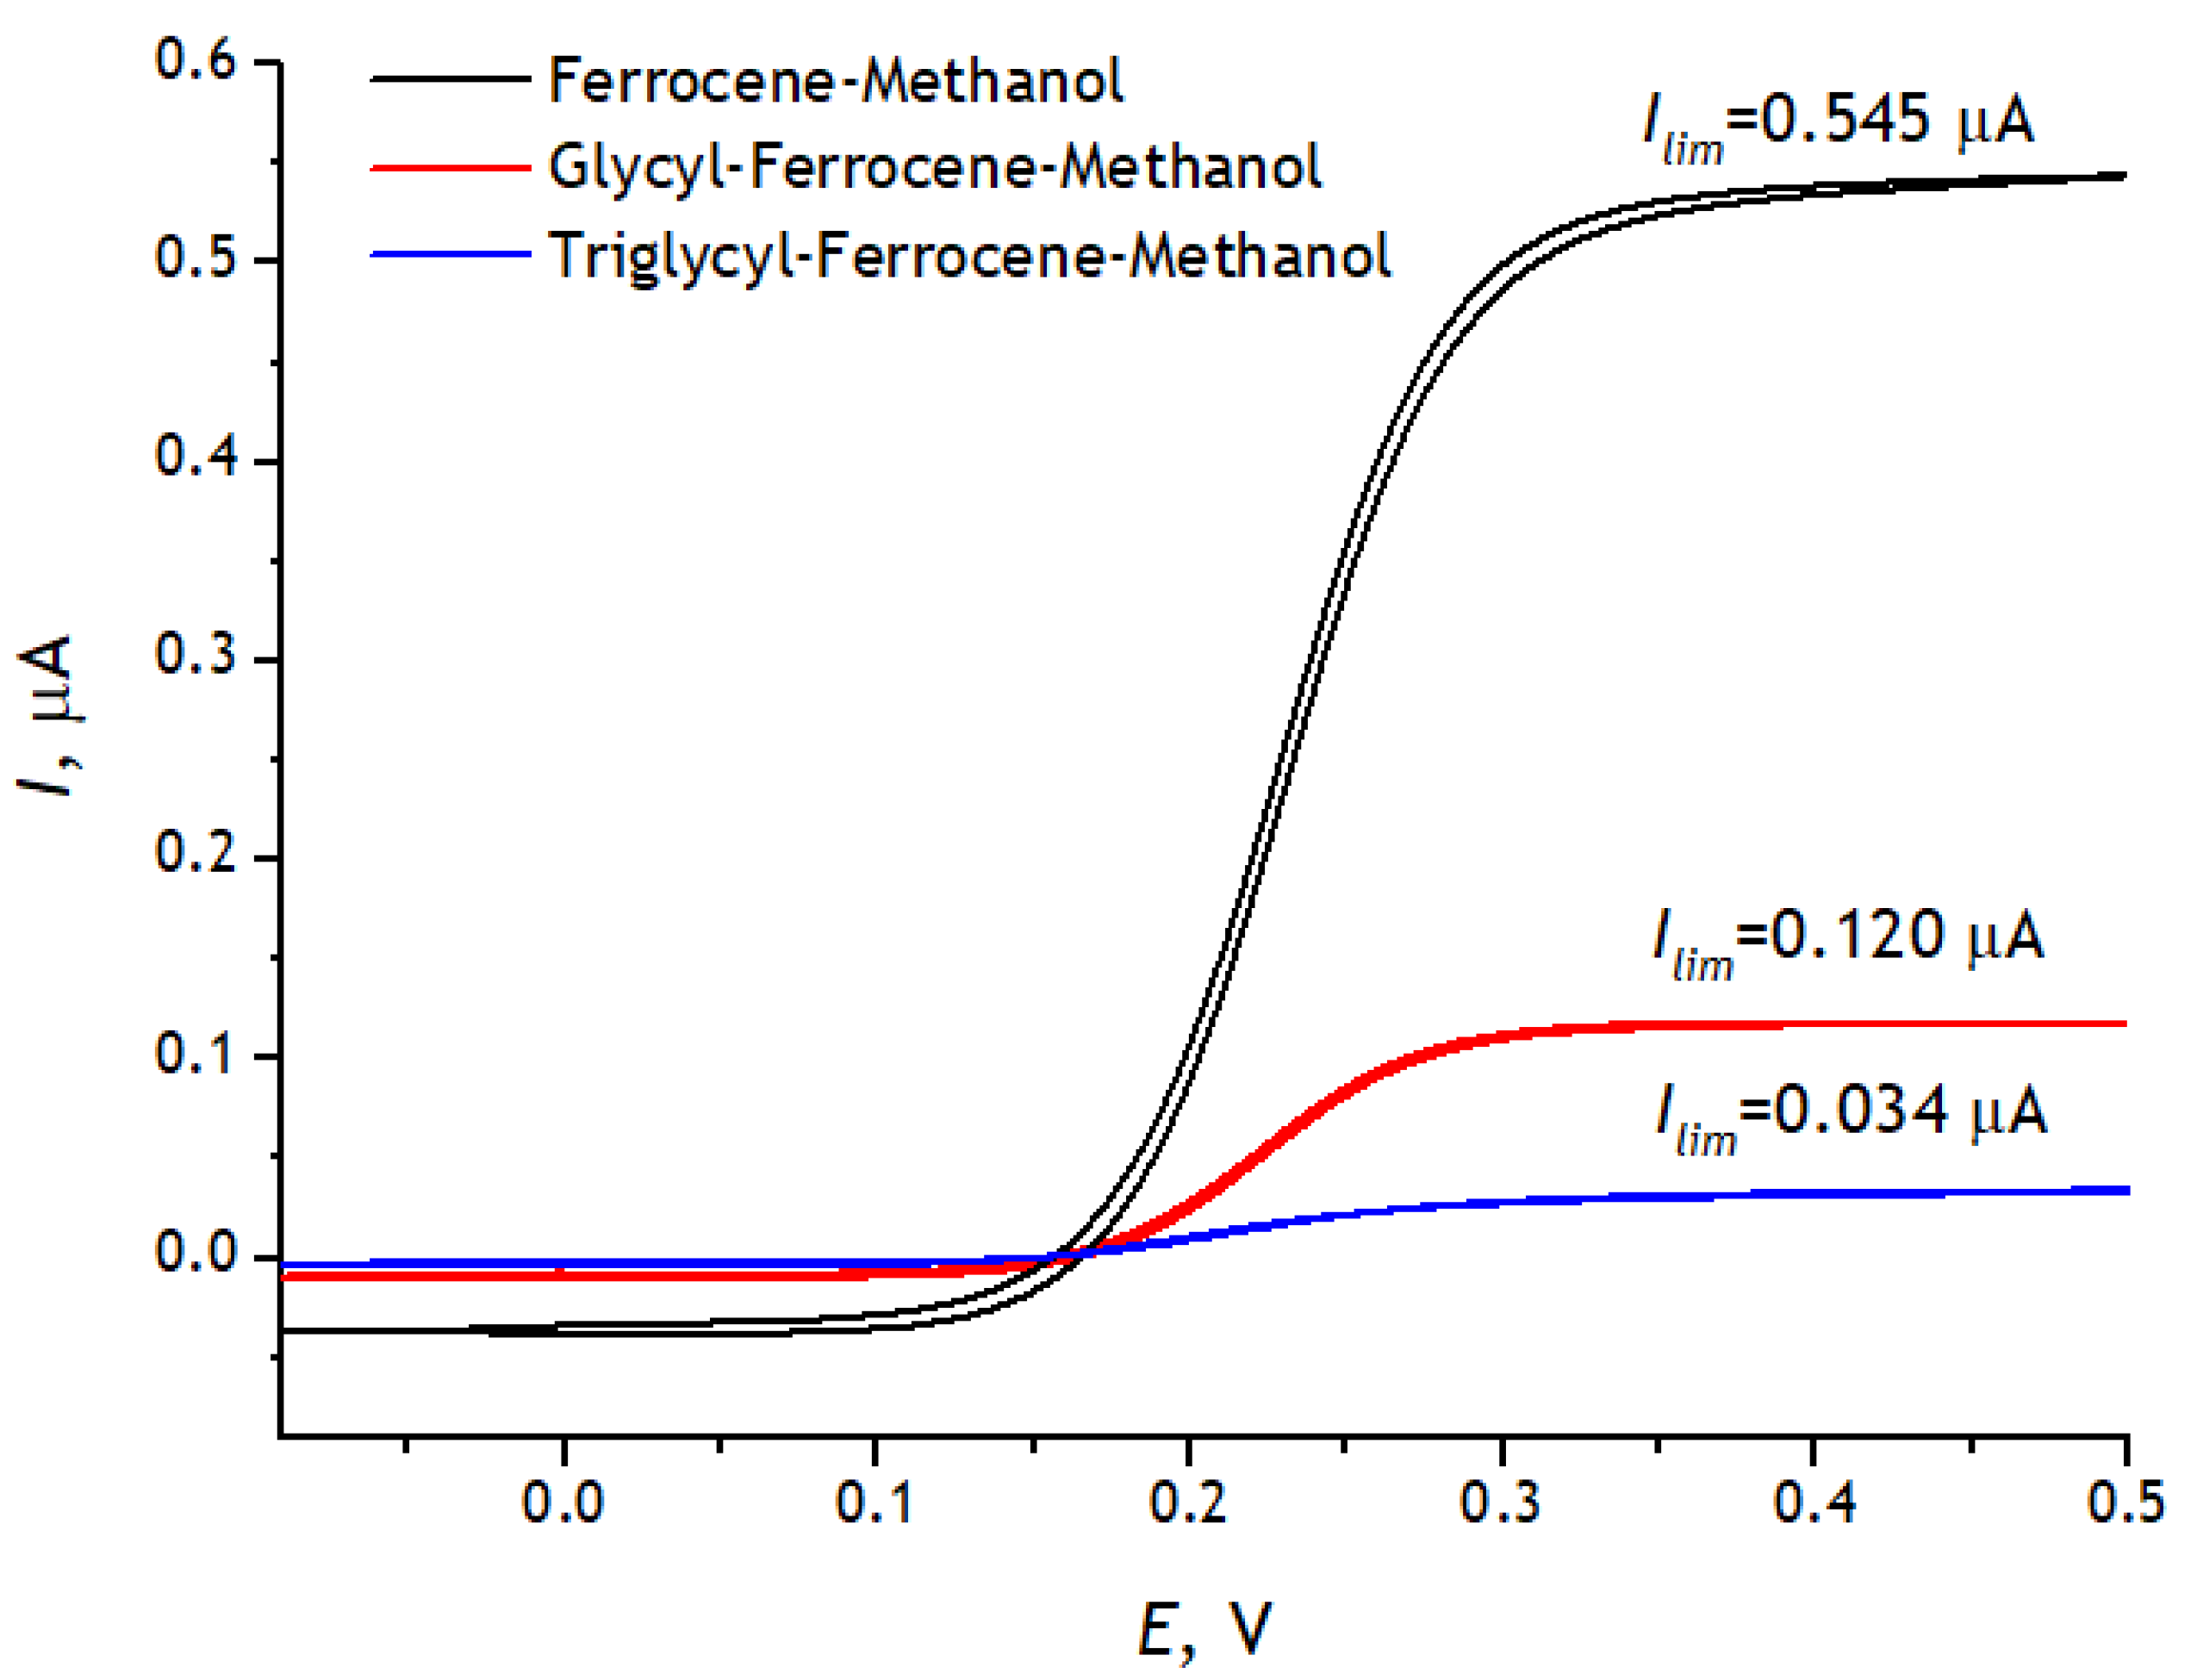
3.2. Determination of the Structure of Ferrocenemethanol Esters of Glycine and Triglycine

To study the esterification products of ferrocenemethanol and Fmoc-triglycine and ferrocenemethanol and Fmoc-glycine, high-resolution ESI MS(+) mass spectra were recorded on a Shimadzu LCMS-9030 Q-TOF mass spectrometer. In the MS1 spectrum (Figure 7) of the first compound, a molecular ion peak [M]+ with m/z 609.1557 (calculated value—609.1557) was observed, which corresponded to the formula C32H31N3O6Fe. The exact mass and isotopic distribution are in good agreement with the calculated spectra. MS2 spectra can be interpreted as the spectra of the expected ions of the products with the proposed structure. In the MS1 spectrum (Figure 8) of the second compound, we observed a molecular ion peak [M]+ with m/z 495.1130 (calculated—495.1128), corresponding to the formula C28H25NO4Fe. The exact mass and isotopic distribution are in good agreement with the calculated spectra. MS2 spectra can be interpreted as the spectra of the expected ions of the products with the proposed structure.
Thus, the study of electroactive peptide derivatives confirmed that the esterification products were Fmoc-protected glycyl ferrocenemethanol and triglycyl ferrocenemethanol.

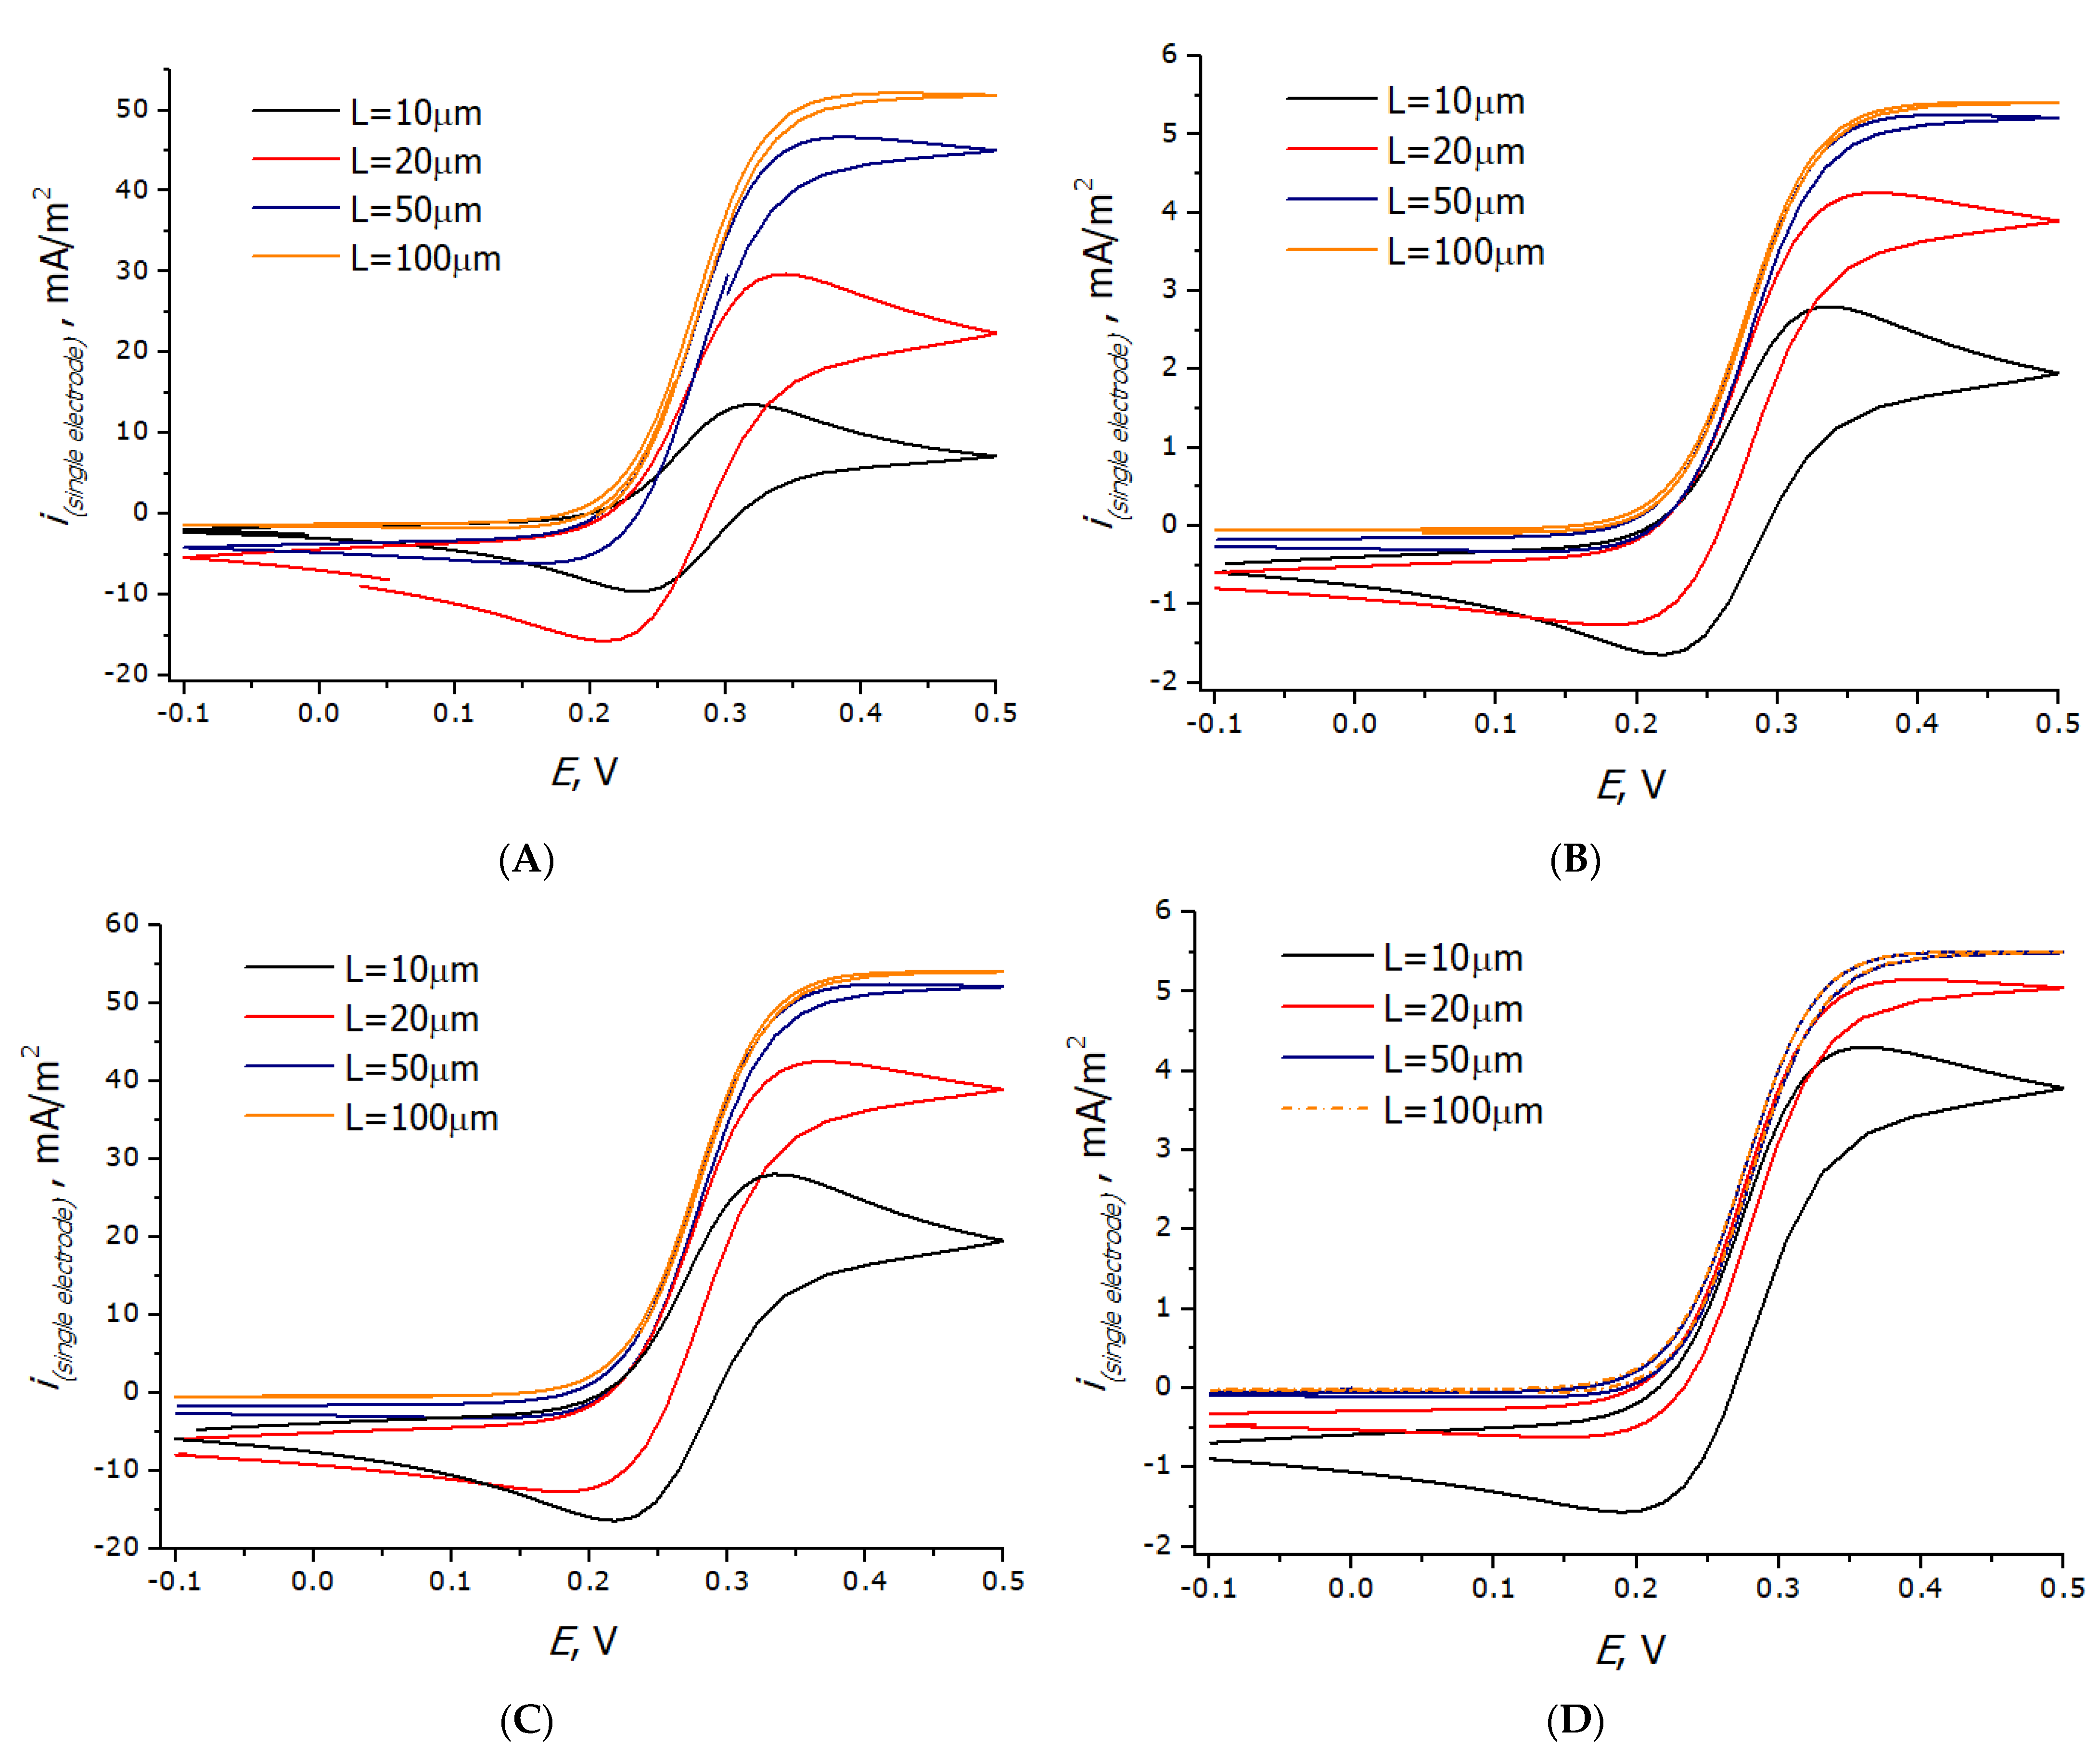
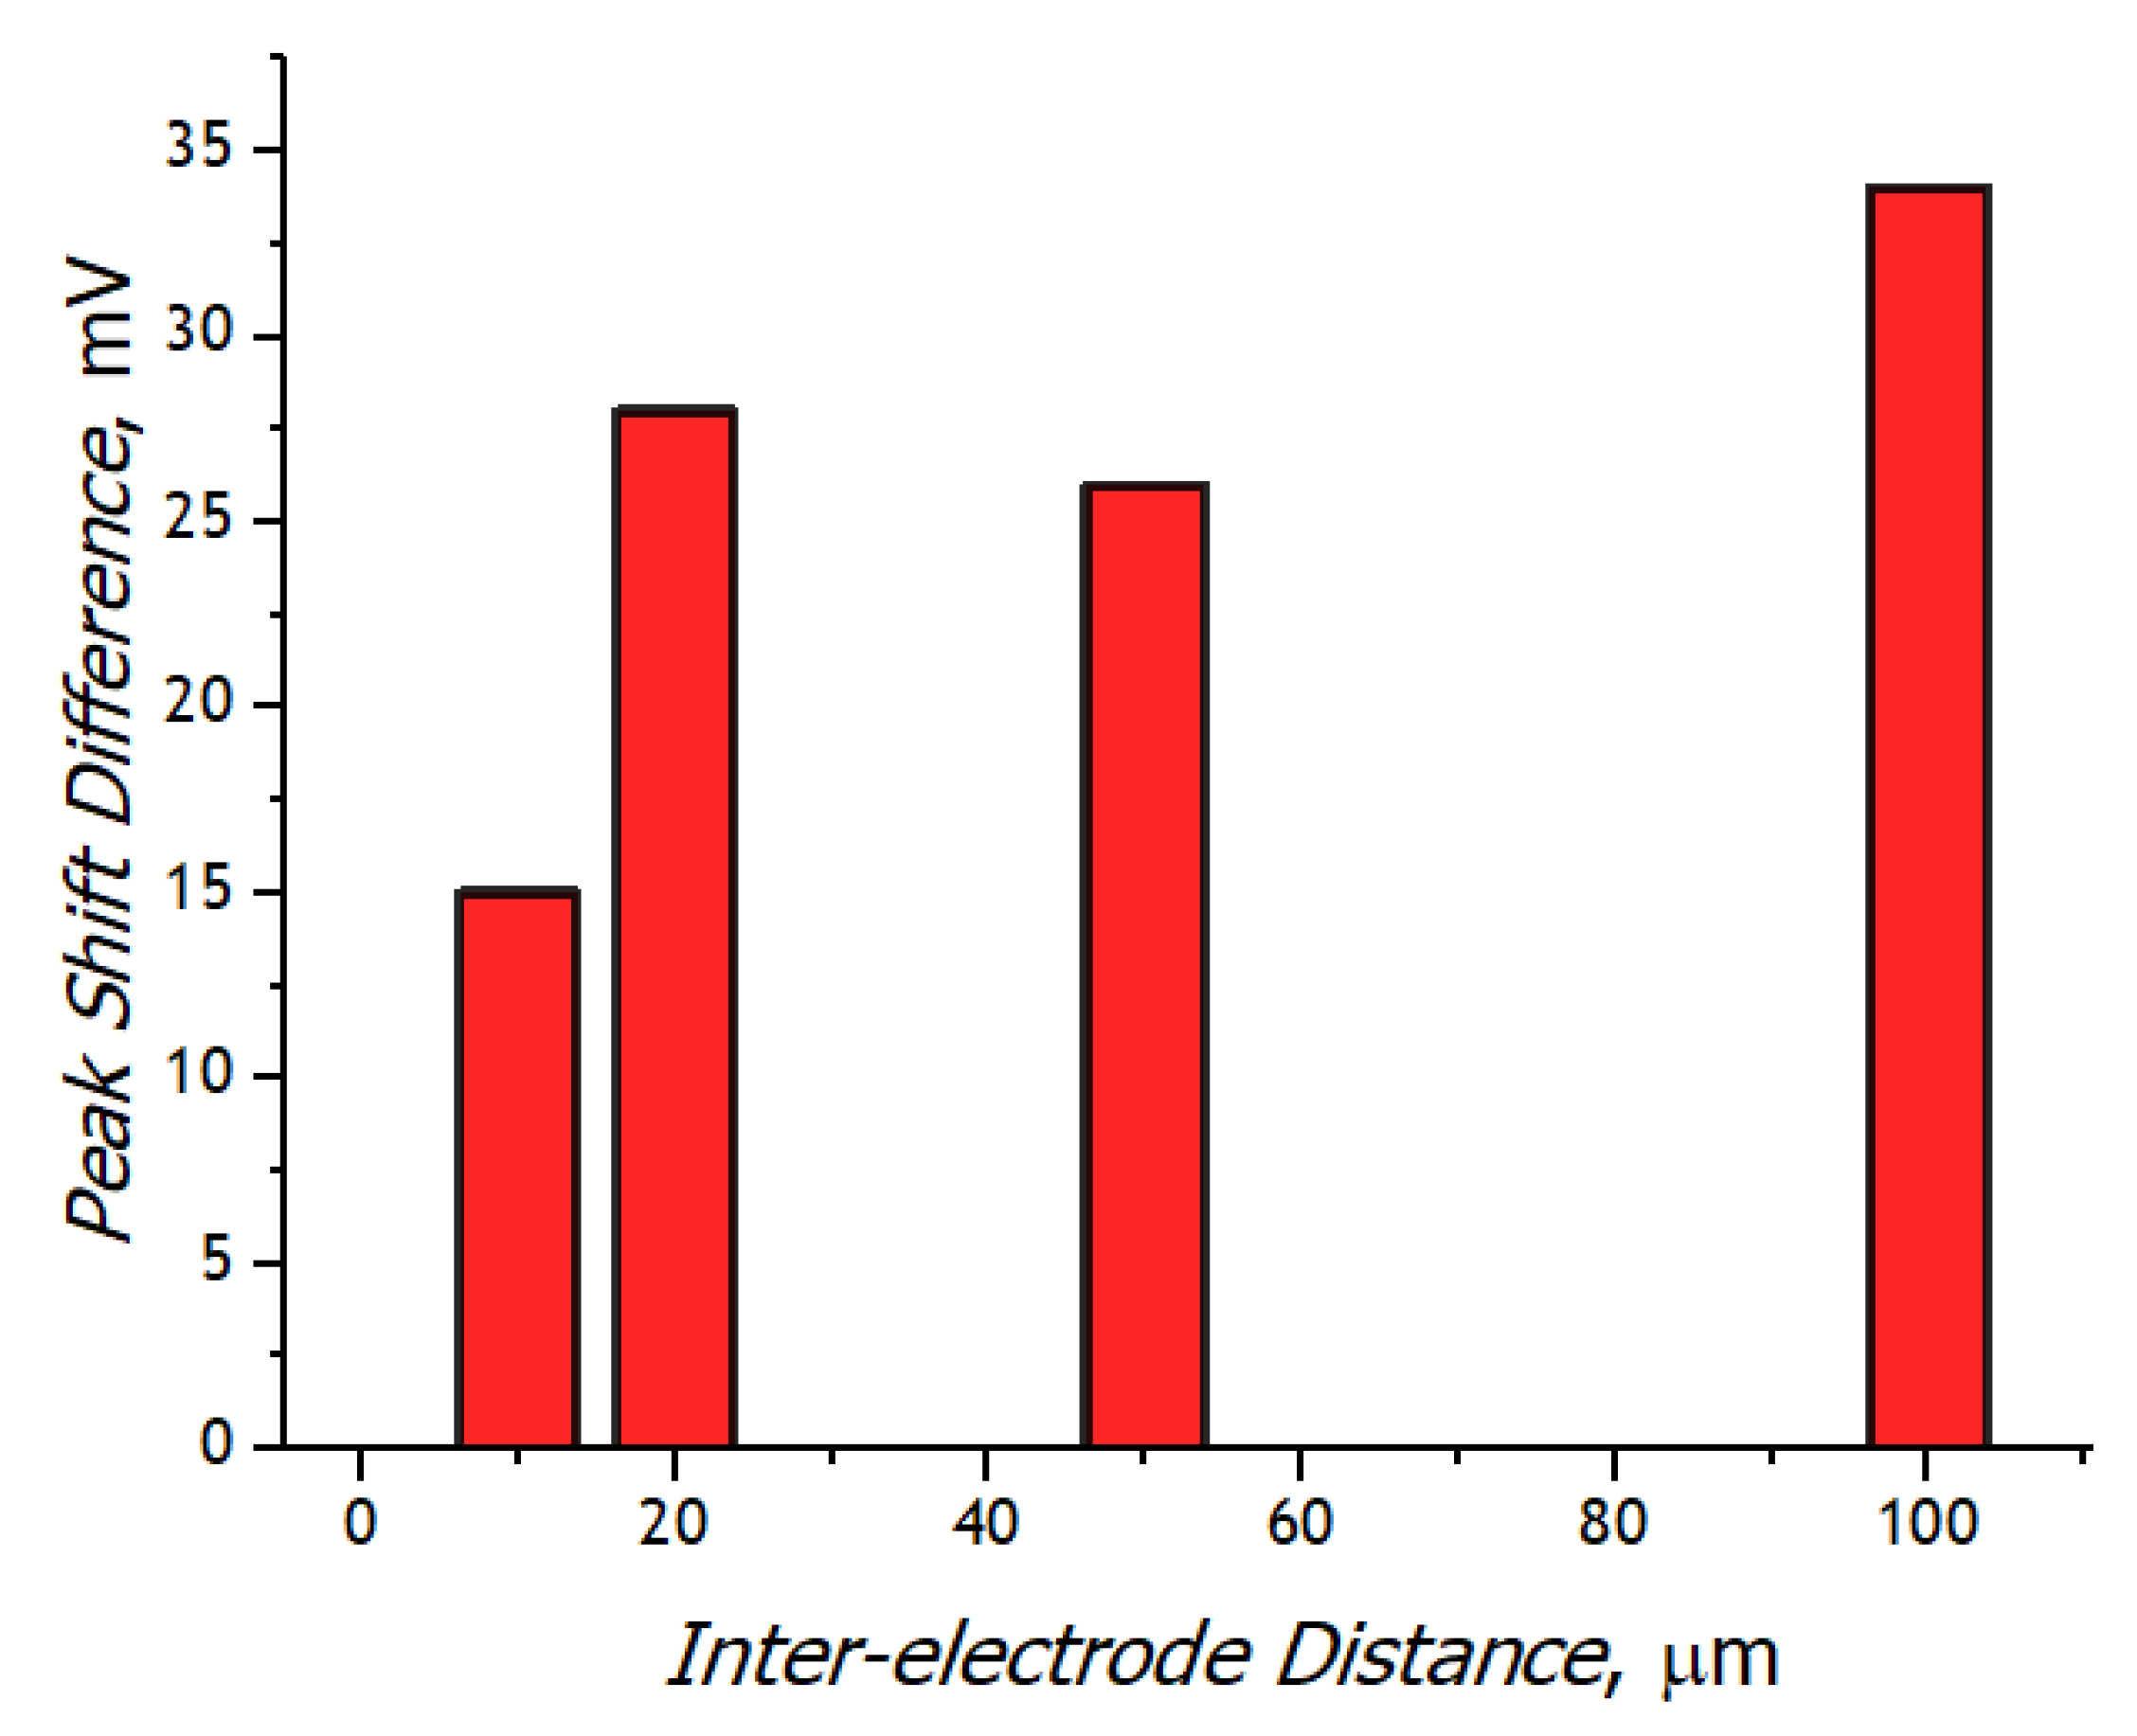
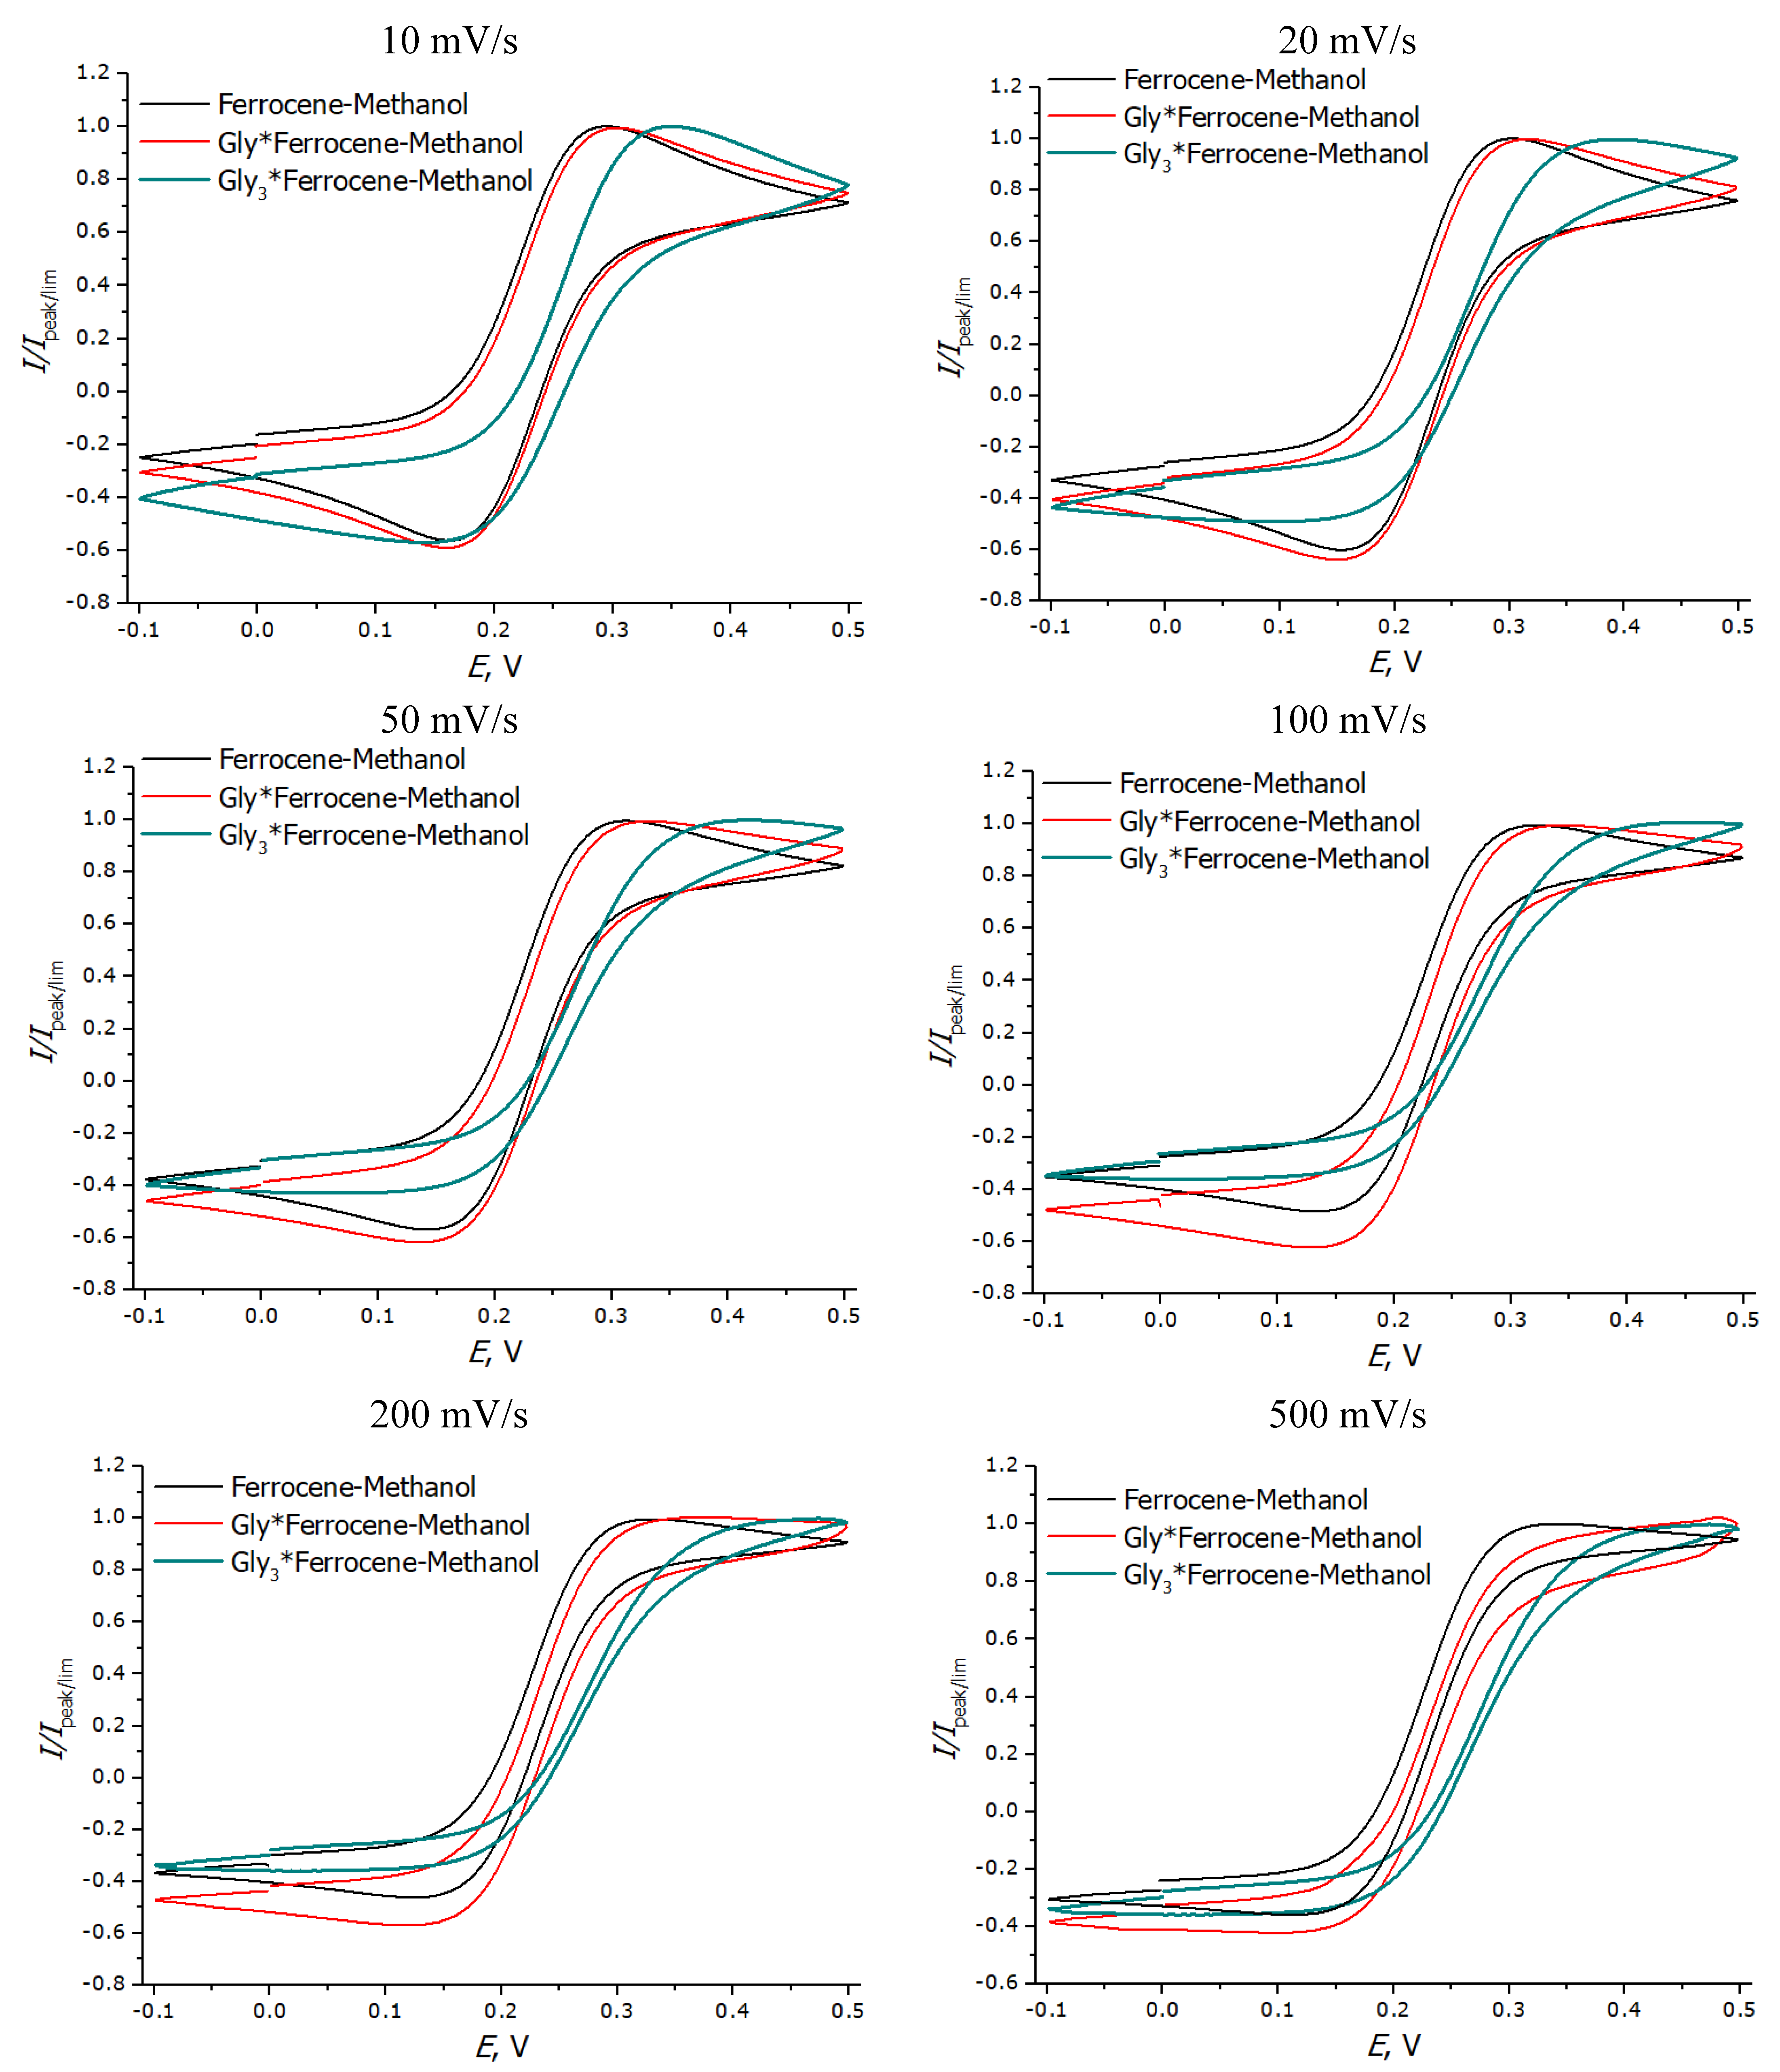
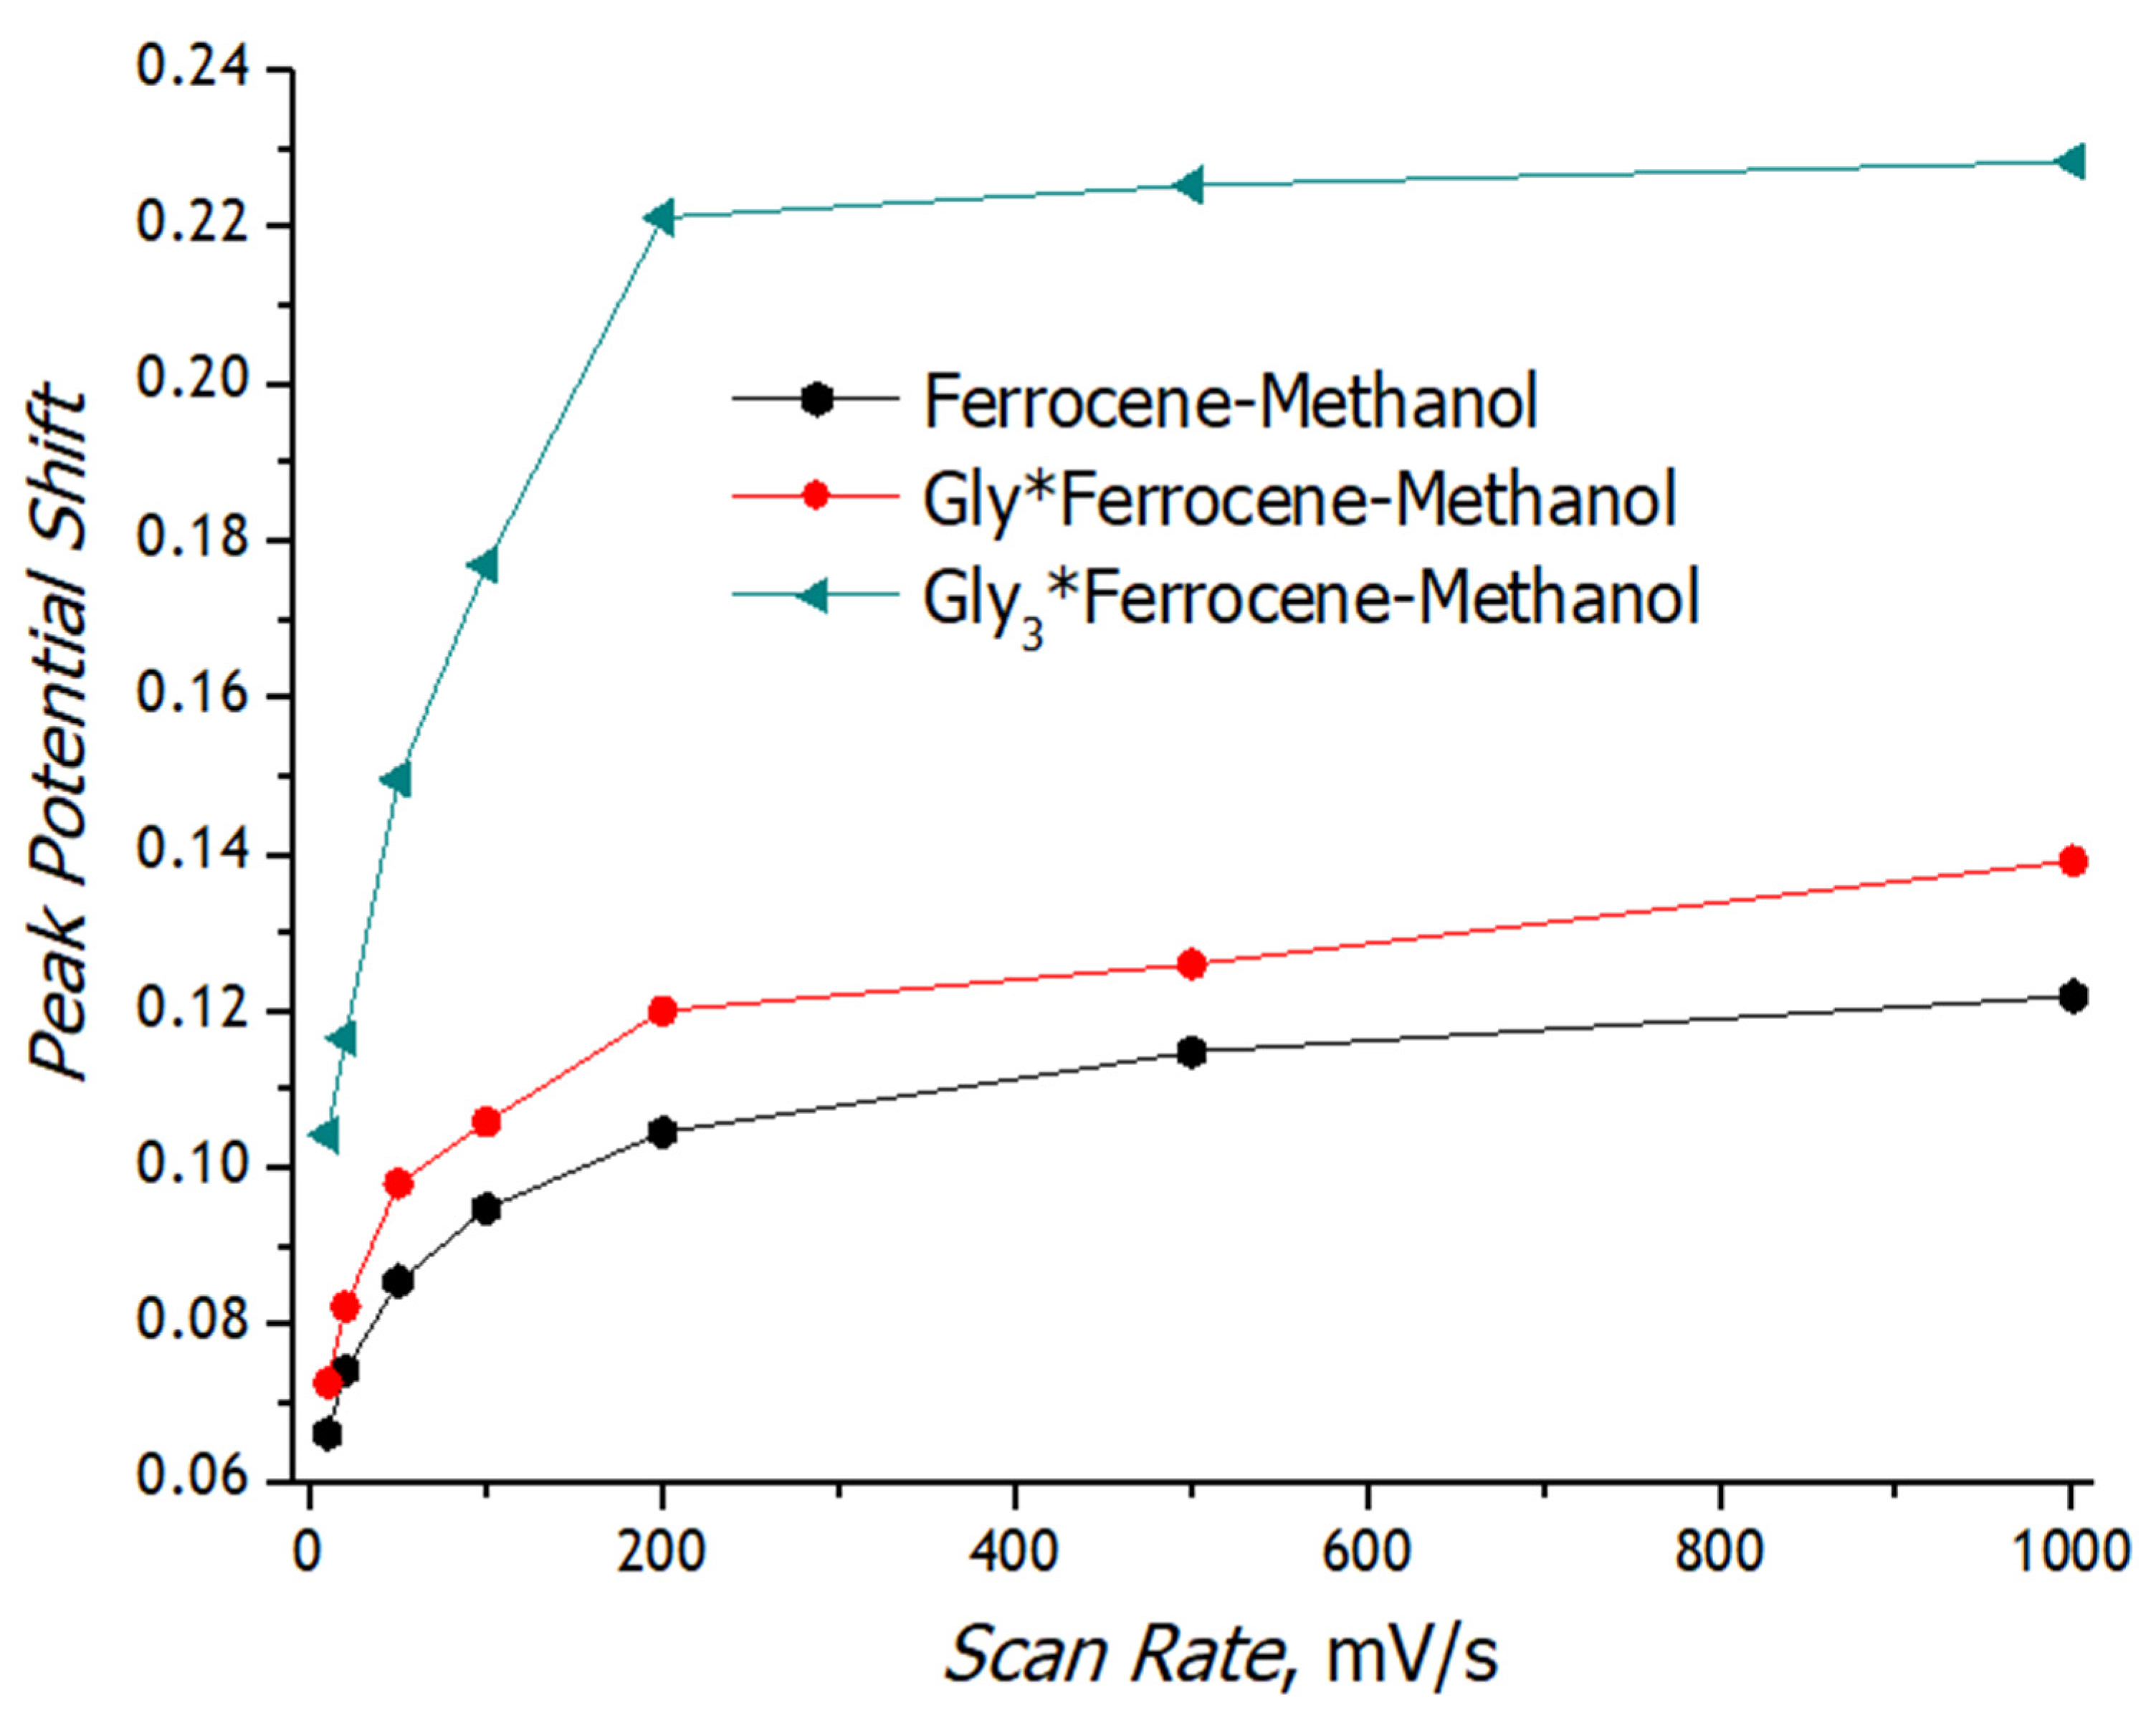
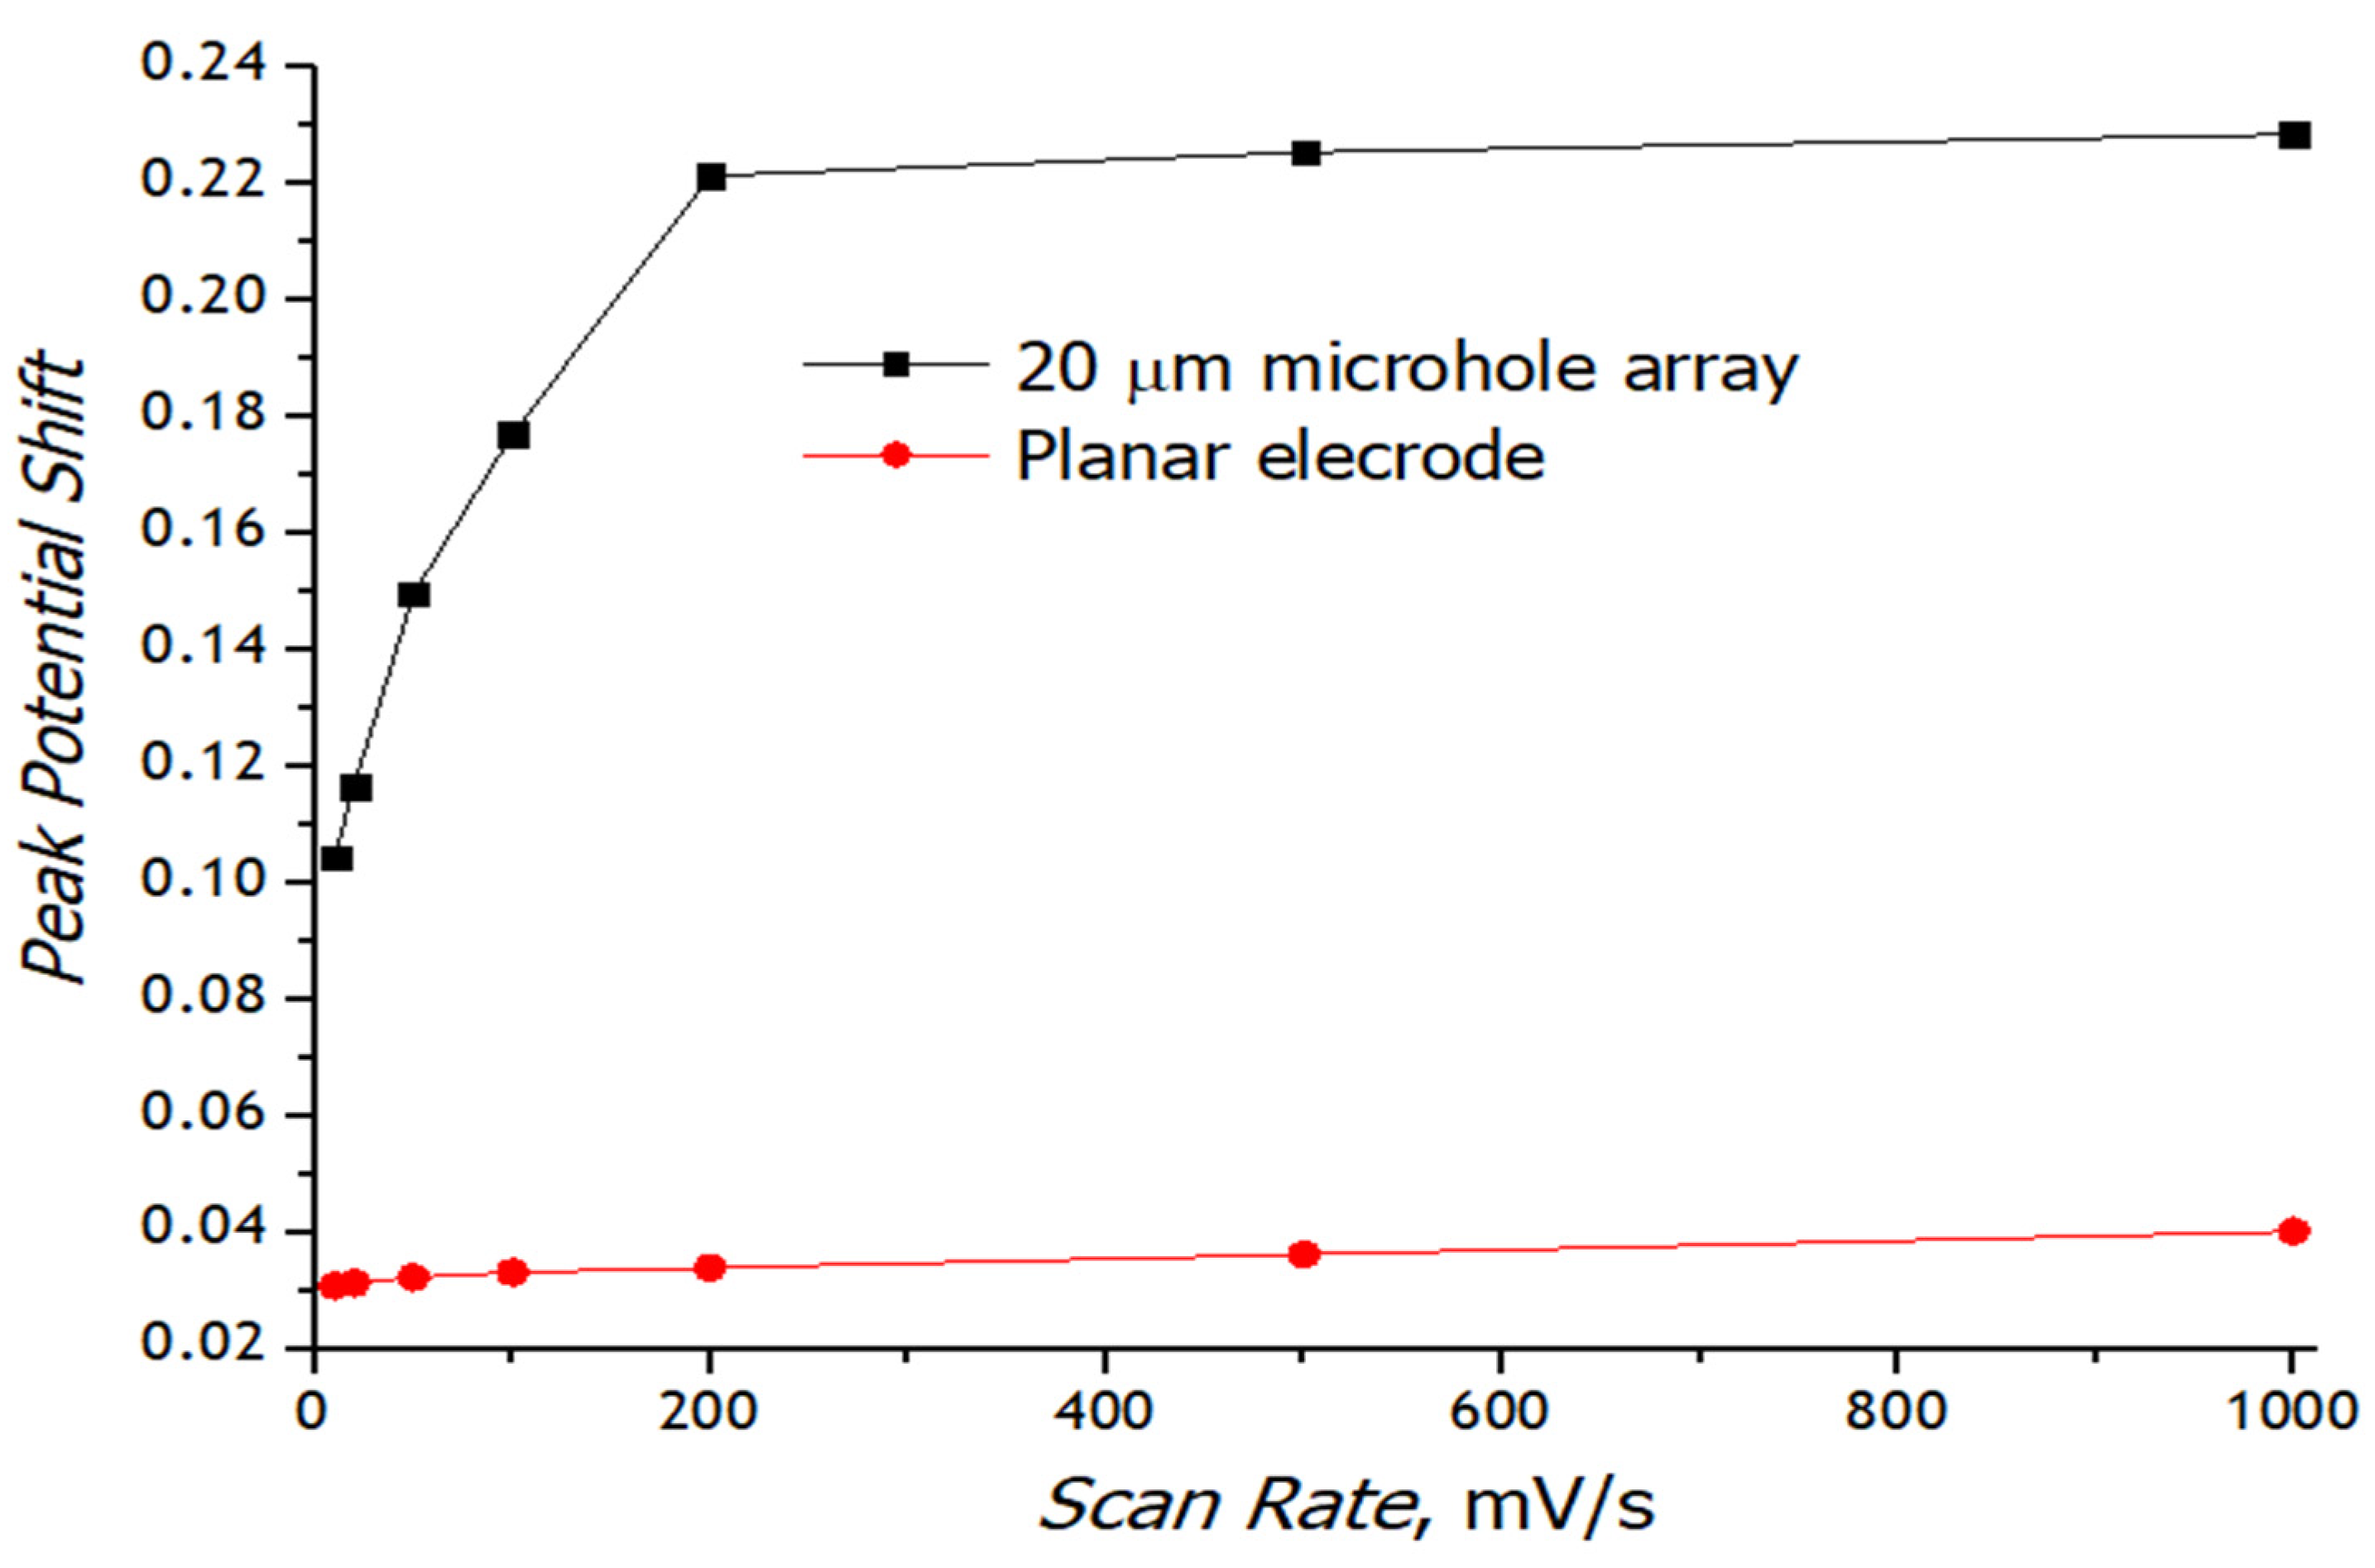
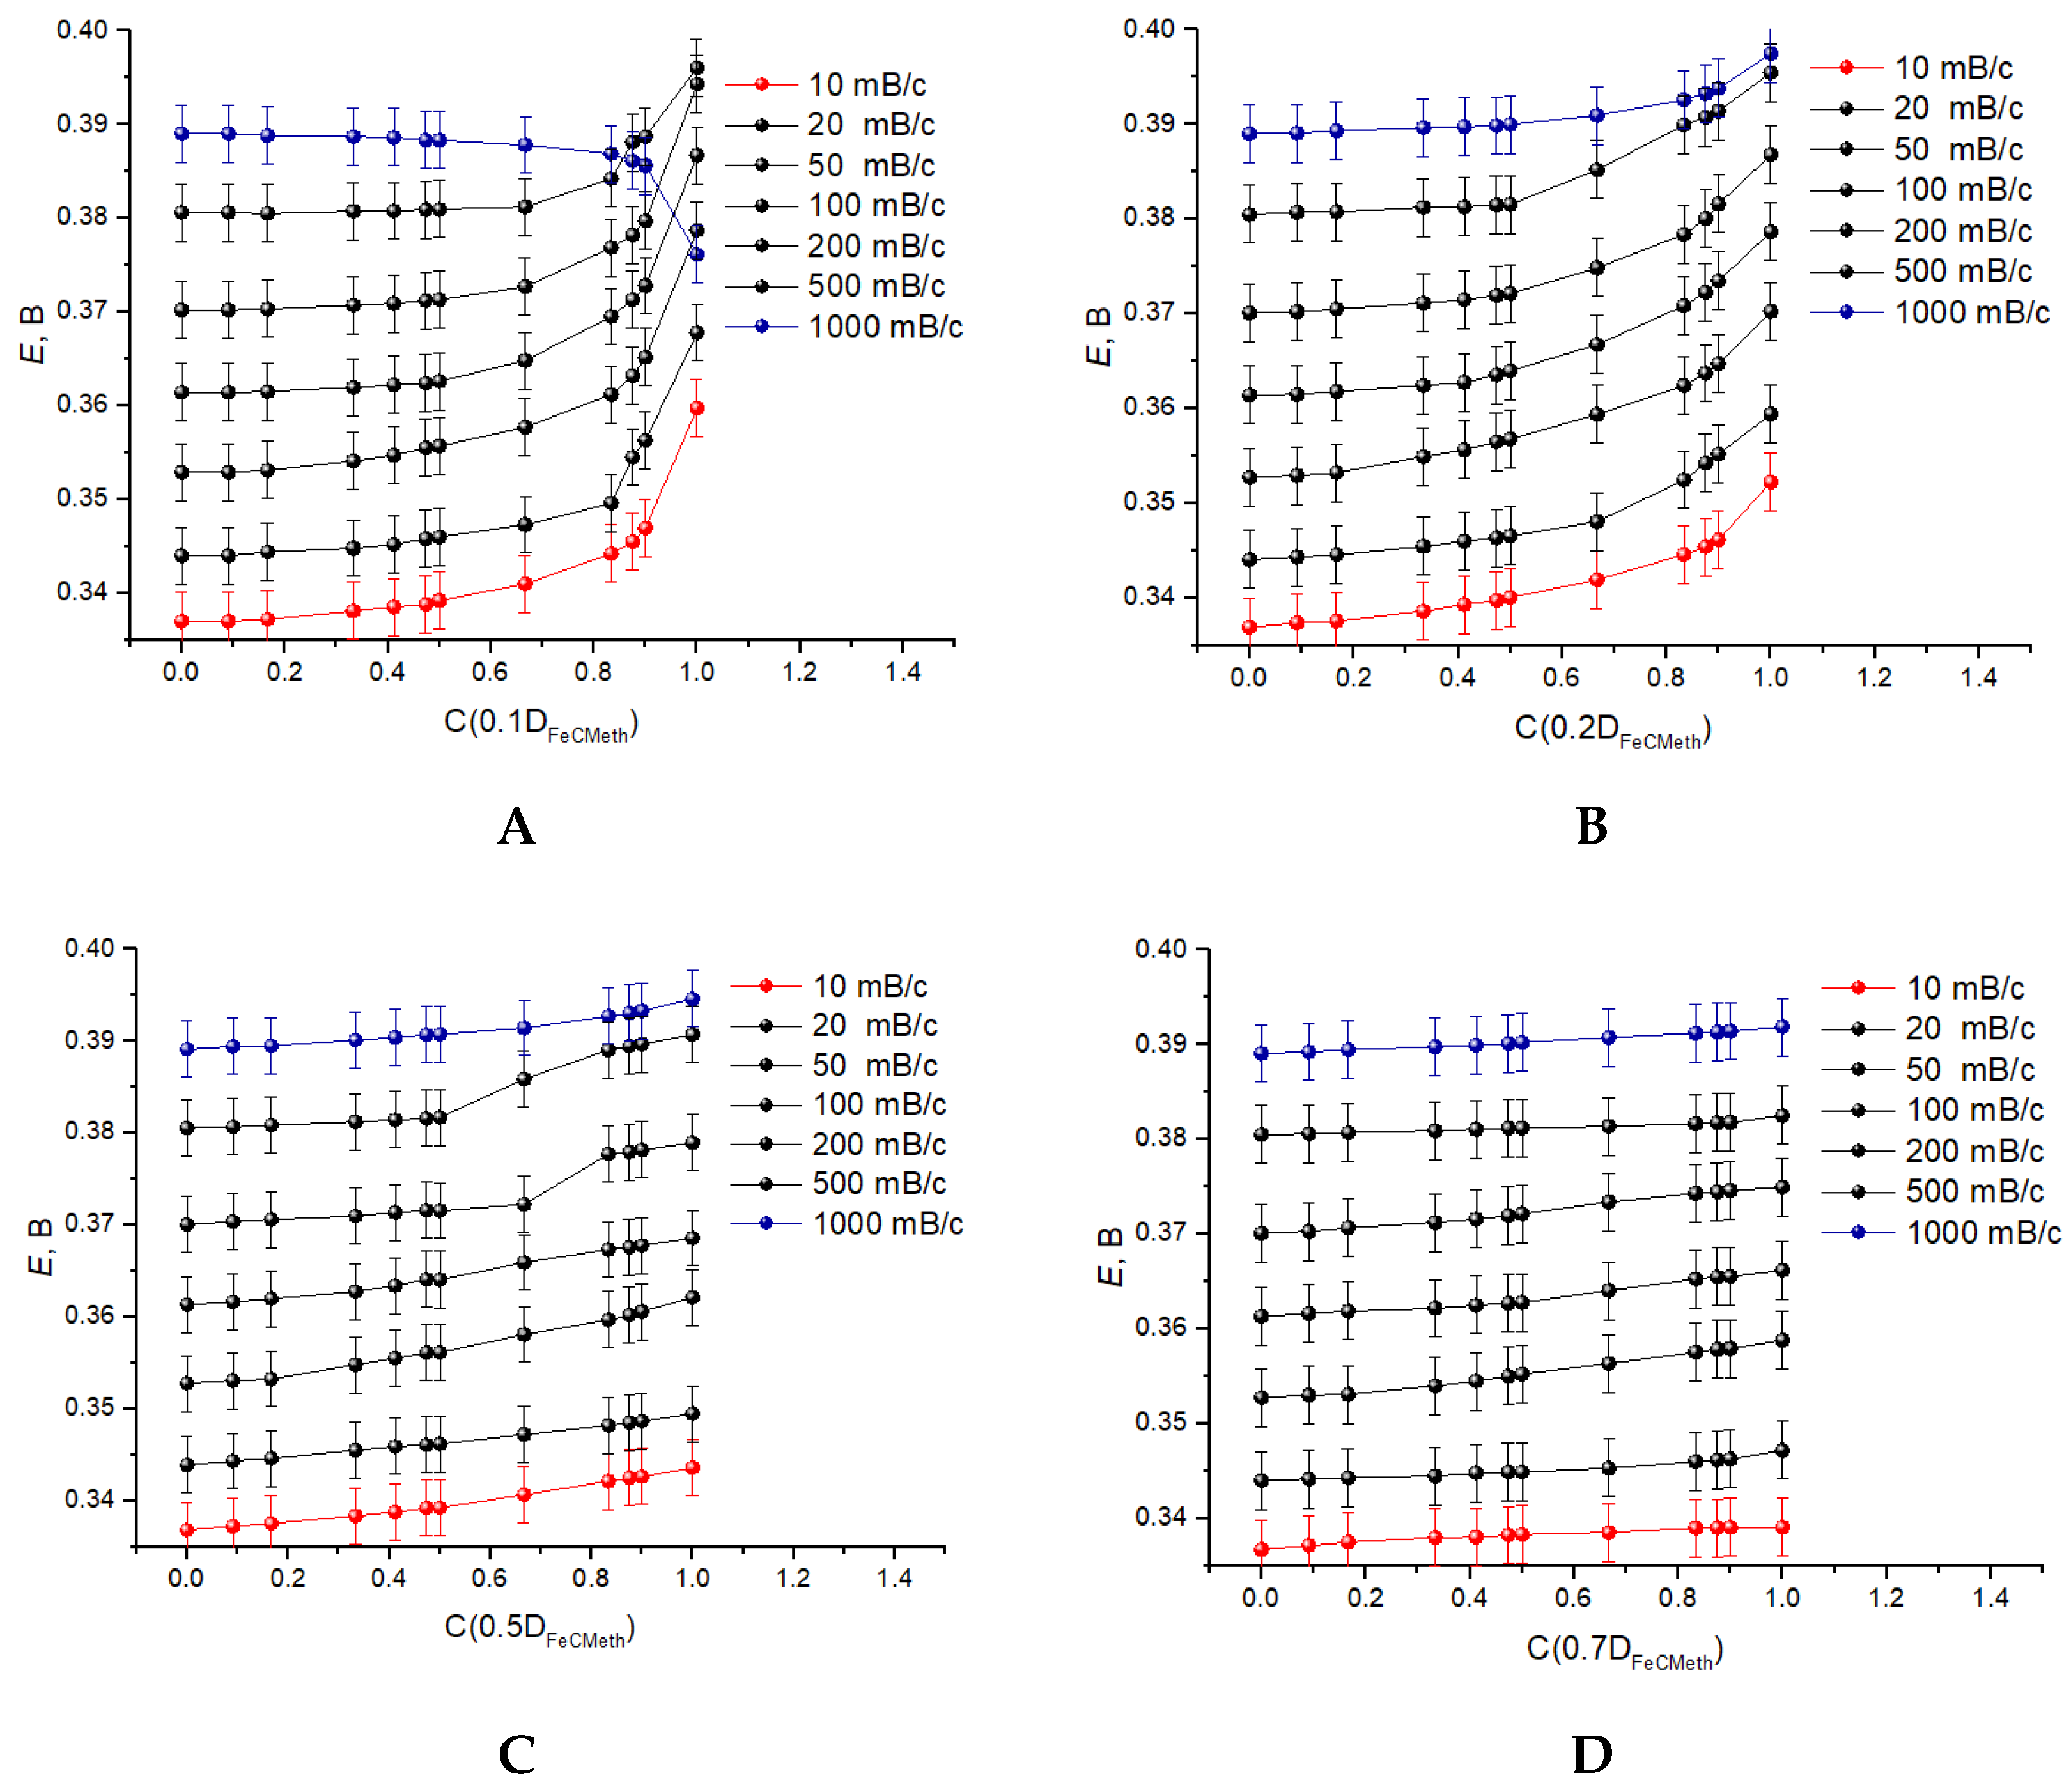
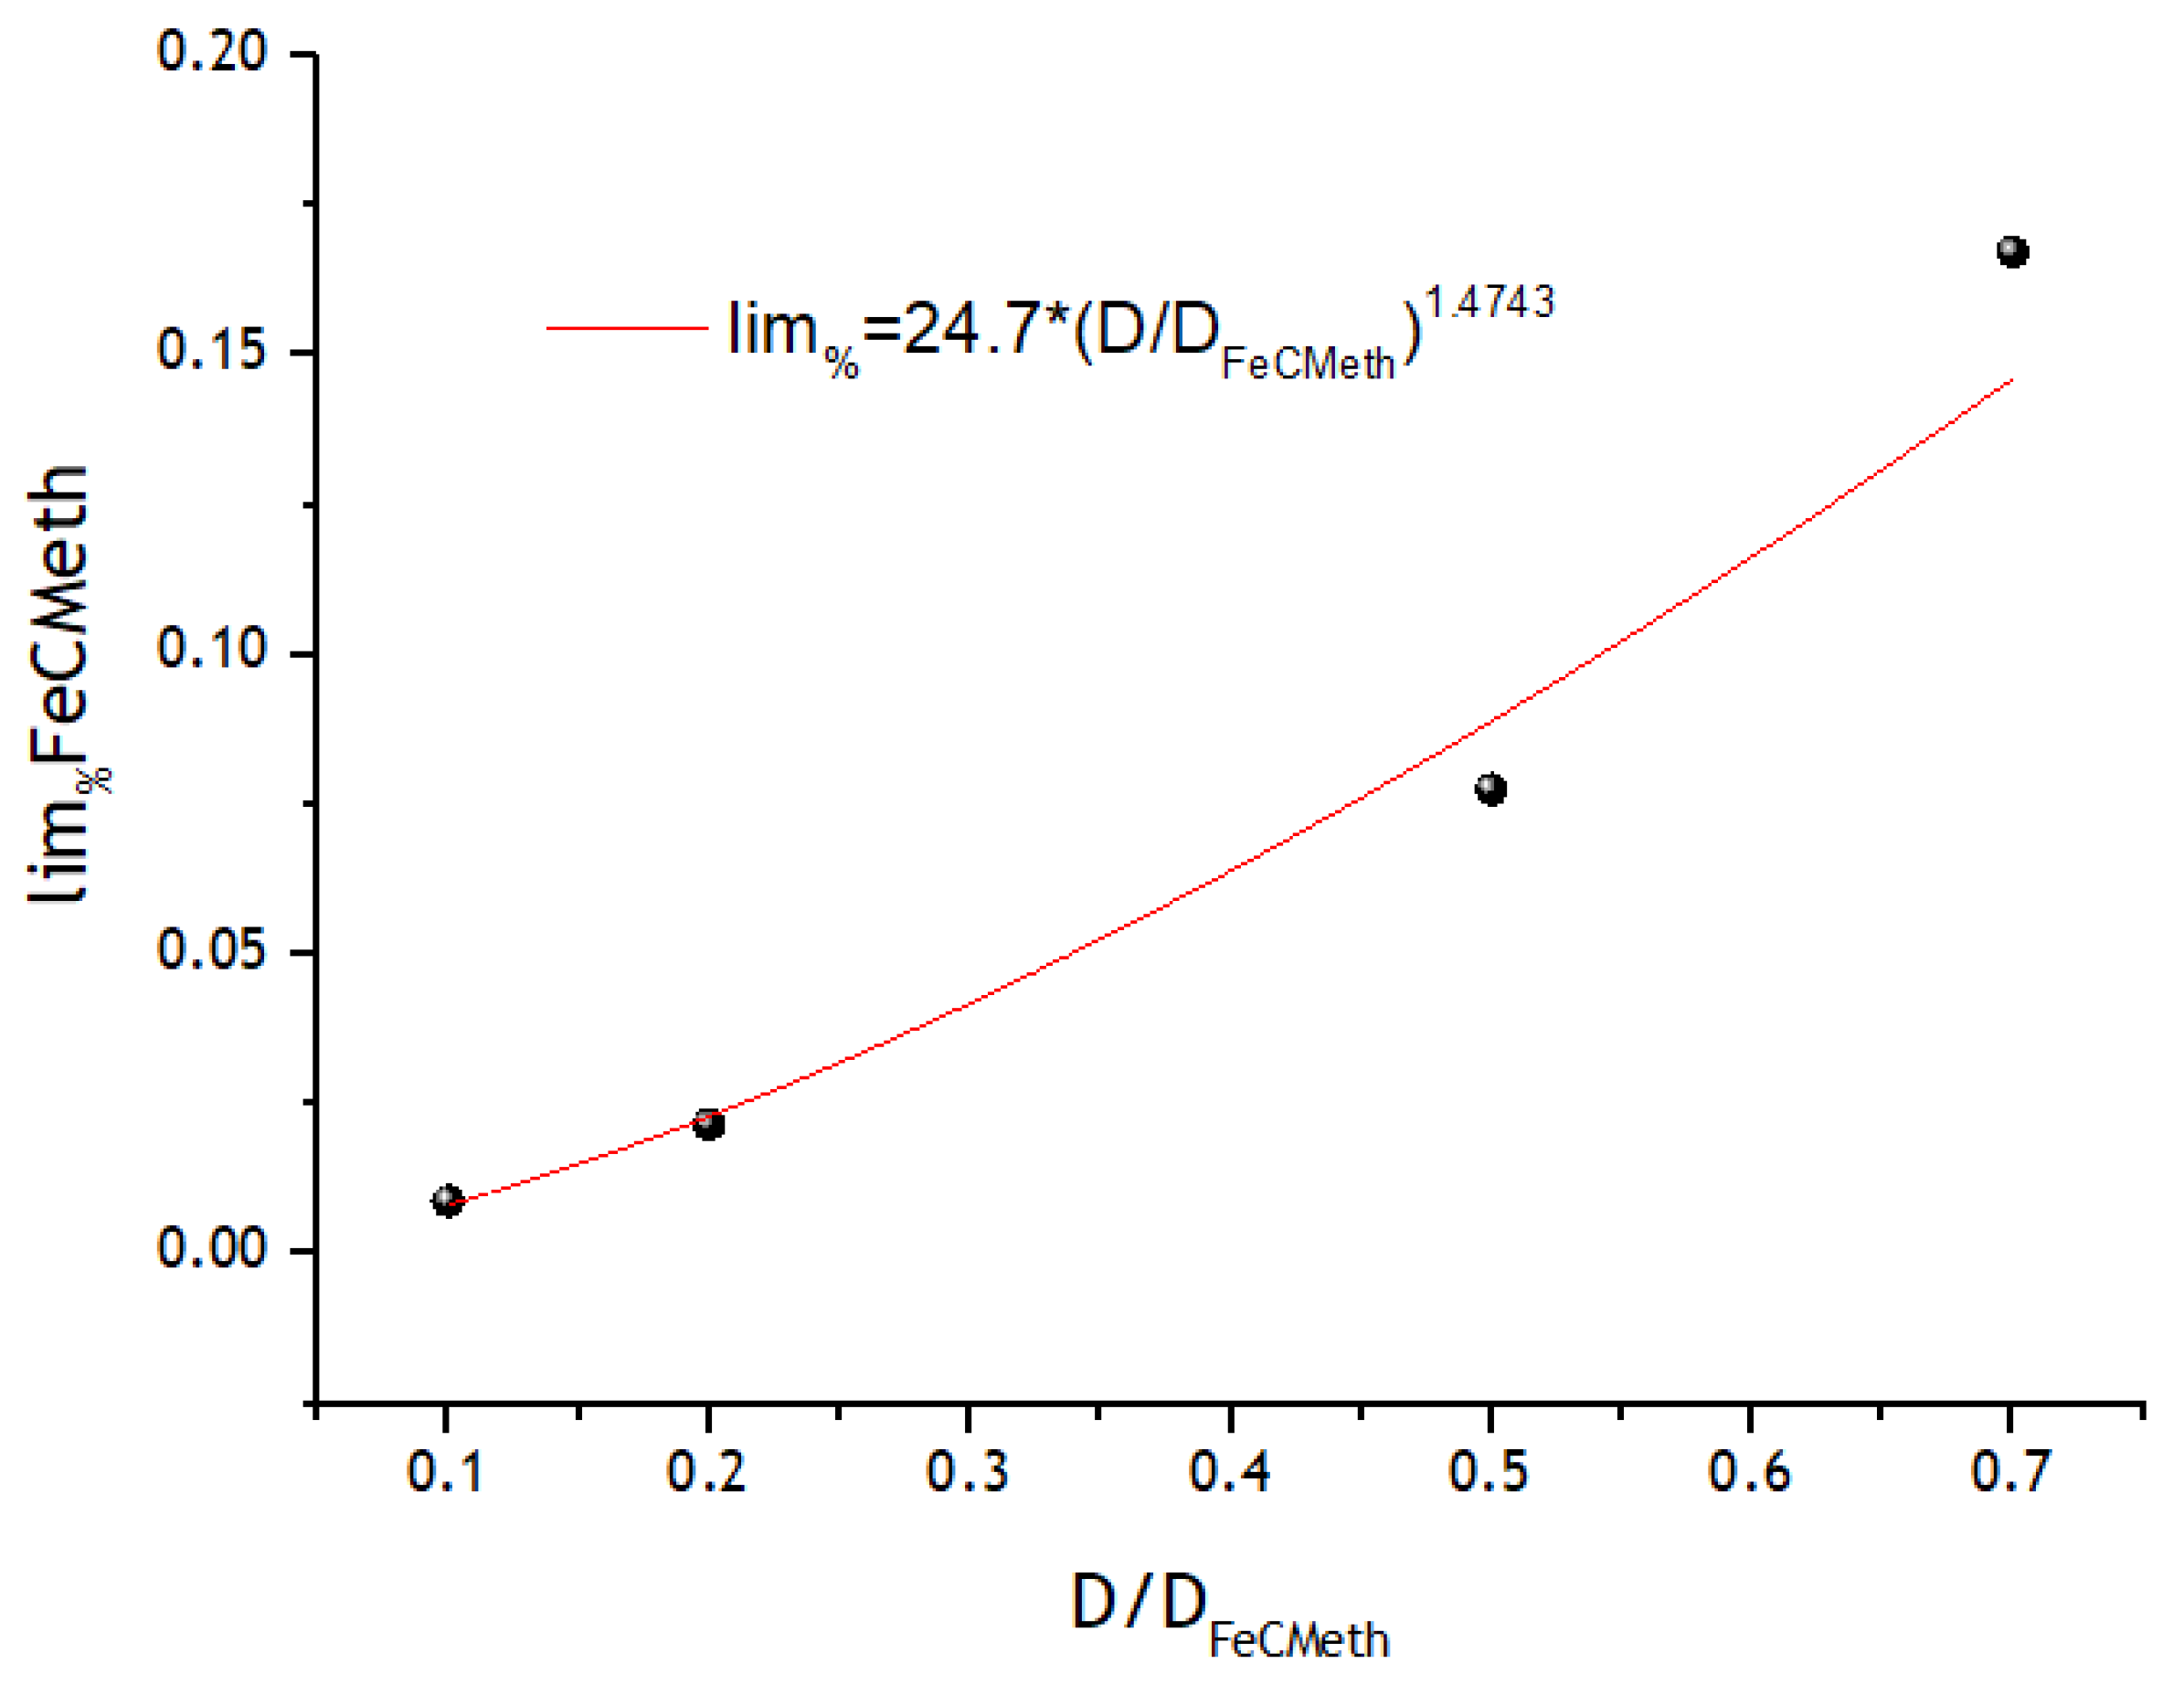
3.3. Registration of Voltammograms and Comparison of the Obtained Results with Theory

A series of cyclic voltammograms for a model compound (ferrocenemethanol, equilibrium potential 275 mV, diffusion coefficient 0.74 × 10⁻⁹ m2/s) was constructed at various sweep rates, and a comparison was made of the voltammetric curves of substances with a diffusion coefficient that differs by an order of magnitude at different values of the distance between individual UMEs. As a measure of the transition from the nonstationary to the stationary mode, the value of the oxidation peak potential displacement was chosen; in the case of equilibrium electrode process, it does not depend on the sweep rate, which means that it can characterize changes associated with differences in the diffusion parameters.
Figure 9 shows a series of current–voltage curves for various distances between the electrodes and various diffusion coefficients.
It can be noted from the Figure 10 that the most noticeable discrepancy in the shape of the curves is observed at a distance of 20 μm and 100 μm, but increasing of the distance results is observed in the decreasing of the integral current of ensemble; therefore, the main significant results are presented for ensembles with interelectrode distance 20 μm. For this ensemble, the calculated dependence of the stationarity parameter on the diffusion coefficient was constructed (Figure 11).
As can be seen from the graph, there is a significant relationship between the diffusion coefficient and the stationarity parameter, associated with a change in the degree of overlapping of the diffusion regions of neighboring ultramicroelectrodes. In addition, it quite accurately fits a linear dependence in log–logarithmic coordinates (or power-law in linear ones) with the coefficients indicated on the graph, which theoretically could be used to separate the signals of substances with different diffusion coefficients.
In addition, model cyclic voltammograms of ferrocenemethanol were built on an ensemble with a distance of 20 μm at various sweep rates for subsequent comparison with experimental data (Figure 12).
Based on the results of the mathematical modeling, it was decided to produce 4 sets of microelectrode ensembles with interelectrode distances of 10, 20, 50, and 100 microns. The first one is convenient from the point of view of a larger area and, consequently, a larger value of the recorded signal, which will be used in the experimental verification of the simulation results; the second one has the optimal geometry in terms of constructing dependences on the diffusion coefficient. An electrode with a distance of 100 µm is guaranteed to have a stationary current–voltage response, which will be used to determine the diffusion coefficient.
Next, we proceeded to study the experimental dependences of the electrochemical parameters on the chain length. Initially, to confirm the convergence of model and experimental data, CV curves were recorded for the established effective interelectrode distance of 20 μm as applied to the ferrocenemethanol/ferroceniummethanol redox system. Various sweep rates from 10 to 1000 mV/s were tested (Figure 13):
For comparison, we also present, on the same graph, calculated and experimental CV curves for a sweep rate of 100 mV/s (Figure 14).
The standard deviation in the area of the oxidation peak (−0.5–0.2 V) is within 5 × 10⁻⁴ in relative units (the current to peak current ratio), which can be considered a satisfactory result in terms of the predictive potential of the model.
It should be noted that large discrepancies in the reduction potential range are due to easy oxidation of ferrocenemethanol in air, which can be seen visually during long-term storage of the solution: its color changes from yellow to blue. For this reason, the oxidation peak of the reduced form was used as a characteristic peak.
In addition, dependences of the peak potential shift on the sweep rate for experimental and theoretical data were plotted (Figure 15), which demonstrate a fairly high convergence (standard deviation within 2 mV, which also confirms the accuracy of the model).
The next step involved the construction of CV curves for ferrocenemethanol modified with peptide fragments (monoglycine and triglycine). As a result, similar series of curves were recorded and graphs of the dependence of the peak potential shift on the sweep rate were plotted. Figure 16 shows cyclic voltammograms for ferrocenemethanol, glycine–ferrocenemethanol, and triglycine–ferrocenemethanol at various sweep rates.
The given CV curves show that the peak potential is most significantly shifted relative to the equilibrium one, which fully corresponds to the proposed model.
The dependences shown in Figure 17 unambiguously indicate that the nature of the peak shift refers to the mass transfer and not to electrochemical polarization. In addition, it is clearly seen that the shift of the peaks increases significantly as the length of the peptide fragment increases, and, consequently, the diffusion coefficient decreases. For a planar electrode, the peak potential shift is enormously smaller than for an array of microelectrodes (Figure 18), while the value itself is comparable with the drift of the silver chloride electrode. The difference between potential shifts obtained from the UME array and planar electrode indicate that using the UME array is more preferable.
The above points to the possibility of using the difference in the shape of the voltammetric curves, in particular the shift of the peak potential, as an analytical signal for the analysis of compounds with different diffusion coefficients and equal redox potentials. Quantification of compounds in a mixture can be of practical interest for analytics. To prove the applicability of the ultramicroelectrode ensemble to the analysis of oligopeptide mixtures, three-factor simulations of mixture systems were performed to study the dependence of changes in the voltammetry peak potential on the concentration ratio of model compounds, their diffusion coefficient ratios, and the potential sweep rate. Since, for ferrocenemethanol and its derivatives, the interelectrode distance of 20 μm proved to be the most advantageous, it was also used in the simulation of the mixture system.
The diffusion coefficient of ferrocenemethanol previously used as a model compound was taken as a starting point: DFeCMeth = 0.74 × 10⁻⁹ m2/s. Other coefficients were counted relative to it: D = x × DFeCMeth. This was required to investigate the presence of a lower molecular weight product (ferrocenemethanol) in a system with a major high molecular weight product with a low diffusion coefficient. The behavior of mixtures containing a high molecular weight product and ferrocenemethanol in ratios of 0.1 to 1, 0.2 to 1, 0.5 to 1, 0.7 to 1, 0.9 to 1, 1 to 1, 2 to 1, 5 to 1, 7 to 1, 9 to 1, and pure compounds was modeled. Dependencies at sweep speeds of 10, 20, 50, 100, 200, 500, and 1000 mV/s were investigated.
The series of voltammetry diagrams of mixtures of substances with different diffusion coefficients obtained by the calculation method show a regular course of the peak potential shift from the ratio of low molecular- and high molecular-weight products (Figure 19).
Dependences of the peak position on the cyclic voltammetry program on the ratio of concentrations of substances with different diffusion coefficients at different sweep speeds were plotted using the model data (Figure 20).
There is a clear shift of the oxidation peak potential toward higher values as the voltammetric curve exhibits a form corresponding more to the stationary behavior. The most dramatic change is characteristic of a system with a ten-fold difference in the diffusion coefficient: as the low molecular weight product is added (i.e., moving from 1 to 0 on the abscissa axis), the peak potential decreases dramatically. As the difference between the diffusion coefficients decreases, the slope of the curves also decreases. Thus, it can be assumed that the more different the diffusion coefficients are, the more obvious the analytical response is when a low molecular weight product is added, and the easier it is to detect.
In addition, we can note an interesting effect that is observed for the substance with the lowest diffusion coefficient at a potential sweep rate of 1000 mV/s. As can be seen from the graph, in this case, the type of dependence is inverted, which can be related to the geometry of the ultramicroelectrode ensemble. Ultramicroelectrodes are formed due to perforations in the resist layer, which leads to deepening of the current-exchange surface. For the effect of the radial diffusion component to manifest itself, the diffusion layer must advance a considerable distance into the space outside the recess. In the case of high sweep speeds, such a situation may not be realized during the recording of the voltammetry program. This assumption is confirmed by the color concentration diagrams constructed by the COMSOL® program (Figure 21).
It can be noted that the diffusion layer in the case of 1000 mV/s sweep rate is more concentrated inside the perforation.
According to the data presented in Figure 20, it is clearly seen that the sweep speed significantly affects the increment of the peak potential when the concentration ratio changes. To quantify this influence, a value of the theoretical detection limit of the “low molecular weight” substance was proposed, which was determined at the signal level equal to the acceptable hourly shift of the potential of the silver chloride reference electrode. In practice, when determining the shift of the peak potential compared to the equilibrium potential, the effect of potential drift will be minimal; here, it was decided to use this value as a conditional value. Its value is 0.12 mV. Dependencies of the theoretical detection limit on the sweep rate for substances with different diffusion coefficients were plotted (Figure 22).
It can be noted that for all presented pairs of substances, the minimum of the detection limit is in the area of the sweep rate of 50 mV/s. In addition, a tendency to a dramatic increase in the detection limit as the diffusion coefficient of the high molecular weight component increases is noticeable.
For the optimal sweep rate of 50 mV/s, a plot of the dependence of the detection limit on the diffusion coefficient was plotted Figure 23.
As can be seen from the graph, the detection limit decreases as the difference in diffusion coefficients increases.
To estimate the diffusion coefficients of mono- and triglycene-ferrocenemethanol, cyclic voltammetry curves obtained on an ensemble of ultramicroelectrodes with a 100 µm inter-electrode distance were used. The distance used is enough to provide a steady-state voltammetry response. The CVs of the solutions of mono- and triglycene derivatives of ferrocenemethanol, as well as of ferrocenemethanol itself, are shown in Figure 24.
Considering that for ultramicroelectrodes functioning in the stationary mode, the thickness of the diffusion layer does not depend on the diffusion coefficient, we can use the direct proportionality of the limiting diffusion current through the ensemble to the diffusion coefficient (Equation (8)):
I l i m = S U M E N U M E n F C D / δ
In this formula, δ is the diffusion layer thickness, SUME is the area of the ultramicroelectrode, and NUME is the number of ultramicroelectrodes. The multiplier can be estimated by knowing the diffusion coefficient of ferrocenemethanol and considering the equality of analyte concentrations (all studied substances were used at a concentration of 1∙10−4 mol/L). In this case, the following expression for the limiting diffusion current can be written for the ensemble of the UME used (Equation (9)):
I l i m = 733.8   ·   D
Now we can estimate, using this equation, the diffusion coefficients of derivatives. For glycyl-ferrocenemethanol and triglycyl-ferrocenemethanol, they are 0.164∙10−9 and 0.046∙10−9, respectively. Their ratio would be 0.28. Knowing the relationship between the diffusion coefficients, we estimate the detection limit of glycyl-ferrocenemethanol in triglycyl-ferrocenemethanol from the approximating curve in Figure 22, which is 3.8%. Considering the decrease in the diffusion coefficient as the peptide chain grows, one can assume lower values of the detection limit of the low molecular weight compound for longer peptide chains.
From the above, the following conclusions can be drawn:
(1) Features of mass transfer in ultramicroelectrode ensembles significantly affect the shape of the curves of substances with different diffusion coefficients.
(2) The smaller the diffusion coefficient, the greater the shift in the shape of the curve towards stationary behavior.
(3) Voltammograms on arrays of ultramicroelectrodes can be used to create a new method for analyzing the composition of mixtures of components with different diffusion coefficients.

4. Conclusions

The proposed concept of the method for electrochemical analysis of oligopeptides by analyzing the change in the course of voltammetric curves found computational and experimental confirmation in the study of the ratio of peak potential shift data as a quantitative indicator of curve shape change. The possibility of using ultramicroelectrode ensembles for analyzing molecules with similar electrochemical properties but with different diffusion coefficients was shown.
The method presented can be adapted for practically important groups of compounds by means, for instance, of modification of active electrode surface with electrocatalytic compounds.
The estimated value of the detection limit of low molecular weight impurity proposed in the work indicates that the method can be used to determine the amount of low molecular weight product impurity, in particular, for solid-phase peptide synthesis. Considering the small size of the ultramicroelectrode ensemble, as well as the successes widely reported in the literature on the miniaturization of potentiostats required for voltammetric experiments, it can be assumed that the equipment required for the method’s realization can be included in the equipment for solid-phase peptide synthesis. Such a variant of application of the method would allow a rapid analysis of the product for the presence of impurities.

Author Contributions

A.Y.A. conceptualization, investigation, project administration, writing—original draft preparation, funding acquisition., A.A.P. conceptualization, investigation, software, visualization, writing—original draft preparation, D.V.N. investigation, methodology, E.S. investigation, methodology, S.O.K. investigation, P.S.V. investigation, methodology, E.G.Z. investigation, writing—review and editing, V.M.S. investigation, data curation, E.E.D. investigation, S.S.E. conceptualization, data curation, A.V. investigation, M.S.M. investigation, A.M.M. investigation, software, methodology. All authors have read and agreed to the published version of the manuscript.

Funding

The study was supported by St. Petersburg State University (ID: 92424770).

Institutional Review Board Statement

Not applicable.

Informed Consent Statement

Not applicable.

Data Availability Statement

Not applicable.

Acknowledgments

We thank the resource centers of St. Petersburg State University Scientific Park: ITKN, “Nanotechnologies”, MASV, “Computer Center of SPbU”, and the staff of the student movement of SPbSU “Project Workshop” for their assistance in this work.

Conflicts of Interest

The authors declare no conflict of interest.

References

  1. Aikens, D.A. Electrochemical Methods, Fundamentals and Applications; ACS Publications: Washington, DC, USA, 1983. [Google Scholar]
  2. Zoski, C.G.; Wijesinghe, M. Electrochemistry at ultramicroelectrode arrays and nanoelectrode ensembles of macro- and ultramicroelectrode dimensions. Isr. J. Chem. 2010, 50, 347–359. [Google Scholar] [CrossRef]
  3. Zhiqiang, G.; Kok, S.S. Ultramicroelectrode ensembles based on self-assembled polymeric monolayers on gold electrodes. Electrochim. Acta 1997, 42, 315–321. [Google Scholar]
  4. Lei, S.; Ying, T.; Tong, S.; Wei, G.; Xueji, Z. Single-walled carbon nanotube ensembles modified gold ultramicroelectrodes prepared by self-assembly deposition method with 1-(1-pyrenyl)-1-methanethiol monolayer as an adhesion layer. Electrochem. Commun. 2012, 20, 163–166. [Google Scholar]
  5. Fernández, J.L.; Wijesinghe, M.; Zoski, C.G. Theory and experiments for voltammetric and SECM investigations and application to orr electrocatalysis at nanoelectrode ensembles of ultramicroelectrode dimensions. Anal. Chem. 2015, 87, 1066–1074. [Google Scholar] [CrossRef]
  6. Fernández, J.L.; Zoski, C.G. Voltammetric and scanning electrochemical microscopy investigations of the hydrogen evolution reaction in acid at nanostructured ensembles of ultramicroelectrode dimensions: Theory and experiment. J. Phys. Chem. C 2018, 122, 71–82. [Google Scholar] [CrossRef]
  7. Ortiz-Ledón, C.A.; Zoski, C.G. Fabrication of glass-insulated ultramicrometer to submicrometer carbon fiber electrodes to support a single nanoparticle and nanoparticle ensembles in electrocatalytic investigations. Anal. Chem. 2018, 90, 12616–12624. [Google Scholar] [CrossRef]
  8. Barham, A.S.; Akhtar, S.; Alkhatab, M.I.; Jaradat, S.Y.; Kennedy, B.M.; El Zein, B. Fabrication of microelectrode ensembles on thin-film single electrodes: The degradation of electropolymerized benzene-1,3-diol films in caustic solutions. Mater. Express 2018, 8, 305–315. [Google Scholar] [CrossRef]
  9. Wang, J.; Bian, C.; Tong, J.; Sun, J.; Li, Y.; Hong, W.; Xia, S. Modification of Graphene on Ultramicroelectrode Array and Its Application in Detection of Dissolved Oxygen. Sensors 2015, 15, 382–393. [Google Scholar] [CrossRef]
  10. Kiran, R.; Rousseau, L.; Lissorgues, G.; Scorsone, E.; Bongrain, A.; Yvert, B.; Picaud, S.; Mailley, P.; Bergonzo, P. Multichannel Boron Doped Nanocrystalline Diamond Ultramicroelectrode Arrays: Design, Fabrication and Characterization. Sensors 2012, 12, 7669–7681. [Google Scholar] [CrossRef]
  11. Miyata, M.; Kitazumi, Y.; Shirai, O.; Kataoka, K.; Kano, K. Diffusion-Limited Biosensing of Dissolved Oxygen by Direct Electron Transfer-Type Bioelectrocatalysis of Multi-Copper Oxidases Immobilized on Porous Gold Microelectrodes. J. Electroanal. Chem. 2020, 860, 113895. [Google Scholar] [CrossRef]
  12. Smirnov, W.; Yang, N.; Hoffmann, R.; Hees, J.; Obloh, H.; Müller-Sebert, W.; Nebel, C.E. Integrated all-diamond ultramicroelectrode arrays: Optimization of faradaic and capacitive currents. Anal. Chem. 2011, 83, 7438–7443. [Google Scholar] [CrossRef] [PubMed]
  13. Arbenin, A.Y.; Zemtsova, E.G.; Ermakov, S.S.; Gaskov, A.M.; Baburova, P.I.; Sokolova, D.N.; Smirnov, V.M. Three-component working electrode micron-sized Ag particles/TiO2 layer/Ti: Template electrochemical synthesis and potential use as electrochemical sensor for glutathione detection. Mater. Res. Express 2020, 7, 035401. [Google Scholar] [CrossRef]
  14. Gomez, H.; Riveros, G.; Ramirez, D. Chronoamperometric Cu (II) Analysis at Gold Ultramicroelectrodes in Concentrated Sulfuric Acid Solutions. Int. J. Electrochem. Sci 2017, 12, 985–993. [Google Scholar] [CrossRef]
  15. Davies, T.J.; Ward-Jones, S.; Banks, C.E.; del Campo, J.; Mas, R.; Muñoz, F.X.; Compton, R.G. The cyclic and linear sweep voltammetry of regular arrays of microdisc electrodes: Fitting of experimental data. J. Electroanal. Chem. 2005, 585, 51–62. [Google Scholar] [CrossRef]
  16. Heinze, J. Ultramicroelectrodes—A new dimension in electrochemistry? Angew. Chem. Int. Ed. Engl. 1991, 30, 170–171. [Google Scholar] [CrossRef]
  17. Guo, J.; Lindner, E. Cyclic voltammetry at shallow recessed microdisc electrode: Theoretical and experimental study. J. Electroanal. Chem. 2009, 629, 180–184. [Google Scholar] [CrossRef] [Green Version]
  18. Shimada, K.; Kato, H.; Saito, T.; Matsuyama, S.; Kinugasa, S. Precise measurement of the self-diffusion coefficient for poly(ethylene glycol) in aqueous solution using uniform oligomers. J. Chem. Phys. 2005, 122, 244914. [Google Scholar] [CrossRef]
  19. Merrifield, R.B. Solid Phase Peptide Synthesis. I. The Synthesis of a Tetrapeptide. J. Am. Chem. Soc. 1963, 85, 2149–2154. [Google Scholar] [CrossRef]
  20. Harfield, J.C.; Batchelor-McAuley, C.; Compton, R.G. Electrochemical determination of glutathione: A review. Analyst 2012, 137, 2285. [Google Scholar] [CrossRef]
  21. Branham, M.L.; Singh, P.; Bisetty, K.; Sabela, M.; Govender, T. Preparation, spectrochemical, and computational analysis of L-carnosine (2-[(3-aminopropanoyl) amino]-3-(1H-imidazol-5-yl) propanoic acid) and its ruthenium (II) coordination complexes in aqueous solution. Molecules 2011, 16, 10269–10291. [Google Scholar] [CrossRef] [Green Version]
  22. Gooding, J.J.; Hibbert, D.B.; Yang, W. Electrochemical metal ion sensors. Exploiting amino acids and peptides as recognition elements. Sensors 2001, 1, 75–90. [Google Scholar]
  23. Galagedera, S.K.K.; Huynh, L.; Wachholz, F.; Jacobsen, M.; Haruehanroengra, P.; Sheng, J.; Flechsig, G.U. Voltammetric Detection of Thrombin by Labeling with Osmium Tetroxide Bipyridine and Binding with Aptamers on a Gold Electrode. Electroanalysis 2018, 30, 398–401. [Google Scholar] [CrossRef]
  24. Wang, S.S. p-Alkoxybenzyl alcohol resin and p-alkoxybenzyloxycarbonylhydrazide resin for solid phase synthesis of protected peptide fragments. J. Am. Chem. Soc. 1973, 95, 1328–1333. [Google Scholar] [CrossRef] [PubMed]
  25. Fields, G.B.; Noble, R.L. Solid phase peptide synthesis utilizing 9-fluorenylmethoxycarbonyl amino acids. Int. J. Pept. Protein Res. 1990, 35, 161–214. [Google Scholar] [CrossRef]
Figure 1. Geometric formulation of the boundary conditions for the model of a hexagonally ordered ensemble of disk ultramicroelectrodes.
Chemosensors 10 00433 g001
Figure 2. Scheme for obtaining microelectrode ensembles.
Chemosensors 10 00433 g002
Figure 3. Scheme of solid phase synthesis of triglycine.
Chemosensors 10 00433 g003
Figure 4. Synthesis of ferrocenemethanol esters by the carbodiimide method.
Chemosensors 10 00433 g004
Figure 5. Dividing the working area of the model into a finite element mesh.
Chemosensors 10 00433 g005
Figure 6. Electron micrographs of the microelectrode ensembles.
Chemosensors 10 00433 g006
Figure 7. ESI MS of triglycine ferrocenemethanol ether.
Chemosensors 10 00433 g007
Figure 8. ESI MS glycyl ferrocenemethanol.
Chemosensors 10 00433 g008
Figure 9. Series of current–voltage curves at different distances between the electrodes in the ensemble and different diffusion coefficients of analytes. (A,C): D = 7.4∙10−9; (B,D): D = 7.4∙10−10. (A,B): scan rate 10 mV/s; (C,D): scan rate 100 mV/s.
Chemosensors 10 00433 g009
Figure 10. Values of the stationarity parameters of curves with different interelectrode distances in the ensemble.
Chemosensors 10 00433 g010
Figure 11. Dependence of the potential shift on the diffusion coefficient for an ensemble with an interelectrode distance of 20 µm and a sweep rate of 1000 mV/s.
Chemosensors 10 00433 g011
Figure 12. CV of an ensemble with an interelectrode distance of 20 µm at various sweep rates.
Chemosensors 10 00433 g012
Figure 13. Experimental current–voltage curves of ferrocenemethanol.
Chemosensors 10 00433 g013
Figure 14. Theoretical and experimental CV curves of ferrocenemethanol.
Chemosensors 10 00433 g014
Figure 15. Comparison of experimental data on the shift of the ferrocenemethanol peak potential with a sweep rate change.
Chemosensors 10 00433 g015
Figure 16. Experimentally obtained cyclic voltammograms of ferrocenemethanol and its esters with glycine and triglycine.
Chemosensors 10 00433 g016
Figure 17. Peak potential shift as a function of sweep rate for ferrocenemethanol and its esters with glycine and triglycine.
Chemosensors 10 00433 g017
Figure 18. Peak potential shift of triglycine ferrocenemethanol ester calculated from CV measured in the microelectrode ensemble (inter-electrode distance 20 μm) and planar gold electrode.
Chemosensors 10 00433 g018
Figure 19. Cyclic voltammetry of mixtures with different ratios of substances with diffusion coefficients differing by a factor of 10. Ultramicroelectrode ensemble 20 µm, sweep rate 10 mV/s.
Chemosensors 10 00433 g019
Figure 20. The dependence of the oxidation peak potential on the fraction of a high molecular weight compound for different sweep rates: (A)—DHMWC = 0.1 × DFeCMeth, (B)—DHMWC = 0.2 × DFeCMeth, (C)—DHMWC = 0.5 × DFeCMeth, (D)—DHMWC = 0.7 × DFeCMeth.
Chemosensors 10 00433 g020
Figure 21. Color diagrams of the near-electrode area concentration at the moment of reaching the end of the first branch of the voltammetric waveform for sweep speeds of 100 (A) and 1000 (B) mV/s.
Chemosensors 10 00433 g021
Figure 22. Dependence of the theoretical detection limit of a low molecular weight substance on the sweep rate for pairs of substances with different diffusion coefficient ratios.
Chemosensors 10 00433 g022
Figure 23. The dependence of the theoretical detection limit of a low molecular weight product in a mixture on the diffusion coefficient of a high molecular weight component.
Chemosensors 10 00433 g023
Figure 24. Cyclic voltammetry of ferrocenemethanol and its derivatives obtained with an ultramicroelectrode ensemble with inter-electrode distance 100 µm.
Chemosensors 10 00433 g024
Publisher’s Note: MDPI stays neutral with regard to jurisdictional claims in published maps and institutional affiliations.

