Abstract
The acquisition of nutrient data on a precise scale has played a vital role in nutrient management processes for soils. However, the lack of rapid precise and multi-index detection techniques for soil macronutrient contents hinders both rational fertilization and cost reduction. In this paper, a rapid detection method and device were devised, combining capillary electrophoresis (CE) and capacitively coupled contactless conductivity detection (C4D), and presented to detect macronutrient contents of soil. The device consisted of a capillary channel, C4D detector, high-voltage system, etc. It separated macronutrient ions using capillary electrophoresis and then measured the ion concentration based on the C4D principle. Lime concretion black soil samples from a complete field were collected and detected. NO3−, NH4+, H2PO4− and K+ in sample solutions could be detected in 5 min with relative standard deviations (RSDs) from 1.0 to 7.51%. The injection voltage was set to 10 kV for 5 s, and the separation voltage was set to 14 kV. This demonstrated the excellent performance of the C4D device on the detection of soil macronutrients, which could help to guide fertilization operations more effectively.
1. Introduction
Commonly, soil macronutrient (N, P and K) management has generally been tailored, to the extent possible, on a scale of tens of hectares [1]. Inevitably, the common broad distribution of fertilizers ultimately leads to under- and overapplication, with the former lowering optimal crop yields and the latter being a detriment to the surrounding ecosystems and creating unnecessarily high input costs. As a result, aiming at achieving the growth in crop yield and reducing polluting emissions, it has become urgent to monitor the fertility of soils on a more precise scale in time and space. Only through thorough understanding of soil fertility on a more precise scale could a reasonable local fertilization strategy be formulated, leading to the reduction of pollution and the improvement of agricultural efficiency.
The availability of soil macronutrients N, P and K in the ionic form of NO3−, NH4+, H2PO4− and K+ was deemed to be of special interest [2], as these ions are directly available for plant roots. Traditional soil detection methods have mainly relied on laboratory testing, which requires complicated and long-term pretreatment processes and large, expensive soil sample testing instruments. To satisfy detection requirements, it was essential to simultaneously adopt several large soil testing instruments, e.g., atomic absorption spectrometers, nitrogen analyzers or ultraviolet spectrometers. These require specialized sites and professional operators [3]. This can lead to complex and time-consuming detection procedures and can also result in secondary pollution to the environment—especially in regions with low density and imperfect laboratory infrastructure. As a consequence, new techniques are urgently needed for rapid precise and multi-index detection of macronutrient contents that can be used on-site to make up for the shortcomings of standard laboratory methods.
Visible–near-infrared spectroscopy (VIS/NIRS, 380~2500 nm) is a physical nondestructive and rapid analytical technique that can provide a prediction of soil chemical properties [4,5]. R. A. Rossel et al. proposed spectral techniques for measuring P, N and carbon (C) in the environment and for assessing the fate and transport of these nutrients in Kelso, NSW, Australia [6]. Y. He et al. demonstrated that near-infrared spectroscopy (NIRS) had the potential to predict N and C with r 0.93 and 0.93 in soil in Hangzhou, Zhejiang Province, but found it hard to predict accurately P and K with r 0.47 and 0.68 [7]. Moreover, this method was highly dependent on the accuracy of the specialized prediction model, which required a large number of samples to be collected for model training and optimization.
Ion-selective electrodes (ISEs), which introduce specific ion-selective membranes and can convert the activity of a specific ion into an electrical signal, were adopted to directly measure in the soil extract [8]. Artigas et al. optimized the electrode membrane materials and obtained measurement results for potassium ions and nitrate ions [9]. ISEs, which are needed to design and optimize ion-selective membranes and electrodes for different ions, rely on specific ion-selective membranes that may degrade over time or may not even be available for certain ions (e.g., for H2PO4−). In addition, the interfering ions would also affect the measuring results of ISEs in the complex soil extract. At present, some excellent work has been reported on the relationship between microstructure and electrochemical properties [10,11,12], which has the potential to improve the sensitivity and anti-interference ability of ISEs. M. Sabzi et al. systematically investigated the microstructure and electrochemical responses, including silver oxide nanoparticles by carbon [13], Al2O3 ceramic film [14] and NiO-TiO2 film [15]. In summary, at the time of this work, a universal device for rapid precise and multi-index detection of soil macronutrients is still missing.
Capacitively coupled contactless conductivity detection (C4D), which has the characteristic of no contact between the electrode and the test solution, has received considerable attention as an alternative detection method in capillary electrophoresis (CE) [16,17]. Due to its robustness, minimal maintenance demands and low cost [18,19], the popularity of this detector has been steadily growing for the detection of inorganic ions, organic and biochemical species in complex matrices such as rainwater [20], serum and hemodialysis fluid and seawater [21]. Considering the complexity and detection range of soil extract, at present, only a small number of research teams have been developing C4D instruments for the detection of soil macronutrients. Z. Xu et al. reported a microfluidic electrophoretic sensor system capable of separating and quantifying inorganic anions (N and P) of soil solution samples [22]. M. Smolka et al. presented a mobile electrophoresis microchip C4D sensor device for on-site analysis of soil sample extracts [2]. However, the extracted amount of H2PO4− was not sufficient for quantification with the sensor, owing to the low sensitivity and detection range of the sensor. The major challenge of a C4D sensor for the detection of soil macronutrients has been to develop a C4D sensor with the appropriate detection range to achieve precise and multi-index detections in soil extraction.
To detect macronutrient contents of lime concretion black soil, this paper presents an on-site rapid detection device for the detection of soil macronutrients. The detection device combined capillary electrophoresis and the C4D method to measure the concentration of NO3−, NH4+, H2PO4− and K+ in the soil extract. Compared to microchips, the capillary electrophoresis instrument was more suitable for improving the detection range to detect soil macronutrients. The lime concretion black soil—the largest mid- and low-yield soil at the present time in China [23,24]—exhibited poor soil fertility, unstable production performances and great annual fluctuations in crop output. To prove the validity of the C4D device, detection was performed on lime concretion black soil samples.
2. Materials and Methods
2.1. Principle of C4D
To achieve high-sensitivity detection, the C4D detector was applied for high-precision measurement of ion concentration. The schematic diagram of the C4D detector is shown in Figure 1; it consisted of an excitation circuit, a receiving circuit and two tubular ring electrodes attached to the surface of the capillary. The detection cell was placed in an aluminum shell to shield against external electromagnetic interference. The equivalent circuit of the detection cell consisted of a resistor (R stands for the ohmic resistance of the solution in the capillary section) and capacitors (C1 and C2 were the wall capacitance of the capillary). When a sinusoidal AC voltage Us was generated by the excitation circuit and applied to an electrode, an AC current Ia could be measured by the receiving circuit at the other electrode. As the frequency of Us increased, the influence of C1 and C2 could be ignored. The conductivity of the solution could be calculated by the formula: K = Q × Ia/Us (Q is a constant related to the detection cell). As the conductivity was sensitive to all charged sample components, the concentration of ions could be accurately obtained by measuring Ia. Due to noncontact between the electrodes and the sample solution, the C4D detector had the characteristics of high stability and long service life.
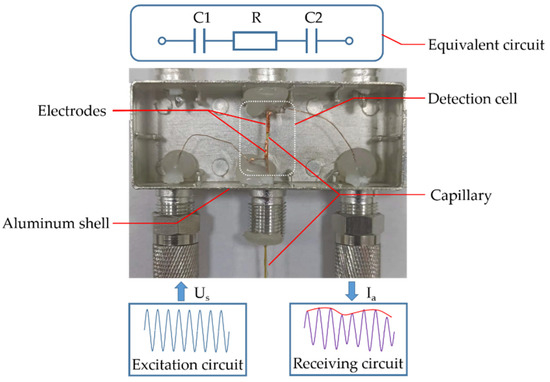
Figure 1.
Schematic diagram of C4D detector.
2.2. Excitation Circuit and Receiving Circuit of C4D
The excitation circuit generated a sinusoidal excitation AC voltage Us, as shown in Figure 2a. Increasing the amplitude and reducing the total harmonic distortion (THD) of Us could contribute to improving the output signal-to-noise ratio of the C4D detector. The traditional laboratory method applied a signal transmitter and a commercial high-voltage signal amplifier in combination. However, the equipment was large in size and complicated in operation, which made it inconvenient to use on-site. In our method, a high-resolution direct digital synthesis (DDS) chip was adopted to synthesize a low-voltage sinusoidal signal Ue with lower distortion and better stability. The amplifier A1 and resistors R1 and R2 composed an inverting amplifier for voltage amplification. A2 was a buffer amplifier with a gain of 1 for current amplification. T1 was a high-frequency transformer with a ratio of 1:20. The working frequency range of the T1 was limited to 10 KHz–1 MHz to reduce the harmonic noise. By optimizing the parameters of the excitation circuit, the amplitude of Us could finally reach 400 V. The THD was less than 0.8%, which could meet the requirements of nutrient ion detection.
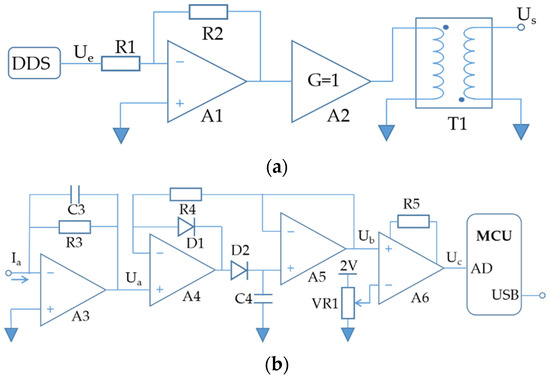
Figure 2.
Schematic diagram of (a) excitation circuit and (b) receiving circuit.
Ia reflected the ion concentration in the solution, which was a weak AC current. The receiving circuit converted the Ia to the C4D signal and uploaded it to the computer for recording and analysis. As shown in Figure 2b, the Ia was first converted into an AC voltage Ua by the transimpedance amplifier circuit, which consisted of A3, R3 and C3. A3 was a high-input impedance FET op-amp, which could reduce the interference caused by bias current and resistance thermal noise. The peak detection circuit converted Ua to DC voltage Ub, which consisted of A4, A5, D1, D2, C4 and R4. Ub contained a background voltage caused by the conductivity of the buffer solution, which would reduce the range of the C4D detector. The zero-adjustment circuit could eliminate the background voltage in Ub, which consisted of an instrument amplifier A6, R5 and VR1. The microcontroller (MCU) periodically collected Uc through the AD port and sent C4D signals to the computer through the USB port. The receiving circuit was able to realize the measurement of nanoampere current with frequency below 1MHz, which made the C4D detector highly sensitive to low-concentration ions in solution.
2.3. High-Voltage System
The high-voltage system had two functions: sample injection and capillary electrophoresis. The system was divided into three modules (boost module, control module, output module), as shown in Figure 3. The boost module contained a multi-voltage rectifier circuit, which could magnify voltage amplification by several hundred times. The control module was the core of the system and was composed of a controller, a touch screen and an interface circuit. On the one hand, the controller could be programmed to set the gain of the boost module according to the user’s settings on the touch screen. On the other hand, the control module monitored the actual output voltage of the boost module and corrected the set value to ensure the accuracy of high-voltage systems. In the lab, each module was powered by a switching power supply. When the device was used in the field, the high-voltage system was powered by a lithium battery. The high-voltage connector was used for the connection of the high-voltage system with the capillary. The output module was placed between the high-voltage connector and the boost module. It contained high-voltage switches, which could realize automatic switching of positive and negative voltages and high-precision timing output. The performance parameters of the high-voltage system were as follows: (1) the output voltage was adjustable from −15 kV to 15 kV; (2) the output voltage ripple was less than 0.05%; (3) the timing accuracy was 1 ms, which could ensure the stability of the electrophoresis process and the accuracy of the injection volume; (4) low power consumption, meaning that the system could run for more than 8 h on battery power.
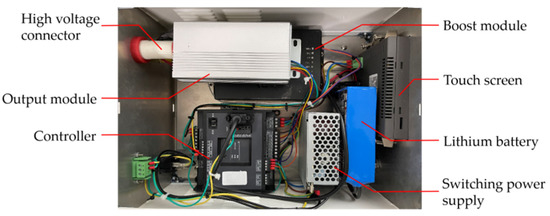
Figure 3.
High-voltage system structure diagram.
2.4. Instruments and Reagents
The proposed rapid soil macronutrient detection device, which consisted of three parts (capillary device with C4D detector, high-voltage system and laptop), is shown in Figure 4a. The capillary device was equipped with a fused quartz capillary with 35 cm length and 50 µm inner diameters. The high-voltage system could be configured and operated on a touch screen. The C4D detection cell was located near the end of the capillary. The C4D detector with the excitation circuit and the receiving circuit was connected to the C4D detection cell by coaxial cable, as shown in Figure 4b. The excitation circuit was composed of a DDS circuit, inverting amplifier, current amplifier and high-frequency transformer. The receiving circuit was composed of transimpedance amplifier, peak detection circuit, zero adjustment circuit and microcontroller. The microcontroller sent C4D signals to the laptop via a USB cable. The analysis software running on the laptop recorded the data and calculated the contents of soil macronutrient ions.
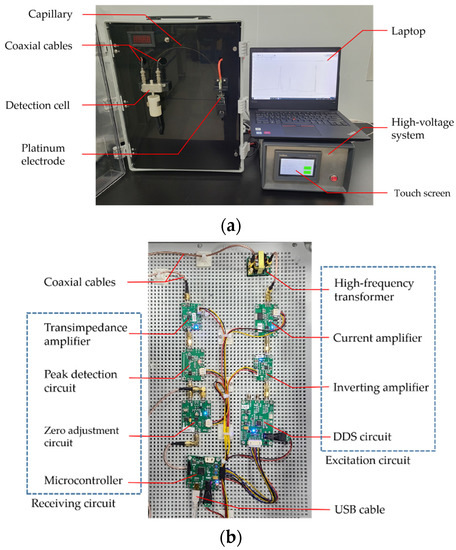
Figure 4.
Images of (a) rapid soil macronutrient detection device and (b) C4D circuit.
All chemicals were of analytical pure grade, and all chemical solutions were prepared with deionized water with resistivity of 18.25 mΩ·cm−1 from an ultrapure water system (AWL−100-M, Chongqing Yiyang Enterprise Development Co., Ltd., Chongqing, China). Standard solutions of NO3−, NH4+, H2PO4− and K+ with 1000 μg/mL were purchased from Guobiao (Beijing) Testing & Certification Co., Ltd. (Beijing, China). Different concentrations of standard solutions of NO3−, NH4+, H2PO4− and K+ were prepared to evaluate the ability of the device to quantify ion concentrations.
The pTAE buffer solution was first prepared with 3.03 g Tris(hydroxymethyl)methyl aminomethane (Tris), 0.18 g ethylene diamine tetraacetic acid (EDTA) and 0.3 mL acetic acid dissolved in 50 mL deionized water. The electrophoresis cationic buffer solution was prepared with 2 mL pTAE buffer solution and 0.6 g polyvinyl pyrrolidone (PVP) dissolved in 100 mL deionized water. The buffer solution for phosphate detection was prepared with 0.026 mol/L acetic acid. The buffer solution for nitrate detection was prepared with 4.65 g/L DL-histidine (His) and 0.426 g 2-(N-morpholino)ethanesulfonic acid (Mes) in 50 mL deionized water.
2.5. Sampling and Soil Sample Preparation
In the present study, lime concretion black soil samples were collected from Long Kang farm, Anhui Province, China. Twenty-four topsoil samples were collected in an S-type sampling way, which was 15~20 cm below the earth’s surface. A total of 1000 g of each soil sample was collected, then naturally air-dried and sieved less than 1 mm.
Additionally, 3 g of air-dried soil was weighed in a specimen cup. Then, 30 mL of deionized water was added to the specimen cup and shaken on a reciprocal shaker for 30 min. After shaking, the solution was filtered using 150 mm quantitative filter paper and syringe filter (0.45 µm/25 mm) (Sangon Biotech (Shanghai, China) Co., Ltd.). The filtrates were collected and stored at 4 °C until taken out for injection into the device.
2.6. Measuring Procedure
Both ends of the capillary tube and platinum electrodes were cleaned with deionized water. The capillary channel was cleaned with sodium hydroxide solution, deionized water and electrophoresis buffer solution for 5 min each. After rinsing, the two ends of the capillary were completely immersed in the electrophoresis buffer solution in the detection tank and storage bottle.
The collected data were recorded by the data collection software for 4 min after the high-voltage power supply. If the baseline was stable, injection mode could be prepared. The soil sample solution was moved to the position of the capillary injection port. The injection voltage was set to 10 kV for 5 s. The electric injection procedure of the instrument was then begun.
The electrophoresis voltage was set to +14 kV for potassium ion and ammonium ion detection. Meanwhile, the electrophoresis cationic buffer solution was applied to simultaneously detect potassium ions and ammonium ions. For nitrate ion and phosphate ion detection, the electrophoresis voltage was set to −14 kV. The buffer solution for phosphate detection was used to detect phosphate ions. The buffer solution for nitrate detection was used to detect nitrate ions. The sample volume was 2 mL.
3. Results and Discussion
3.1. Soil Sample Ion Separation
An extracted soil sample solution with three kinds of electrophoresis buffer solutions was tested. Typical measurement results of the electrophoretic analysis with C4D detection are presented in Figure 5. Each ion peak of the extracted soil sample solution could be clearly separated. The peaks of four kinds of soil macronutrient ions are highlighted with their labels in Figure 5. The target ion peaks were identified according to standard addition method. By comparing the significant differences of peak areas before and after adding the standard solution of single ions, the target ion peak could be easily identified. The corresponding cation curve contained peaks of potassium ions and ammonium ions. The detection times were all less than 6 min. The peak of potassium ions appeared at 2.58 min followed by the peak of ammonium ions at 2.97 min. The second peak, which appeared at 4.15 min, was the peak of nitrate ions, as shown in Figure 5b. In consideration of the significance of phosphate ions and their low sensitivity and low electrophoretic mobility on His/Mes buffer solution (Smolka et al., 2017 [2]) with very low conductivity (da Silva et al., 2010 [25]), an acetic acid solution of low concentration was introduced to the measured phosphate ions. The individual peak of phosphate ions appeared at 2.93 min. Consequently, the detection sensitivity of phosphate ions in the extracted soil sample solution was effectively improved in this work. These electrophoretic analysis results of the extracted soil sample solution show excellent test parameters.
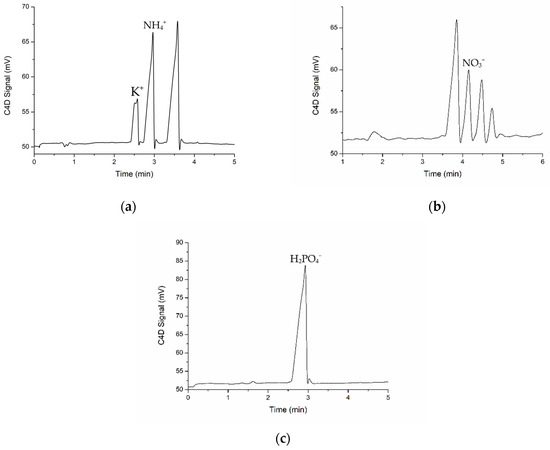
Figure 5.
Electrophoretic electropherograms of a soil sample with peaks of (a) K+ and NH4+, (b) NO3− and (c) H2PO4− with C4D detection.
3.2. Determination of Standard Concentration of Single Ion
To investigate the analytical performance of C4D on four kinds of macronutrient ions in electrophoresis buffer solutions, standard solutions of single ions were used to measure the reproducibility. All these measurements were considered in subsequent evaluations. The peak areas in each electropherogram were acquired, and the performances of the detection device were evaluated for each ion. In view of the C4D signal response and ranges of ions in the extracted soil sample solution, the standard concentrations of four kinds of ions showed differences. The standard concentrations of potassium ions were 0.1 mg/L, 0.25 mg/L, 0.5 mg/L, 1 mg/L, 2 mg/L, 2.5 mg/L and 3 mg/L. The standard concentrations of ammonium ions were 20 μg/L, 50 μg/L, 100 μg/L, 200 μg/L, 250 μg/L, 300 μg/L and 500 μg/L. The standard concentrations of nitrate ions were 0.1 mg/L, 0.2 mg/L, 0.5 mg/L, 1 mg/L, 2 mg/L, 3 mg/L, 5 mg/L and 10 mg/L. The standard concentrations of phosphate ions were 0.1 mg/L, 0.2 mg/L, 0.5 mg/L, 1 mg/L, 1.5 mg/L and 2 mg/L.
The results (Figure 6) show that the peak area of each ion was positively correlated with the solution concentration, which meant that the larger the concentration, the larger the peak area. The repeatability of analysis was evaluated by relative standard deviations (%RSD) of peak areas. The peak area repeatability of each ion was determined by performing repeat analyses of the same sample using a standard protocol. The RSD for peak area was determined to be 0.45–5.88% for four kinds of macronutrient ion solutions with standard concentrations. These values demonstrated the excellent repeatability and analytical performance of the C4D for quantitative analysis.
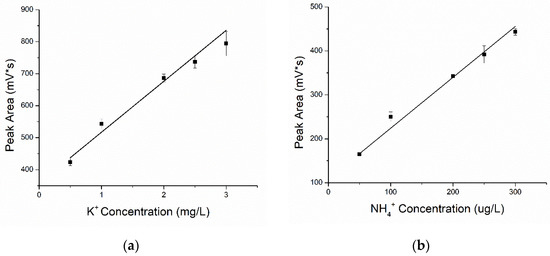
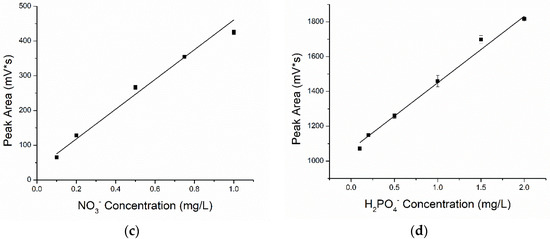
Figure 6.
The fit curves for the four kinds of macronutrient ions: (a) K+, (b) NH4+, (c) NO3− and (d) H2PO4−.
The fitting curves of the concentration and peak area of the four different kinds of ions are shown in Figure 6. The function of curves and correlation coefficients were respectively expressed as:
potassium ion: y = 357.854 + 159.193x, R2 = 0.974,
ammonium ion: y = 108.359 + 1.157x, R2 = 0.996,
nitrate ion: y = 32.455 + 427.914x, R2 = 0.992,
phosphate ion: y = 1067.090 + 382.396x, R2 = 0.993.
The value of R2 greater than 0.97 indicated good fitting (between concentration and peak area). Furthermore, the fitting curve of phosphate ions was observed to be linear, while the peak area of the other three ions grew slowly, and the trend of curves grew flat when the concentration reached a certain value. Owing to the ionic conductivities and total amount of injected ions at a certain injection voltage and time, sample ions at high concentrations did not always show linear fit results. New injection methods, rather than electric injection, will be considered in future works.
3.3. Soil Macronutrient Analysis
For the quantitative analysis of four kinds of macronutrient ions in the extracted soil sample solutions, a quantitative method was introduced. In this method, an electrophoresis analysis was carried out after a small amount (0.1 mL) of a high-concentration ion standard solution (C0 = 10 mg/L) was added to the sample at the end of the test.
Figure 7 illustrates the electropherograms of phosphate in a soil extract sample before and after the addition of a high-concentration ion standard solution. From Figure 7, the peak area was significantly improved after the addition of a high-concentration ion standard solution. By comparing the peak areas of addition (or not), we obtained the final ion concentration (Ct) in the sample according to the following formula:
where the volumes of solutions before and after the addition of a high-concentration ion standard solution were V1 mL and V2 mL, respectively. The electrophoresis peak areas before and after the addition of a high-concentration ion standard solution were S1 and S2.
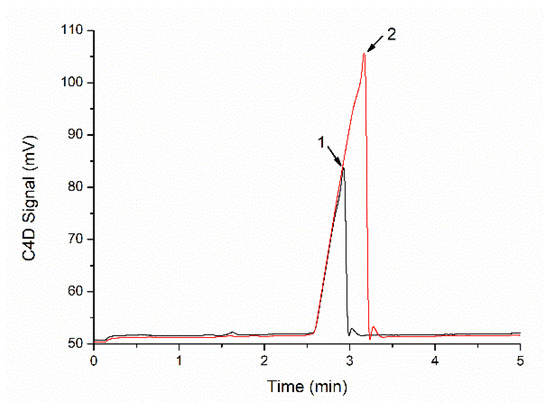
Figure 7.
Electropherograms of phosphate in a soil extract sample before (1, black line) and after (2, red line) the addition of high-concentration ion standard solution.
Furthermore, the contents of four kinds of soil macronutrients were obtained according to the following formula:
Soil macronutrients contents = 10 × Ct.
Additionally, three lime concretion black soil samples were randomly picked for macronutrient measurement a total of three times. The RSD (n = 3) for the detections ranged from 1.0 to 7.51% (Table 1), which demonstrated good repeatability.

Table 1.
Detection results of 3 lime concretion black soil samples macronutrients.
Table 2 shows the macronutrient measurements of 24 lime concretion black soil samples in a complete field. Figure 8 shows the content distributions of the four macronutrients in this field. These spatially continuous distribution maps of soil macronutrients were generated based on the interpolation of known nutrient data, a prediction method and coordinate locations of 24 soil samples in Table 2. The prediction method was realized by using the sample data around the unmeasured points and the weight value, in which the sample point closest to the predicted position was assigned a larger weight. According to the weight value of different soil sample points, the soil nutrient data of all unmeasured points in the target area were calculated to form the distribution map of soil nutrients. The results prove that the contents of the four macronutrients varied greatly in the same field. Therefore, the C4D device will help to measure the macronutrients of lime concretion black soil on a more precise scale and guide fertilization operations more effectively.

Table 2.
Macronutrient contents of 24 lime concretion black soil samples (mg·kg−1).
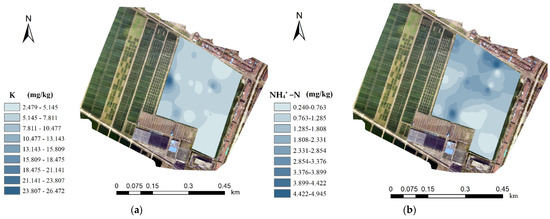
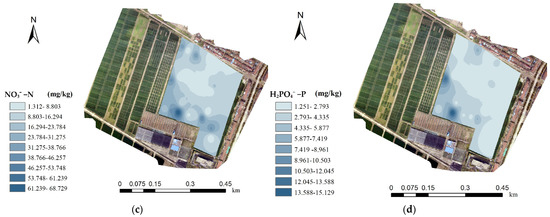
Figure 8.
The content distributions of the four macronutrients: (a) K, (b) NH4+ −N, (c) NO3− −N and (d) H2PO4− −P in this field.
4. Conclusions
The lack of rapid precise and multi-index detection techniques for soil macronutrient contents has hindered rational fertilization on a precise scale. To address this problem, this paper presented a rapid detection device, which combined capillary electrophoresis and the C4D method to achieve the detection of four soil macronutrient contents. The obtained results in this study are as follows:
The rapid detection device (including a high-sensitivity C4D detector and a high-performance high-voltage system that could be used on-site) was designed. A high-resolution DDS chip and a high-frequency transformer were adopted in the C4D detector to improve the sensitivity of macronutrient detection. The high-voltage system was battery-operated, modular-designed and highly integrated, making it suitable for on-site use and meeting measurement requirements for soil macronutrients.
The standard solutions of single ions were measured to investigate the analytical performance of C4D. The RSD was determined to be 0.45–5.88% for four kinds of macronutrient ion solutions with standard concentrations, which demonstrated the excellent repeatability and analytical performance of the C4D for quantitative analysis.
A total of 24 topsoil lime concretion black soil samples from a complete field were collected and extracted by deionized water. NO3−, NH4+, H2PO4− and K+ in soil extract solutions could be separated well and detected in 5 min with three kinds of electrophoresis buffer solutions, with the injection voltage set to 10 kV for 5 s and the separation voltage set to 14 kV. According to the electrophoresis peak areas, the contents of four kinds of soil macronutrients were obtained, and the RSD values of these soil samples ranged from 1.0% to 7.51%. This demonstrated the excellent performance of the C4D device in the detection of lime concretion black soil.
By detection of soil samples from a complete field, the content distributions of the four macronutrients in a plot were proven to vary greatly, especially NO3−, H2PO4− and K+. The C4D device proposed in this paper will help to measure the macronutrients of lime concretion black soil on a more precise scale and guide fertilization operations more effectively. Moreover, the C4D device will also be extended to other types of soil detections. See Supplementary Materials.
Supplementary Materials
The following supporting information can be downloaded at: https://www.mdpi.com/article/10.3390/chemosensors10020084/s1, Figure S1. Schematic diagram of the device.
Author Contributions
Conceptualization, X.C. and R.W.; methodology, J.Z., H.G. and Y.C.; software, Z.J.; validation, Y.L., J.C. and M.L.; formal analysis, J.Z.; investigation, J.Z. and M.L.; resources, R.W.; data curation, X.C.; writing—original draft preparation, X.C. and J.Z.; writing—review and editing, R.W. and X.C.; project administration, X.C.; funding acquisition, R.W. and X.C. All authors have read and agreed to the published version of the manuscript.
Funding
This research was funded by the National Key Research and Development Program of China, grant number 2021YFD2000204, the Youth Foundation of the Natural Science Foundation of Anhui Province, grant number 1908085QE202, and the Dean Foundation of Hefei Institutes of Physical Science, Chinese Academy of Sciences, grant numbers YZJJ2019QN14, YZJJ2020QN19.
Institutional Review Board Statement
Not applicable.
Informed Consent Statement
Not applicable.
Data Availability Statement
Not applicable.
Conflicts of Interest
The authors declare no conflict of interest.
References
- Lund, E.D.; Wolcott, M.C.; Hanson, G.P. Applying nitrogen site-specifically using soil electrical conductivity maps and precision agriculture technology. Sci. World J. 2001, 1 (Suppl. S2), 767–776. [Google Scholar] [CrossRef] [PubMed] [Green Version]
- Smolka, M.; Puchberger-Enengl, D.; Bipoun, M.; Klasa, A.; Kiczkajlo, M.; Smiechowski, W.; Sowinski, P.; Krutzler, C.; Keplinger, F.; Vellekoop, M.J. A mobile lab-on-a-chip device for on-site soil nutrient analysis. Precis. Agric. 2017, 18, 152–168. [Google Scholar] [CrossRef]
- Yubing, W.; Huang, H.; Chen, X. Predicting organic matter content, total nitrogen and ph value of lime concretion black soil based on visible and near infrared spectroscopy. Eurasian Soil Sci. 2021, 54, 1681–1688. [Google Scholar] [CrossRef]
- Cambule, A.H.; Rossiter, D.G.; Stoorvogel, J.J.; Smaling, E.M.A. Building a near infrared spectral library for soil organic carbon estimation in the limpopo national park, mozambique. Geoderma 2012, 183, 41–48. [Google Scholar] [CrossRef]
- Lin, Z.; Wang, R.; Wang, Y.; Wang, L.; Lu, C.; Liu, Y.; Zhang, Z.; Zhu, L. Accurate and rapid detection of soil and fertilizer properties based on visible/near-infrared spectroscopy. Appl. Opt. 2018, 57, D69–D73. [Google Scholar] [CrossRef] [PubMed]
- Rossel, R.A.V.; Mcglynn, R.N.; Mcbratney, A.B. Determining the composition of mineral-organic mixes using uv–vis–nir diffuse reflectance spectroscopy. Geoderma 2006, 137, 70–82. [Google Scholar] [CrossRef]
- He, Y.; Huang, M.; Annia, G.; Antihus, H.; Song, H. Prediction of soil macronutrients content using near-infrared spectroscopy. Comput. Electron. Agric. 2007, 58, 144–153. [Google Scholar] [CrossRef]
- Shaw, R.; Williams, A.P.; Miller, A.; Jones, D.L. Assessing the potential for ion selective electrodes and dual wavelength uv spectroscopy as a rapid on-farm measurement of soil nitrate concentration. Agriculture 2013, 3, 327–341. [Google Scholar] [CrossRef] [Green Version]
- Artigas, J.; Beltran, A.; Jiménez, C.; Baldi, A.; Mas, R.; Domínguez, C.; Alonso, J. Application of ion sensitive field effect transistor based sensors to soil analysis. Comput. Electron. Agric. 2001, 31, 281–293. [Google Scholar] [CrossRef]
- Dezfuli, S.M.; Sabzi, M. Deposition of self-healing thin films by the sol–gel method: A review of layer-deposition mechanisms and activation of self-healing mechanisms. Appl. Phys. A 2019, 125, 557. [Google Scholar] [CrossRef]
- Dezfuli, S.M.; Sabzi, M. Deposition of ceramic nanocomposite coatings by electroplating process: A review of layer-deposition mechanisms and effective parameters on the formation of the coating. Ceram. Int. 2019, 45, 21835–21842. [Google Scholar] [CrossRef]
- Mousavi Anijdan, S.H.; Sabzi, M.; Asadian, M.; Jafarian, H.R. Effect of sub-layer temperature during hfcvd process on morphology and corrosion behavior of tungsten carbide coating. Int. J. Appl. Ceram. Technol. 2019, 16, 243–253. [Google Scholar] [CrossRef] [Green Version]
- Sabzi, M.; Mersagh Dezfuli, S. A study on the effect of compositing silver oxide nanoparticles by carbon on the electrochemical behavior and electronic properties of zinc-silver oxide batteries. Int. J. Appl. Ceram. Technol. 2018, 15, 1446–1458. [Google Scholar] [CrossRef]
- Sabzi, M.; Mersagh Dezfuli, S. Deposition of al2o3 ceramic film on copper-based heterostructured coatings by aluminizing process: Study of the electrochemical responses and corrosion mechanism of the coating. Int. J. Appl. Ceram. Technol. 2019, 16, 195–210. [Google Scholar] [CrossRef] [Green Version]
- Sabzi, M.; Anijdan, S.M. Microstructural analysis and optical properties evaluation of sol-gel heterostructured nio-tio2 film used for solar panels. Ceram. Int. 2019, 45, 3250–3255. [Google Scholar] [CrossRef]
- Revelou, P.-K.; Xagoraris, M.; Alissandrakis, E.; Pappas, C.S.; Tarantilis, P.A. A review of the analytical methods for the determination of 4(5)-methylimidazole in food matrices. Chemosensors 2021, 9, 322. [Google Scholar] [CrossRef]
- Ryvolová, M.; Macka, M.; Ryvolová, M.; Preisler, J.; Macka, M. Portable capillary-based (non-chip) capillary electrophoresis. TrAC Trends Anal. Chem. 2010, 29, 339–353. [Google Scholar] [CrossRef] [Green Version]
- Kuban, P.; Hauser, P.C. Contactless conductivity detection for analytical techniques developments from 2014 to 2016. Electrophoresis 2017, 38, 95–114. [Google Scholar] [CrossRef]
- Ribeiro, M.M.A.C.; Freitas, J.M.; Munoz, R.A.A.; do Lago, C.L.; Richter, E.M. Fast determination of diphenhydramine, pyridoxine, and 8-chlorotheophylline by capillary electrophoresis with capacitively coupled contactless conductivity detection. Anal. Methods-Uk 2016, 8, 4432–4437. [Google Scholar] [CrossRef]
- Rocha, F.R.; Fracassi, D.; Lago, C.L.; Fornaro, A.; Gutz, I. Wet deposition and related atmospheric chemistry in the so paulo metropolis, brazil: Part 1. Major inorganic ions in rainwater as evaluated by capillary electrophoresis with contactless conductivity detection. Atmos. Environ. 2003, 37, 105–115. [Google Scholar] [CrossRef]
- Brito-Neto, J.G.A.; da Silva, J.A.F.; Blanes, L.; do Lago, C.L. Understanding capacitively coupled contactless conductivity detection in capillary and microchip electrophoresis. Part 1. Fundamentals. Electroanal 2005, 17, 1198–1206. [Google Scholar] [CrossRef]
- Xu, Z.; Wang, X.; Weber, R.J.; Kumar, R.; Dong, L. Nutrient sensing using chip scale electrophoresis and in situ soil solution extraction. IEEE Sens. J. 2017, 17, 4330–4339. [Google Scholar] [CrossRef]
- Li, L.J.; Guo, X.S.; Wang, D.Z.; Sun, Y.X.; Wu, P.P. State and spatial variability of nutrient of lime concretion black soil in huaibei plain. J. Anhui Agric. Ences 2006, 34, 722–723. [Google Scholar]
- Yuan, Z. Countermeasures of mengcheng sand ginger black soil improvement and quality promotion. Ningxia J. Agric. For. Sci. Technol. 2013, 54, 50–51. [Google Scholar]
- da Silva, J.A.F.; de Castro, N.V.; de Jesus, D.P.; Faria, A.F.; De Souza, M.V.N.; de Oliveira, M.A.L. Fast determination of ethambutol in pharmaceutical formulations using capillary electrophoresis with capacitively coupled contactless conductivity detection. Electrophoresis 2010, 31, 570–574. [Google Scholar] [CrossRef]
Publisher’s Note: MDPI stays neutral with regard to jurisdictional claims in published maps and institutional affiliations. |
© 2022 by the authors. Licensee MDPI, Basel, Switzerland. This article is an open access article distributed under the terms and conditions of the Creative Commons Attribution (CC BY) license (https://creativecommons.org/licenses/by/4.0/).