Article

Advanced Sensing of Antibiotics with Sr@Se Flower-Like Structure on Phosphorus-Doped g-C3N4 Composite: Application towards Detection of Chloramphenicol in Food Samples

by
Sanjay Ballur Prasanna
1,
Gagan Kumar Sakaleshpur Kumar
2,
Sandeep Shadakshari
2,*,
Santhosh Arehalli Shivamurthy
3,
Karthik Chimatahalli Shanthakumar
2,
Bhari Mallanna Nagaraja
4 and
Ren-Jei Chung
1,*
1
Department of Chemical Engineering and Biotechnology, National Taipei University of Technology (Taipei Tech), Taipei 10608, Taiwan
2
Department of Chemistry, SJCE, JSS Science and Technology University, Karnataka 570006, India
3
Department of Chemistry (UG), NMKRV College for Women’s, Karnataka 560011, India
4
Centre for Nano and Material Science (CNMS), Jain University, Jain Global Campus, Bangalore 562112, India
*
Authors to whom correspondence should be addressed.
Chemosensors 2022, 10(10), 425; https://doi.org/10.3390/chemosensors10100425
Submission received: 23 September 2022 / Revised: 9 October 2022 / Accepted: 11 October 2022 / Published: 17 October 2022

Abstract

:
In this article, we developed specific sensing of chloramphenicol (CAP) using strontium selenium nanoflower-adorned phosphorus-doped graphitic carbon nitride (Sr@Se/PGCN) nanocomposite. The synthesized Sr@Se/PGCN nanocomposite was characterized using spectrophotometric techniques. Electrochemical Impedance Spectroscopy (EIS), Cyclic Voltammetry (CV), and Differential Pulse Voltammetry (DPV) were used to examine the electrochemical performance of Sr@Se/PGCN nanocomposite. The Sr@Se/PGCN composite shows excellent performance with a linear range of 5–450 µM and an LOD of 2.7 nM. Furthermore, the present electrochemical CAP sensor exhibited high sensitivity, good stability, exceptional reproducibility, and an excellent recovery rate in real food samples.

1. Introduction

Chloramphenicol (CAP) is an antibiotic with a wide range of activity against diverse bacteria [1]. Since the 1950s, it has been widely used to treat infectious infections in humans and animals [2]. However, it causes significant human side effects, including grey baby syndrome, leukemia, and aplastic anemia [1]. As a result, the use of CAP in animal-derived foods has been excluded globally to assure food safety [3]. However, owing to its low cost and availability, CAP is not eradicated in actual manufacturing and living, so it is preferable to make a simple and rapid CAP monitoring method [4]. For CAP detection, several analytical methods have been developed, including LC-mass spectrometry (LC-MS), high-performance liquid chromatography (HPLC), gas chromatography (GC), Raman scattering, and chemiluminescence, gas chromatography-mass spectrometry, and enzyme-linked immunosorbent assay [5,6,7,8,9,10]. However, it is essential to note that these techniques have significant drawbacks. Electrochemical sensors have received attention because of their fast reaction time, easy operation, and the convenience of on-site analysis and detection [11].
The semiconductor nanoparticles exhibit exceptional nonlinear characteristics, as well as saturable absorption and optical bi-stability [12]. Selenium (Se) has many key features and applications, including semiconductors, catalytic activity, sensing, free radical scavenging, and strong photoconductivity [13,14]. Yajuan et al. reported on a photoelectrochemical biosensor based on Se-doped In2S3 nanomaterials for highly sensitive detection of chloramphenicol [15]. Recently, Hao et al. synthesized cubic MnSe2 nanoparticles dispersed on multi-walled carbon nanotubes: A robust electrochemical sensing platform for chloramphenicol [16]. In this research, we opted to substitute the strontium (Sr) with Se in our study since there has been relatively little research on electrochemical sensors. The usage of Se for sensing applications is extremely less and undeveloped. Because of these characteristics, they are helpful in semiconducting optoelectronic applications [17,18,19]. K. Y. Hwa et al. reported flower-like Sr@Se nanoflowers coated with rGO: an effective electrode matrix for promethazine hydrochloride sensing applications [20]. Muhammad Faisal Iqbal et al. reported on the electrocatalytic performance of strontium selenide nanowires for hydrogen evolution reactions at varied pH levels [21].
Carbonaceous materials are a suitable electrocatalyst for cost-effective and extremely sensitive modifiers due to their rapid transfer of an electron, catalytic reactivity, and lasting stability [22]. Among several carbon-based nanomaterials, g-C3N4, a metal-free polymeric semiconductor, has garnered significant attention in various applications because of its adjustable electronic characteristics and exceptional chemical stability [23]. Furthermore, a simple preparation process involving the one-step polymerization of nitrogen-rich compounds [24] and its environmentally friendly and cost-effective nature means that g-C3N4 an excellent material for photocatalysis [25], energy [26], biological [27], and optoelectronic applications [28]. A few studies have been published in recent times about the benefits of PGCN catalysts for typical applications such as hydrogen generation [29], electrocatalytic activity [30], and catalytic degradation [31]. The literature that is currently accessible bases its reports on gCN for QCN detection on metal nanocomposites. Veerakumar et al. reported using the green microwave technique and an AgNPs@g-CN composite with an LoD of 1 nM [32]. In a similar manner, S. Selvarajan et al. developed a g-C3N4/NiO heterostructure nanocomposite using a sonochemical method. The sensor showed a linear range of QCN concentration from 0.010 to 230 µM and a detection limit of 2 nM [33]. In consideration of this, introducing phosphorus to the gCN environment has the potential to increase both electrical conductivity and catalytic activity [34,35]. As a result, in this study, Strontium selenium nanoparticles were used to adorn phosphorus-doped graphitic carbon nitride nanocomposite utilizing a simple sonochemical process.
In the present work, a Sr@Se/PGCN nanocomposite was successfully produced and analyzed using several analytical and spectroscopic techniques in this study. The Sr@Se/PGCN nanocomposite demonstrated high conductivity and a sizeable electroactive surface area. Furthermore, we assigned a highly sensitive electrochemical sensor for the detection of CAP using Sr@Se/PGCN nanocomposite. The electrochemical analysis of the Sr@Se/PGCN composite produced a significant and acceptable specific capacitance value. As a result, Sr@Se/PGCN was demonstrated to be a viable choice for electrode material in practical sensing and energy storage applications.

2. Materials and Methods

2.1. Reagents and Materials

Chloramphenicol (C11H12Cl2N2O5), strontium nitrate (Sr (NO3)2), selenium powder, ethylene glycol (C₂H₆O₂), and hydrazine hydrate (N2H4) were purchased from Sigma-Aldrich, Mumbai, India. Monobasic sodium phosphate, sodium hydrogen phosphate, potassium chloride, urea, sodium hypophosphite, sodium hydroxide, ethanol, hydrochloric acid, uric acid (UA), and glucose (GLU) were purchased from SD fine chemicals LTD (Bengaluru, India), and the double-distilled water was purchased from local Wenders (Nice Chemicals (P) LTD, Kerala, India).

2.2. Apparatus

The prepared nanocomposite structural crystallinity was investigated using the XRD (Rigaku X-ray diffraction Ultima—IV, Tokyo, Japan) technique. The infrared analyzer (PerkinElmer RX-1 spectrophotometer, Waltham, MA, USA) determined the electrode’s distinct functional groups. The prepared composites’ structural topography and elemental mapping were examined by FE-SEM (JEOLModel-JSM7100F, Tokyo, Japan) with EDX. We employed a three-electrode electrochemical workstation (CHI 660D, Austin, USA). The Pt filament, saturated Ag/AgCl, and GCE (surface area-0.07 cm2) acted as the auxiliary, reference, and working electrodes, respectively. Various electrochemical techniques, including CV, EIS, and DPV, were used to examine the electroanalytical properties of the modified electrodes.

2.3. Synthesis of Sr@Se

Typically, Sr@Se was synthesized by modifying the previously reported solvothermal synthesis techniques [20]. Briefly, Sr (NO3)2 (0.1 M) was dissolved in 60 mL of DD water, ethylene glycol, and hydrazine hydrate in the ratio (7:3:1) and was vigorously stirred for 30 min at 60 °C to form a homogenous mixture. The mixture added 0.2 M of selenium powder and stirred for 30 min. Later, the solution was transferred to a stainless-steel Teflon autoclave that was sealed and heated to 180 °C for 24 h. The sample was then collected, cooled at ambient temperature, and centrifuged many times at 7000 rpm for 30 min to ensure that all of the unreacted particles were adequately removed. Finally, the acquired product was dried overnight at 60 °C. The synthetic procedure of Sr@Se nanoparticles is illustrated in Scheme 1a.

2.4. Preparation of PGCN

To synthesize PGCN using condensing precursors, CH₄N₂O and sodium hypophosphate were placed in a muffle furnace at high temperatures. In particular, 10 g of CH₄N₂O was liquified in 25 mL of ethanol, and 1.2 g of sodium hypophosphate was introduced. The aqueous solution was ultrasonically treated for 20 min, and then the ethanol was allowed to evaporate in an oven at a temperature of 80 °C. The resultant precipitates were transferred to a covered crucible and heated at 550 °C for 2 h at a calcinating rate of 5 °C min−1. The yellow solid is produced and crushed into tiny grains in a mortar for subsequent usage and designated as PGCN [36]. Scheme 1b depicts the synthesis of PGCN.

2.5. Fabrication of the Sr@Se/PGCN/GCE

First, Glassy Carbon Electrodes (GCE) were polished successively on silicon carbide paper and Al2O3 powder and then washed in water and ethanol for a short period, respectively. Under optimization, a 1:1 ratio (wt %) of Sr@Se/PGCN/GCE nanocomposite (mg/mL) of approximately 8 µL, which demonstrated outstanding electrochemical performance, was dropped over the GCE to construct a CAP electrochemical sensor. After that, the modified GCE was dried for 10 min at 50 °C. Next, the electrocatalytic reaction of CAP was investigated using a Sr@Se/PGCN/GCE-modified electrode. Following that, the modified Sr@Se/PGCN/GCE was used to detect CAP by CV and DPV. Scheme 1c depicts the fabrication process of the Sr@Se/PGCN-modified GCE for CAP measurement.

3. Results

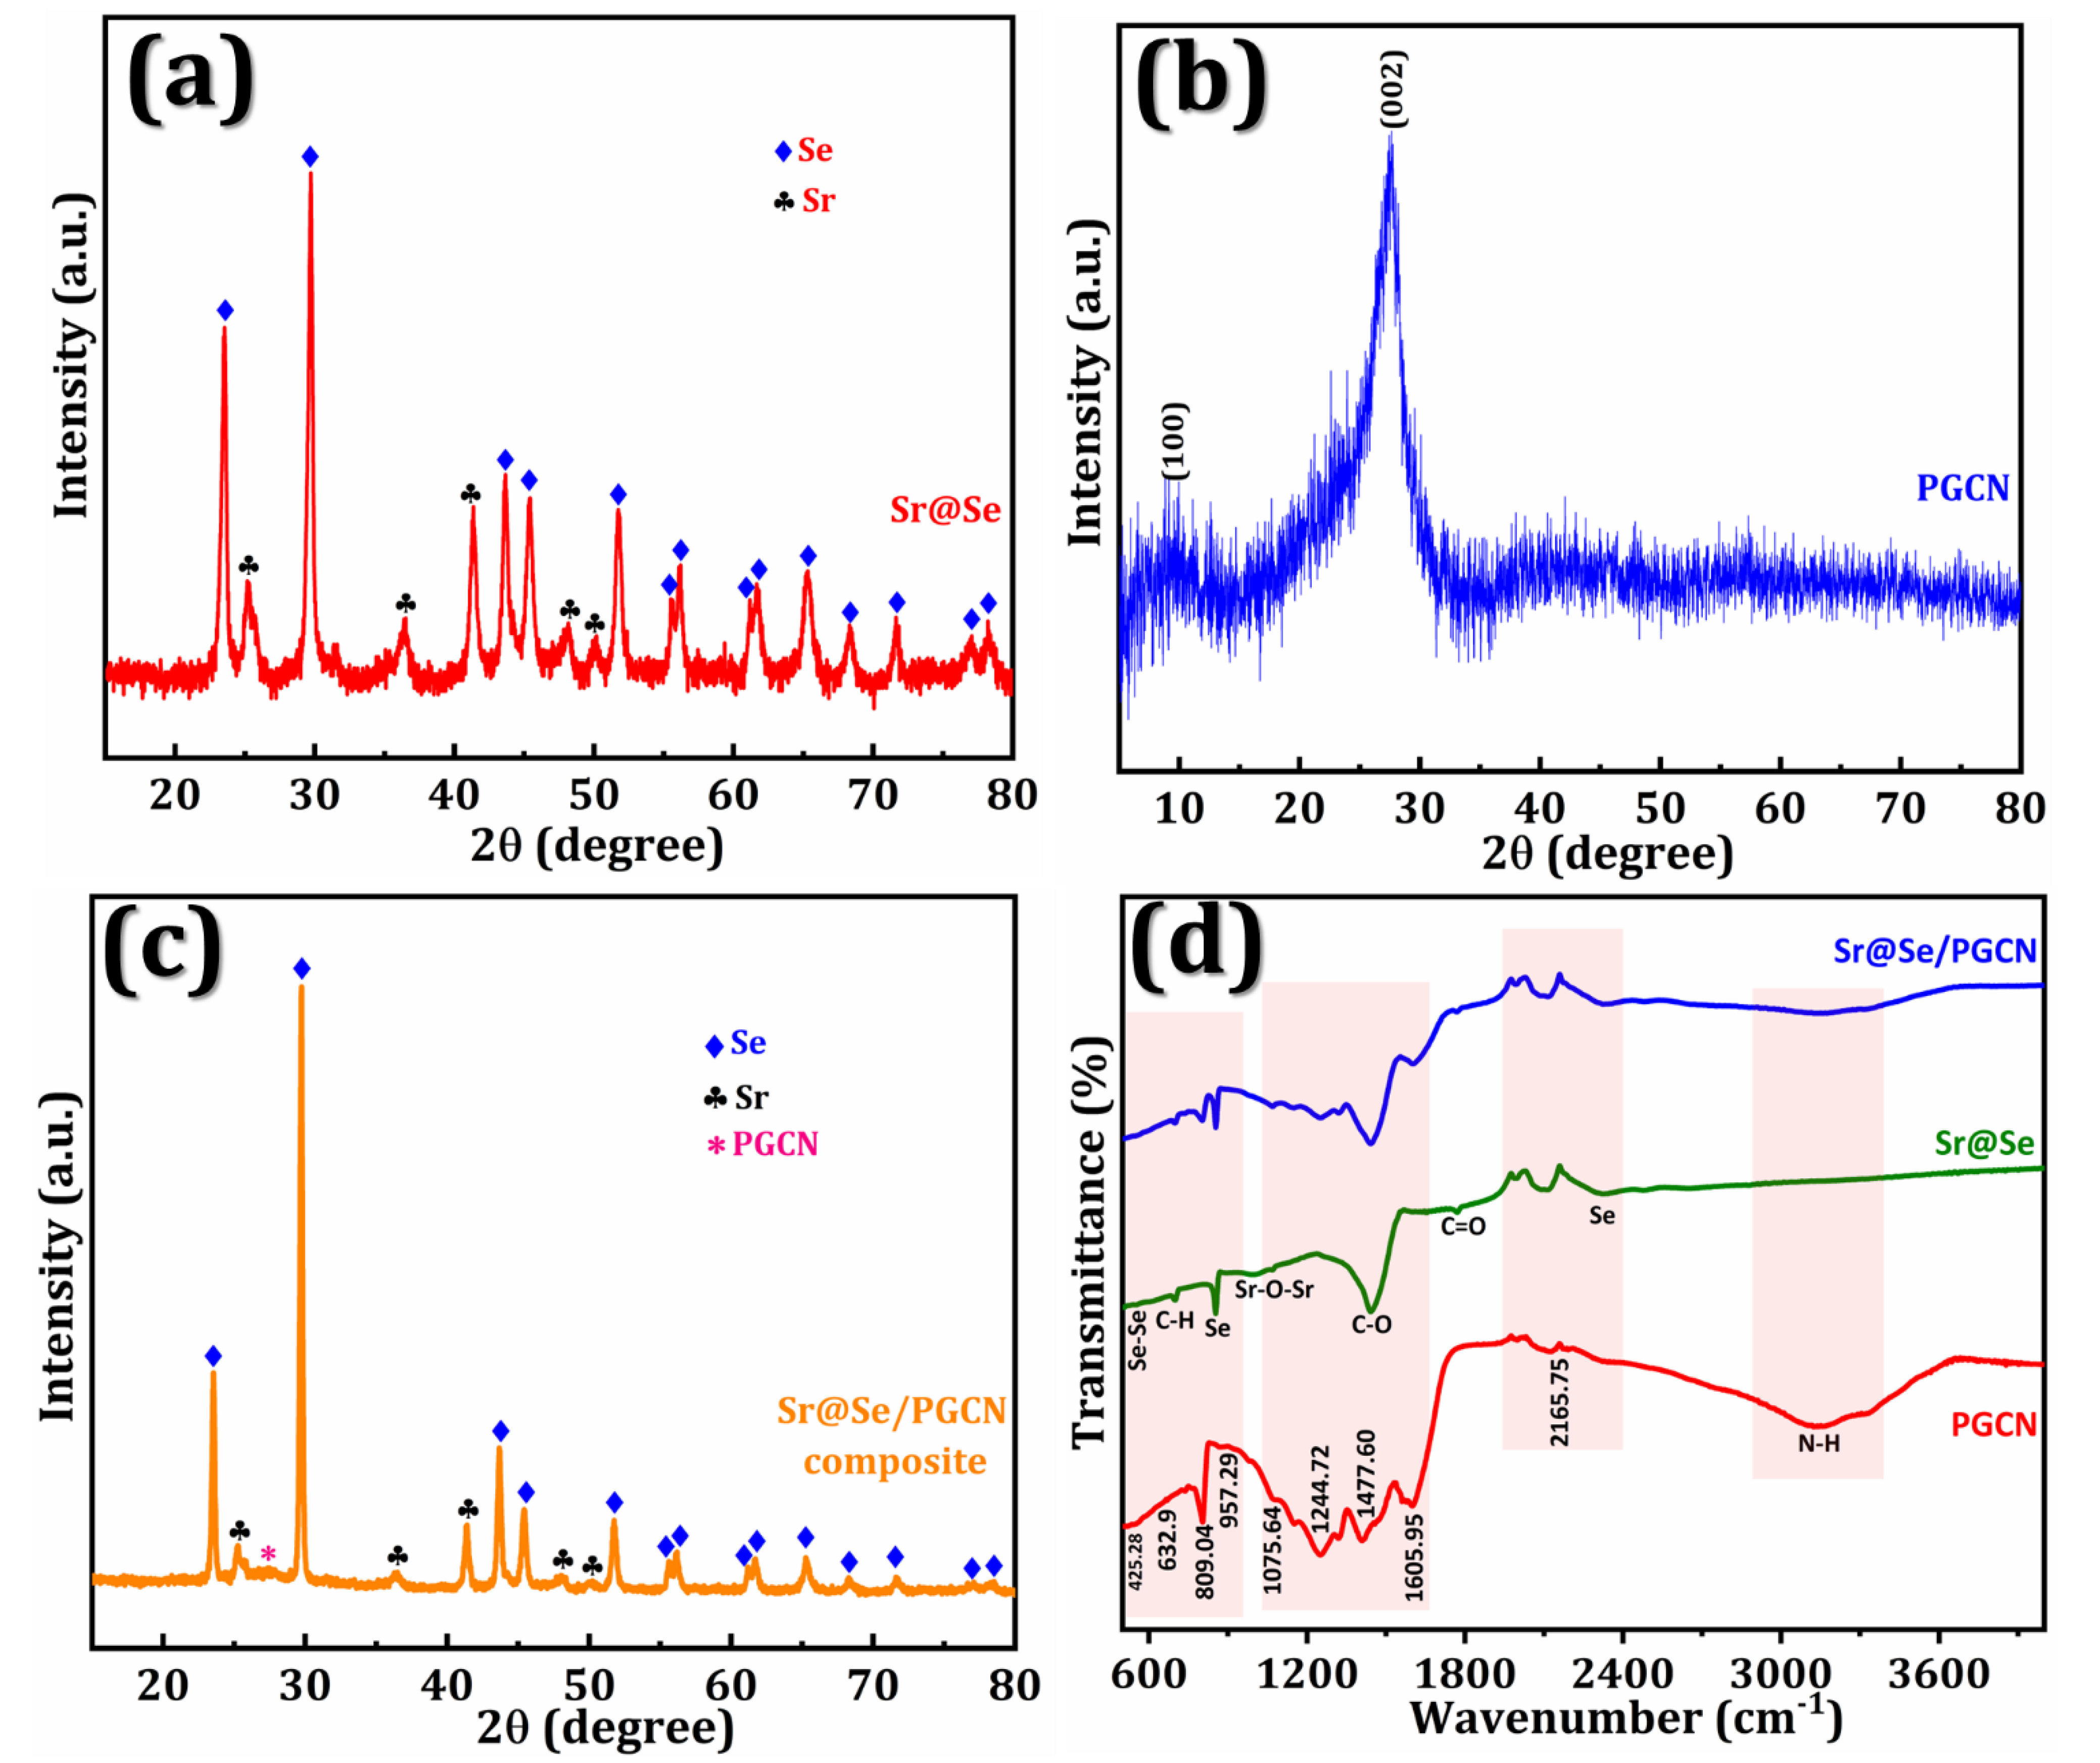
To assess the crystalline structure and phase purity of the synthesized materials, XRD was taken, which included Sr@Se, PGCN, and Sr@Se/PGCN, and the outcomes are displayed in Figure 1a. The XRD pattern of Sr@Se is in good agreement with previously reported studies [20], which confirmed the pure form of Sr@Se. The diffraction peaks at 2θ = 23.49, 29.8, 41.36, 43.7, 45.42, 48.13, 51.8, 55.53, 56.16, 61.22, 61.65, 65.28, 68.3, 71.68, 76.9, and 78.19 were ascribed to Sr@Se (JCPDS card no. 00-001-0574) and fitting to the hkl planes (100), (101), (110), (102), (111), (200), (003), (112), (103), (202), (210), (211), (113), (203), (301), and (104), respectively. Additionally, 2θ peaks are seen at 25.4, 42.12, 49.6, and 52.3, which correspond to (111), (220), (311), and (222) hkl, respectively. Moreover, a smaller 2θ at 9.37 (100) and a larger 2θ at 27.4 (002) were noted (Figure 2b). Interestingly, the Sr@Se and PGCN diffraction peaks were reproduced in the Sr@Se/PGCN nanocomposite, indicating the nanocomposite’s effective formation (Figure 2c).
The Fourier-transform infrared spectroscopy (FT-IR) spectra of Sr@Se, PGCN, and Sr@Se/PGCN are shown in Figure 1d. The range of Sr@Se reveals a minor peak at 525.12 due to a Se-Se bonding and other peaks at 769.76 and 856.60 due to Se (out-of-plane) bending in the material. The C-H stretching is confirmed from the peak at 701.36 [37]. The symmetric C=O and C-O stretching vibrations produce a weak band at 1436.86 and 1775.03 cm−1, respectively. The stretching frequency of O-H bonds is greater than that of heavier atom bonds [38]. The spectra of PGCN display an absorption band extending from 1100 to 1600 cm−1, which is attributed to the stretching vibration of tri-s-triazine, and it is important for C-N and C=N heterocycles. The absorption is strong at 809.23 cm−1, corresponding to the triazine unit bending vibration in the heptazine rings, confirming the development of g-C3N4 [39]. The stretching vibration modes of O-H bonds were assigned a set of peaks in the 3020–3600 cm−1 range. A distinctive peak at 3144.59 cm−1 is ascribed to the N-H stretching group [40]. A minor peak determines the formation of PGCN at 957.29 cm−1, which is caused by the inclusion of a phosphorus dopant [41]. Furthermore, by modifying PGCN with Sr@Se, all of the absorption peaks in the nanocomposite were reproduced.
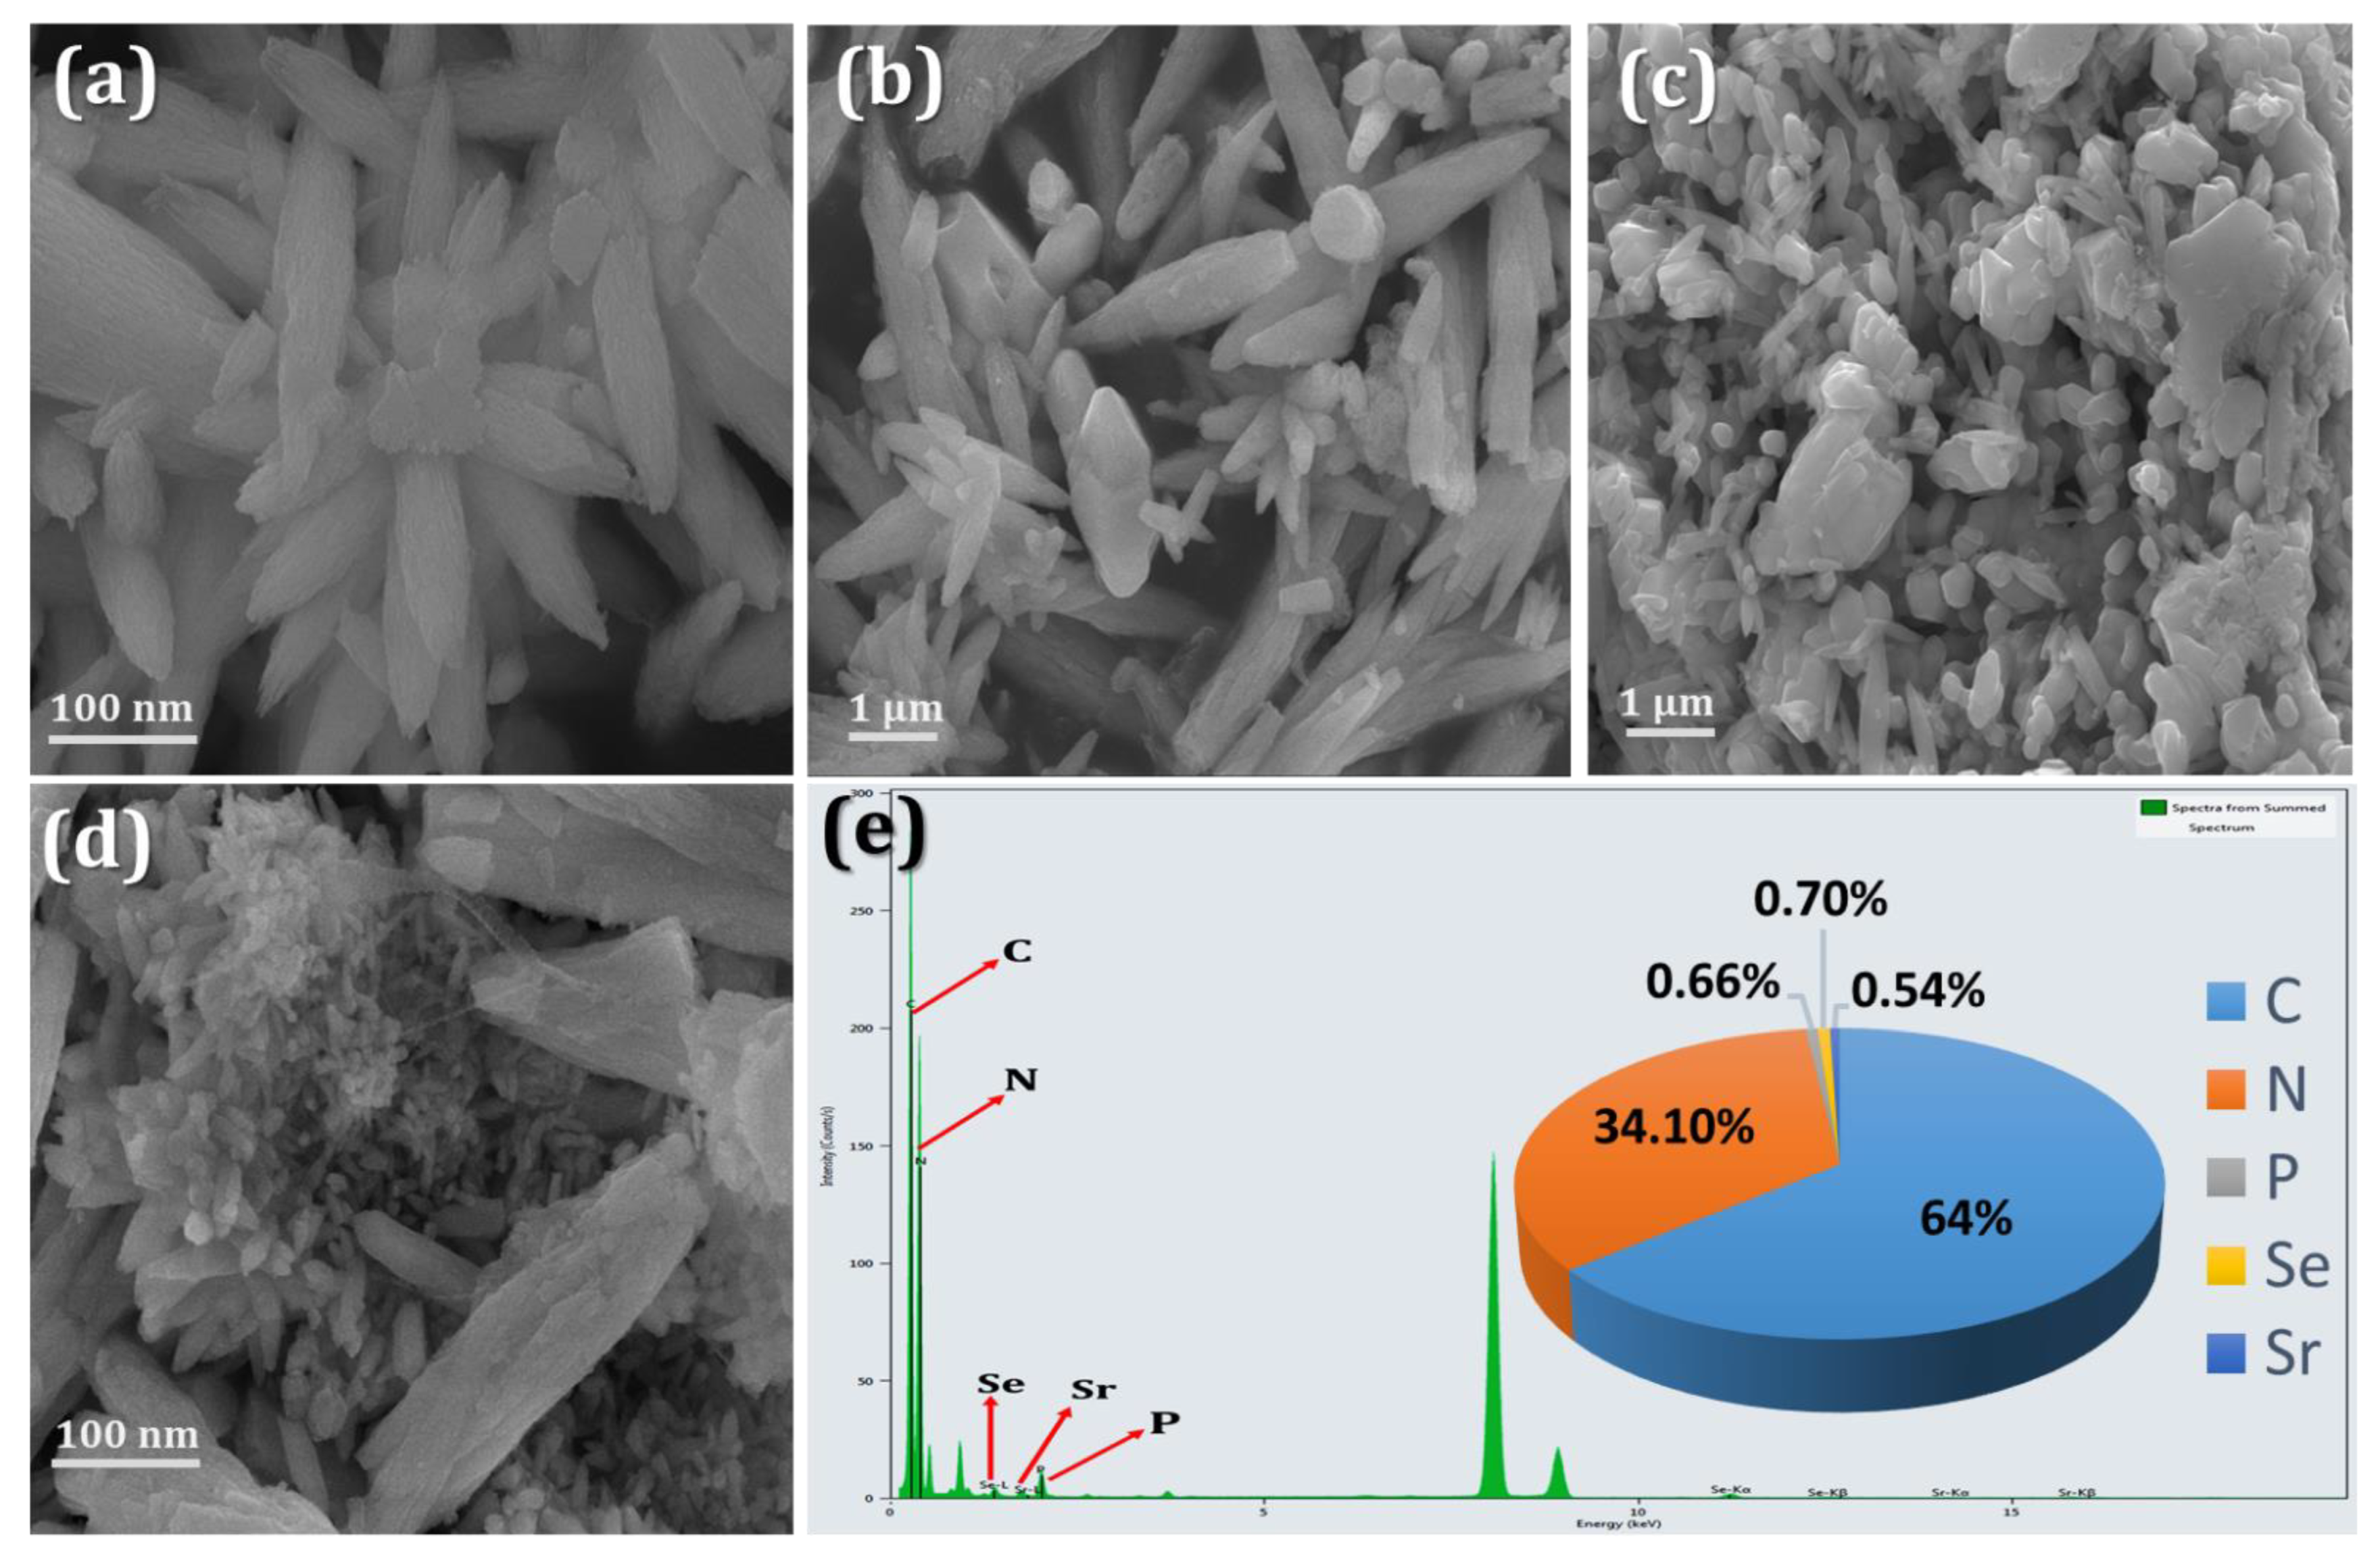
FE-SEM was used to examine the structural properties and external morphology of the material. FE-SEM images of the Sr@Se (a and b), PGCN (c), and Sr@Se/PGCN nanocomposite are shown in Figure 2a–d. For Sr@Se (Figure 2a,b) clearly shows the development of a flower-like structure on lengthy micro rods. After careful examination, we can observe that the Sr@Se 3D flower-like structure generated has numerous little rod-like structures of uneven length that extend in all directions. The picture of the PGCN shows a 2D sheet-like structure with flat surfaces (Figure 2c). On the other hand (Figure 2d), shows an FE-SEM image of the Sr@Se/PGCN nanocomposite in which the Sr@Se flowers-like nanorods that are tightly anchored on the PGCN sheets are visible. The pictures were obtained to confirm the excellent anchoring of Sr@Se on the PGCN. The EDX analysis of the Sr@Se/PGCN nanocomposite (Figure 2e) reveals the elements with their weight percentages such as carbon (64%), nitrogen (34.10%), selenium (0.70%), strontium (0.54%), and phosphorous (0.66%) (Figure 2e (inset)).

3.1. Electrochemical Performance of the Sr@Se/PGCN Nanocomposite

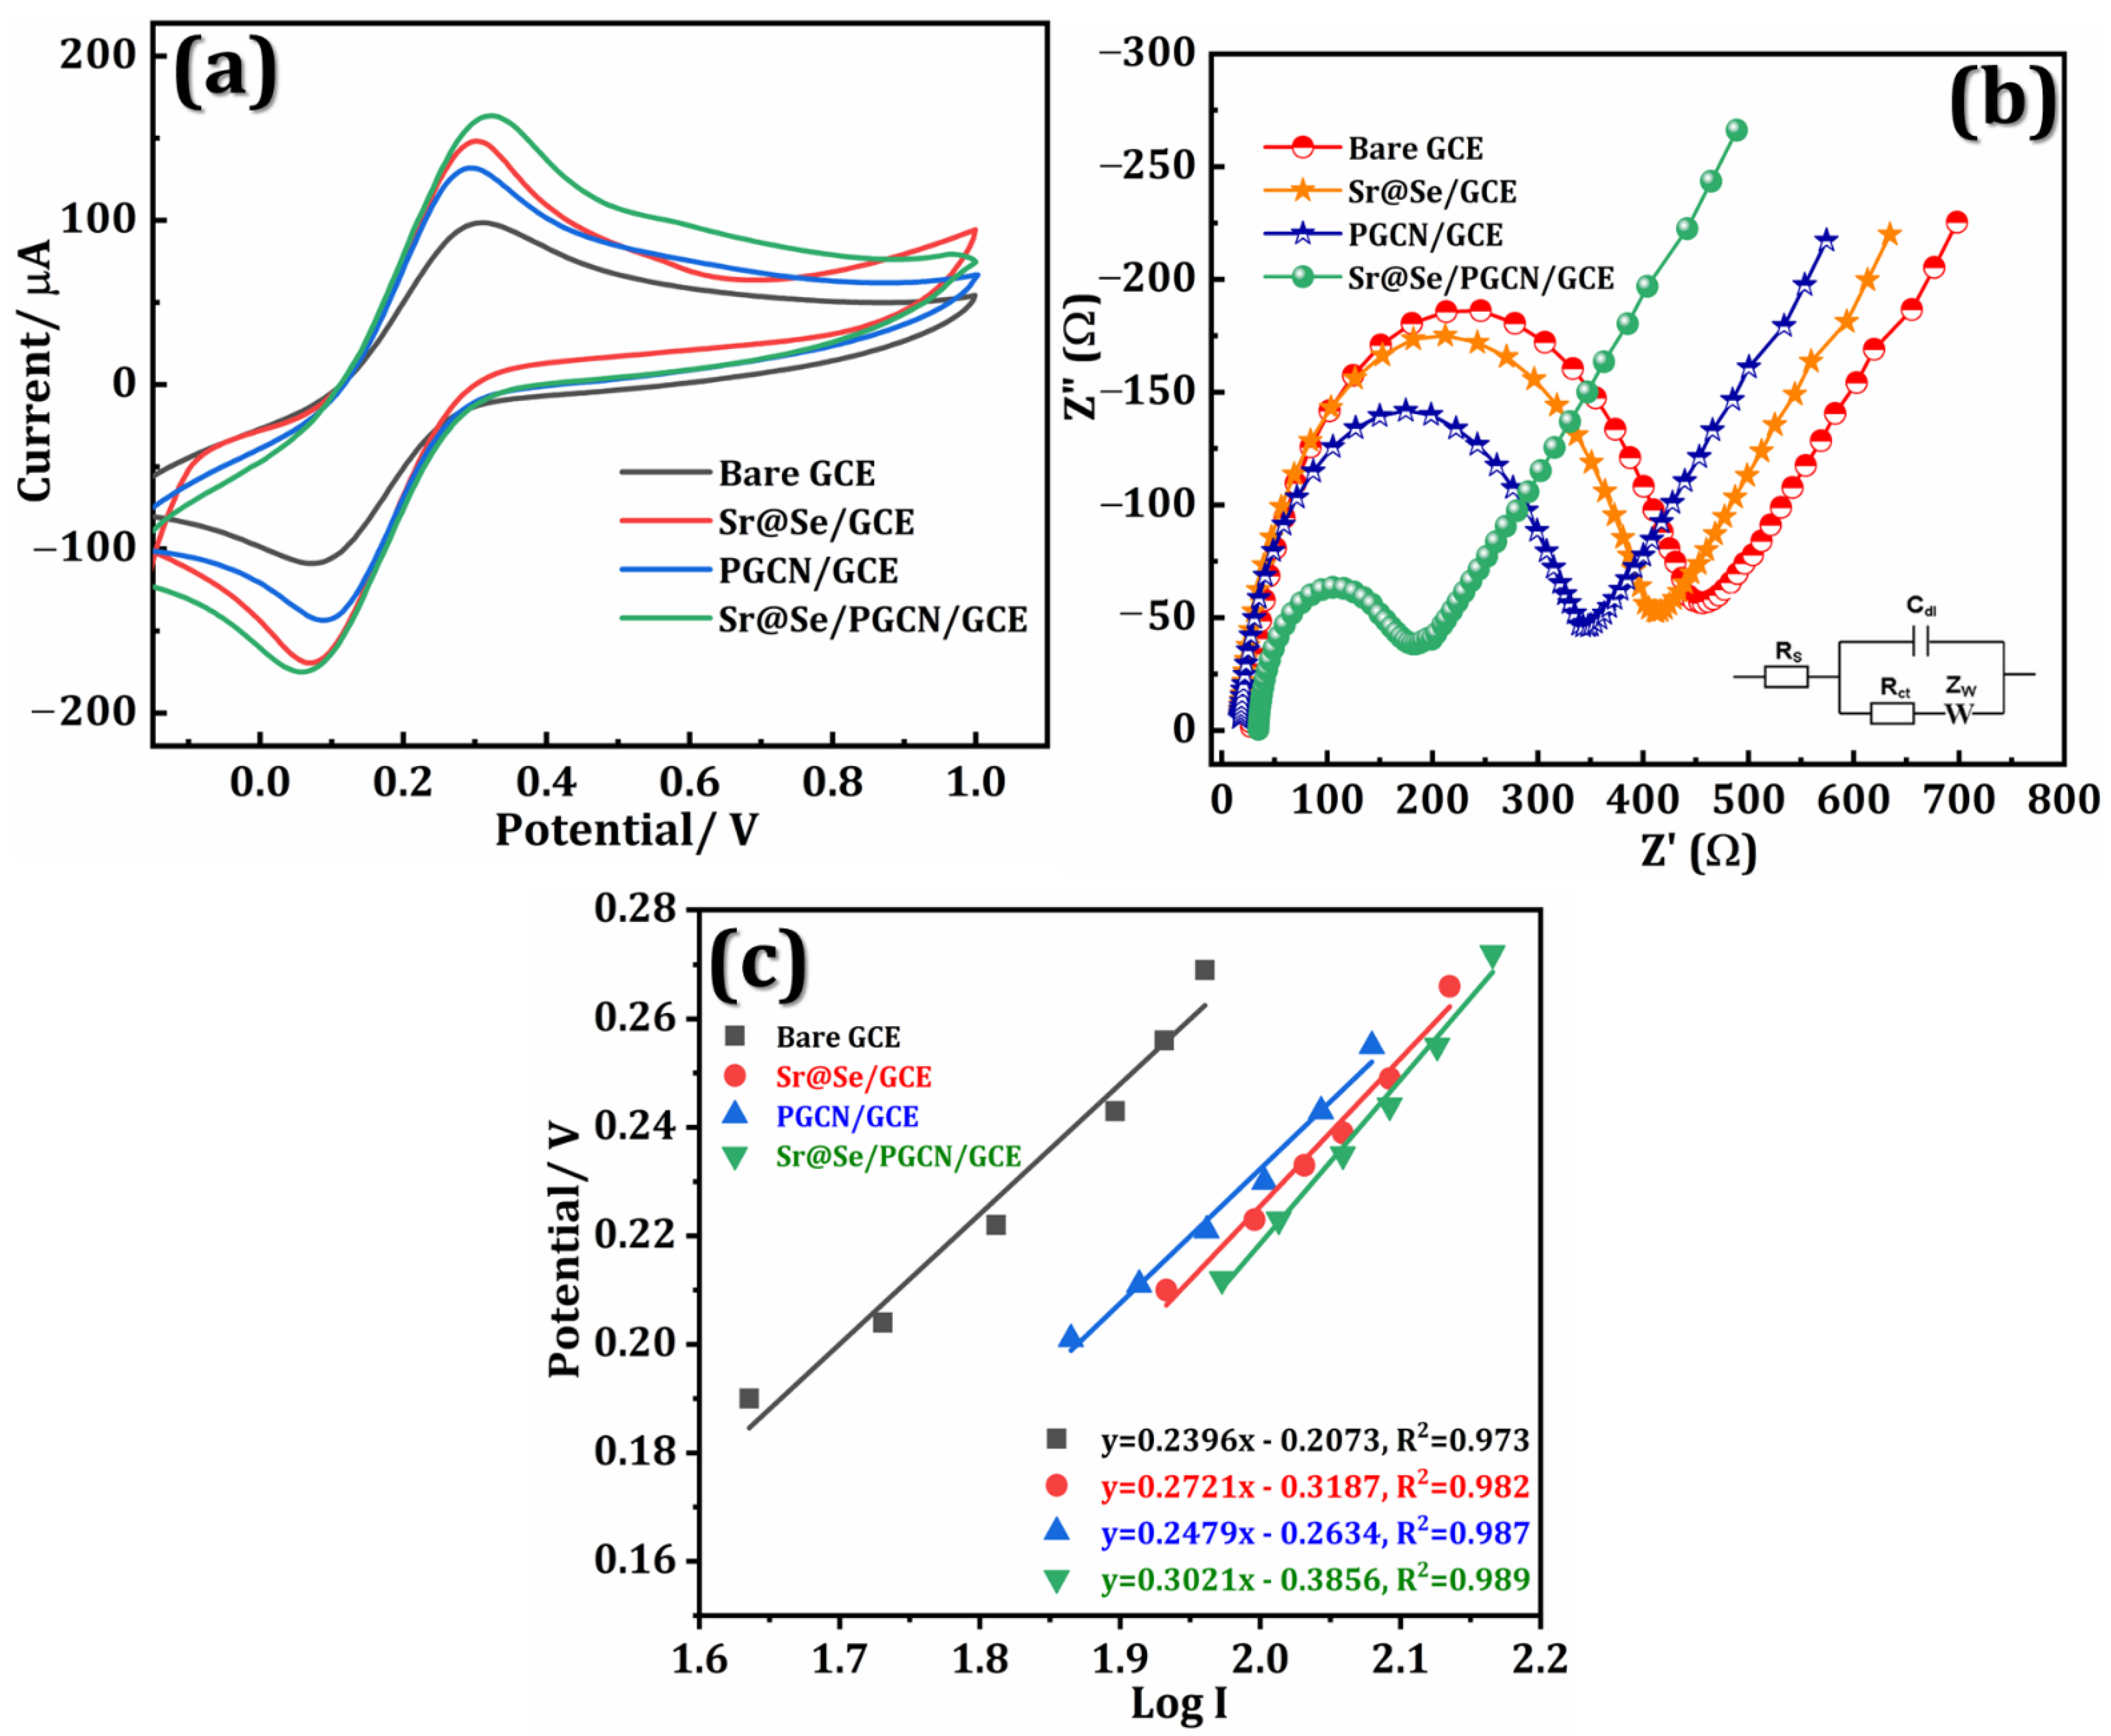
The electrochemical performance of the modified electrodes, namely bare GCE, Sr@Se/GCE, PGCN/GCE, and Sr@Se/PGCN/GCE, were measured using CV in [Fe(CN)6]3−/4− solution at a sweep rate of 50 mVs−1. (Figure 3a). The bare GCE, Sr@Se/GCE, PGCN/GCE, and Sr@Se/PGCN-modified GCE obtained anodic peak current (Ipa) values of 100.84, 133.34, 149.28, and 164.34 µA, respectively. Furthermore, compared to other modified electrodes, the synergistic impact of Sr@Se (increased catalytic activity) and PGCN (high conductivity) might improve the peak current response.
EIS is a widely used method for assessing electrode kinetics as well as changes in the electrode–electrolyte interface induced by electrode surface modifications. Figure 3b depicts the EIS spectra of the bare GCE, Sr@Se/GCE, PGCN/GCE, and Sr@Se/PGCN/GCE. All of the measurements were executed in a 5 mM [Fe(CN)6]3−/4− electrolyte containing 0.1 M KCl. The inset image of Randles’ equivalent circuit illustrates the best match, where Rs is the solution resistance, Cdl is the double-layer capacitance, W is the Warburg resistance, and Rct is the charge transfer resistance. Rct was calculated at the interface of electrode–electrolyte using a well-defined semicircle in the Nyquist plot for bare GCE, Sr@Se/GCE, PGCN/GCE, and Sr@Se/PGCN/GCE. From the Nyquist plot, the Rct values for bare GCE (423.46 Ω), Sr@Se/GCE (388.7 Ω), PGCN/GCE (323.51 Ω), and Sr@Se/PGCN/GCE (149.83 Ω). The Rct value decreased to 323.51 Ω when the GCE surface was modified with PGCN, indicating the development of charge-transfer kinetics. Finally, the Rct value for the Sr@Se/PGCN/GCE nanocomposite fabricated with the GCE surface was 149.83 Ω, which was remarkably lower than bare GCE, Sr@Se/GCE, and PGCN/GCE. Considering the Rct value, there is a rapid electron transfer rate between the Sr@Se/PGCN/GCE and electrolyte solution, resulting in lower resistance and excellent conductivity. According to the EIS study, the Sr@Se/PGCN composite has excellent electrical conductivity and excellent charge transfer capabilities, making it suitable for electrochemical sensing applications.
Using the Tafel plot (Figure 3c) and a slope of 2.3RT/n (1 − α) F [42], the electron transfer coefficient (α) was determined to be 0.99.
The Randle–Sevcik equation was used to determine the modified electrode’s active surface area (Equation (1)) [43].
I pa = 2.69 × 10 5 A   C   n 3 / 2   D 1 / 2   υ 1 / 2
where Ipa represents the oxidation peak current of variously adjusted electrodes, n denotes the number of electrons (n = 4), A is surface area (cm2), D is diffusion coefficient (6 × 10⁻⁶ for [Fe (CN)6]3−/4−), C stands for concentration of electrolyte (10−6 mol cm−3 for [Fe(CN)6]3−4−), and υ is scan rate (Vs−1). Surface areas of the bare GCE, Sr@Se/GCE, PGCN/GCE, and Sr@Se/PGCN/GCE were determined using Equation (1) to be 1.21, 1.60, 1.79, and 1.97 cm2, respectively. These findings show that the electrode’s electrical conductivity is proportional to its active surface area, resulting in greater charge transfer in the Sr@Se/PGCN/GCE.
The number of redox cores on the surface and the electrode dimensions determine the roughness factor (Rf). The ratio of the electrode surface area is known as the Rf [44]. The ratio of the surface areas of Sr@Se/GCE, PGCN/GCE, and Sr@Se/PGCN/GCE to the surface area of bare GCE is used to estimate the Rf of bare GCE, Sr@Se/GCE, PGCN/GCE, and Sr@Se/PGCN/GCE. The calculated Rf values for Sr@Se/GCE, PGCN/GCE, and Sr@Se/PGCN/GCE are 1.32, 1.47, and 1.62, respectively.
Equation (2) can be used to determine the kinetic parameter (Ψ) follows [45]:
Ψ = k 0 RT / π FDv 1 2
where, Ψ is denoted as the dimensionless kinetic parameter, R is the gas constant, T is the temperature of the solution in kelvin, F is the faraday constant (C/mol), ν is the scan rate (V/s), and D denotes the diffusion coefficient of Fe(CN)6]3−4−. The calculated values were 0.453, 0.451, 0.435, and 0.36 for the bare GCE, Sr@Se/GCE, PGCN/GCE, and Sr@Se/PGCN/GCE, respectively.
In the EIS analysis, two segments are obtained, such as semi-circular and linear. The kinetics of the electron transfer are represented by the semicircle’s diameter, which is abbreviated as Rct. From the Rct observations, the standard heterogeneous rate constant (k0) is determined by employing the following equation (Equation (3)) [46].
k0 = RT/F2 Rct AC
The general gas constant (8.314 JK−1mol−1), the Faraday constant (96,485 C mol−1), and the temperature (298 K) are each represented by the symbols T, R, and F in this equation. The Rct values for bare GCE, Sr@Se/GCE, PGCN/GCE, and Sr@Se/PGCN/GCE are determined from the EIS investigations. As determined above, A represents the surface areas of bare GCE, Sr@Se/GCE, PGCN/GCE, and Sr@Se/PGCN/GCE. C represents the concentration of the potassium ferrocyanide solution. According to the calculations, the values of k0 for bare GCE, Sr@Se/GCE, PGCN/GCE, and Sr@Se/PGCN/GCE are 1.03 × 10⁻³ cms−1, 1.13 × 10⁻³ cms−1, 1.35 × 10⁻³ cms−1, and 2.93 × 10⁻³ cms−1, respectively. A system with a higher k0 value achieves equilibrium in very little time. This is further evidence of faster electron transfer for Sr@Se/PGCN/GCE when compared to other modified electrodes.
From the Cottrell equation (I = nFAD1/2 Cbπ − ½ t−1/2) [42], where (A = 0.36 cm2, n = 4, and F = 96,485C mol−1) and the value of diffusion coefficient (D) was determined to be bare GCE, Sr@Se/GCE, PGCN/GCE, and Sr@Se/PGCN/GCE are 7.94 × 10⁻², 9.03 × 10⁻², 7.18 × 10⁻², and 8.09 × 10⁻², respectively.
The standard heterogeneous rate constant (ks) for Fe(CN)6]3−4− at the bare GCE, Sr@Se/GCE, PGCN/GCE, and Sr@Se/PGCN-modified GCE was determined using Equation (4) [47].
ks = 2.415 exp (−0.02F/RT) D1/2 (Ep − Ep/2)−1/2 V1/2
where Ep and Ep/2 represent the peak potential and the half-height potential in CV, respectively. Therefore, ks was determined to be bare GCE, Sr@Se/GCE, PGCN/GCE, and Sr@Se/PGCN/GCE are 2.414 × 10⁻³ cms−1, 2.60 × 10⁻³ cms−1, 2.18 × 10⁻³ cms−1, and 2.62 × 10⁻³, respectively.

3.2. Electrochemical Performance of the Sr@Se/PGCN Composite with CAP

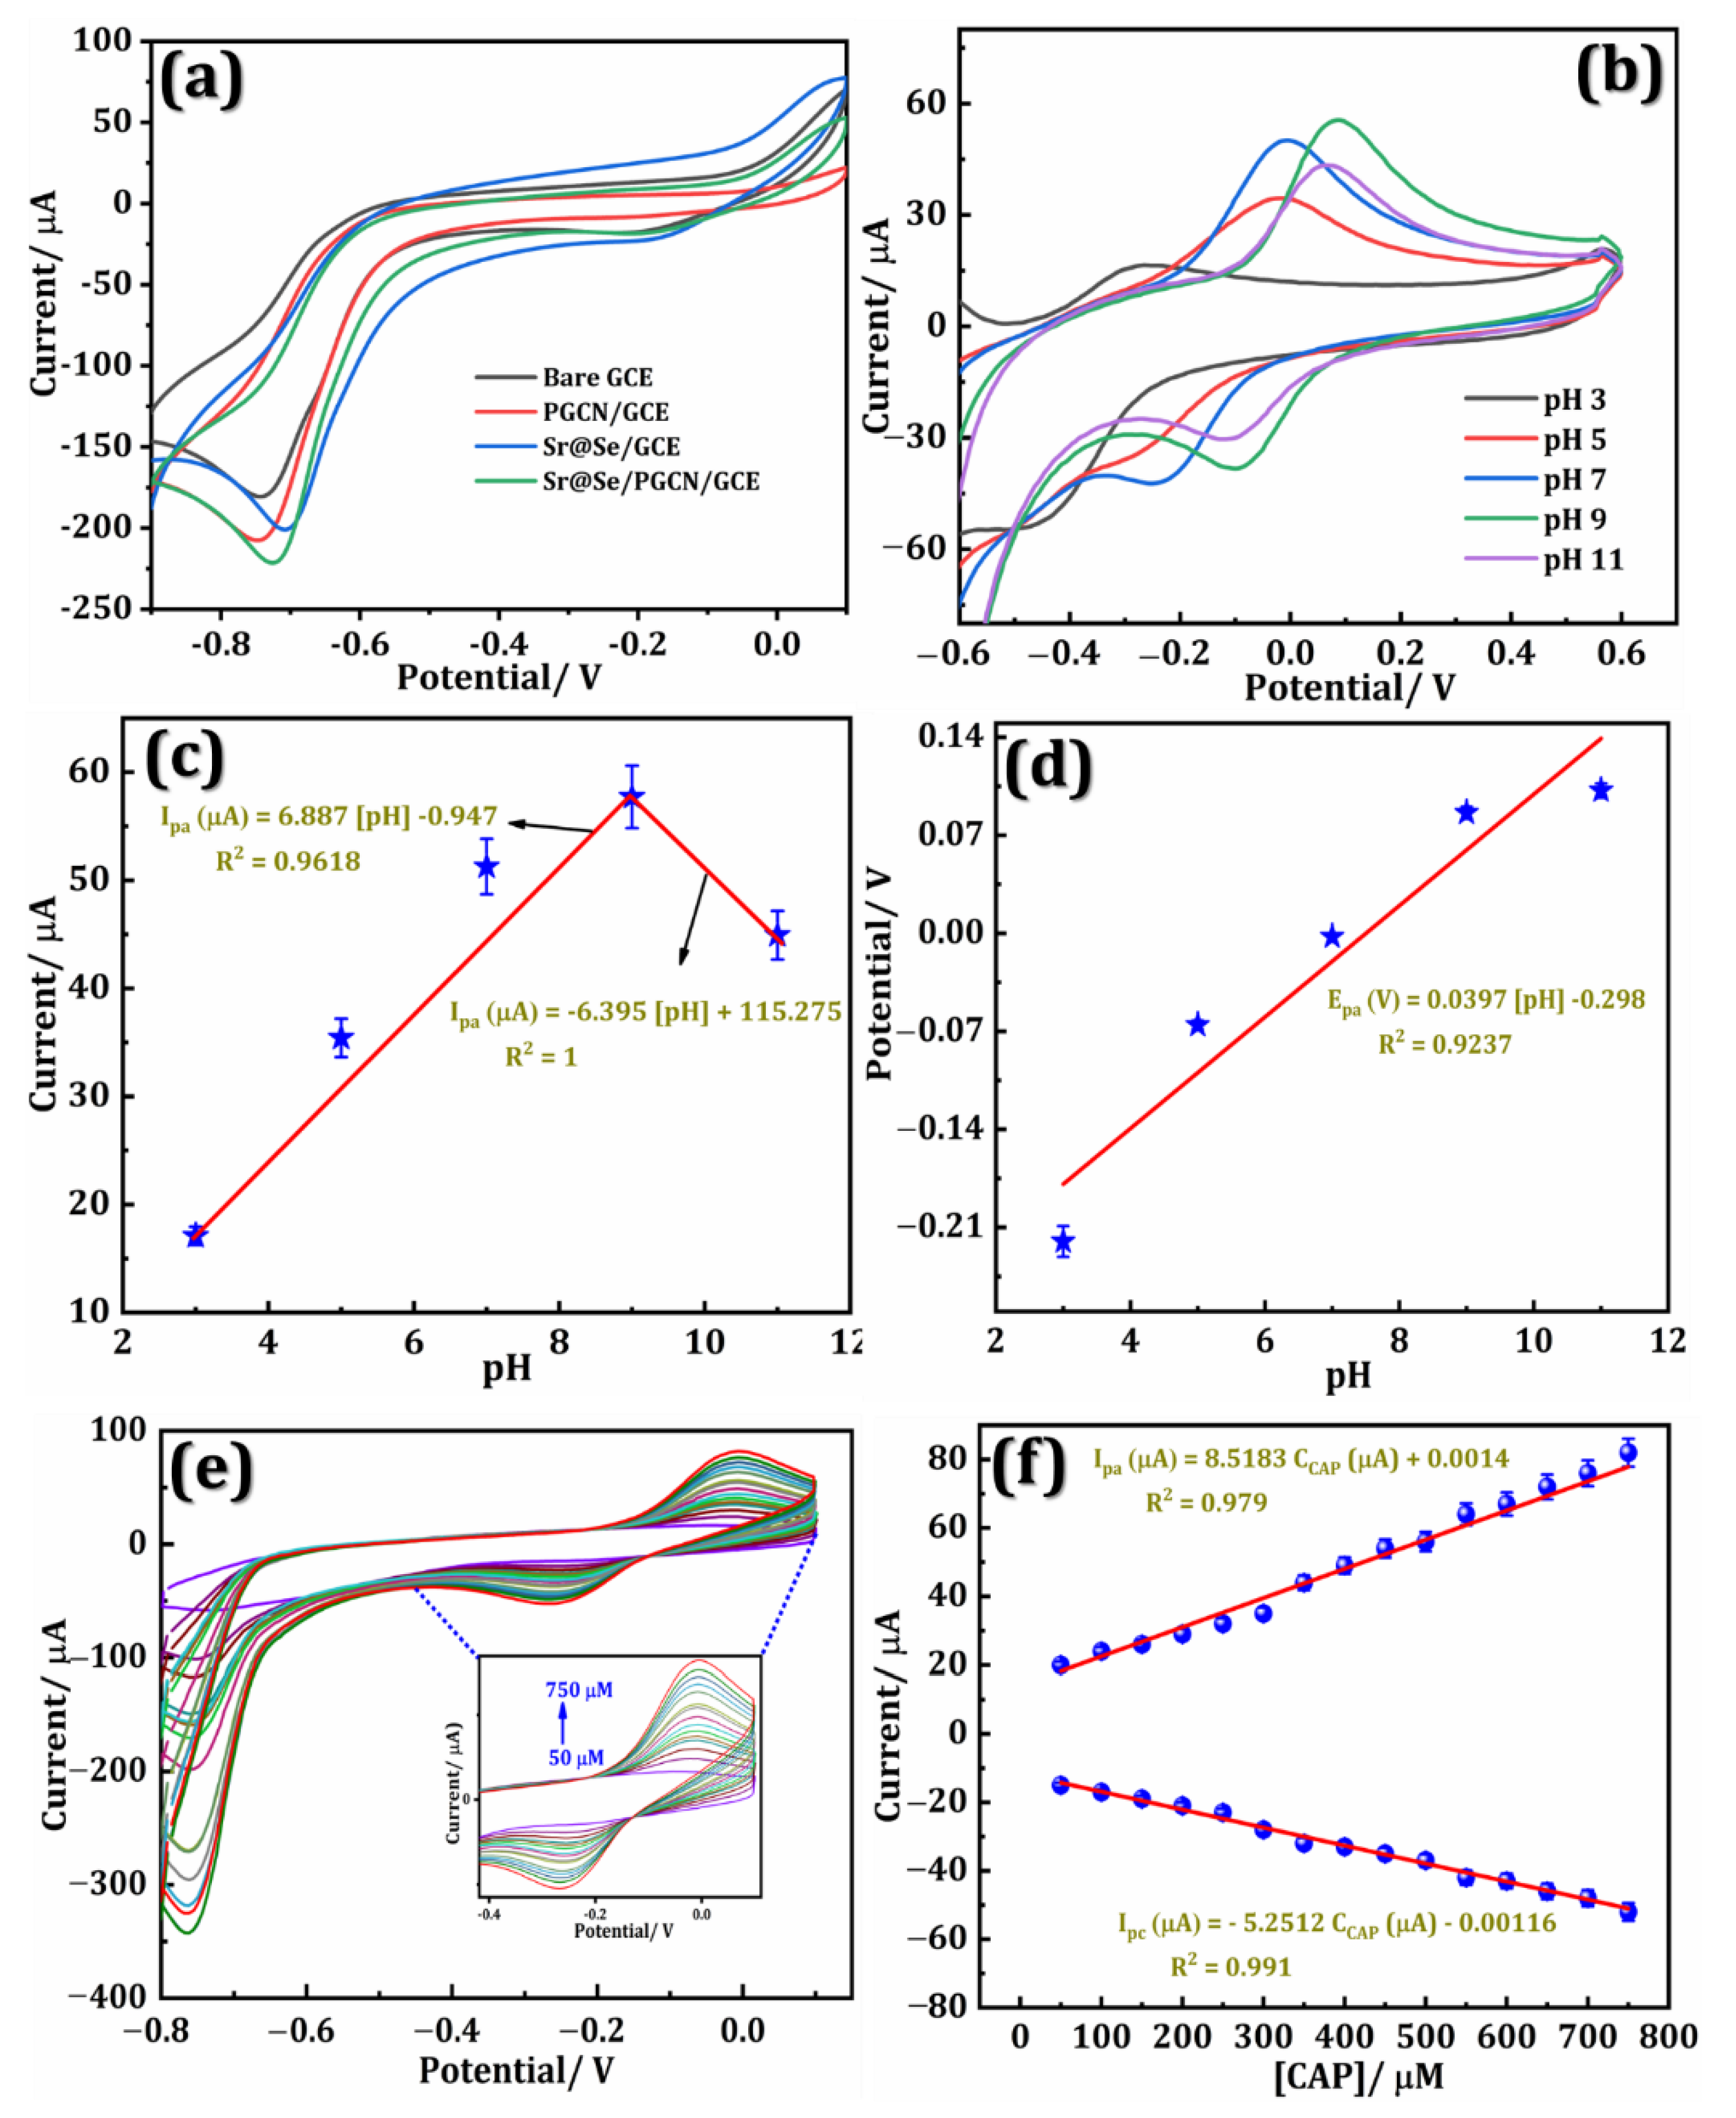
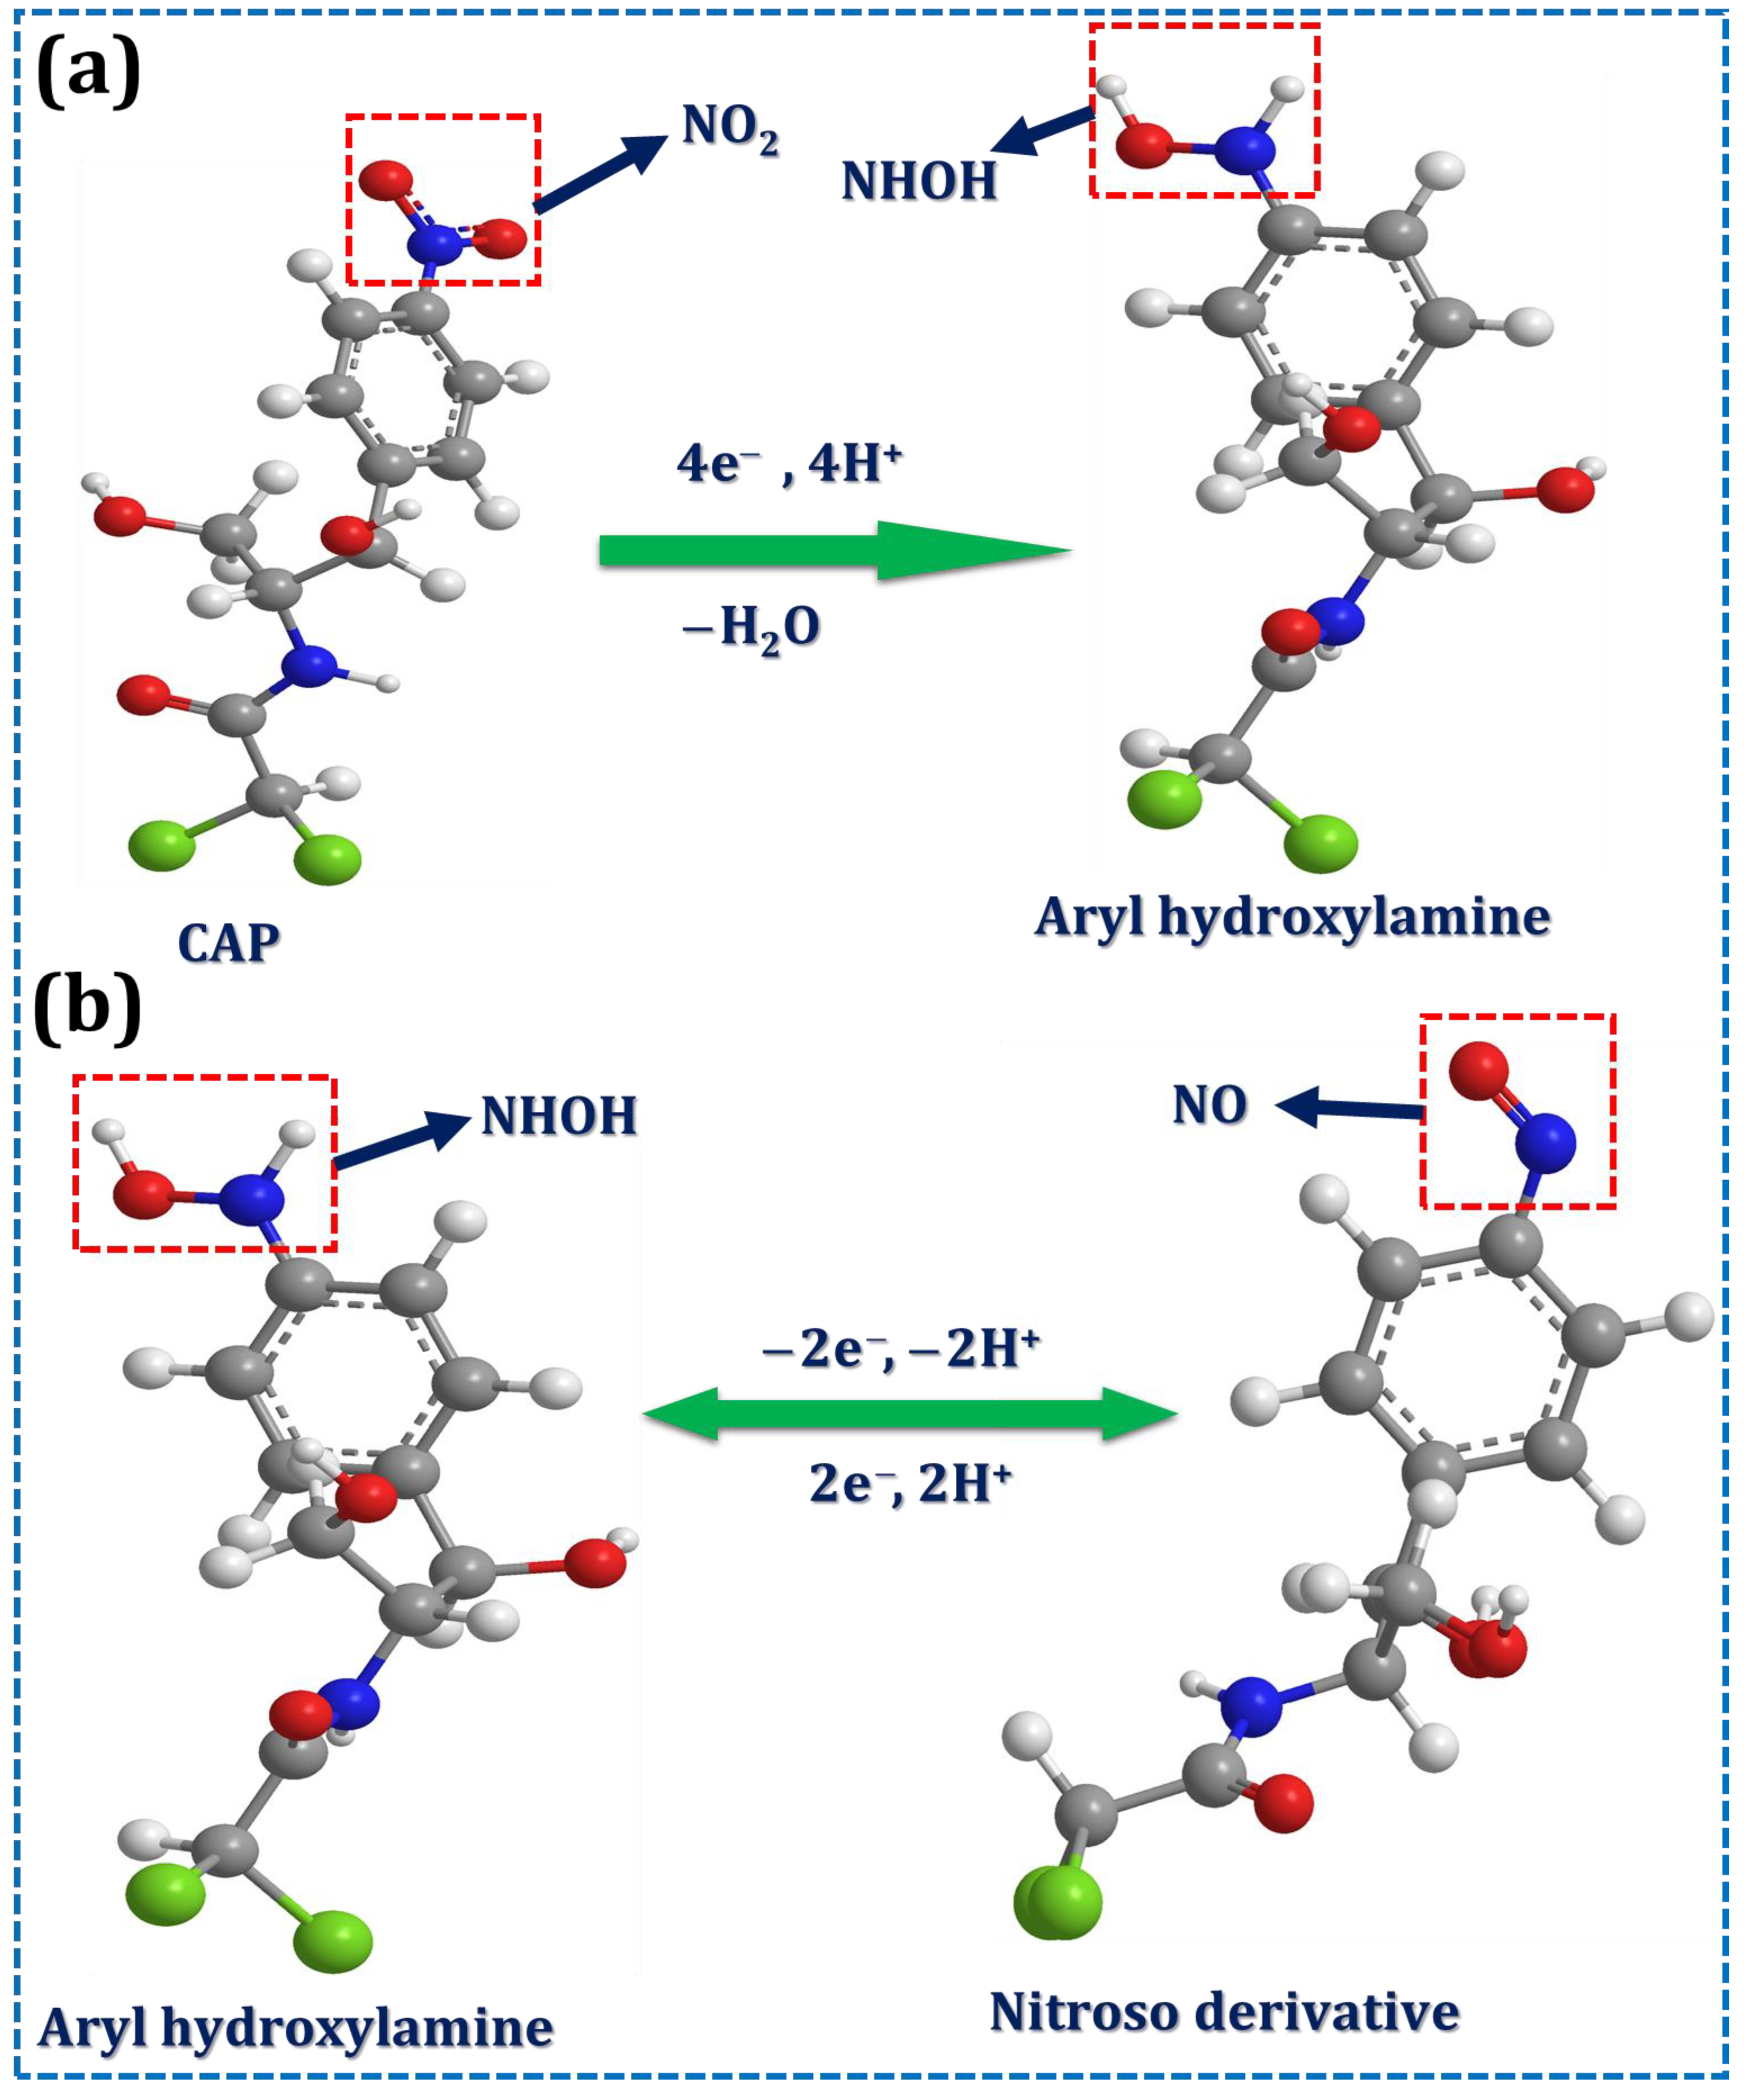
Several aspects, including the scan rate, different nanomaterial effects, and pH variation, must be studied during the sensor development process to understand the sensor’s electrochemical behavior. The CV findings of the bare GCE, Sr@Se/GCE, PGCN/GCE, and Sr@Se/PGCN/GCE in 250 µM of CAP are shown in Figure 4a. The bare GCE and Sr@Se/GCE exhibited high Ipc values of −181.36 and −201.27 µA, respectively. After modification with PGCN/GCE, a higher Ipc value of −209.09 µA was observed owing to the large surface area and the high conductivity of PGCN, and the Ipc value of the PGCN-modified GCE was twice that of Sr@Se/GCE and thrice that of bare GCE. Interestingly, the Sr@Se/PGCN nanocomposite-modified GCE shows a maximum Ipc of −225.43 µA compared to the other fabricated electrodes. The electrochemical performance of the Sr@Se/PGCN nanocomposite was increased by the strong electrocatalytic activity of Sr@Se and the larger specific surface area of PGCN. In this case, the reduction is ascribed to the direct reduction of CAP (Scheme 2a) to phenylhydroxylamine involving four electrons and four protons, which is the reduction of nitroso derivative into hydroxylamine and two electrons and two protons oxidation of hydroxylamine into a nitroso derivative [48,49] (Scheme 2b). Scheme 2 depicts a proposed electrochemical redox mechanism of CAP.

3.3. pH and CAP Concentrations

The pH of the supporting electrolytes influences peak shape, current, and potential. Figure 4b shows the CV findings towards 250 µM CAP for pH values of 3.0, 5.0, 7.0, 9.0, and 11.0 on Sr@Se/PGCN/GCE. The current increased significantly as the pH increased from 3.0 to 9.0, followed by a gradual redox process from 9.0 to 11.0. The CAP redox reaction was accomplished at pH 9.0 based on developing a well-resolved, sharp, high-intensity peak, offering a broad consideration of the reaction process, and showing the practical use of the as-prepared electrochemical sensor for hassle-free real-time detection. The pH vs. Ipa and pH versus Epa graphs are given in Figure 4c,d, respectively, and the correlated regression equations are as follows (Equations (5)–(7)):
I pa   ( μ A ) = 6.887   [ pH ] 0.947   ( R 2 = 0.9618 )     ( pH :   3 ,   5 ,   7 ,   and   9 )
I pa   ( μ A ) =   6.395   [ pH ] +   115.275   ( R 2 = 1 )     ( pH :   9   and 11 )
E pa   ( V ) = 0.0397   [ pH ]     0.0298   ( R 2   =   0.9237 )
The current investigation shows that CAP is stable in an alkaline medium. At pH 9.0, the CAP oxidation showed an Ipa of 57.72 µA, indicating excellent adsorption on the prepared GCE surface due to the presence of a matrix compound that hinders electron transport with CAP on the fabricated GCE surface. The increase in pH changes the peak potential to the negative side, which might be attributable to modifications in the CAP molecules’ acid–base protonation activities [20]. Based on these findings, this work utilized electrolyte solutions with a pH of 9.0 for all electrochemical experiments.
The electrocatalytic activity and conductivity of Sr@Se/PGCN/GCE were examined using CV at a scan rate of 50 mVs−1 with increasing concentrations of CAP (from 50 to 750 μM), as shown in Figure 4e. The increase in CAP concentration also increased the related Ipa and Ipc values, indicating the remarkable electrocatalytic activity of the Sr@Se/PGCN/GCE. The plot of Ipa and Ipc vs. CAP concentrations is shown in Figure 4f, and the corresponding equations are as follows (Equations (8) and (9)).
I pa   ( μ A ) = 5.5183   C CAP   ( μ M )   +   0.0014   ( R 2   =   0.985 )
I pc   ( μ A ) = 5.2512   C CAP   ( μ M ) 0.00116   ( R 2 = 0.966 )
The synergistic combination of Sr@Se (increased electrocatalytic activity of porosity) and PGCN (higher conductivity and large active surface area) may improve electrochemical performances for the CAP redox reaction.

3.4. Scan Rate

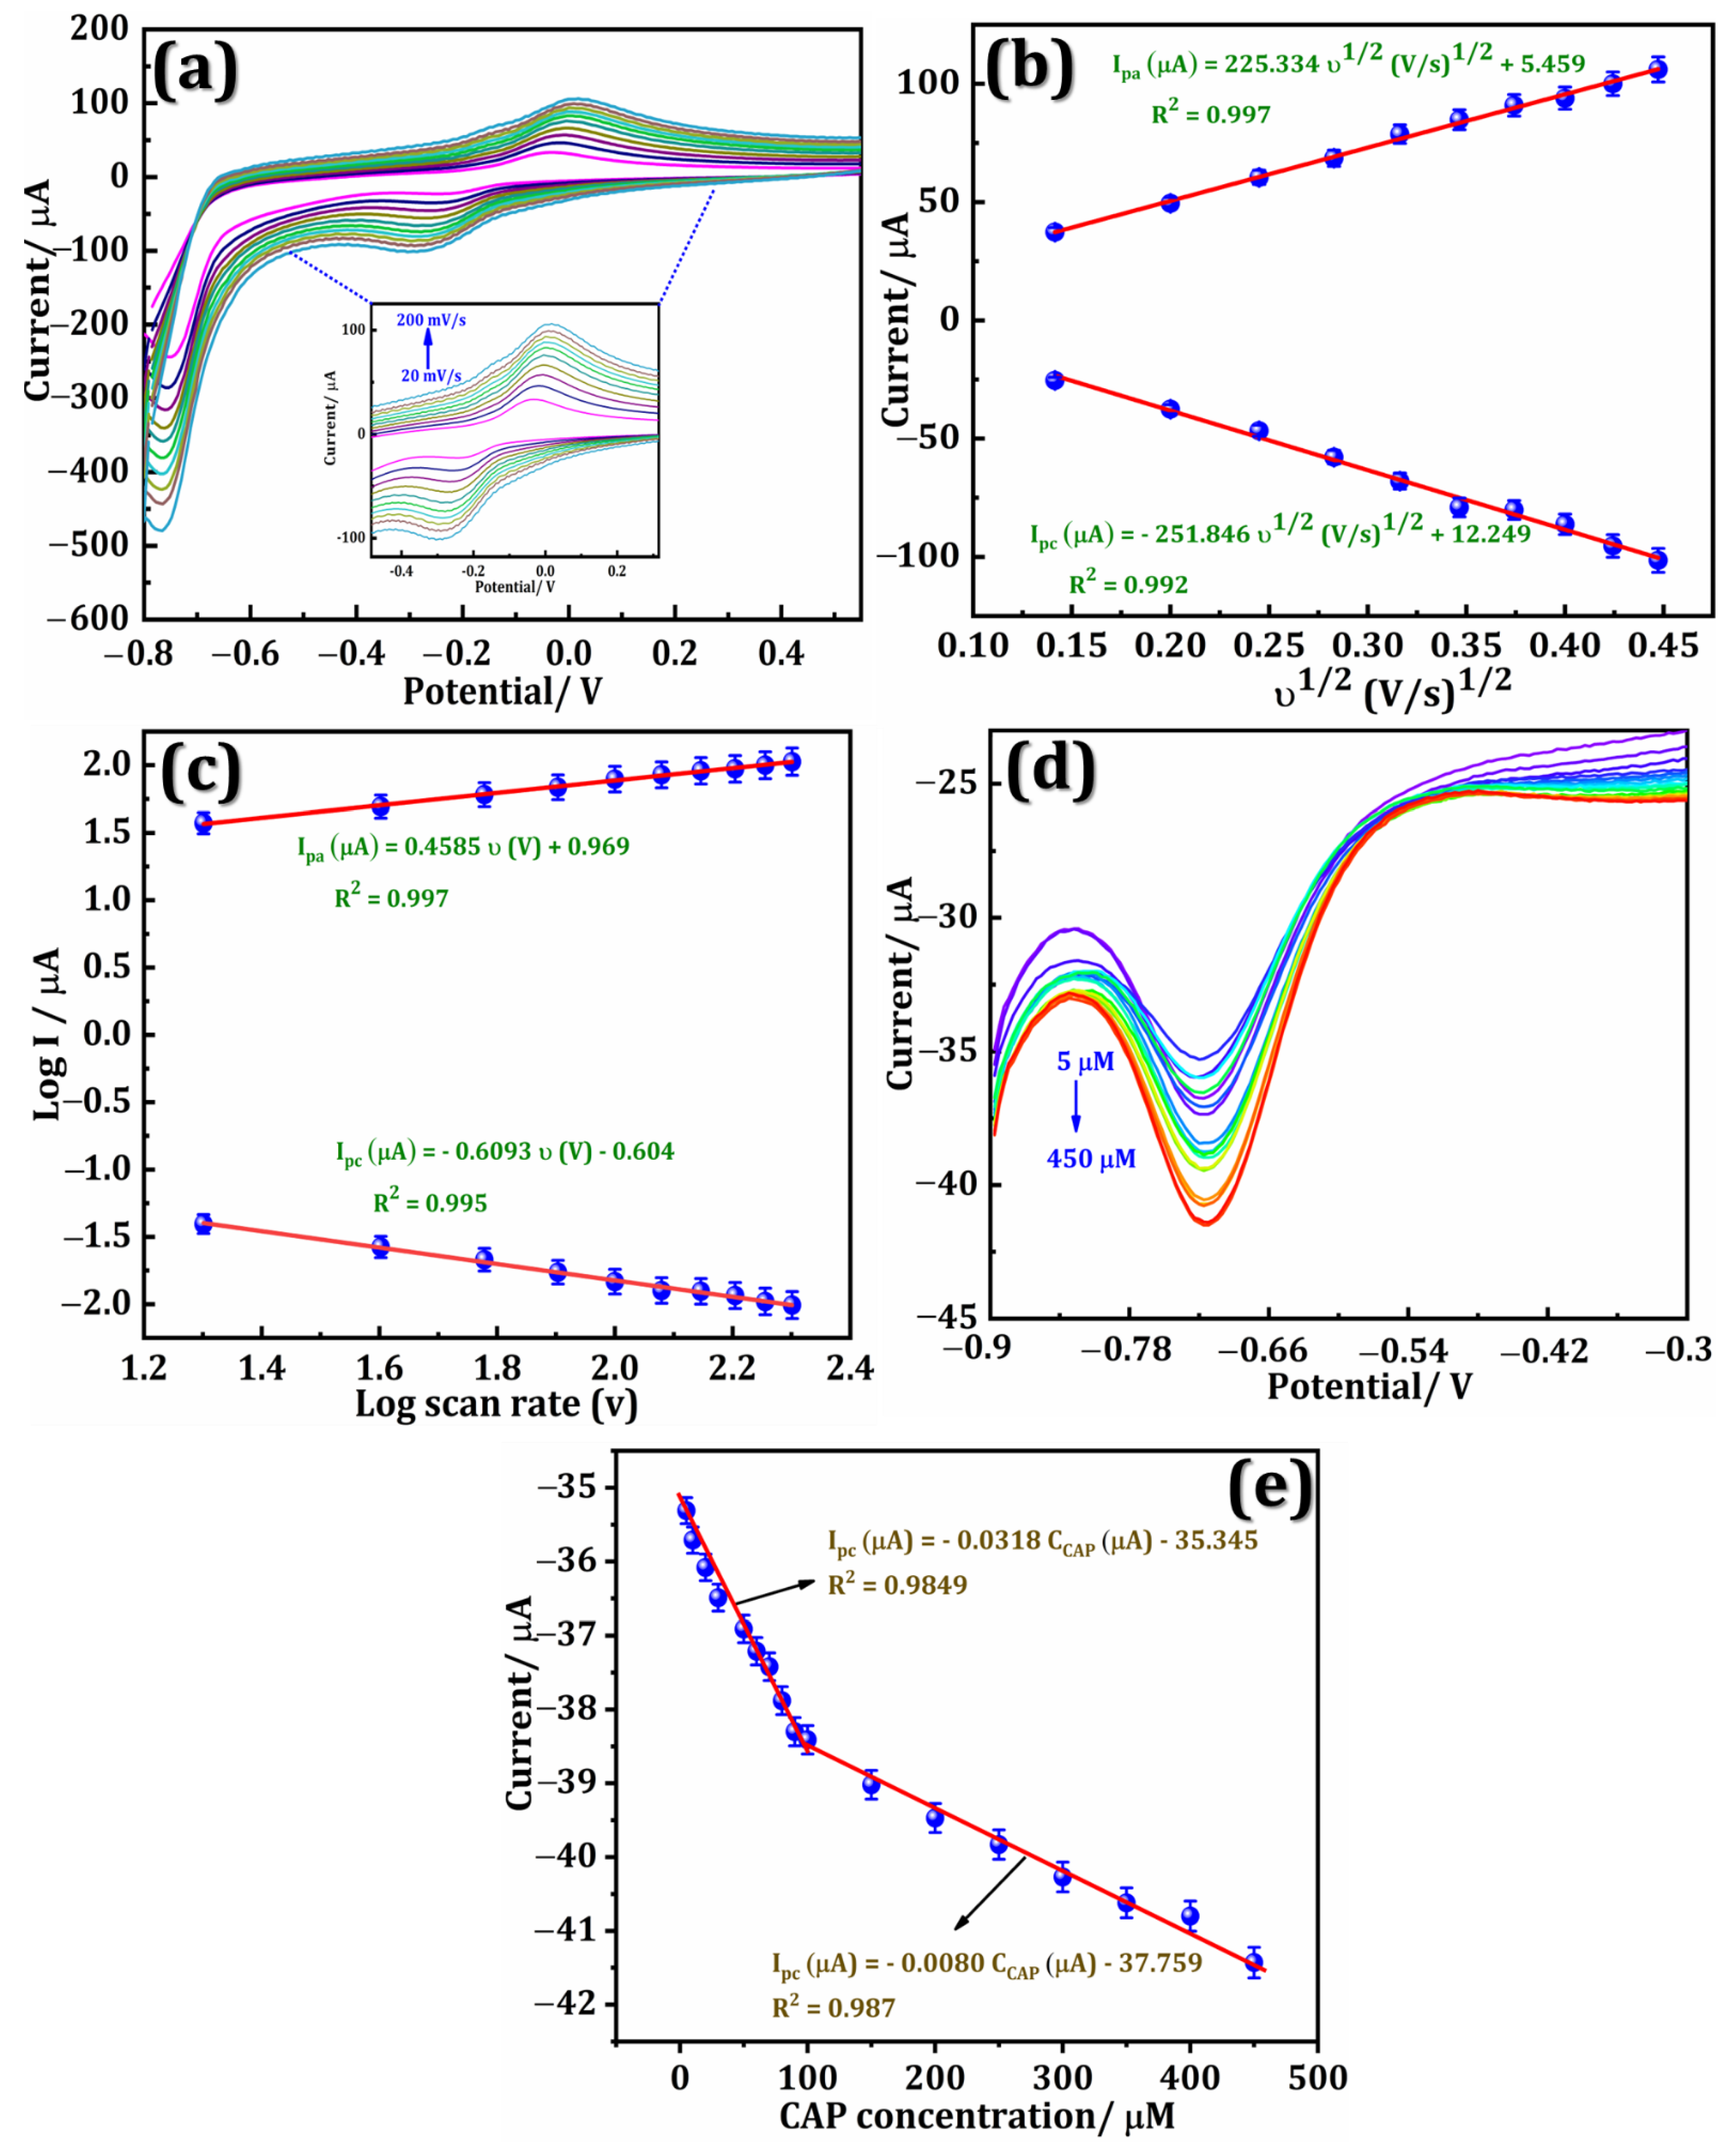
The electrochemical response of Sr@Se/PGCN/GCE in CAP (250 μM) containing 0.1 M PBS (pH 9.0) with increasing scan rates ranging from 20 to 200 mVs−1 was examined to assess the electrode kinetics. As illustrated in Figure 5a, increasing scan rates resulted in a gradual increase in Ipa and Ipc, as well as a significant shift in Epa and Epc. The linear graph of the square root of scan rates vs. Ipa and Ipc, as well as the corresponding linear regression (Equations (10) and (11)), is shown in Figure 5b, showing a diffusion-controlled CAP system on the Sr@Se/PGCN/GCE.
I pa   ( μ A ) = 225.334   υ 1 / 2   ( V / s ) 1 / 2 + 5.439   ( R 2 = 0.995 )
I pc   ( μ A ) = 251.846   υ 1 / 2   ( V / s ) 1 / 2 + 12.249   ( R 2 = 0.992 )
The plot of Epa and Epc vs. log square root of scan rate is shown in Figure 5c, and the equation is as follows (Equations (12) and (13)):
Log   I pa   ( μ A ) = 0.4585   log   υ   ( V ) + 0.969   ( R 2   =   0.997 )
Log   I pc   ( μ A ) = 0.6093   log   υ   ( V ) 0.604   ( R 2   =   0.995 )
The slope was estimated using Equations (12) and (13) and was found to be 0.4585 (Ipa) and 0.6093 (Ipc), which is nearly identical to the theoretical value [50]. This finding demonstrates that the electrochemical redox reaction is a diffusion-controlled mechanism.

3.5. Quantification of CAP

DPV analysis was used to evaluate the CAP detection response on Sr@Se/PGCN/GCE, and the results are displayed in Figure 5d. At a scan rate of 50 mVs−1, the CAP concentration range was linearly increased from 5 to 450 µM (pH 9.0). As seen in Figure 5d, increasing the CAP concentration resulted in a gradual increase in Ipc intensity due to the synergistic activity and non-covalent interaction between Sr@Se and PGCN, which improves electroanalytical performance for the CAP redox reaction. Figure 5e depicts a linear plot of CAP concentration vs. Ipc, with two linear fits recorded. The initial linear regression ranged from 5 to 90 µM, and the related equation is shown below (Equation (14)):
I pc   ( μ A ) = 0.0318   C CAP   ( μ M ) 35.345   ( R 2   =   0.9849 )
The second linear regression was applied to the concentrations ranging from 100 µM to 450 µM using the following regression equation (Equation (15)):
I pc   ( μ A ) = 0.0080   C CAP   ( μ M ) 37.759   ( R 2   =   0.987 )
In this study, the CAP is a reduction reaction. CAP occurs via the shortest electron transfer mechanism between the modified GCE surface and the CAP molecules. The estimated LOD is 2.7 nM, and the sensitivity is 2.25 µA µM−1 cm−2. The electroanalytical activities of the Sr@Se/PGCN/GCE were compared to those of previously described CAP sensors (Table 1).

3.6. Interference Studies

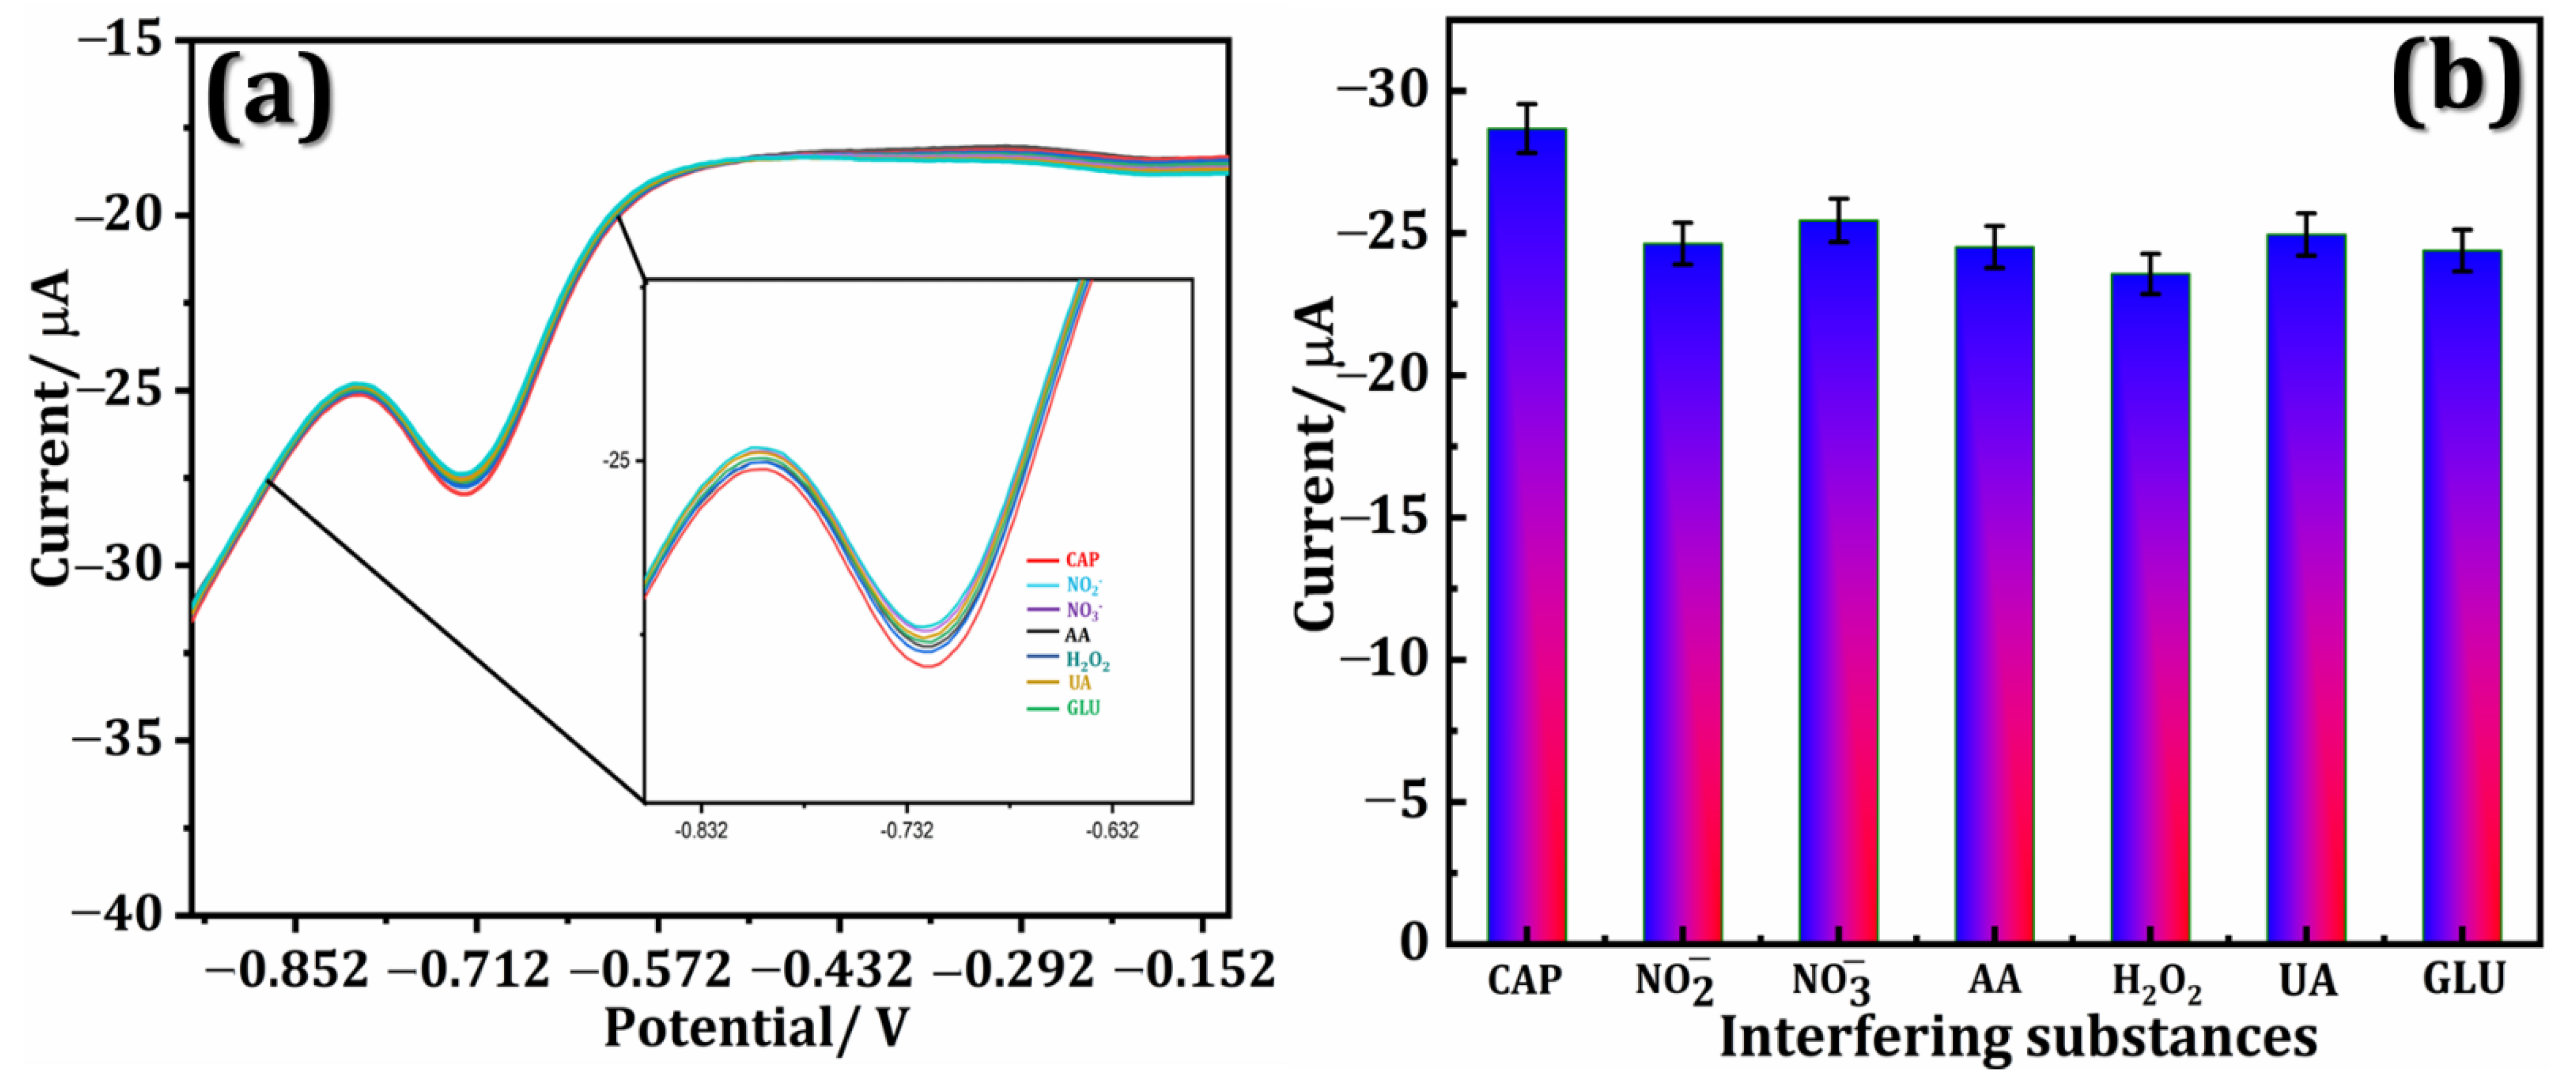
DPV investigated the selectivity of the Sr@Se/PGCN/GCE sensor for CAP reduction with various biological species. The DPV curves of CAP with three-fold concentrations of various interfering species, including CAP, NO2−, NO3, AA, H2O2, UA, and glucose, are shown in Figure 6a. The bar graph reveals that there was no significant change (<8%) in the Ipc values of CAP and interfering species (Figure 6b). As a result, the developed sensor has improved selectivity for CAP detection.

3.7. Reproducibility and Stability

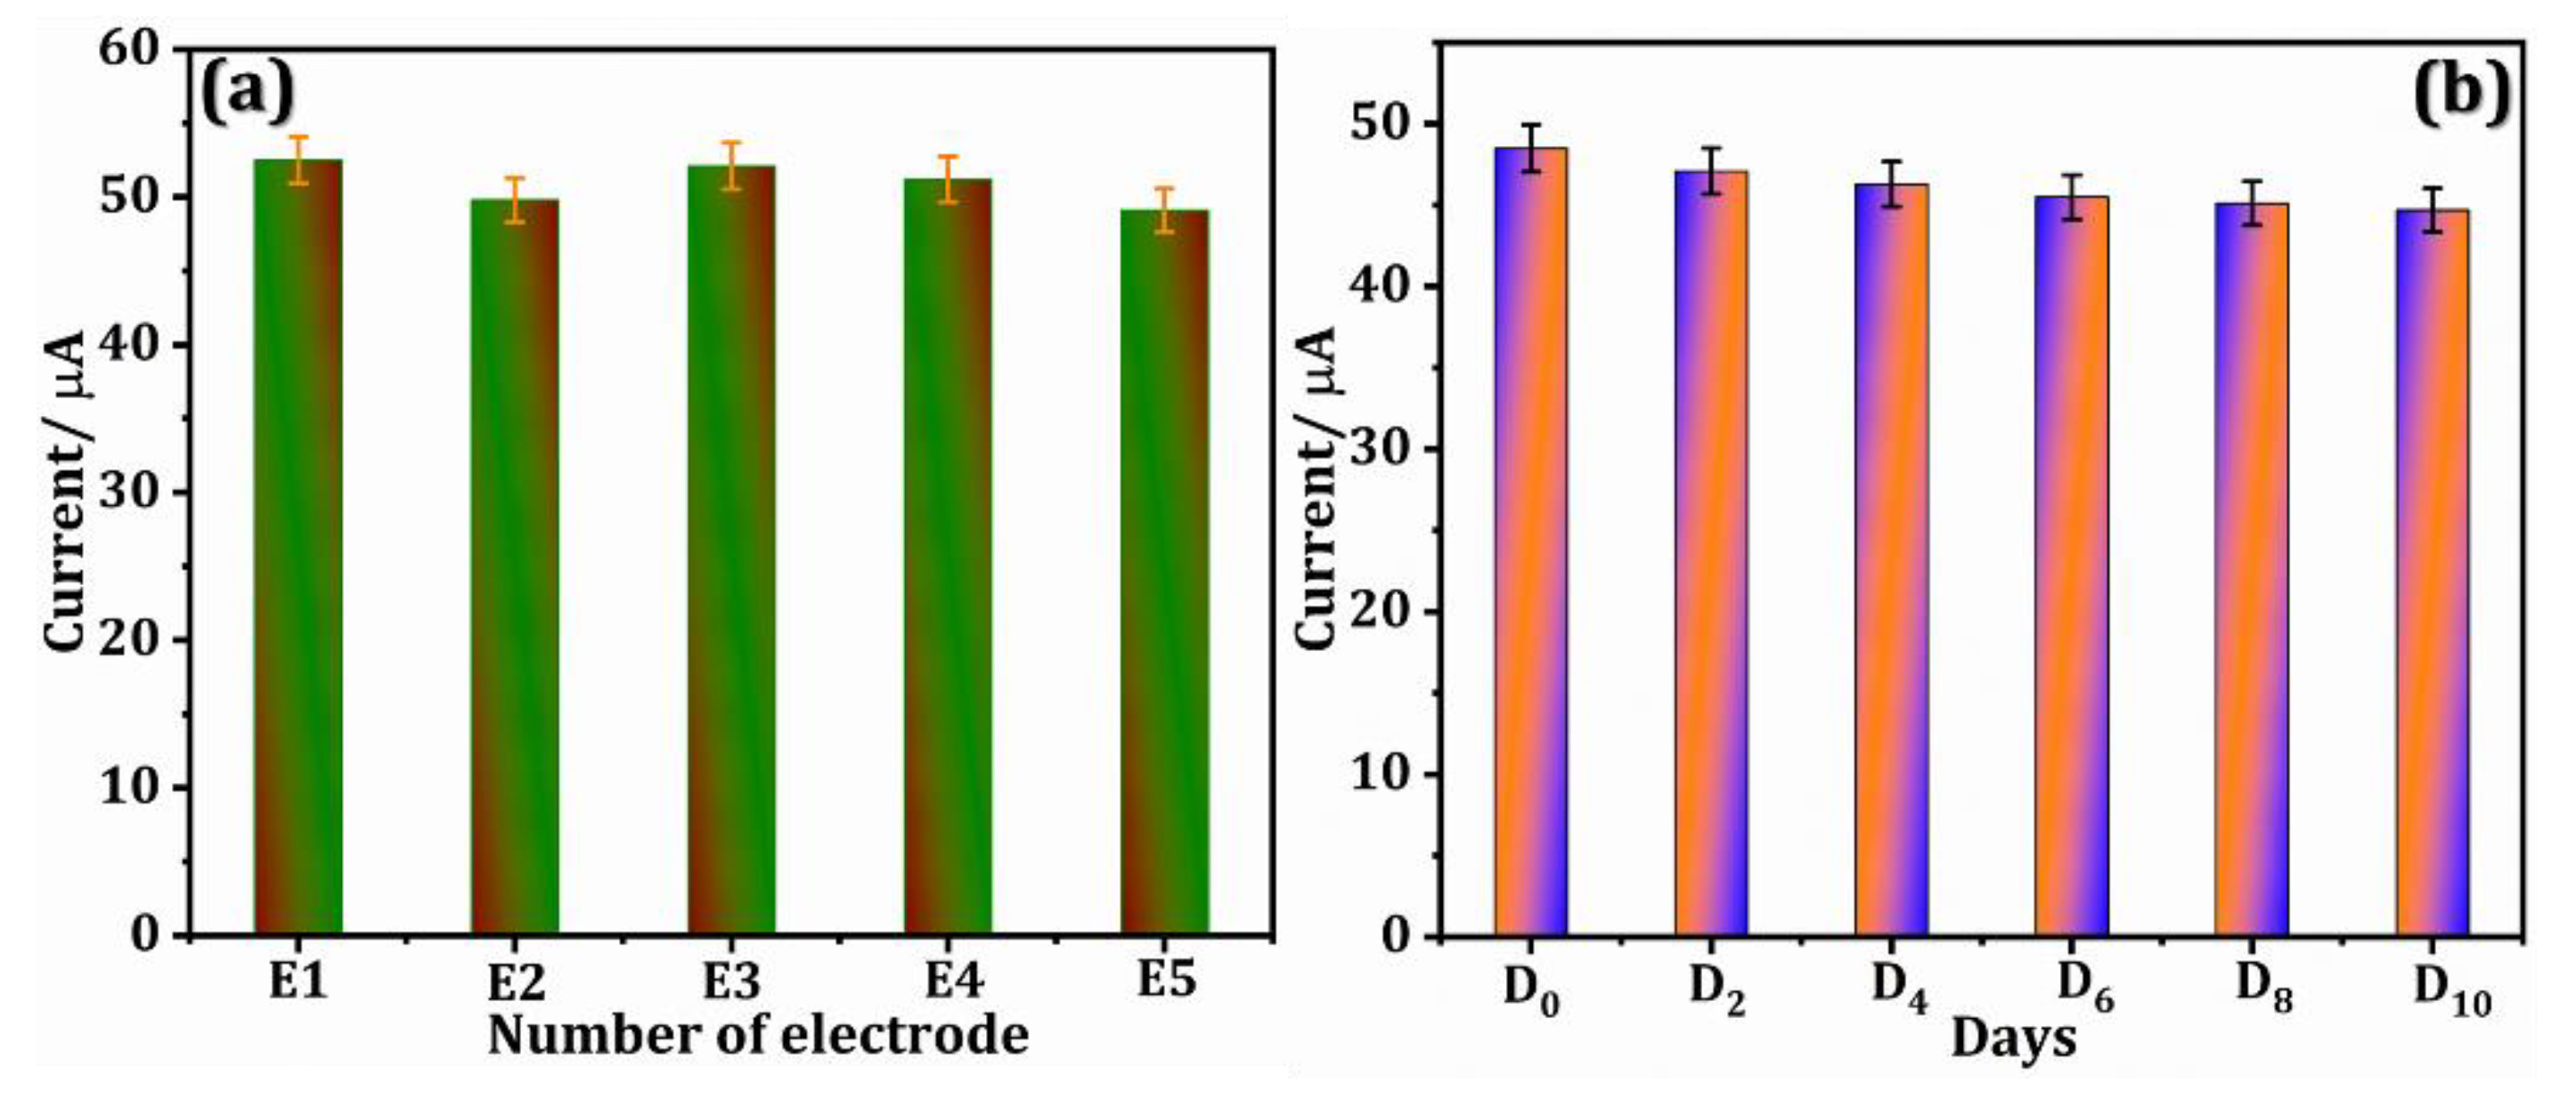
The CV approach was used to assess the reproducibility of five different Sr@Se/PGCN-modified GCEs in 250 µM of CAP. Figure 7a depicts a bar graph of the five GCEs with variations in Ipa values. The RSD was determined to be 2.98%, indicating the Sr@Se/PGCN/GCE sensor’s significant reproducibility. Sr@Se/PGCN/GCE was kept in a 4 °C refrigerator for 10 days to assess storage stability. A bar graph depicts the sensor’s storage stability after 0, 2, 4, 6, 8, and 10 days and the corresponding Ipa values (Figure 7b). After 10 days, the current intensity remained at 80.12% of its initial value, indicating that the Sr@Se/PGCN/GCE sensor has high storage stability.

3.8. Real Sample Analysis

DPV investigated the potential of the Sr@Se/PGCN electrochemical sensor for real-time CAP measurements in food samples such as milk and honey. Before the study, the food samples were taken from nearby stores, and no CAP traces were found. Following that, a known CAP concentration was introduced to the food samples, and the electrochemical responses were investigated. Table 2 summarizes the recovery and RSD results of the milk and honey samples, revealing that the Sr@Se/PGCN/GCE has an appreciable recovery for determining CAP in food samples.

4. Conclusions

In summary, the current study demonstrates a highly sensitive electrochemical sensor for CAP quantification employing Sr@Se/PGCN on a GCE. The electrochemical sensor performed exceptionally well for CAP detection due to the synergistic interaction of Sr@Se and PGCN. Among the modified electrodes, Sr@Se/PGCN/GCE has the highest sensitivity, a wide detection range, a LOD, and admirable reproducibility and stability for CAP detection. The designed chemical sensor was successfully used to detection of CAP in food samples.

Author Contributions

S.B.P.: Writing—Original Draft, Writing—Review and Editing, Methodology, Formal analysis, Data Curation, Visualization. G.K.S.K.: Writing—Review and Editing, Conceptualization, Methodology, S.S.; Writing—Review and Editing, Conceptualization, Methodology, Supervision. S.A.S.: Conceptualization, Methodology. K.C.S.: Methodology, Writing—Review and Editing. B.M.N.: Investigation, Resources, Writing—Review and Editing. R.-J.C.: Conceptualization, Methodology, Supervision, Project administration, Funding acquisition, Writing—Review and Editing. All authors have read and agreed to the published version of the manuscript.

Funding

The authors are grateful for the financial support from the Ministry of Science and Technology of Taiwan (MOST 109-2222-E-027-004; MOST 111-2221-E-027-102).

Institutional Review Board Statement

Not applicable.

Informed Consent Statement

Not applicable.

Acknowledgments

Technical assistance from the Precision Analysis and Material Research Center of the National Taipei University of Technology (Taipei Tech) is appreciated.

Conflicts of Interest

The authors declare no conflict of interest.

References

  1. Yang, G.; Zhao, F. Electrochemical Sensor for Chloramphenicol Based on Novel Multiwalled Carbon Nanotubes@molecularly Imprinted Polymer. Biosens. Bioelectron. 2015, 64, 416–422. [Google Scholar] [CrossRef] [PubMed]
  2. Zhang, X.; Zhang, Y.C.; Zhang, J.W. A Highly Selective Electrochemical Sensor for Chloramphenicol Based on Three-Dimensional Reduced Graphene Oxide Architectures. Talanta 2016, 161, 567–573. [Google Scholar] [CrossRef]
  3. Wang, K.P.; Zhang, Y.C.; Zhang, X.; Shen, L. Green Preparation of Chlorine-Doped Graphene and Its Application in Electrochemical Sensor for Chloramphenicol Detection. SN Appl. Sci. 2019, 1, 157. [Google Scholar] [CrossRef] [Green Version]
  4. Rajaji, U.; Manavalan, S.; Chen, S.M.; Govindasamy, M.; Chen, T.W.; Maiyalagan, T. Microwave-Assisted Synthesis of Europium(III) Oxide Decorated Reduced Graphene Oxide Nanocomposite for Detection of Chloramphenicol in Food Samples. Compos. Part B Eng. 2019, 161, 29–36. [Google Scholar] [CrossRef]
  5. Sniegocki, T.; Posyniak, A.; Gbylik-Sikorska, M.; Zmudzki, J. Determination of Chloramphenicol in Milk Using a QuEChERS-Based on Liquid Chromatography Tandem Mass Spectrometry Method. Anal. Lett. 2014, 47, 568–578. [Google Scholar] [CrossRef]
  6. Kawano, S.I.; Hao, H.Y.; Hashi, Y.; Lin, J.M. Analysis of Chloramphenicol in Honey by On-Line Pretreatment Liquid Chromatography–Tandem Mass Spectrometry. Chinese Chem. Lett. 2015, 26, 36–38. [Google Scholar] [CrossRef]
  7. Ji, W.; Yao, W. Rapid Surface Enhanced Raman Scattering Detection Method for Chloramphenicol Residues. Spectrochim. Acta Part A Mol. Biomol. Spectrosc. 2015, 144, 125–130. [Google Scholar] [CrossRef] [PubMed]
  8. Mamani, M.C.V.; Amaya-Farfan, J.; Reyes, F.G.R.; da Silva, J.A.F.; Rath, S. Use of Experimental Design and Effective Mobility Calculations to Develop a Method for the Determination of Antimicrobials by Capillary Electrophoresis. Talanta 2008, 76, 1006–1014. [Google Scholar] [CrossRef] [PubMed]
  9. Tajik, H.; Malekinejad, H.; Razavi-Rouhani, S.M.; Pajouhi, M.R.; Mahmoudi, R.; Haghnazari, A. Chloramphenicol Residues in Chicken Liver, Kidney and Muscle: A Comparison among the Antibacterial Residues Monitoring Methods of Four Plate Test, ELISA and HPLC. Food Chem. Toxicol. 2010, 48, 2464–2468. [Google Scholar] [CrossRef] [PubMed]
  10. Avula, B.; Sagi, S.; Wang, Y.H.; Zweigenbaum, J.; Wang, M.; Khan, I.A. Corrigendum to “Characterization and Screening of Pyrrolizidine Alkaloids and N-Oxides from Botanicals and Dietary Supplements Using UHPLC-High Resolution Mass Spectrometry” [Food Chem. 178 (2015) 136–148]. Food Chem. 2018, 248, 361–363. [Google Scholar] [CrossRef]
  11. Geng, L.; Huang, J.; Zhai, H.; Shen, Z.; Han, J.; Yu, Y.; Fang, H.; Li, F.; Sun, X.; Guo, Y. Molecularly Imprinted Electrochemical Sensor Based on Multi-Walled Carbon Nanotubes for Specific Recognition and Determination of Chloramphenicol in Milk. Microchem. J. 2022, 182, 107887. [Google Scholar] [CrossRef]
  12. Wang, T.; Yang, L.; Zhang, B.; Liu, J. Extracellular Biosynthesis and Transformation of Selenium Nanoparticles and Application in H2O2 Biosensor. Colloids Surfaces B Biointerfaces 2010, 80, 94–102. [Google Scholar] [CrossRef] [PubMed]
  13. Dumore, N.S.; Mukhopadhyay, M. Antioxidant Properties of Aqueous Selenium Nanoparticles (ASeNPs) and Its Catalysts Activity for 1, 1-Diphenyl-2-Picrylhydrazyl (DPPH) Reduction. J. Mol. Struct. 2020, 1205, 127637. [Google Scholar] [CrossRef]
  14. Zhang, H.; Yang, D.; Ji, Y.; Ma, X.; Xu, J.; Que, D. Selenium Nanotubes Synthesized by a Novel Solution Phase Approach. J. Phys. Chem. B 2004, 108, 1179–1182. [Google Scholar] [CrossRef]
  15. Liu, Y.; Ai, S.; Yuan, R.; Liu, H. Defective Se-Doped In2S3 Nanomaterial-Based Photoelectrochemical Biosensor for the Ultrasensitive Detection of Chloramphenicol. Sens. Actuators B Chem. 2022, 373, 132705. [Google Scholar] [CrossRef]
  16. Feng, H.; Li, J.; Liu, Y.; Xu, Z.; Cui, Y.; Liu, M.; Liu, X.; He, L.; Jiang, J.; Qian, D. Cubic MnSe2 Nanoparticles Dispersed on Multi-Walled Carbon Nanotubes: A Robust Electrochemical Sensing Platform for Chloramphenicol. J. Electroanal. Chem. 2022, 922, 116755. [Google Scholar] [CrossRef]
  17. Prasad, K.S.; Vaghasiya, J.V.; Soni, S.S.; Patel, J.; Patel, R.; Kumari, M.; Jasmani, F.; Selvaraj, K. Microbial Selenium Nanoparticles (SeNPs) and Their Application as a Sensitive Hydrogen Peroxide Biosensor. Appl. Biochem. Biotechnol. 2015, 177, 1386–1393. [Google Scholar] [CrossRef]
  18. Praharaj, R.; Mishra, S.; Rautray, T.R. The Structural and Bioactive Behaviour of Strontium-Doped Titanium Dioxide Nanorods. J. Korean Ceram. Soc. 2020, 57, 271–280. [Google Scholar] [CrossRef]
  19. Taha, K.K.; Mustafa, M.M.; Ahmed, H.A.M.; Talab, S. Selenium Zinc Oxide (Se/ZnO) Nanoparticles: Synthesis, Characterization, and Photocatalytic Activity. Z. Naturforsch. A 2019, 74, 1043–1056. [Google Scholar] [CrossRef]
  20. Hwa, K.Y.; Ganguly, A.; Santhan, A.; Sharma, T.S.K. Construction of Three-Dimensional/One-Dimensional Heterostructure of Flower-like Sr Nanoflowers on Se Microrods Decorated on Reduced Graphene Oxide: An Efficient Electrocatalyst for Oxidation of Promethazine Hydrochloride. Mater. Today Chem. 2022, 23, 100654. [Google Scholar] [CrossRef]
  21. Iqbal, M.F.; Ashiq, M.N.; Razaq, A.; Saleem, M.; Parveen, B.; Hassan, M.U. Excellent Electrochemical Performance of Graphene Oxide Based Strontium Sulfide Nanorods for Supercapacitor Applications. Electrochim. Acta 2018, 273, 136–144. [Google Scholar] [CrossRef]
  22. Fethi, A. Novel Materials for Electrochemical Sensing Platforms. Sens. Int. 2020, 1, 100035. [Google Scholar] [CrossRef]
  23. Zhao, Z.; Sun, Y.; Dong, F. Graphitic Carbon Nitride Based Nanocomposites: A Review. Nanoscale 2015, 7, 15–37. [Google Scholar] [CrossRef] [PubMed]
  24. Mishra, A.; Mehta, A.; Basu, S.; Shetti, N.P.; Reddy, K.R.; Aminabhavi, T.M. Graphitic Carbon Nitride (g–C3N4)–Based Metal-Free Photocatalysts for Water Splitting: A Review. Carbon N. Y. 2019, 149, 693–721. [Google Scholar] [CrossRef]
  25. Lou, W.; Ali, A.; Shen, P.K. Recent Development of Au Arched Pt Nanomaterials as Promising Electrocatalysts for Methanol Oxidation Reaction. Nano Res. 2022, 15, 18–37. [Google Scholar] [CrossRef]
  26. Chan, M.-H.; Liu, R.-S.; Hsiao, M. Graphitic Carbon Nitride-Based Nanocomposites and Their Biological Applications: A Review. Nanoscale 2019, 11, 14993–15003. [Google Scholar] [CrossRef]
  27. Qiu, Y.; Xin, L.; Jia, F.; Xie, J.; Li, W. Three-Dimensional Phosphorus-Doped Graphitic-C3N4 Self-Assembly with NH2-Functionalized Carbon Composite Materials for Enhanced Oxygen Reduction Reaction. Langmuir 2016, 32, 12569–12578. [Google Scholar] [CrossRef]
  28. Bian, J.; Huang, C.; Zhang, R.-Q. Graphitic Carbon Nitride Film: An Emerging Star for Catalytic and Optoelectronic Applications. ChemSusChem 2016, 9, 2723–2735. [Google Scholar] [CrossRef]
  29. Ran, J.; Ma, T.Y.; Gao, G.; Du, X.-W.; Qiao, S.Z. Porous P-Doped Graphitic Carbon Nitride Nanosheets for Synergistically Enhanced Visible-Light Photocatalytic H 2 Production. Energy Environ. Sci. 2015, 8, 3708–3717. [Google Scholar] [CrossRef]
  30. Wu, M.; Zhang, J.; He, B.B.; Wang, H.W.; Wang, R.; Gong, Y.S. In-Situ Construction of Coral-like Porous P-Doped g-C3N4 Tubes with Hybrid 1D/2D Architecture and High Efficient Photocatalytic Hydrogen Evolution. Appl. Catal. B Environ. 2019, 241, 159–166. [Google Scholar] [CrossRef]
  31. Chai, B.; Yan, J.; Wang, C.; Ren, Z.; Zhu, Y. Enhanced Visible Light Photocatalytic Degradation of Rhodamine B over Phosphorus Doped Graphitic Carbon Nitride. Appl. Surf. Sci. 2017, 391, 376–383. [Google Scholar] [CrossRef]
  32. Veerakumar, P.; Rajkumar, C.; Chen, S.-M.; Thirumalraj, B.; Lin, K.-C. Ultrathin 2D Graphitic Carbon Nitride Nanosheets Decorated with Silver Nanoparticles for Electrochemical Sensing of Quercetin. J. Electroanal. Chem. 2018, 826, 207–216. [Google Scholar] [CrossRef]
  33. Selvarajan, S.; Suganthi, A.; Rajarajan, M. Fabrication of G-C3N4/NiO Heterostructured Nanocomposite Modified Glassy Carbon Electrode for Quercetin Biosensor. Ultrason. Sonochem. 2018, 41, 651–660. [Google Scholar] [CrossRef] [PubMed]
  34. Puziy, A.; Poddubnaya, O.; Gawdzik, B.; Tascón, J.M.D. Phosphorus-Containing Carbons: Preparation, Properties and Utilization. Carbon N. Y. 2020, 157, 796–846. [Google Scholar] [CrossRef]
  35. Wang, J.; Liao, T.; Wei, Z.; Sun, J.; Guo, J.; Sun, Z. Heteroatom-Doping of Non-Noble Metal-Based Catalysts for Electrocatalytic Hydrogen Evolution: An Electronic Structure Tuning Strategy. Small Methods 2021, 5, 2000988. [Google Scholar] [CrossRef] [PubMed]
  36. Hasija, V.; Sudhaik, A.; Raizada, P.; Hosseini-Bandegharaei, A.; Singh, P. Carbon Quantum Dots Supported AgI /ZnO/Phosphorus Doped Graphitic Carbon Nitride as Z-Scheme Photocatalyst for Efficient Photodegradation of 2, 4-Dinitrophenol. J. Environ. Chem. Eng. 2019, 7, 103272. [Google Scholar] [CrossRef]
  37. Márquez-Herrera, A.; Ovando-Medina, V.M.; Castillo-Reyes, B.E.; Zapata-Torres, M.; Meléndez-Lira, M.; González-Castañeda, J. Facile Synthesis of SrCO3-Sr(OH)2/PPy Nanocomposite with Enhanced Photocatalytic Activity under Visible Light. Materials 2016, 9, 30. [Google Scholar] [CrossRef] [PubMed] [Green Version]
  38. Maqbool, M.; Nawaz, Q.; Rehman, M.A.U.; Cresswell, M.; Jackson, P.; Hurle, K.; Detsch, R.; Goldmann, W.H.; Shah, A.T.; Boccaccini, A.R. Synthesis, Characterization, Antibacterial Properties, and In Vitro Studies of Selenium and Strontium Co-Substituted Hydroxyapatite. Int. J. Mol. Sci. 2021, 22, 4246. [Google Scholar] [CrossRef] [PubMed]
  39. Bandyopadhyay, A.; Ghosh, D.; Kaley, N.M.; Pati, S.K. Photocatalytic Activity of G-C3N4 Quantum Dots in Visible Light: Effect of Physicochemical Modifications. J. Phys. Chem. C 2017, 121, 1982–1989. [Google Scholar] [CrossRef]
  40. Ji, H.; Zhang, L.; Hu, C. Chemical-Bond Conjugated BiO(OH)xI1−x-AgI Heterojunction with High Visible Light Activity and Stability in Degradation of Pollutants. Appl. Catal. B Environ. 2017, 218, 443–451. [Google Scholar] [CrossRef]
  41. Jiang, D.; Cao, L.; Liu, W.; Su, G.; Qu, H.; Sun, Y.; Dong, B. Synthesis and Luminescence Properties of Core/Shell ZnS:Mn/ZnO Nanoparticles. Nanoscale Res. Lett. 2009, 4, 78–83. [Google Scholar] [CrossRef] [Green Version]
  42. Karimi-Maleh, H.; Darabi, R.; Shabani-Nooshabadi, M.; Baghayeri, M.; Karimi, F.; Rouhi, J.; Alizadeh, M.; Karaman, O.; Vasseghian, Y.; Karaman, C. Determination of D&C Red 33 and Patent Blue V Azo Dyes Using an Impressive Electrochemical Sensor Based on Carbon Paste Electrode Modified with ZIF-8/g-C3N4/Co and Ionic Liquid in Mouthwash and Toothpaste as Real Samples. Food Chem. Toxicol. 2022, 162, 112907. [Google Scholar] [PubMed]
  43. Sanjay, B.P.; Sandeep, S.; Santhosh, A.S.; Karthik, C.S.; Varun, D.N.; Kumara Swamy, N.; Mallu, P.; Nithin, K.S.; Rajabathar, J.R.; Muthusamy, K. Unprecedented 2D GNR-CoB Nanocomposite for Detection and Degradation of Malachite Green—A Computational Prediction of Degradation Pathway and Toxicity. Chemosphere 2022, 287, 132153. [Google Scholar] [CrossRef] [PubMed]
  44. Krzyczmonik, P.; Socha, E.; Skrzypek, S.; Soliwoda, K.; Celichowski, G.; Grobelny, J. Honeycomb-Structured Porous Poly(3,4-Ethylenedioxythiophene) Composite Layers on a Gold Electrode. Thin Solid Films 2014, 565, 54–61. [Google Scholar] [CrossRef]
  45. Li, X.; Wang, X.; Li, J.; Liu, G.; Jia, D.; Ma, Z.; Zhang, L.; Peng, Z.; Zhu, X. High-Performance, Flexible, Binder-Free Silicon–Carbon Anode for Lithium Storage Applications. Electrochem. Commun. 2022, 137, 107257. [Google Scholar] [CrossRef]
  46. Santos, A.M.; Wong, A.; Fatibello-Filho, O. Simultaneous Determination of Salbutamol and Propranolol in Biological Fluid Samples Using an Electrochemical Sensor Based on Functionalized-Graphene, Ionic Liquid and Silver Nanoparticles. J. Electroanal. Chem. 2018, 824, 1–8. [Google Scholar] [CrossRef]
  47. Li, J.; Kuang, D.; Feng, Y.; Zhang, F.; Xu, Z.; Liu, M. A Graphene Oxide-Based Electrochemical Sensor for Sensitive Determination of 4-Nitrophenol. J. Hazard. Mater. 2012, 201–202, 250–259. [Google Scholar] [CrossRef]
  48. Karthik, R.; Govindasamy, M.; Chen, S.-M.; Mani, V.; Lou, B.-S.; Devasenathipathy, R.; Hou, Y.-S.; Elangovan, A. Green Synthesized Gold Nanoparticles Decorated Graphene Oxide for Sensitive Determination of Chloramphenicol in Milk, Powdered Milk, Honey and Eye Drops. J. Colloid Interface Sci. 2016, 475, 46–56. [Google Scholar] [CrossRef]
  49. Karthik, R.; Vinoth Kumar, J.; Chen, S.M.; Karuppiah, C.; Cheng, Y.H.; Muthuraj, V. A Study of Electrocatalytic and Photocatalytic Activity of Cerium Molybdate Nanocubes Decorated Graphene Oxide for the Sensing and Degradation of Antibiotic Drug Chloramphenicol. ACS Appl. Mater. Interfaces 2017, 9, 6547–6559. [Google Scholar] [CrossRef]
  50. Bhuvaneswari, C.; Ganesh Babu, S. Nanoarchitecture and Surface Engineering Strategy for the Construction of 3D Hierarchical CuS-RGO/g-C3N4 Nanostructure: An Ultrasensitive and Highly Selective Electrochemical Sensor for the Detection of Furazolidone Drug. J. Electroanal. Chem. 2022, 907, 116080. [Google Scholar] [CrossRef]
  51. Zaveri, N.; Sun, R.; Zufelt, N.; Zhou, A.; Chen, Y.Q. Evaluation of Microbially Influenced Corrosion with Electrochemical Noise Analysis and Signal Processing. Electrochim. Acta 2007, 52, 5795–5807. [Google Scholar] [CrossRef]
  52. Yang, B.; Shao, M.; Xu, Y.; Du, Y.; Yang, H.; Bin, D.; Liu, B.; Lu, H. Core–Shell ZIF-8@ZIF-67-Derived Cobalt Nanoparticles In Situ Grown on N-doped Carbon Nanotube Polyhedra for Ultrasensitive Electrochemical Detection of Chloramphenicol. ChemElectroChem 2022, 9, e202200438. [Google Scholar] [CrossRef]
  53. Chang, C.; Wang, Q.; Xue, Q.; Liu, F.; Hou, L.; Pu, S. Highly Efficient Detection of Chloramphenicol in Water Using Ag and TiO2 Nanoparticles Modified Laser-Induced Graphene Electrode. Microchem. J. 2022, 173, 107037. [Google Scholar] [CrossRef]
  54. Gopi, P.K.; Srinithi, S.; Chen, S.-M.; Hunsur Ravikumar, C. Simple Construction of GdBiVO 4 Assembled on Reduced Graphene Oxide for Selective and Sensitive Electrochemical Detection of Chloramphenicol in Food Samples. New J. Chem. 2022, 46, 1577–1587. [Google Scholar] [CrossRef]
  55. Umesh, N.; Sathiyan, A.; Wang, S.F.; Elanthamilan, E.; Merlin, J.P.; Jesila, J.A. A Simple Chemical Approach for Synthesis of Sr2Co2O5 Nanoparticles and Its Application in the Detection of Chloramphenicol and in Energy Storage Systems. J. Electroanal. Chem. 2021, 880, 114911. [Google Scholar] [CrossRef]
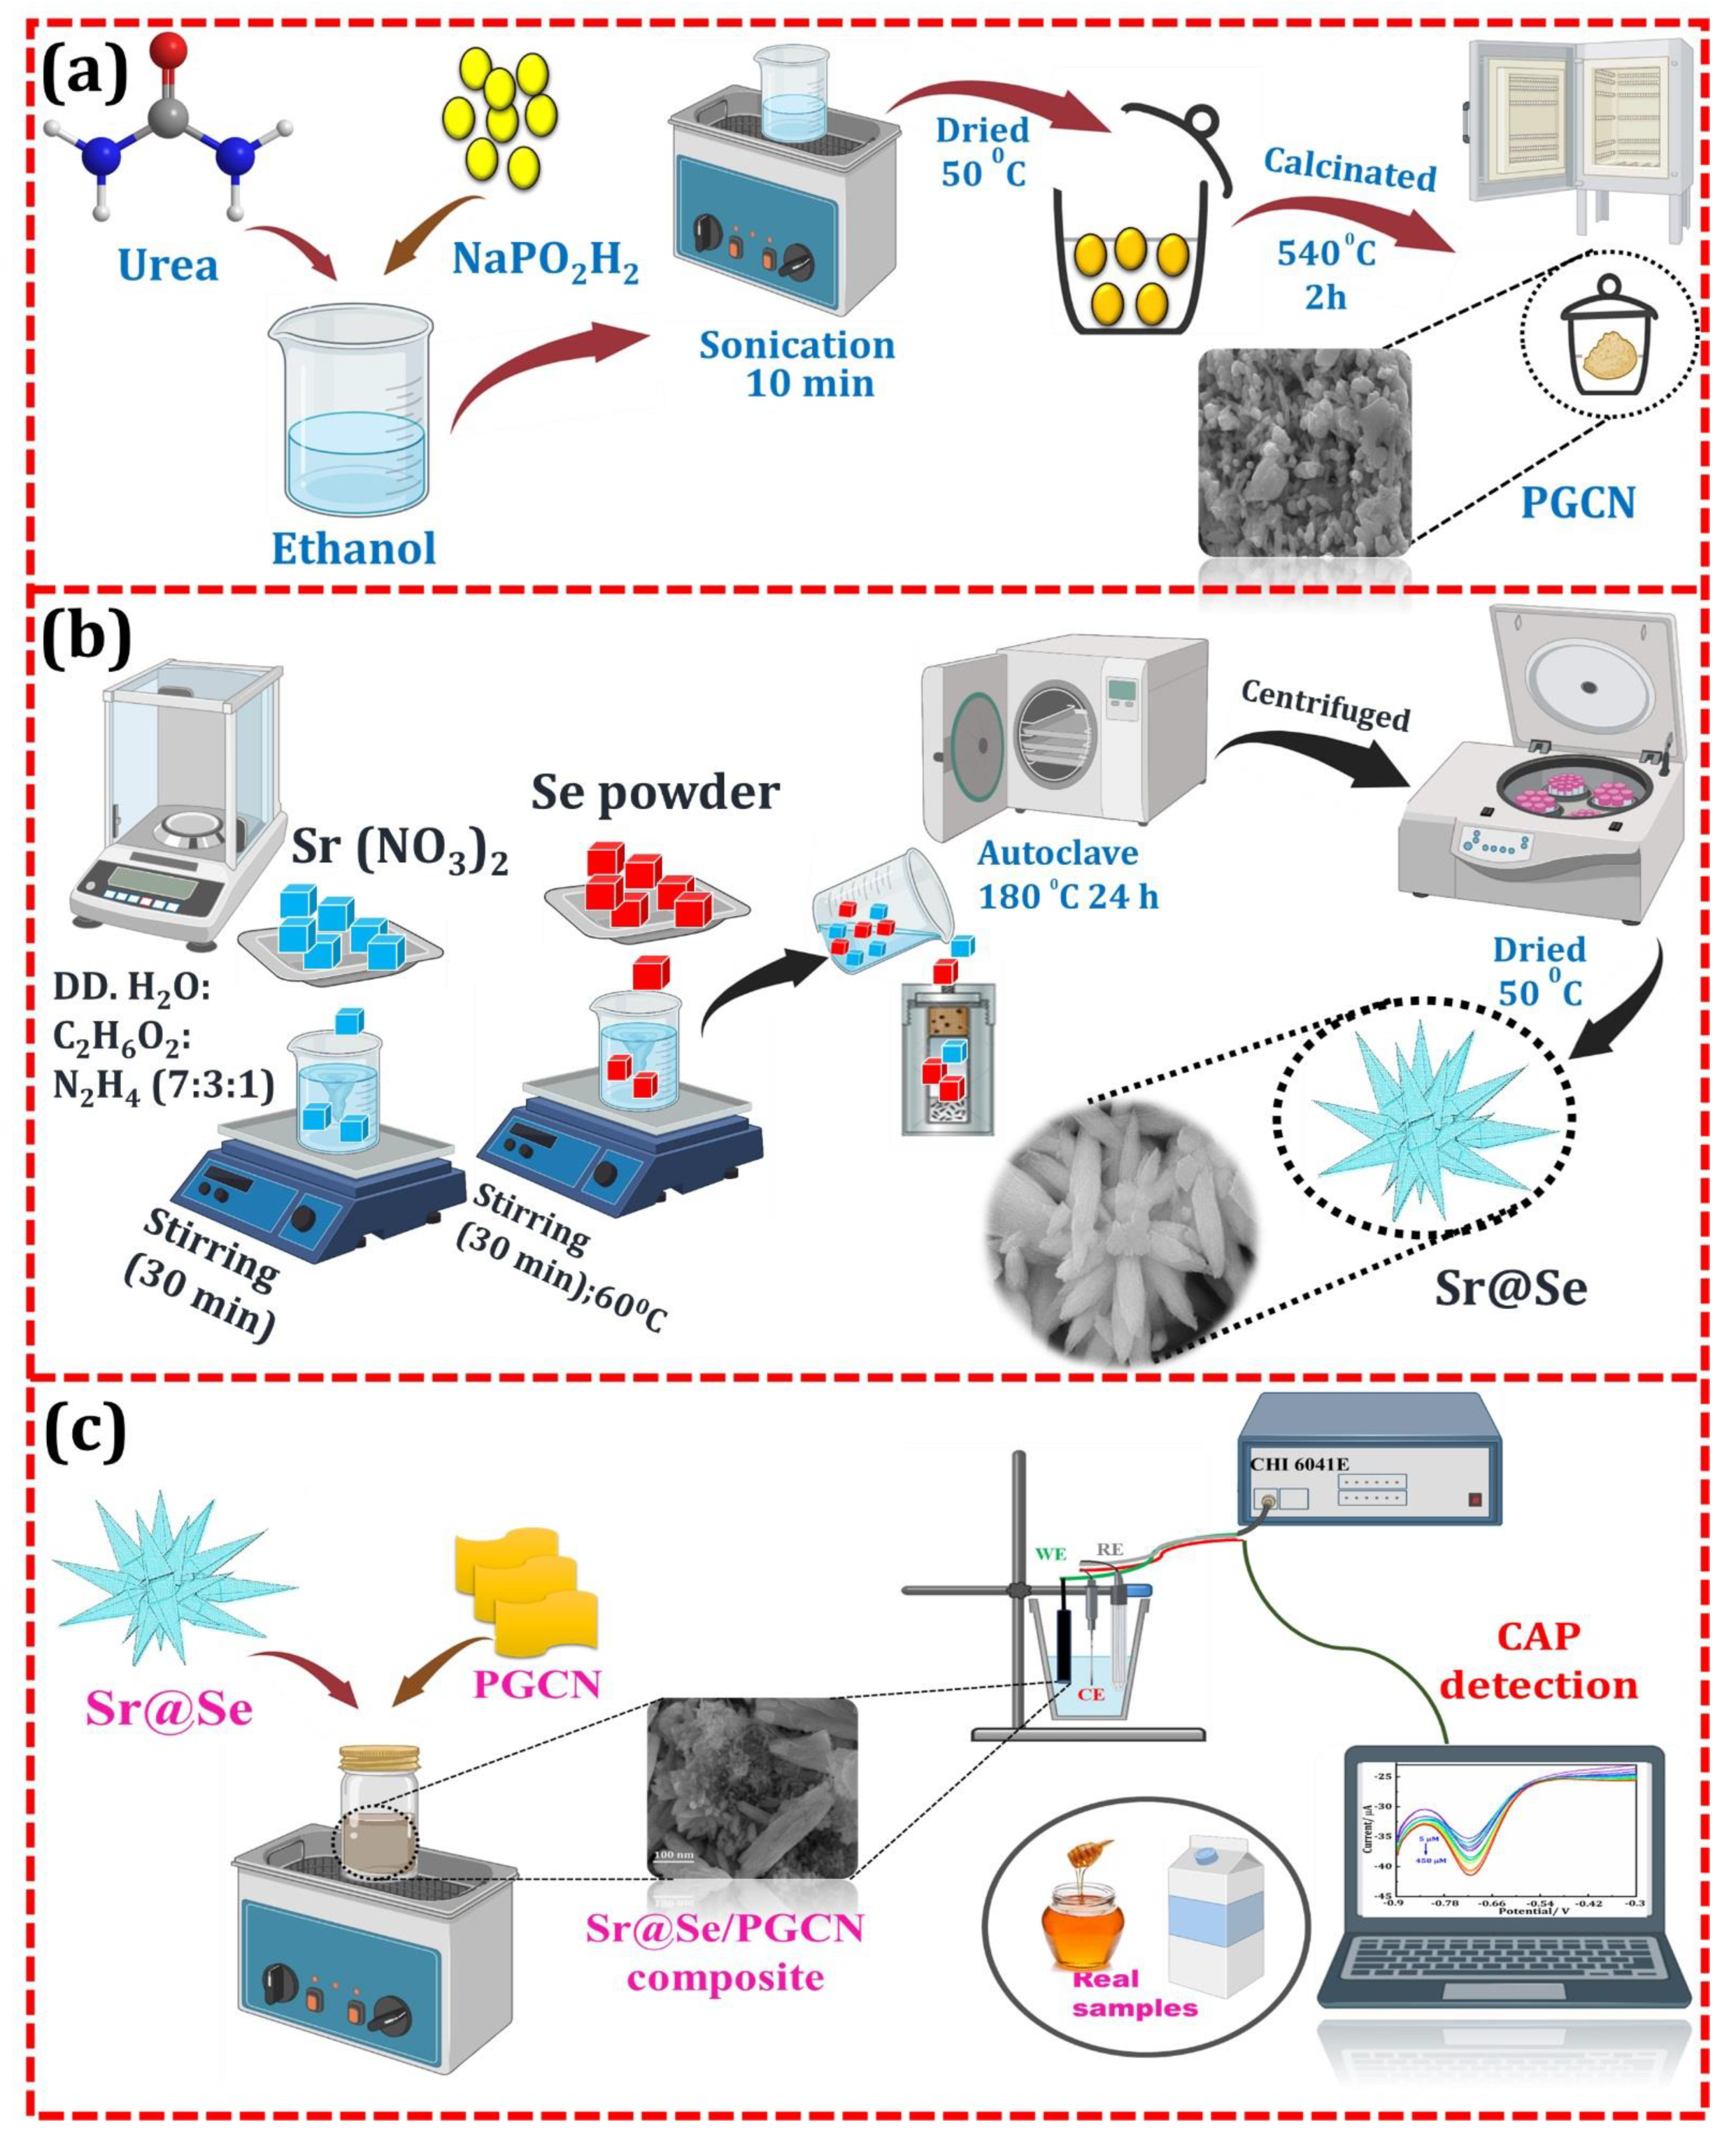
Scheme 1. (a) Synthesis of PGCN, (b) synthesis scheme of Sr@Se, and (c) preparation of electrocatalyst and its application for the electrochemical measurement of CAP in the real sample application.
Chemosensors 10 00425 sch001
Figure 1. (a) XRD spectrum of Sr@Se, (b) PGCN, (c) Sr@Se/PGCN composite, and (d) FT-IR spectra of Sr@Se, PGCN, and Sr@Se/PGCN composite.
Chemosensors 10 00425 g001
Figure 2. FE-SEM images of (a,b) Sr@Se, (c) PGCN, and (d) Sr@Se/PGCN nanocomposite and (e) EDX spectra of nanocomposite with corresponding weight percentages (inset).
Chemosensors 10 00425 g002
Figure 3. (a) CV curves and (b) EIS spectra and, (c) Tafel plot for bare GCE, Sr@Se/GCE, PGCN/GCE, and Sr@Se/PGCN/GCE in a 5 mm [Fe(CN)6]3−/4− a solution containing 0.1 M KCl.
Chemosensors 10 00425 g003
Figure 4. (a) CV curves of bare GCE, Sr@Se/GCE, PGCN/GCE, and Sr@Se/PGCN/GCE in 250 µM of CAP (pH 9.0) and (b) CV curves of CAP (250 µM) at pH 3, 5, 7, 9, and 11. Linear plots of (c) current and (d) potential at different pH values. (e) CV responses with increasing CAP concentration from 50 to 750 µM in (pH 9.0) on the Sr@Se/PGCN/GCE and (f) corresponding linear plots.
Chemosensors 10 00425 g004
Scheme 2. Plausible electrochemical mechanism of CAP.
Chemosensors 10 00425 sch002
Figure 5. (a) CV curves for scan rate ranging from 20 mVs−1 to 200 mVs−1 in the presence of 250 µM CAP (0.1 M PBS, pH 9.0). Linear plots of (b) current vs. square root of scan rate and (c) log current vs. log square root of the scan rate. (d) DPV curves of the Sr@Se/PGCN/GCE were obtained at the CAP concentration ranging from 5 to 450 μM in 0.1 M PBS (pH 9). (e) Linear graph of increasing concentration of CAP against Ipc.
Chemosensors 10 00425 g005
Figure 6. (a) DPV curves for the Sr@Se/PGCN/GCE in the presence of CAP and CAP with different interfering substances, and (b) Bar graph of different interfering substances versus Ipc.
Chemosensors 10 00425 g006
Figure 7. (a) Bar graphs for the reproducibility study and (b) storage stability of the Sr@Se/PGCN/GCE in 250 µM CAP.
Chemosensors 10 00425 g007
Table 1. Electroanalytical characteristics of Sr@Se/PGCN/GCE and other electrocatalysts.
ElectrocatalystDetection Technique pH ValuesLinear Range (µM)LOD (nM)References
Fe3O4/Au/GCEDPV51.0–12144[51]
Co@NCNP/GCEDPV75–268.83500[52]
Ag/CMC@TiO2/LIGDPV70.01–1007[53]
GdBiVO4@rGO/SPCEDPV70.05–2336.5522.9[54]
Sr2Co2O5/GCEDPV70.01–931.12.3[55]
Sr@Se/PGCN/GCEDPV95–4502.7Present work
Table 2. Determination of CAP in milk and honey samples using the Sr@Se/PGCN/GCE sensor.
SamplesAdded (µM)Found (µM)Recovery
(%)
RSD
(%)
Chemosensors 10 00425 i001
Milk
5049.9799.402.8
10099.999.92.3
Chemosensors 10 00425 i002
Honey
5049.590.03.6
10099.9599.772.8
Publisher’s Note: MDPI stays neutral with regard to jurisdictional claims in published maps and institutional affiliations.