Article

Facile Preparation of Ag-NP-Deposited HRGB-SERS Substrate for Detection of Polycyclic Aromatic Hydrocarbons in Water

1
Faculty of Geosciences and Environmental Engineering, Southwest Jiaotong University, Chengdu 610031, China
2
State-Province Joint Engineering Laboratory of Spatial Information Technology of High-Speed Rail Safety, Chengdu 610031, China
*
Author to whom correspondence should be addressed.
Chemosensors 2022, 10(10), 406; https://doi.org/10.3390/chemosensors10100406
Submission received: 13 September 2022 / Revised: 1 October 2022 / Accepted: 6 October 2022 / Published: 10 October 2022
(This article belongs to the Special Issue Nanoparticles in Chemical and Biological Sensing)

Abstract

:
In this study, a surface-enhanced Raman scattering (SERS) substrate based on high-refractive-index reflective glass beads (HRGBs) was prepared by a facile method and successfully applied to the detection of polycyclic aromatic hydrocarbons (PAHs). The HRGB-SERS substrate was prepared by depositing silver nanoparticles (Ag NPs) onto the surface of HRGBs. The preparation procedure of the substrate was simplified by accelerating the hydrolysis of (3-Aminopropyl) trimethoxysilane (APTMS) and increasing the concentration of Ag NPs. Compared with previous methods, the HRGB-SERS substrate prepared with one round of deposition has the same detection performance, a simpler preparation process, and lower cost. Additionally, halide ions were used to modify the substrate to increase the detection sensitivity of PAHs. Adding 10 mM KBr solution to the HRGB-SERS substrate was found to achieve the best modification effect. Under the optimal modification conditions, the detection sensitivity of pyrene was improved by 3 orders of magnitude (10−7 M). Due to the HRGB-SERS substrate’s excellent performance, the rapid identification and trace detection of spiked water samples mixed with anthracene, phenanthrene, and pyrene was realized using a Raman spectrometer with only a volume of 10 μL of the water samples.

1. Introduction

Polycyclic aromatic hydrocarbons (PAHs) are a group of organic pollutants with carcinogenic, mutagenic, and teratogenic effects [1], and they are widely distributed in the air [2,3], soil [4], and water [5,6]. PAHs in the environment come from a wide range of sources, and almost all types of organic matter may release PAHs during incomplete combustion [7]. In nature, several biochemical processes that are required for the growth of microorganisms and higher plants synthesize PAHs. Coal, oil, asphalt, and other substances also contain PAHs. These PAHs are discharged into the environment through volcanic eruptions and forest and grassland fires, which are natural sources of PAHs. Artificial sources are the main sources of PAHs, including fossil fuel combustion, biomass combustion, coke and asphalt production, oil regeneration, aluminum smelting, and other industrial activities [8]. In addition, PAHs are also produced during waste incineration, tail gas emission, and food processing [9].
PAHs’ physical and chemical properties make them ubiquitous in all kinds of environmental media and highly mobile [10]. PAHs entering the atmosphere can be transported in gas or aerosol over a long distance. In this process, PAHs undergo a series of physical and chemical reactions and are then transferred to water, sediment, soil, and plants through precipitation and particle deposition [9]. PAHs invade the human body mainly through ingestion, inhalation, and absorption and are transported through the blood circulation system and accumulated in human organs [11]. Their mixture will induce inflammatory reactions through oxidative stress, destroy vascular endothelial cells, and lead to asthma. Therefore, the rapid on-site detection of PAHs is of significance for effective and accurate control.
At present, the detection methods of PAHs mainly include high-performance liquid chromatography (HPLC) [12,13], liquid/gas chromatography-mass spectrometry (LC/GC-MS) [12,14], synchronous fluorescence spectrometry [15], capillary electrophoresis [16], and infrared spectroscopy [17]. HPLC and LC/GC-MS, as the most mature and sensitive detection methods at present, are widely used in the detection of PAHs in aquatic environments. However, due to the complex sample matrix and the mixture of PAHs in actual water samples, the analysis can only be carried out after time-consuming and complicated sample pretreatment [18]. Moreover, organic solvents are also necessary for sample pretreatment and detection procedures, which lead to many potential environmental problems, such as secondary pollution during the processes of storage, transportation, treatment, and disposal. Although a sample for the synchronous fluorescence method does not need pretreatment, and the operation is simple and fast, it has high interference [19]. Capillary electrophoresis has the disadvantage of a narrow application range [20]. Infrared spectroscopy is a detection method that is closely linked to computer technology. Its spectrum of characteristic results is closely related to analysis software, model parameters, and data processing, which limits its popularization and application to a certain extent.
Surface-enhanced Raman scattering (SERS) is a new technology with high sensitivity for analyzing environmental pollutants [21,22]. SERS has many advantages, such as high time efficiency, nondestructive detection, high sensitivity (as low as the single-molecule level), no need for complicated sample pretreatment, and no interference from water [23]. It has been widely used in environmental monitoring [24,25,26,27], food safety [28,29], homeland security [30,31,32,33], and biomedical fields [34,35]. It shows significant potential in the detection of trace organic pollutants [36]. However, the detection performance of SERS strongly depends on the enhancement characteristics of the substrate [37], which is closely related to the “hot spot” and surface area formed by the substrate. In addition, the reproducibility, selectivity, and stability of the SERS substrate are also important indexes to evaluate the performance of the SERS substrate [38]. In recent years, with the continuous development of nanotechnology and optical technology, the research and development of SERS substrates has also made great progress, pushing SERS technology toward wider and even specialized application fields [39,40,41].
Currently, the common types of SERS substrates are mainly colloidal substrates, semiconductor substrates, rigid substrates, and flexible substrates. Among them, the properties of the colloidal substrate can be adjusted by changing the morphology and size of noble-metal nanoparticles. Pu et al. synthesized a two-dimensional Au@Ag nanorod array by interface self-assembly technology, which possessed not only the high SERS activity of silver nanorods but also the high stability of gold nanorods and showed high sensitivity and a good linear relationship in the detection of thiram [42]. Although the colloidal substrate has the advantage of high sensitivity, it can be significantly affected by pH [43]. The semiconductor substrate has excellent optical properties, providing electron transfer channels to promote charge transfer [44]. Compared with other materials, it is more abundant and has the advantages of good biocompatibility and high selectivity. Song et al. peeled off ultra-thin two-dimensional MoO3 nanosheets, resulting in many surface defect structures, which improved the charge transfer efficiency and promoted the chemical adsorption of target molecules [45]. However, the photocatalytic ability of conventional semiconductor materials will degrade the target substance on the substrate surface, which may affect the accuracy of the detection results. The flexible substrate not only has all of the advantages of a rigid substrate [46] but also has a specific deformation ability, which can adapt to complex and changeable implementation and testing environments. Fan et al. deposited silver on the surface of sandpaper in a vacuum and prepared a SERS swab, which can directly wipe pesticides from various surfaces for testing [47].
However, due to the hydrophobicity of PAHs, these chemicals only have a weak affinity when adsorbed on metal surfaces, which leads to a poor SERS response, limiting the application of SERS in the detection of PAHs [48,49]. In order to yield strong Raman signals of PAHs and obtain ideal SERS analysis results, many studies have been devoted to finding the corresponding SERS substrates [50]. For example, Li et al. prepared a wearable screen-printed SERS array sensor with the lowest detection concentration of 10 μM for PAHs [51], and Du et al. prepared a mercapto-modified Fe3O4@Ag magnetic SERS probe with the lowest detection concentration of 1 μM for pyrene [52], among other studies. At present, most methods of detecting PAHs by SERS technology are carried out in the laboratory. On-site rapid detection methods for PAHs need to be improved for practical application [53].
High-refractive-index reflective glass beads (HRGBs) have excellent retroreflective performance, concentrating most of the light irradiated on HRGBs into a narrow cone and returning it in the light source direction [54]. With this characteristic, not only can loading SERS-active nanomaterials on the HRGB surface greatly enhance the SERS signal collection efficiency, but the laser reflected by HRGBs can also excite the substrate twice, thus enhancing the detection sensitivity of SERS to PAHs, which is of great significance for on-site detection. This is because the configuration of portable equipment is not as good as that in the laboratory, and efficient signal collection is an effective way to improve the detection performance. Therefore, an HRGB substrate has great potential for field application. In our previous work, an HRGB-SERS substrate was prepared and used to detect 2,4-dinitrotoluene (2,4-DNT) [55]. Considering the maturity of self-assembled Ag NP technology, multiple rounds of Ag NP deposition on the surface of HRGBs were used. However, this preparation method is complicated and time-consuming, which limits its practical application. Herein, a simple preparation method of HRGBs-SERS was studied by adjusting the number of deposition rounds of Ag NPs on the surface of HRGBs. In addition, since PAHs are non-polar organic pollutants, which lack functional groups with affinity to gold, silver, and other noble-metal nanoparticles, chemical modification is needed to enhance the interaction between PAHs and the substrate to enrich PAHs and improve the sensitivity of SERS detection [56]. After the halogen modification scheme was optimized, the substrate was successfully applied to detect PAHs in water samples.
The prepared substrate has strong stability and high detection sensitivity. The detection of PAHs was realized by halogen modification, which was then successfully applied to the detection and identification of a PAH mixture in water samples (Scheme 1).

2. Materials and Methods

2.1. Materials and Instruments

2.1.1. Materials

Silver nitrate (AgNO3), sodium citrate, Rhodamine 6G (R6G), and potassium iodide (KI) were obtained from Sigma-Aldrich (Shanghai, China); (3-Aminopropyl) trimethoxysilane (APTMS), pyrene (Pyr), phenanthrene (Phe), anthracene (Ant), potassium bromide (KBr), sodium bromide (NaBr), and Methyl alcohol were obtained from Shanghai Titan Scientific Co., Ltd., Shanghai, China; absolute ethanol and hydrochloric acid were obtained from Chron Chemicals; RGBs were bought from Jiangyou Reflective Materials Technology Co., Ltd. (Jiangyou China). The water used in this work was ultrapure water with an electrical resistivity of 18.2 MΩ∙cm. Different concentrations of PAH solutions were prepared with absolute ethanol (these solutions are called PAH–ethanol solutions for convenience).

2.1.2. Instruments and Data Analysis

In this work, the main Raman measurements were taken using a customized Raman microscope equipped with a Pixis-100BR CCD (Princeton Instruments, Trenton, NJ, USA), Acton SP-2500i spectrometer, and He–Ne laser (20 mW). An excitation wavelength of 633 nm and a 20 × objective lens (NA = 0.40) were used, and the integration time was 1 s × 1. In addition, a UV-Vis spectrometer (MAYA 2000Pro, Ocean Optics, Dunedin, FL, USA) was used. A scanning electron microscope (JSM-6610LV, JEOL, Tokyo, Japan) was used to observe the morphology of RGB-SERS. All SERS data were baseline-corrected using Origin Pro 2021 software (V3, Originlab Corporation, Northampton, MA, USA).

2.2. Preparation of Ag NPs

Ag NPs were prepared by the citrate reduction method using silver nitrate solution with a concentration of 5 mM (for convenience, hereafter, Ag NPs prepared with 5 mM silver nitrate are abbreviated as 5 mM Ag NPs). A certain amount of AgNO3 was dissolved in ultrapure water to prepare 500 mL of a 5 mM AgNO3 solution. The prepared 5 mM AgNO3 solution was heated to boiling while magnetic stirring was performed at 300 rpm. Then, 10 mL of a 10% trisodium citrate solution was added rapidly to the boiling AgNO3 solution. The solution was condensed and refluxed for 1 h while boiling was maintained. After that, heating was stopped, the solution was stirred until it was cooled to room temperature, and a 5 mM Ag NP solution was obtained.

2.3. Preparation of HRGB-SERS Substrate

2.3.1. Preparation of APTMS Sol–Gel Solution

The APTMS sol–gel solution was used for subsequent rounds of deposition. The APTMS sol–gel solution was prepared as follows: 400 μL of APTMS and 332 μL of 0.1 M HCl were added to 33 mL of ultrapure water with magnetic stirring for at least 1 h. The APTMS sol–gel solution should be used on the same day.

2.3.2. Deposition of Ag NPs

The appropriate amount of HRGBs was removed after being immersed in deionized water for one week, rinsed with absolute ethanol, transferred into 2% (v/v) APTMS prepared from 95% ethanol, and mechanically vibrated for 2 h. They were thoroughly rinsed with absolute ethanol and deionized water several times after removal to ensure no excess APTMS residue remained. After that, they were immersed in a 5 mM Ag NPs solution and mechanically vibrated for 12 h. The RGB-SERS substrate with one round of deposition of Ag NPs was obtained after rising the Ag-NP-deposited HRGBs with deionized water.

2.4. Modification of HRGB-SERS Substrate

To modify the substrate, 10 mM solutions of KBr, KI, and NaBr (aq) were prepared with deionized water, and then a small amount of the HRGB-SERS substrate was immersed in the above-mentioned modified solution with a volume of 400 μL for 1 min. Then, the substrate was removed and placed onto the surface of foil paper, and the sample was dripped on the substrate with a volume of 10 μL for SERS detection. The concentration gradient was 30, 20, 10, 5, and 1 mM, all of which are aqueous solutions. The modification and detection procedures were the same as above.

2.5. Stability of HRGB-SERS Substrate

The unmodified HRGB-SERS substrates were stored in ultrapure water. To explore the stability of the substrate, the SERS spectra of an R6G–ethanol solution were recorded at 0, 7, and 31 days after substrate preparation. In order to explore the stability of the halogen-modified substrate, the modified HRGB-SERS substrate was exposed to air at different times. The SERS spectra of pyrene–ethanol with a concentration of 10 μM were recorded at 0, 2, 4, 8, and 10 days after the modified-substrate preparation.

2.6. SERS Detection of Water Samples

To simulate the existing state of PAHs, three-ringed anthracene and phenanthrene and four-ringed pyrene were selected as the representative PAHs. The final concentrations of anthracene, phenanthrene, and pyrene in mixed water samples were 10 μM, 10 μM, and 1 μM, respectively. Simulated water samples prepared with ultrapure water and lake water were taken as the actual water samples to explore the feasibility of detection. SERS measurements were carried out after placing a small amount of the HRGB-SERS substrate onto aluminum foil paper and dropping 10μL of the water samples on the substrate. Laser power: 13.8 MW; integration time: 1 s × 1; and objective lens: 20×.

3. Results and Discussion

3.1. Improvement of HRGB-SERS Substrate Preparation

Compared with the previous work, we made the following changes in order to simplify the preparation procedure: (1) replaced absolute ethanol with 95% ethanol to accelerate the hydrolysis of APTMS during the preparation of the APTMS ethanol solution; (2) increased the concentration of the silver nitrate solution from 1 mM to 5 mM for Ag NP preparation. The HRGB-SERS substrate was prepared by activating the surface of HRGBs with APTMS, and Ag NPs were loaded evenly onto the surface of HRGBs.
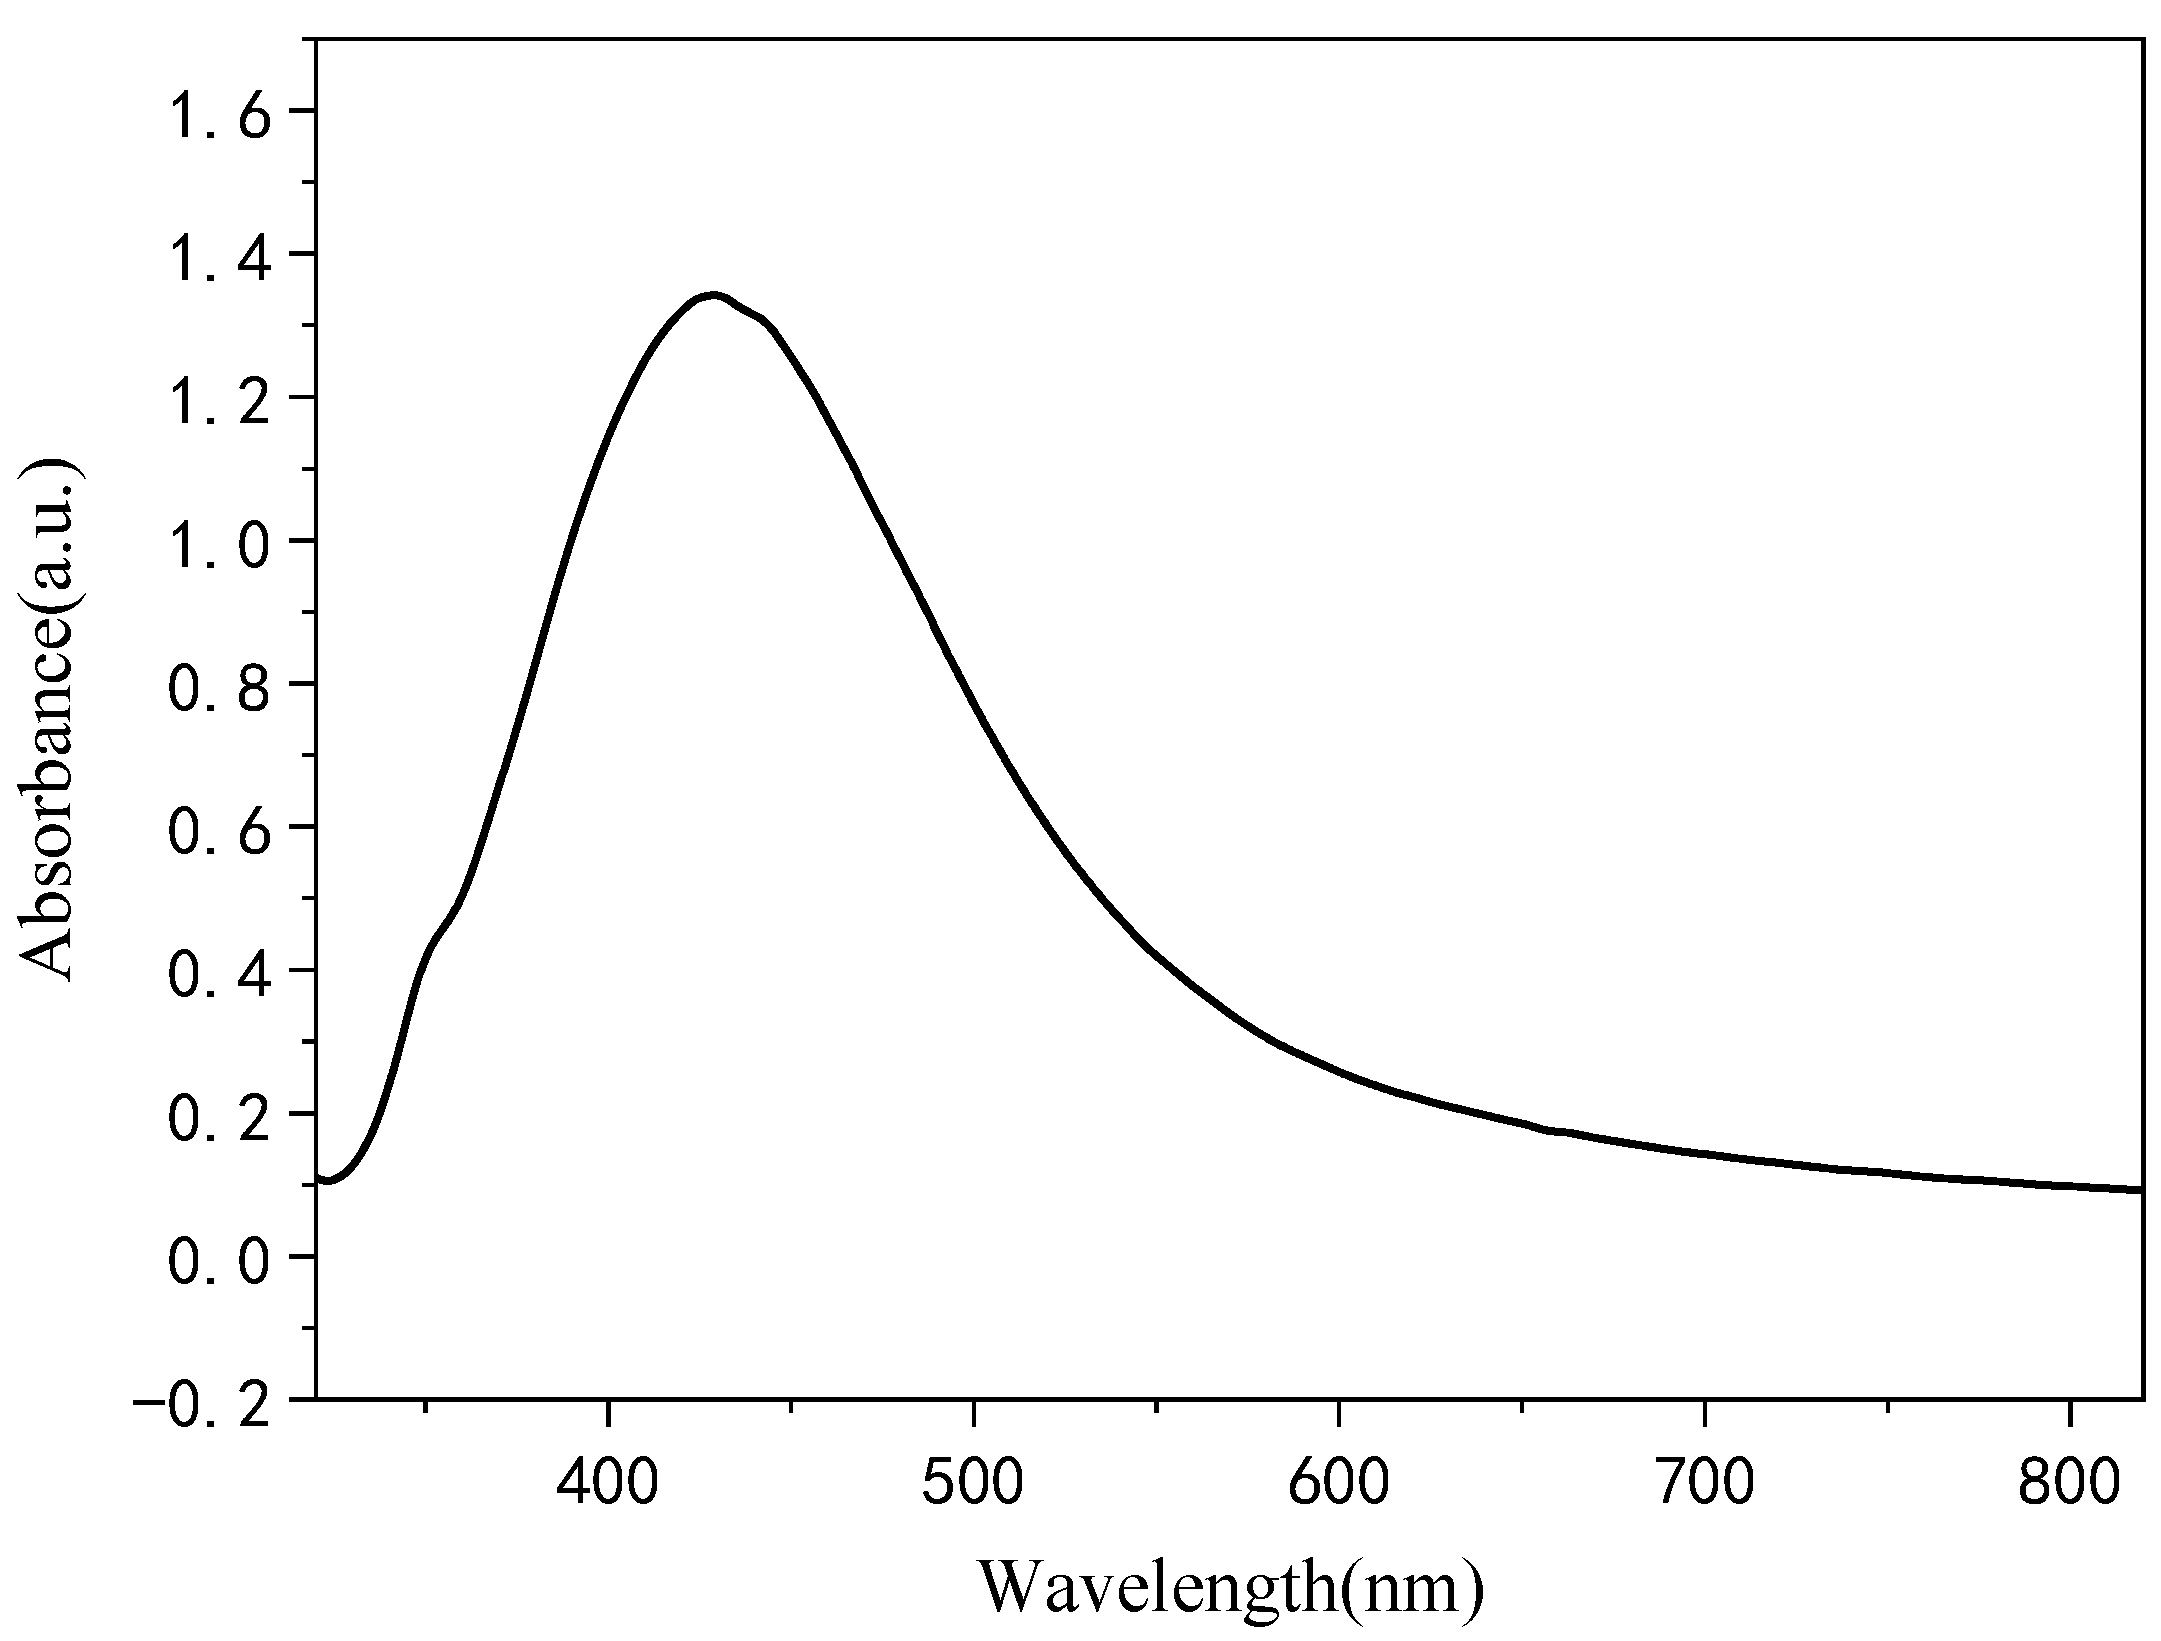
As shown in Figure S1, the APTMS is hydrolyzed by water. Adding a small amount of water to ethanol can promote the hydrolysis of APTMS and make APTMS form a network structure before combining with RGB. After adding Ag NPs, positively charged Ag NP particles combine with negatively charged -NH2 on the APTMS network and finally form a stable HRGB-SERS substrate [57,58]. As shown in Figure S2, the particle size range of Ag NPs prepared in this work was 44–83 nm (the average particle size was 60 nm), which is consistent with a previous report [59]. The UV-Vis spectrum of 5 mM Ag NPs proved the successful preparation of Ag NPs (Figure 1).
The spectra of HRGB-SESR substrates with different rounds of deposition are shown in Figure 2A. The R6G–ethanol solution with a concentration as low as 1 nM was detected using the HRGB-SERS substrate prepared with one round of deposition of Ag NPs. With the increase in deposition rounds, the detection sensitivity declined. Due to the increased concentration of Ag NPs and the acceleration of APTMS hydrolysis, the HRGB-SERS substrate prepared with one round of deposition not only formed copious “hot spots” but also made full use of its retroreflective performance. The subsequent deposition resulted in excessive Ag NPs covering the surface of HRGBs, which hindered the retroreflection of the incident light (Figure 2B–D). Meanwhile, Ag NP agglomeration led to the loss of its nano size, which in turn reduced the original “hot spots”, as well as the SERS performance of the substrate.
We compared the SEM images of the substrates prepared in the present and previous work, and it can be proved that the simplified scheme can significantly improve the deposition efficiency of Ag NPs. As shown in Figure S3, the lowest detection concentration of the HRGB-SERS substrate prepared with one round of deposition is 1 nM, which is no different from the previous work, which deposited three rounds. The preparation time is greatly shortened, and the preparation process is simple.

3.2. Modification of HRGB-SERS Substrate

PAHs contain many benzene rings, which can enhance the physical adsorption of the SERS substrate to the target by co-adsorption with halogen anions [48,60]. With the increase in the number of rings, the enhancement caused by co-adsorption is more significant, thus improving the detection efficiency of trace PAHs. For noble-metal nanoparticles prepared by citrate reduction, halogen cations can also destroy the stable citrate layer on the surface of the nanoparticles, causing the silver nanoparticles to collide with each other, thus forming more active “hot spots” on the substrate [61].
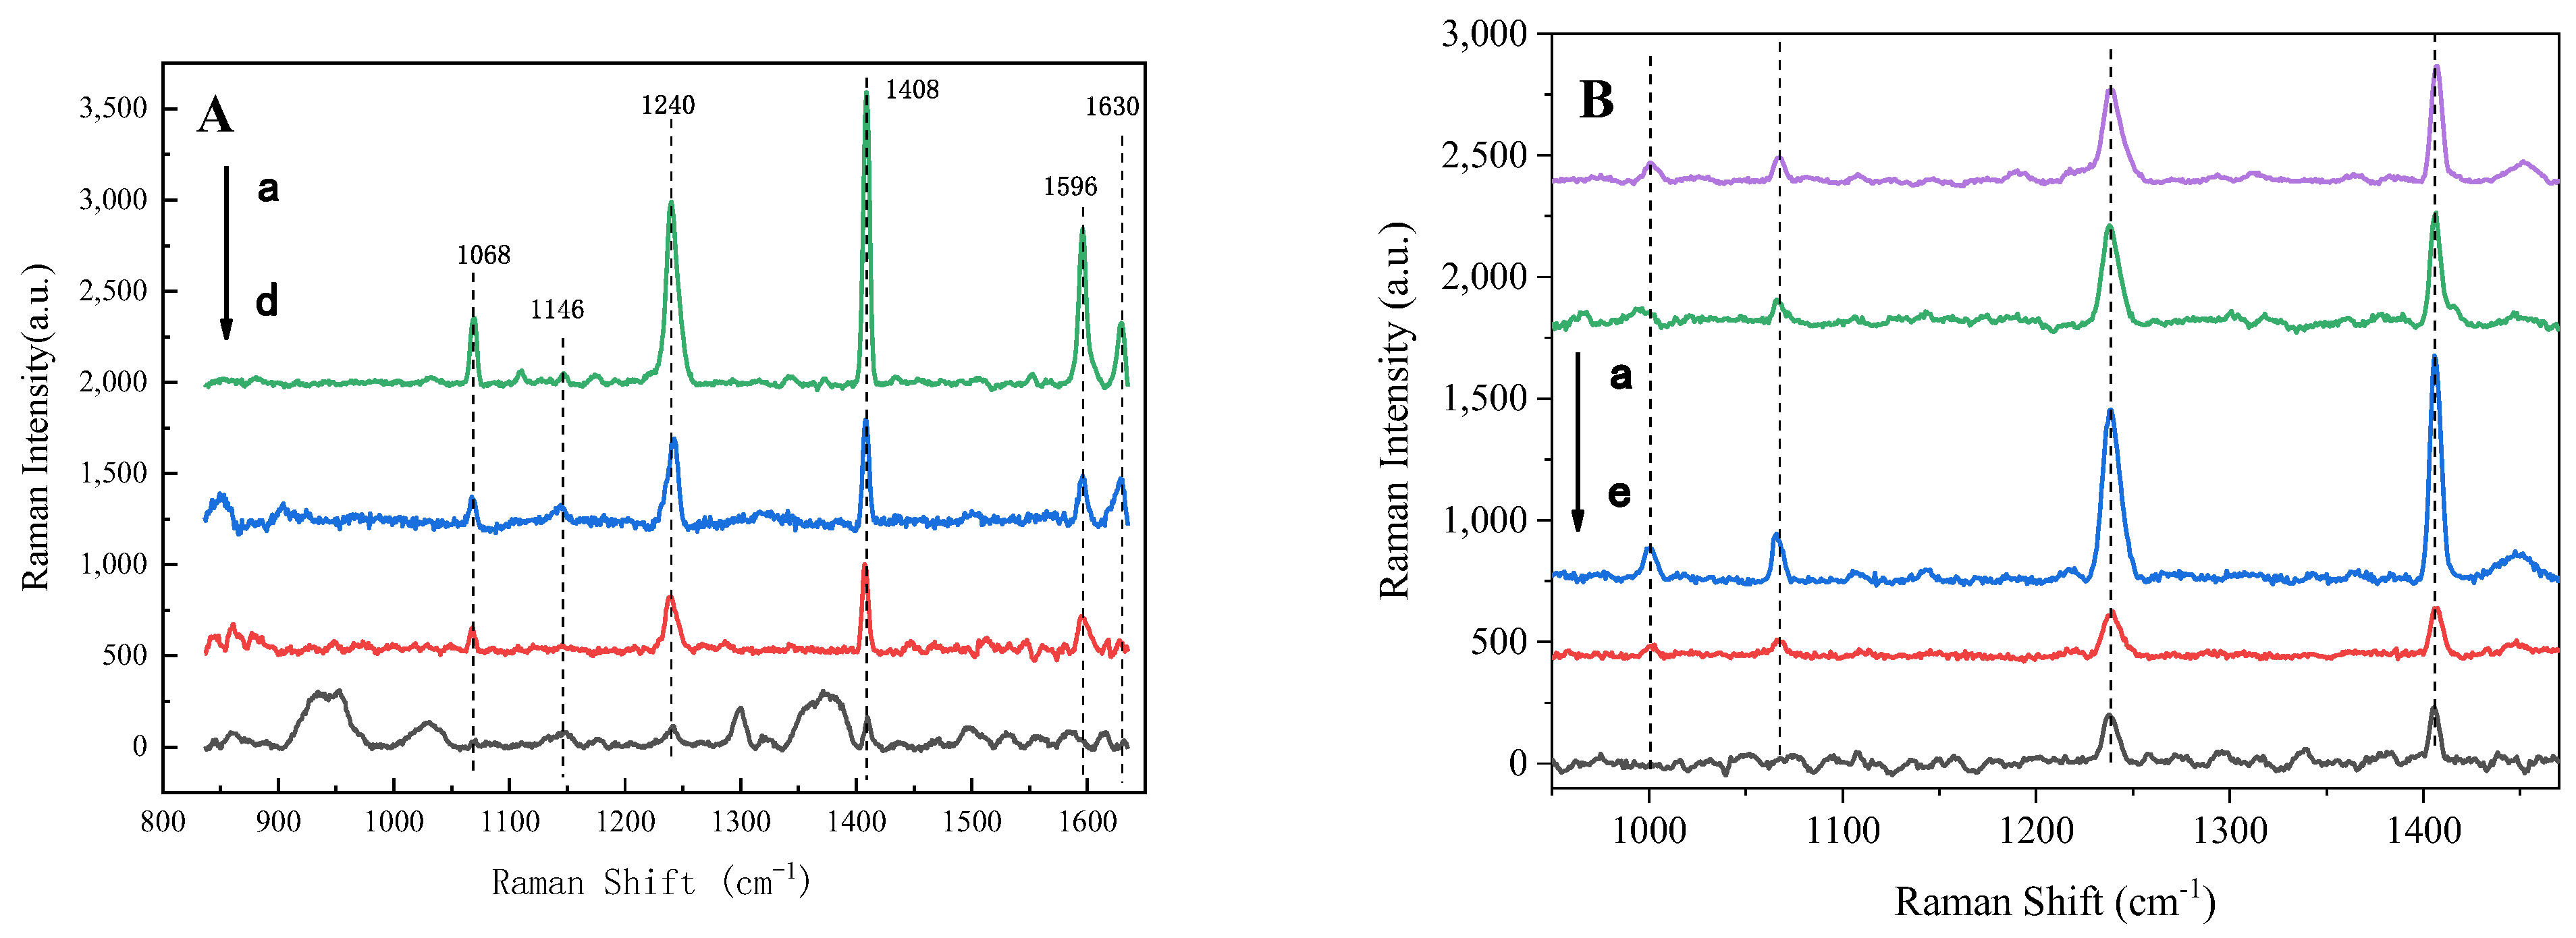
In order to improve the detection sensitivity of PAHs, 10 mM solutions of KBr, KI, and NaBr (aq) were used to modify the RGB-SERS substrate [62]. The pyrene–ethanol solution was used as the representative of PAHs for SERS detection. After being modified by KBr, the SERS intensity is higher, and the characteristic peak can be distinguished (Figure 3A). Although the HRGB-SERS substrates modified by KI and NaBr have a specific signal enhancement effect when detecting the pyrene–ethanol solution, they are not as good as that of KBr, which proves that KBr is the best modifier for this substrate. The following modifications were all conducted using KBr.
We further compared the modification effects of different concentrations of KBr aqueous solutions to determine the best modification concentration. A concentration gradient of 30, 20, 10, 5, and 1 mM was obtained by diluting the KBr aqueous solution with water. With the same modification steps, a 10 μM pyrene–ethanol solution was used to test the performance of the modified RGB-SERS substrate. When 10 mM KBr was used, the SERS signal was the strongest (Figure 3B). This is because too few bromine ions cannot activate Ag NPs, while too many of them will lead to excessive aggregation and deposition [63]. Hence, the 10 mM KBr aqueous solution was selected to modify the substrate in the following experiments.
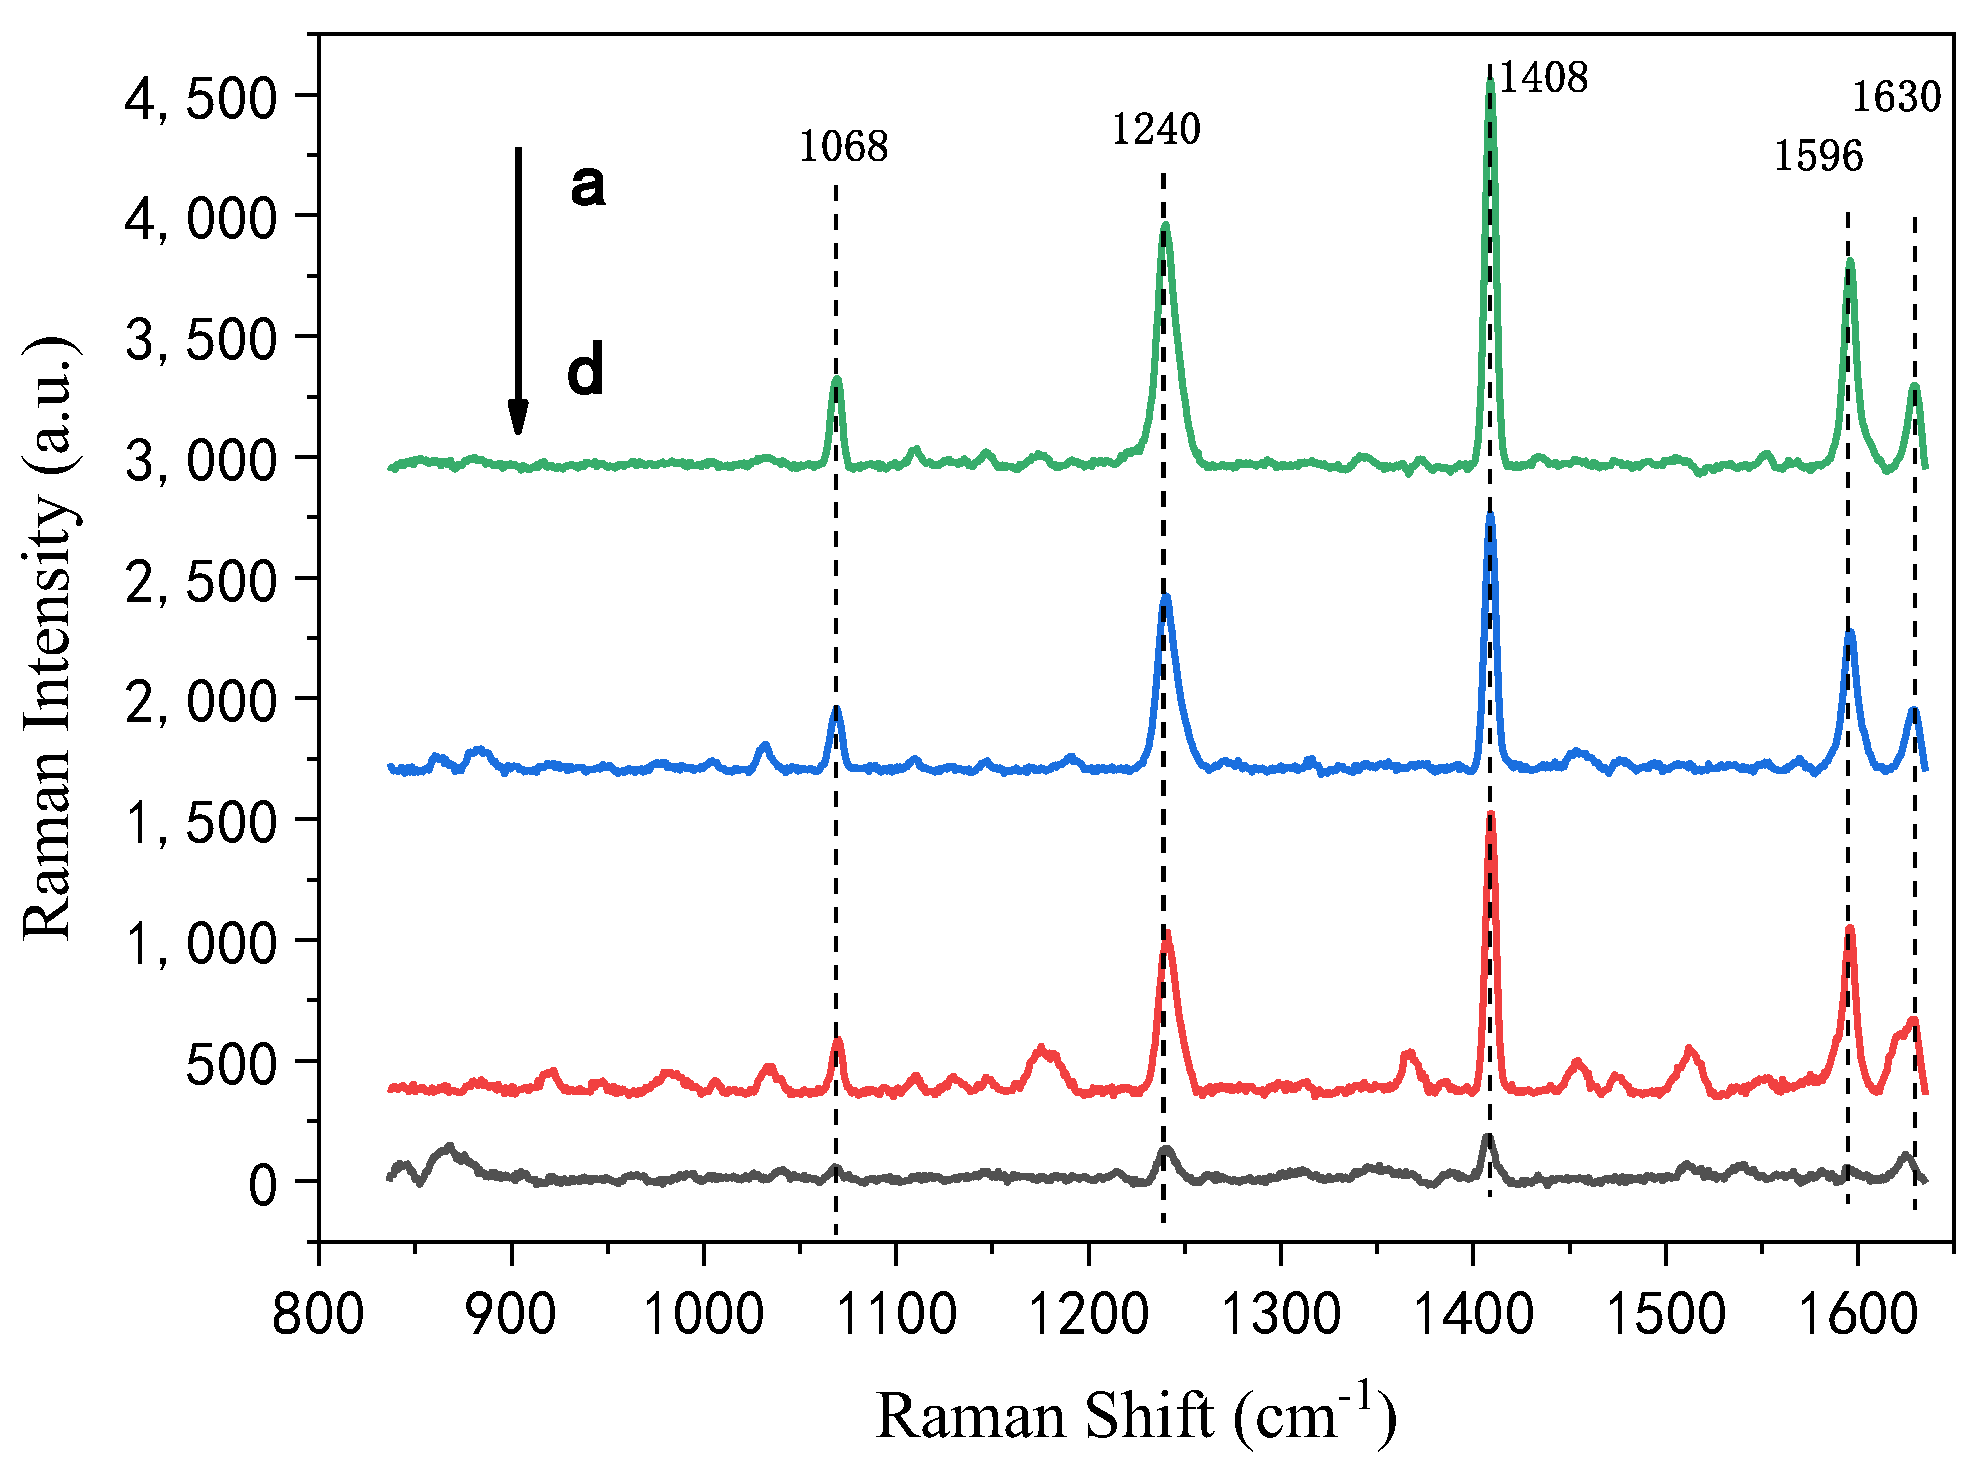
Taking the Raman shift of pyrene as the abscissa and the Raman intensity of pyrene as the ordinate, the SERS spectrum of the 10 mM-KBr-modified HRGB-SERS substrate was plotted. As shown in Figure 4, the detection sensitivity of pyrene could reach 100 nM, which was improved by 3 orders of magnitude, while that of the unmodified substrate only reached 100 μM, indicating that the 10 mM-KBr-modified RGB-SERS substrate shows a good detection effect on PAHs represented by pyrene. The relative standard deviations (RSD) of 100, 10, 1, and 0.1 μM pyrene–ethanol solutions are 0.24, 0.65, 0.30, and 0.37, respectively. The reason for this result is that the detection performance of the HRGB-SERS substrate is highly dependent on the morphology of HRGBs and the distribution of silver nanoparticles on their surface. Even a slight movement will make the SERS signal fluctuate greatly, so it can only be used for the semi-quantitative analysis of the target at present. However, this does not affect the advantages of the HRGB-SERS substrate in SERS detection. HRGBs have excellent retroreflective performance and high detection sensitivity under a low-power objective lens. Even if there are low concentrations of PAHs in water, they can be easily detected, which can achieve the purpose of on-site detection. Moreover, the preparation method is simple and environment-friendly.

3.3. Stability of HRGB-SERS Substrate

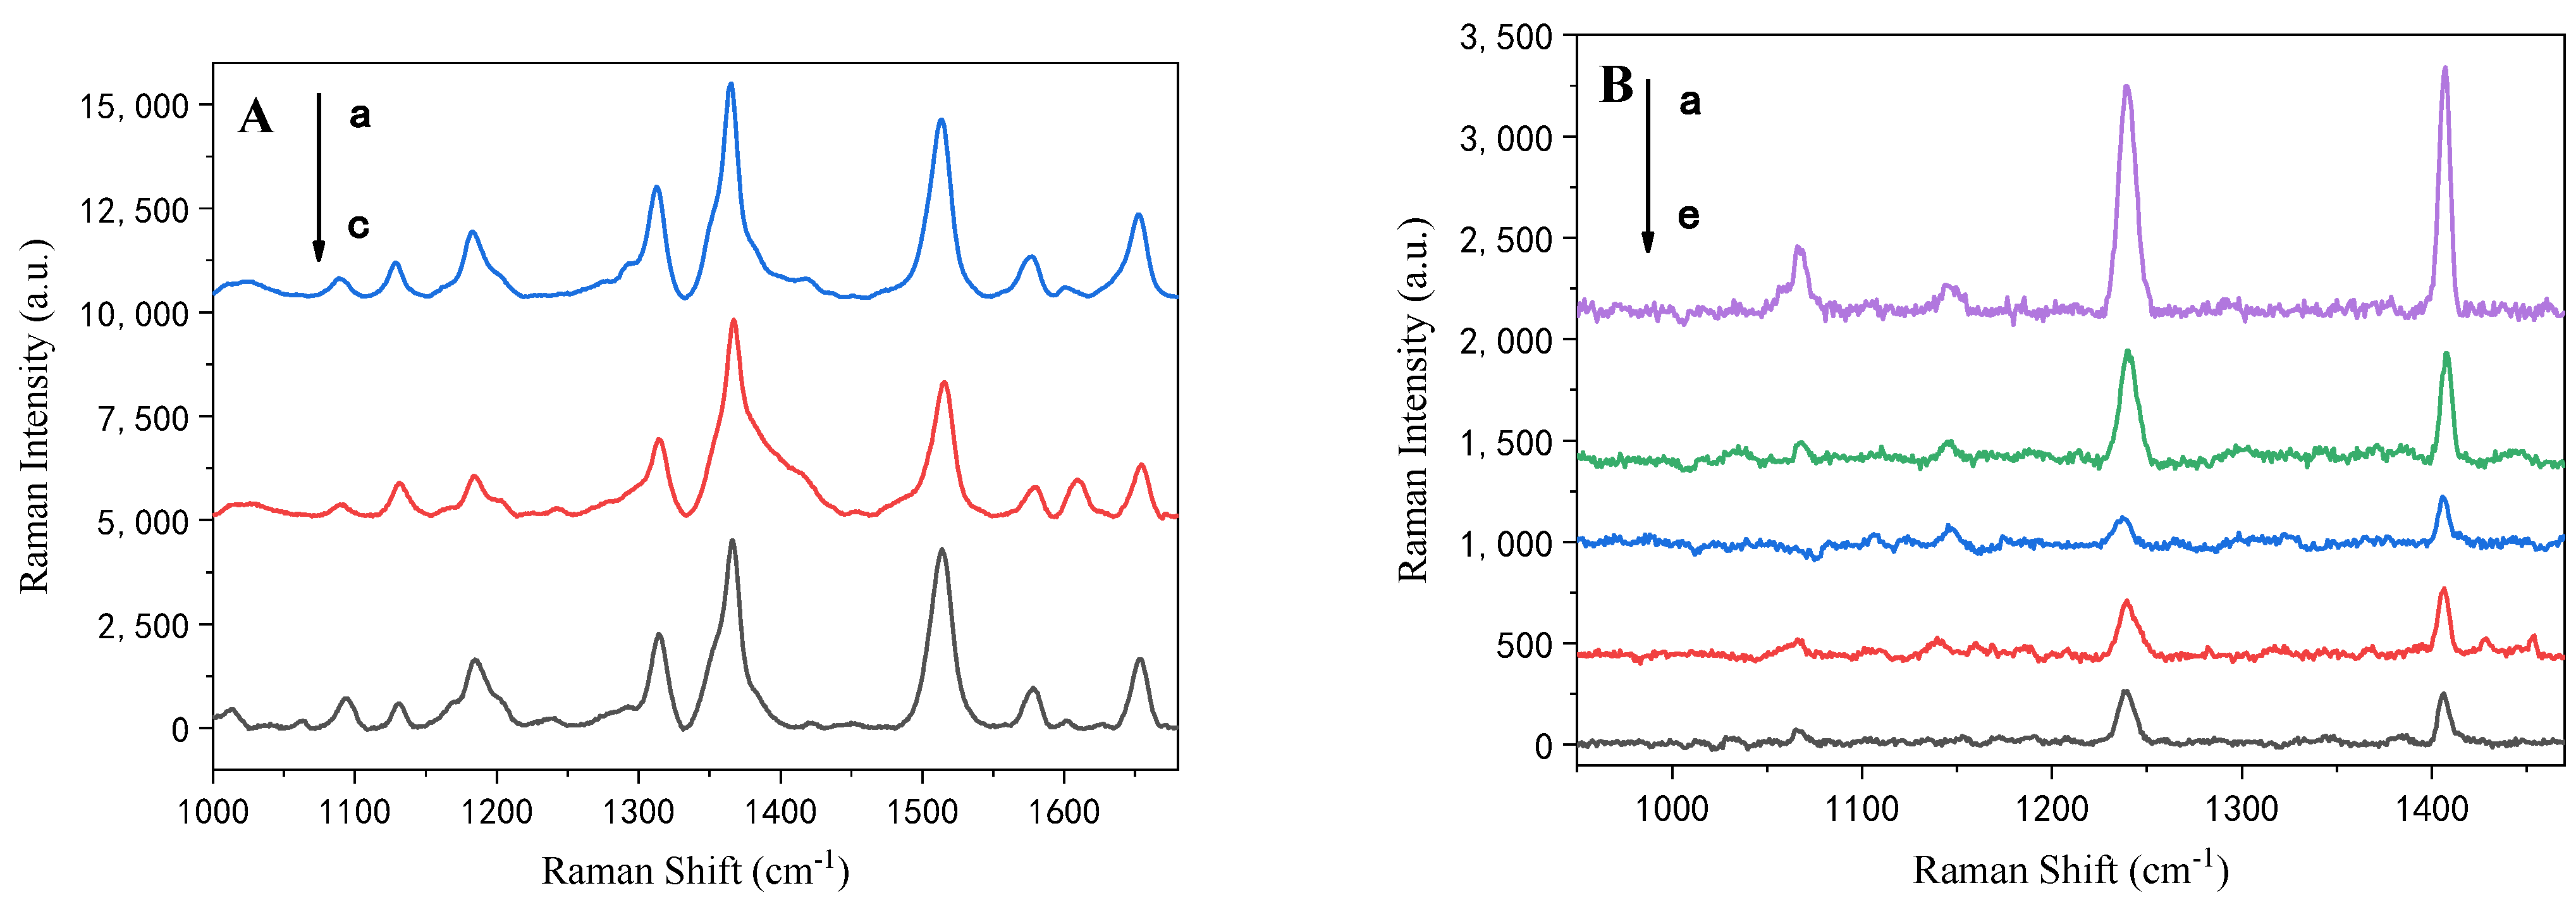
In order to study the stability of the HRGB-SERS substrate, the effects of R6G–ethanol solution detection before modification were monitored over time. As shown in Figure 5A, the stability of the unmodified HRGB-SERS substrate did not change significantly over time, which indicates that the prepared HRGB-SERS substrate could be stored in ultrapure water before being used. However, the modified HRGB-SERS substrate did not show a stable performance for pyrene over time. As shown in Figure 5B, the substrate modified by halogen ions had the best detection performance just after it its modification, and the performance gradually weakened with the increase in exposure time. This result may be because the water on the substrate surface gradually evaporated with the increase in exposure time, which affected the migration of halogen ions. Therefore, to obtain the best detection performance, the detection of PAHs should be carried out immediately after the substrate is modified with halogen ions.

3.4. Application of RGB-SERS Substrate to Actual Samples

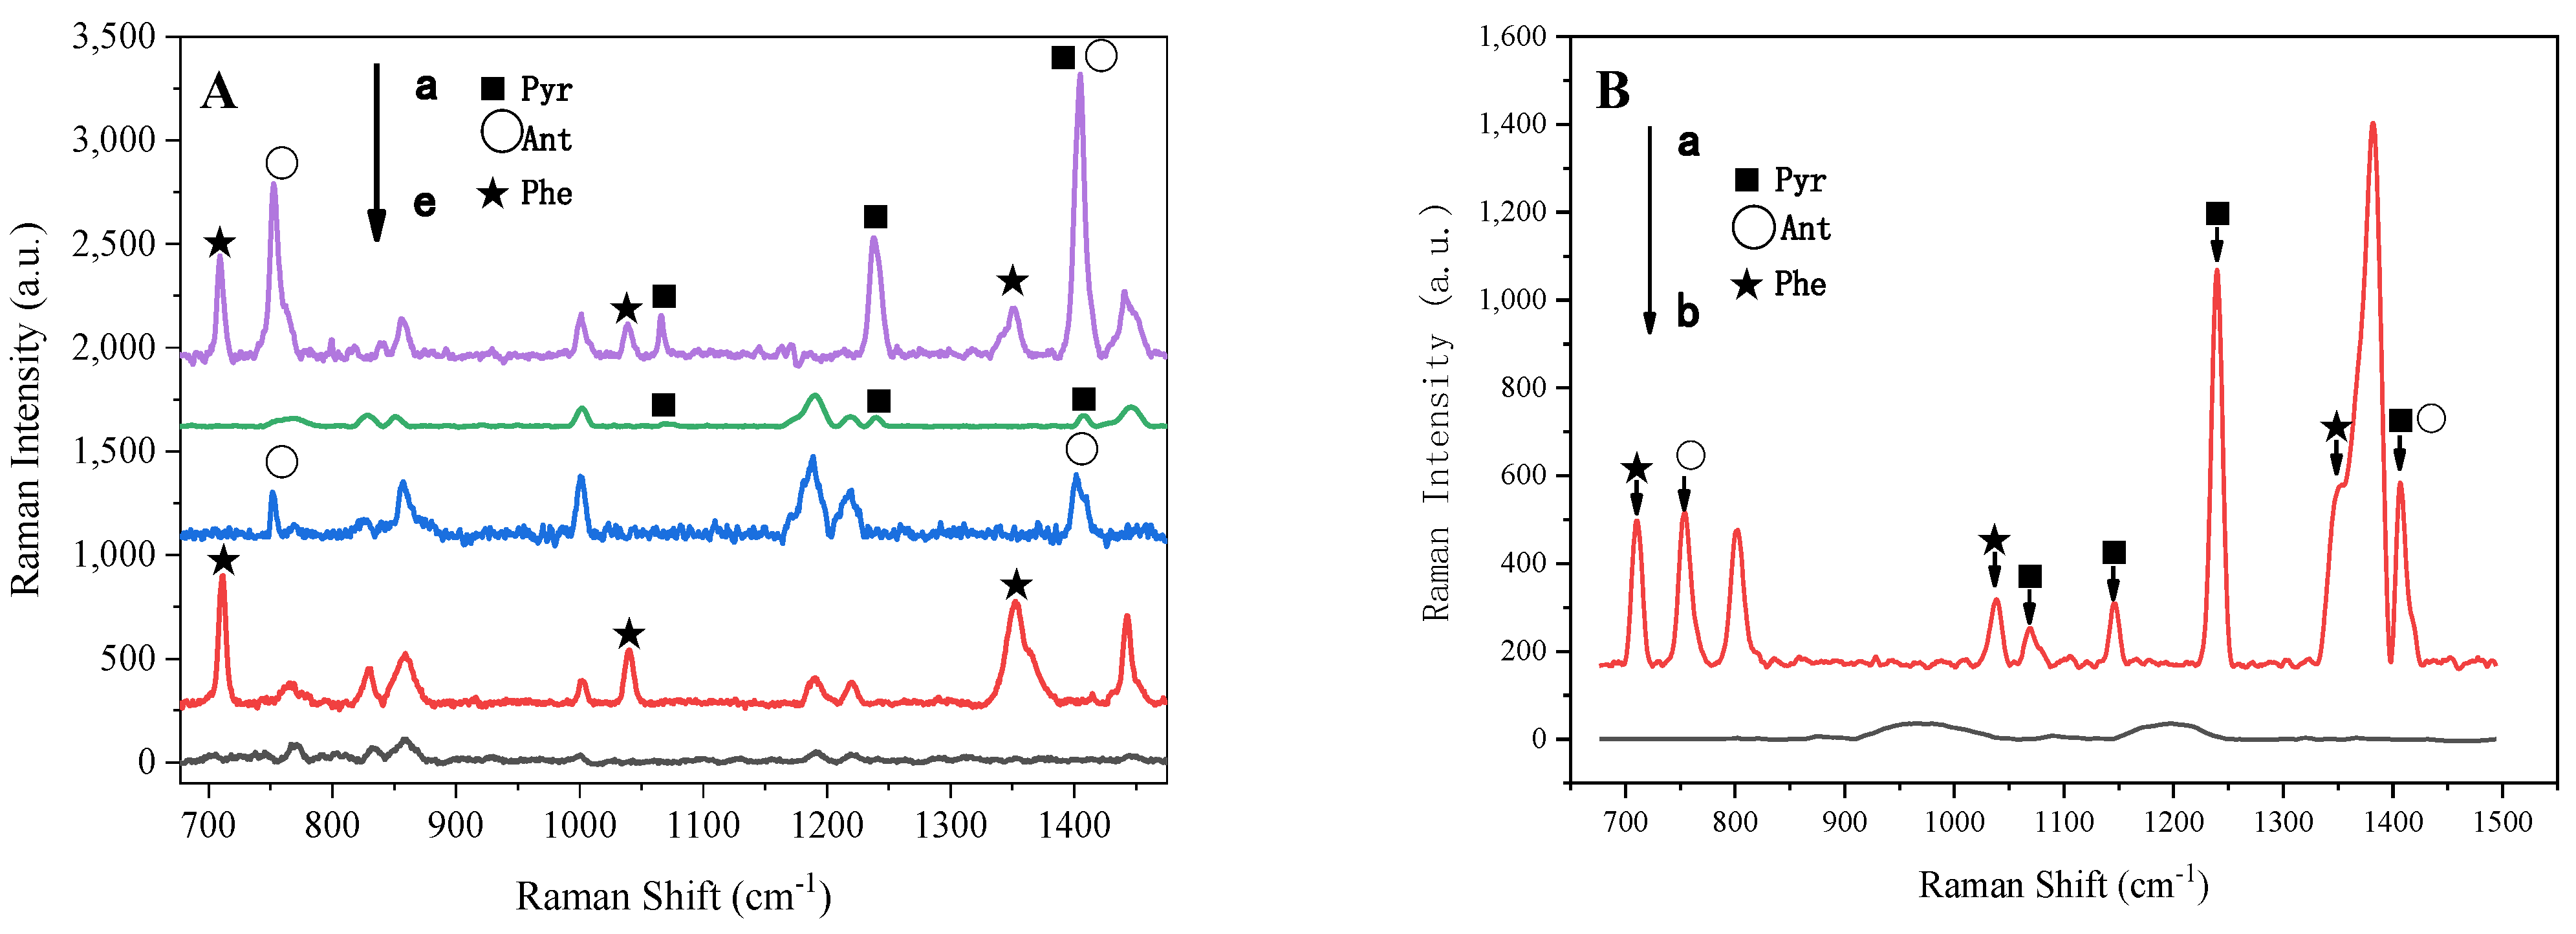
The SERS spectrum of the simulated water samples is shown in Figure 6A. It is observed that most of the characteristic peaks of phenanthrene, anthracene, and pyrene can be clearly distinguished by a comparison of their respective peaks (Table 1). However, the peak position at 1404 cm−1 in the simulated water sample is different from that with anthracene or pyrene alone. This is probably because the many types of PAHs in water samples will compete for active sites at this peak [64]. So, a peak at 1404 cm−1 cannot be used as the target peak for quantitative detection. The peaks at other positions are very representative, which can be used to distinguish various PAHs in water samples.
Lake water (Table 2) was taken as the actual water sample to explore the feasibility of detection. The same method was used to detect the blank lake water sample, with no SERS signals of pyrene, anthracene, and phenanthrene observed. This shows that the concentrations of pyrene, anthracene, and phenanthrene in the lake water are lower than the limits of the substrate used here. Then, the actual mixed water sample was detected. The characteristic peaks of phenanthrene, anthracene, and pyrene can be observed in Figure 6B. Although anthracene and pyrene have characteristic peaks overlapping at the same position, similar to the simulated mixed water sample, these three PAHs can still be distinguished. The results also show that other organic substances in the lake water will not interfere with the detection of dissolved pyrene, anthracene, and phenanthrene by the RGB-SERS substrate, which proves that the substrate has a promising application prospect for the rapid detection of PAHs in the field.

4. Conclusions

An HRGB-SERS substrate was successfully prepared by accelerating the hydrolysis of APTMS with 95% ethanol and increasing the concentration of Ag NPs with 5 mM silver nitrate. The prepared substrate has strong stability and high detection sensitivity toward PAHs in the water environment. To obtain the best detection performance, the detection of PAHs should be carried out immediately after being modified with halogen ions. The detection sensitivity of pyrene was improved by 3 orders of magnitude by halogen modification using a 10 mM KBr solution. In particular, spiked water samples mixed with three types of PAHs (anthracene, phenanthrene and pyrene) can be identified and rapidly detected. This proves that the SERS substrate prepared in this work has a promising application prospect for the rapid detection of PAHs in water environments.

Supplementary Materials

The following supporting information can be downloaded at: https://www.mdpi.com/article/10.3390/chemosensors10100406/s1, Figure S1: Schematic diagram of HRGB-SERS substrate structure [1]; Figure S2: SEM images of Ag NPs; Figure S3: (a) Background peak. (b–d) SERS spectrum of R6G–ethanol solutions with concentrations of 100, 10 and 1nM were detected by HRGB-SERS substrate. Reference [58] is cited in the supplementary materials.

Author Contributions

Conceptualization, B.H.; data curation, X.Z.; investigation, B.H., X.Z. and J.Z.; methodology, B.H. and J.Z.; project administration, D.W.; supervision, D.W., Z.G. and M.F.; validation, D.W. and B.H.; visualization, D.W., B.H. and X.Z.; writing—original draft, B.H.; writing—review and editing, D.W. All authors have read and agreed to the published version of the manuscript.

Funding

This research was funded by the National Natural Science Foundation of China, Grant Nos. 22006121 and 22076153.

Institutional Review Board Statement

Not applicable.

Informed Consent Statement

Not applicable.

Data Availability Statement

Not applicable.

Acknowledgments

This research was supported by the National Natural Science Foundation of China (Grant Nos. 22006121 and 22076153). We would like to thank the Analytical and Testing Center of Southwest Jiaotong University for SEM analysis.

Conflicts of Interest

The authors declare no conflict of interest.

References

  1. Jesus, F.; Pereira, J.L.; Campos, I.; Santos, M.; Re, A.; Keizer, J.; Nogueira, A.; Goncalves, F.J.M.; Abrantes, N.; Serpa, D. A review on polycyclic aromatic hydrocarbons distribution in freshwater ecosystems and their toxicity to benthic fauna. Sci. Total Environ. 2022, 820, 153282. [Google Scholar] [CrossRef] [PubMed]
  2. Nowakowski, M.; Rykowska, I.; Wolski, R.; Andrzejewski, P. Polycyclic Aromatic Hydrocarbons (PAHs) and their Derivatives (O-PAHs, N-PAHs, OH-PAHs): Determination in Suspended Particulate Matter (SPM)—A Review. Environ. Process. 2021, 9, 2. [Google Scholar] [CrossRef]
  3. Dat, N.D.; Chang, M.B. Review on characteristics of PAHs in atmosphere, anthropogenic sources and control technologies. Sci. Total Environ. 2017, 609, 682–693. [Google Scholar] [CrossRef]
  4. Kong, L.; Gao, Y.; Zhou, Q.; Zhao, X.; Sun, Z. Biochar accelerates PAHs biodegradation in petroleum-polluted soil by biostimulation strategy. J. Hazard Mater. 2018, 343, 276–284. [Google Scholar] [CrossRef] [PubMed]
  5. Yu, H.; Liu, Y.; Han, C.; Fang, H.; Weng, J.; Shu, X.; Pan, Y.; Ma, L. Polycyclic aromatic hydrocarbons in surface waters from the seven main river basins of China: Spatial distribution, source apportionment, and potential risk assessment. Sci. Total Environ. 2021, 752, 141764. [Google Scholar] [CrossRef] [PubMed]
  6. Meng, Y.; Liu, X.; Lu, S.; Zhang, T.; Jin, B.; Wang, Q.; Tang, Z.; Liu, Y.; Guo, X.; Zhou, J.; et al. A review on occurrence and risk of polycyclic aromatic hydrocarbons (PAHs) in lakes of China. Sci. Total Environ. 2019, 651, 2497–2506. [Google Scholar] [CrossRef] [PubMed]
  7. Zhang, Y.; Tao, S. Global atmospheric emission inventory of polycyclic aromatic hydrocarbons (PAHs) for 2004. Atmos. Environ. 2009, 43, 812–819. [Google Scholar] [CrossRef]
  8. Honda, M.; Suzuki, N. Toxicities of Polycyclic Aromatic Hydrocarbons for Aquatic Animals. Int. J. Environ. Res. Public Health 2020, 17, 1363. [Google Scholar] [CrossRef] [Green Version]
  9. Sharma, B.M.; Melymuk, L.; Bharat, G.K.; Pribylova, P.; Sanka, O.; Klanova, J.; Nizzetto, L. Spatial gradients of polycyclic aromatic hydrocarbons (PAHs) in air, atmospheric deposition, and surface water of the Ganges River basin. Sci. Total Environ. 2018, 627, 1495–1504. [Google Scholar] [CrossRef]
  10. Kim, K.H.; Jahan, S.A.; Kabir, E.; Brown, R.J. A review of airborne polycyclic aromatic hydrocarbons (PAHs) and their human health effects. Environ. Int. 2013, 60, 71–80. [Google Scholar] [CrossRef] [PubMed]
  11. Gurbani, D.; Bharti, S.K.; Kumar, A.; Pandey, A.K.; Ana, G.R.; Verma, A.; Khan, A.H.; Patel, D.K.; Mudiam, M.K.; Jain, S.K.; et al. Polycyclic aromatic hydrocarbons and their quinones modulate the metabolic profile and induce DNA damage in human alveolar and bronchiolar cells. Int. J Hyg. Environ. Health 2013, 216, 553–565. [Google Scholar] [CrossRef]
  12. Groner, A.R.M.; Myrick, M.L. Identification of Major Water-soluble Fluorescent Components of Some Petrochemicals. Pergamon 2001, 42, 935–941. [Google Scholar] [CrossRef]
  13. Valcarcel, S.C.; Gallego, M. Sample screening systems in analytical chemistry. Trends Anal. Chem. 1999, 18, 685–694. [Google Scholar] [CrossRef]
  14. Chuang, J.C.; Van Emon, J.M.; Chou, Y.-L.; Junod, N.; Finegold, J.K.; Wilson, N.K. Comparison of immunoassay and gas chromatography–mass spectrometry for measurement of polycyclic aromatic hydrocarbons in contaminated soil. Anal. Chim. Acta 2003, 486, 31–39. [Google Scholar] [CrossRef]
  15. Zhang, W.; Lin, D.L.; Zou, Z.X.; Li, Y.Q. A novel approach for simultaneous determination of polycyclic aromatic hydrocarbons by Shpol’skii non-linear variable-angle synchronous fluorescence spectrometry. Talanta 2007, 71, 1481–1486. [Google Scholar] [CrossRef] [PubMed]
  16. Zhang, X.-X.; Yang, Y.; Korenaga, T. Determination of Polynuclear Aromatic Hydrocarbons (PAHs) in Environmental Samples by Capillary Electrophoresis. Anal. Sci. 1997, 13, 235–238. [Google Scholar] [CrossRef] [Green Version]
  17. Tommasini, M.; Lucotti, A.; Alfe, M.; Ciajolo, A.; Zerbi, G. Fingerprints of polycyclic aromatic hydrocarbons (PAHs) in infrared absorption spectroscopy. Spectrochim. Acta A Mol. Biomol. Spectrosc. 2016, 152, 134–148. [Google Scholar] [CrossRef] [PubMed]
  18. Fähnrich, K.A.; Pravda, M.; Guilbault, G.G. Immunochemical Detection of Polycyclic Aromatic Hydrocarbons (PAHs). Anal. Lett. 2002, 35, 1269–1300. [Google Scholar] [CrossRef]
  19. Kang, R.H.; Wang, Y.S.; Yang, H.M.; Li, G.R.; Tan, X.; Xue, J.H.; Zhang, J.Q.; Yuan, Y.K.; Shi, L.F.; Xiao, X.L. Rapid simultaneous analysis of 1-hydroxypyrene, 2-hydroxyfluorene, 9-hydroxyphenanthrene, 1- and 2-naphthol in urine by first derivative synchronous fluorescence spectrometry using Tween-20 as a sensitizer. Anal. Chim. Acta 2010, 658, 180–186. [Google Scholar] [CrossRef] [PubMed]
  20. Marlow, M.; Hurtubise, R.J. Liquid–liquid–liquid microextraction for the enrichment of polycyclic aromatic hydrocarbon metabolites investigated with fluorescence spectroscopy and capillary electrophoresis. Anal. Chim. Acta 2004, 526, 41–49. [Google Scholar] [CrossRef]
  21. Fan, M.; Andrade, G.F.S.; Brolo, A.G. A review on recent advances in the applications of surface-enhanced Raman scattering in analytical chemistry. Anal. Chim. Acta. 2020, 1097, 1–29. [Google Scholar] [CrossRef] [PubMed]
  22. Wang, P.; Sun, Y.; Wang, L.; Li, X.; Liu, M.; Li, G. Facile Detection and Quantification of Acetamiprid Using a Portable Raman Spectrometer Combined with Self-Assembled Gold Nanoparticle Array. Chemosensors 2021, 9, 327. [Google Scholar] [CrossRef]
  23. Sun, J.; Gong, L.; Wang, W.; Gong, Z.; Wang, D.; Fan, M. Surface-enhanced Raman spectroscopy for on-site analysis: A review of recent developments. Luminescence 2020, 35, 808–820. [Google Scholar] [CrossRef] [PubMed]
  24. Fu, Y.; Kuppe, C.; Valev, V.K.; Fu, H.; Zhang, L.; Chen, J. Surface-Enhanced Raman Spectroscopy: A Facile and Rapid Method for the Chemical Component Study of Individual Atmospheric Aerosol. Environ. Sci. Technol. 2017, 51, 6260–6267. [Google Scholar] [CrossRef] [PubMed]
  25. Chu, H.V.; Liu, Y.; Huang, Y.; Zhao, Y. A high sensitive fiber SERS probe based on silver nanorod arrays. Opt. Express 2007, 15, 12230–12239. [Google Scholar] [CrossRef]
  26. Li, D.; Qu, L.; Zhai, W.; Xue, J.; Fossey, J.S.; Long, Y. Facile on-site detection of substituted aromatic pollutants in water using thin layer chromatography combined with surface-enhanced Raman spectroscopy. Environ. Sci. Technol. 2011, 45, 4046–4052. [Google Scholar] [CrossRef] [PubMed]
  27. Gong, K.; Jones, R.R.; Li, K.; Xu, G.; Cheng, H.; Feng, Y.; Valev, V.K.; Zhang, L. Sensing pH of individual microdroplet by combining SERS and indicator paper. Sens. Actuators B Chem. 2021, 346, 130521. [Google Scholar] [CrossRef]
  28. Liu, B.; Zhou, P.; Liu, X.; Sun, X.; Li, H.; Lin, M. Detection of Pesticides in Fruits by Surface-Enhanced Raman Spectroscopy Coupled with Gold Nanostructures. Food Bioprocess Technol. 2012, 6, 710–718. [Google Scholar] [CrossRef]
  29. He, S.; Xie, W.; Zhang, W.; Zhang, L.; Wang, Y.; Liu, X.; Liu, Y.; Du, C. Multivariate qualitative analysis of banned additives in food safety using surface enhanced Raman scattering spectroscopy. Spectrochim. Acta A Mol. Biomol. Spectrosc. 2015, 137, 1092–1099. [Google Scholar] [CrossRef]
  30. Chou, A.; Jaatinen, E.; Buividas, R.; Seniutinas, G.; Juodkazis, S.; Izake, E.L.; Fredericks, P.M. SERS substrate for detection of explosives. Nanoscale 2012, 4, 7419–7424. [Google Scholar] [CrossRef]
  31. Emamian, S.; Eshkeiti, A.; Narakathu, B.B.; Avuthu, S.G.R.; Atashbar, M.Z. Gravure printed flexible surface enhanced Raman spectroscopy (SERS) substrate for detection of 2,4-dinitrotoluene (DNT) vapor. Sens. Actuators B Chem. 2015, 217, 129–135. [Google Scholar] [CrossRef] [Green Version]
  32. Gillibert, R.; Huang, J.Q.; Zhang, Y.; Fu, W.L.; Lamy de la Chapelle, M. Explosive detection by Surface Enhanced Raman Scattering. Trends Anal. Chem. 2018, 105, 166–172. [Google Scholar] [CrossRef]
  33. Liyanage, T.; Rael, A.; Shaffer, S.; Zaidi, S.; Goodpaster, J.V.; Sardar, R. Fabrication of a self-assembled and flexible SERS nanosensor for explosive detection at parts-per-quadrillion levels from fingerprints. Analyst 2018, 143, 2012–2022. [Google Scholar] [CrossRef] [Green Version]
  34. Alvarez-Puebla, R.A.; Liz-Marzan, L.M. SERS-based diagnosis and biodetection. Small 2010, 6, 604–610. [Google Scholar] [CrossRef] [PubMed]
  35. Feuillie, C. Raman spectroscopy in biomedicine: New advances in SERRS cancer imaging. Ann. Transl. Med. 2015, 3, 347. [Google Scholar] [CrossRef]
  36. Shumskaya, A.; Kozhina, E.; Bedin, S.; Andreev, S.; Kulesh, E.; Rogachev, A.; Yarmolenko, M.; Korolkov, I.; Kozlovskiy, A.; Zdorovets, M.; et al. Detection of Polynitro Compounds at Low Concentrations by SERS Using Ni@Au Nanotubes. Chemosensors 2022, 10, 306. [Google Scholar] [CrossRef]
  37. Le Ru, E.C.; Blackie, E.; Meyer, M.; Etchegoin, P.G. Etchegoin. Surface Enhanced Raman Scattering Enhancement Factors: A Comprehensive Study. J. Phys. Chem. C 2007, 111, 13794–13803. [Google Scholar] [CrossRef]
  38. Liu, J.; Liu, W.; Zhou, S.-N.; Wang, D.-M.; Gong, Z.-J.; Fan, M.-K. Free-Standing Membrane Liquid-State Platform for SERS-Based Determination of Norfloxacin in Environmental Samples. J. Anal. Test. 2021, 5, 217–224. [Google Scholar] [CrossRef]
  39. Liu, R.; Chen, Y.; Zhao, H.; Sun, J.; He, Z.; Shan, W.; Li, G.; Liu, J.; Jiang, G. Ligand-Sharing-Mediated Synthesis of Intermetallic FeM Clusters Embedded in Ultrathin γ-Fe2O3 Nanosheets. Adv. Funct. Mater. 2019, 30, 1906995. [Google Scholar] [CrossRef]
  40. Cai, L.J.; Wang, M.; Hu, Y.; Qian, D.J.; Chen, M. Synthesis and mechanistic study of stable water-soluble noble metal nanostructures. Nanotechnology 2011, 22, 285601. [Google Scholar] [CrossRef] [PubMed]
  41. Liang, P.; Guo, Q.; Zhao, T.; Wen, C.Y.; Tian, Z.; Shang, Y.; Xing, J.; Jiang, Y.; Zeng, J. Ag Nanoparticles with Ultrathin Au Shell-Based Lateral Flow Immunoassay for Colorimetric and SERS Dual-Mode Detection of SARS-CoV-2 IgG. Anal. Chem. 2022, 94, 8466–8473. [Google Scholar] [CrossRef] [PubMed]
  42. Pu, H.; Huang, Z.; Xu, F.; Sun, D.W. Two-dimensional self-assembled Au-Ag core-shell nanorods nanoarray for sensitive detection of thiram in apple using surface-enhanced Raman spectroscopy. Food Chem. 2021, 343, 128548. [Google Scholar] [CrossRef] [PubMed]
  43. Yaseen, T.; Pu, H.; Sun, D.-W. Functionalization techniques for improving SERS substrates and their applications in food safety evaluation: A review of recent research trends. Trends Food Sci. Technol. 2018, 72, 162–174. [Google Scholar] [CrossRef]
  44. Yang, B.; Wang, Y.; Guo, S.; Jin, S.; Park, E.; Chen, L.; Jung, Y.M. Charge transfer study for semiconductor and semiconductor/metal composites based on surface-enhanced Raman scattering. Bull. Korean Chem. Soc. 2021, 42, 1411–1418. [Google Scholar] [CrossRef]
  45. Song, G.; Gong, W.; Cong, S.; Zhao, Z. Ultrathin Two-Dimensional Nanostructures: Surface Defects for Morphology-Driven Enhanced Semiconductor SERS. Angew Chem. Int. Ed. Engl. 2021, 60, 5505–5511. [Google Scholar] [CrossRef]
  46. Eshkeiti, A.; Narakathu, B.B.; Reddy, A.S.G.; Moorthi, A.; Atashbar, M.Z.; Rebrosova, E.; Rebros, M.; Joyce, M. Detection of heavy metal compounds using a novel inkjet printed surface enhanced Raman spectroscopy (SERS) substrate. Sens. Actuators B Chem. 2012, 171-172, 705–711. [Google Scholar] [CrossRef]
  47. Fan, M.; Zhang, Z.; Hu, J.; Cheng, F.; Wang, C.; Tang, C.; Lin, J.; Brolo, A.G.; Zhan, H. Ag decorated sandpaper as flexible SERS substrate for direct swabbing sampling. Mater. Lett. 2014, 133, 57–59. [Google Scholar] [CrossRef]
  48. Wang, D.; Zhu, J.; Hui, B.; Gong, Z.; Fan, M. Halogen ion-modified silver nanoparticles for ultrasensitive surface-enhanced Raman spectroscopy detection of polycyclic aromatic hydrocarbons. Luminescence 2022, 37, 1541–1546. [Google Scholar] [CrossRef]
  49. Gong, X.; Liao, X.; Li, Y.; Cao, H.; Zhao, Y.; Li, H.; Cassidy, D.P. Sensitive detection of polycyclic aromatic hydrocarbons with gold colloid coupled chloride ion SERS sensor. Analyst 2019, 144, 6698–6705. [Google Scholar] [CrossRef]
  50. Du, J.; Jing, C. Preparation of Thiol Modified Fe3O4@Ag Magnetic SERS Probe for PAHs Detection and Identification. J. Phys. Chem. C 2011, 115, 17829–17835. [Google Scholar] [CrossRef]
  51. Li, X.J.; Li, Y.T.; Gu, H.X.; Xue, P.F.; Qin, L.X.; Han, S. A wearable screen-printed SERS array sensor on fire-retardant fibre gloves for on-site environmental emergency monitoring. Anal. Methods 2022, 14, 781–788. [Google Scholar] [CrossRef] [PubMed]
  52. Li, D.; Cao, X.; Zhang, Q.; Ren, X.; Jiang, L.; Li, D.; Deng, W.; Liu, H. Facile in situ synthesis of core–shell MOF@Ag nanoparticle composites on screen-printed electrodes for ultrasensitive SERS detection of polycyclic aromatic hydrocarbons. J. Mater. Chem. A 2019, 7, 14108–14117. [Google Scholar] [CrossRef]
  53. Zhang, M.; Tian, Y.; Jiao, A.; Ma, H.; Wang, C.; Zheng, L.; Li, S.; Chen, M. Synergistic double laser beam-boosted liquid-NIR-SERS for ultralow detection of non-adsorptive polycyclic aromatic hydrocarbons in lake water. Nanophotonics 2022, 11, 2875–2889. [Google Scholar] [CrossRef]
  54. Yuan, J.; Emura, K.; Farnham, C. Geometrical-optics analysis of reflective glass beads applied to building coatings. Sol. Energy 2015, 122, 997–1010. [Google Scholar] [CrossRef]
  55. Huang, Y.; Liu, W.; Gong, Z.; Wu, W.; Fan, M.; Wang, D.; Brolo, A.G. Detection of Buried Explosives Using a Surface-Enhanced Raman Scattering (SERS) Substrate Tailored for Miniaturized Spectrometers. ACS Sens. 2020, 5, 2933–2939. [Google Scholar] [CrossRef]
  56. Szlag, V.M.; Rodriguez, R.S.; He, J.; Hudson-Smith, N.; Kang, H.; Le, N.; Reineke, T.M.; Haynes, C.L. Molecular Affinity Agents for Intrinsic Surface-Enhanced Raman Scattering (SERS) Sensors. ACS Appl. Mater. Interfaces 2018, 10, 31825–31844. [Google Scholar] [CrossRef] [PubMed]
  57. Sadrara, M.; Khorrami, M.K.; Darian, J.T.; Garmarudi, A.B. Fabrication of highly mesoporous ZSM-48 zeolite by anionic surfactant-organosilane system for catalytic conversion of methanol to gasoline. Solid State Sci. 2022, 128, 106888. [Google Scholar] [CrossRef]
  58. Andrade, G.F.; Fan, M.; Brolo, A.G. Multilayer silver nanoparticles-modified optical fiber tip for high performance SERS remote sensing. Biosens. Bioelectron. 2010, 25, 2270–2275. [Google Scholar] [CrossRef] [PubMed]
  59. Zhu, C.; Liu, W.; Wang, D.; Gong, Z.; Fan, M. Boosting bacteria differentiation efficiency with multidimensional surface-enhanced Raman scattering: The example of Bacillus cereus. Luminescence 2022, 37, 1145–1151. [Google Scholar] [CrossRef]
  60. Zhou, Z.; Lu, J.; Wang, J.; Zou, Y.; Liu, T.; Zhang, Y.; Liu, G.; Tian, Z. Trace detection of polycyclic aromatic hydrocarbons in environmental waters by SERS. Spectrochim. Acta A Mol. Biomol. Spectrosc. 2020, 234, 118250. [Google Scholar] [CrossRef]
  61. Lu, J.; Cai, Z.; Zou, Y.; Wu, D.; Wang, A.; Chang, J.; Wang, F.; Tian, Z.; Liu, G. Silver Nanoparticle-Based Surface-Enhanced Raman Spectroscopy for the Rapid and Selective Detection of Trace Tropane Alkaloids in Food. ACS Appl. Nano Mater. 2019, 2, 6592–6601. [Google Scholar] [CrossRef]
  62. Fan, W.; Yang, S.; Zhang, Y.; Huang, B.; Gong, Z.; Wang, D.; Fan, M. Multifunctional Flexible SERS Sensor on a Fixate Gel Pad: Capturing, Derivation, and Selective Picogram Indirect Detection of Explosive 2,2’,4,4’,6,6’-Hexanitrostilbene. ACS Sens. 2020, 5, 3599–3606. [Google Scholar] [CrossRef] [PubMed]
  63. Hasi, W.-L.-J.; Lin, X.; Lou, X.-T.; Lin, S.; Yang, F.; Lin, D.-Y.; Lu, Z.-W. Chloride ion-assisted self-assembly of silver nanoparticles on filter paper as SERS substrate. Appl. Phys. A 2014, 118, 799–807. [Google Scholar] [CrossRef]
  64. Jones, C.L.; Bantz, K.C.; Haynes, C.L. Partition layer-modified substrates for reversible surface-enhanced Raman scattering detection of polycyclic aromatic hydrocarbons. Anal. Bioanal. Chem. 2009, 394, 303–311. [Google Scholar] [CrossRef] [PubMed]
  65. Qu, L.L.; Li, Y.T.; Li, D.W.; Xue, J.Q.; Fossey, J.S.; Long, Y.T. Humic acids-based one-step fabrication of SERS substrates for detection of polycyclic aromatic hydrocarbons. Analyst 2013, 138, 1523–1528. [Google Scholar] [CrossRef] [PubMed]
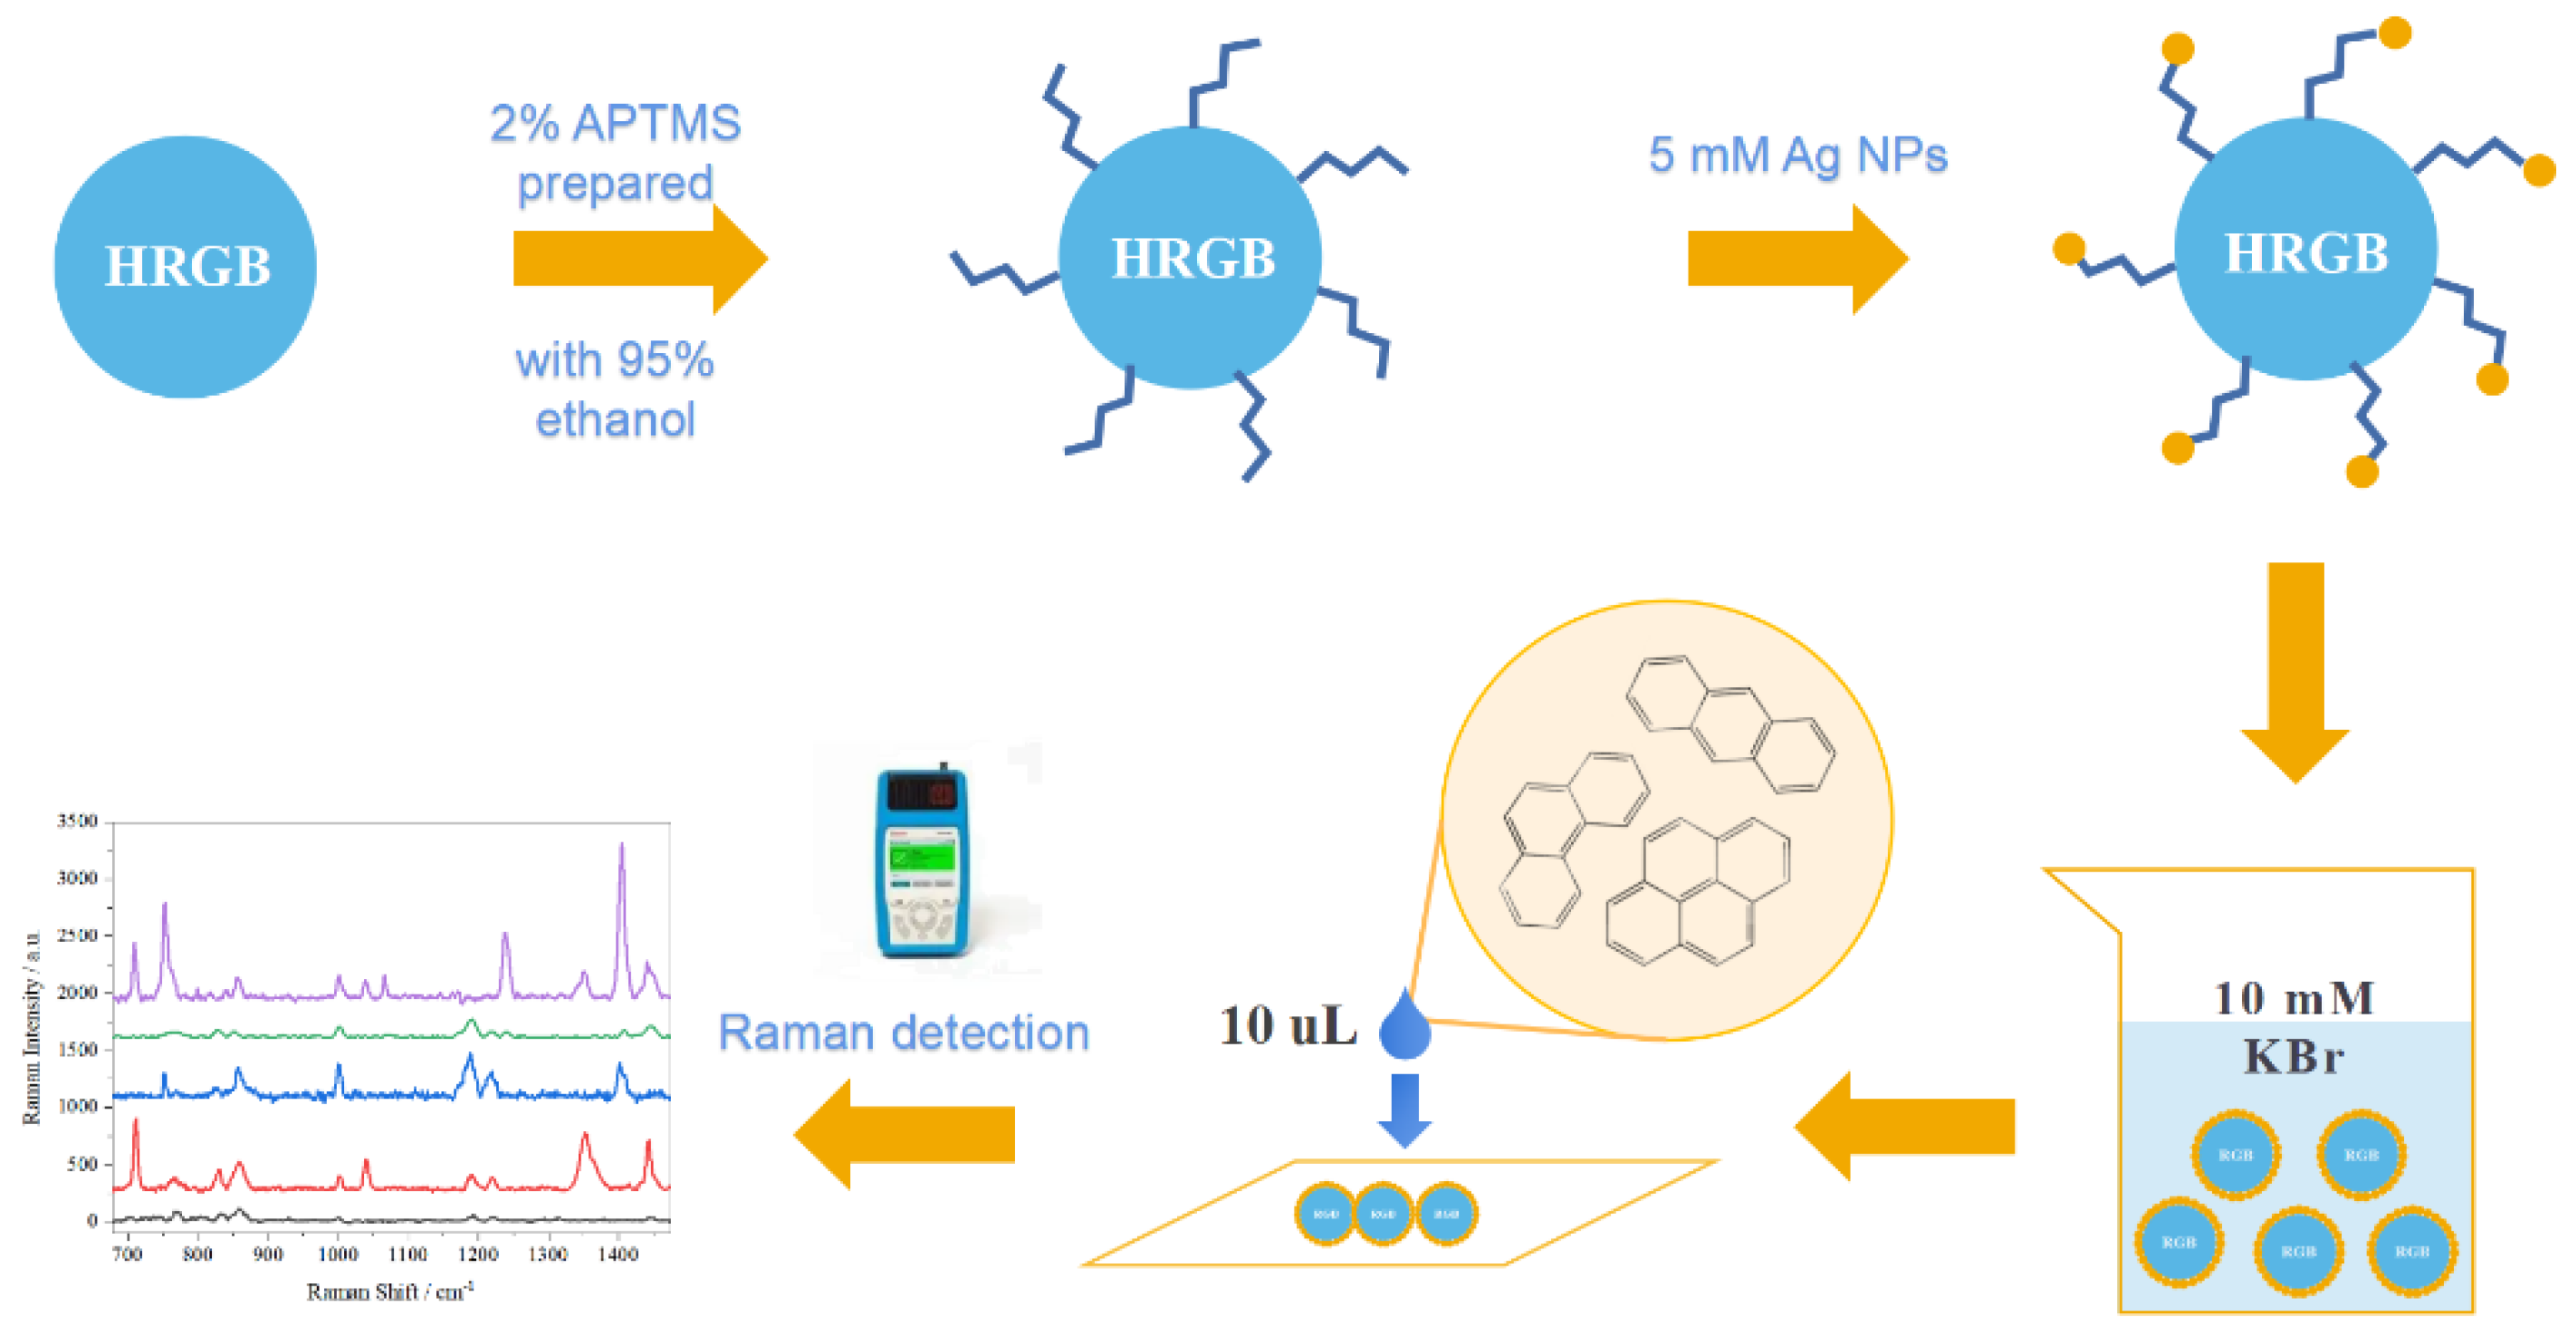
Scheme 1. Schematic representation of the preparation and application of HRGB–SERS substrate.
Chemosensors 10 00406 sch001
Figure 1. UV-Vis spectrum of Ag NPs prepared with 1 mM and 5 mM AgNO3.
Chemosensors 10 00406 g001
Figure 2. (A). SERS spectrum of R6G–ethanol solution with a concentration of 10 μM detected by RGB-SERS substrates with different deposition rounds. Spectra (a) to (c) represent the deposition of silver nanoparticles in 1, 2, and 3 rounds, respectively. Laser power: 13.8 MW; integration time: 1 s × 1; objective lens: 20×. (BD). SEM images of Ag-NP-deposited HRGBs; (BD) represents 1, 2, and 3 rounds, respectively.
Chemosensors 10 00406 g002
Figure 3. (A). SERS spectrum of pyrene–ethanol solution with a concentration of 100 uM after dripping a volume of 10 μL on KBr—(a), KI—(b), NaBr-modified—(c) and unmodified—(d) RGB-SERS substrate for SERS detection; (B). SERS spectrum of pyrene–ethanol solution with a concentration of 10 μM after dripping a volume of 10 μL on the KBr-modified RGB-SERS substrate for SERS detection. Spectra (a–e) represent 30, 20, 10, 5, and 1 mM KBr, respectively.
Chemosensors 10 00406 g003
Figure 4. SERS spectra of pyrene–ethanol solution at different concentrations after dripping a volume of 10 μL on the 10 mM–KBr–modified RGB-SERS substrate for SERS detection. Spectra (a) to (d) represent 100, 10, 1, and 0.1 μM, respectively. Laser power: 13.8 MW; integration time: 1 s × 1; objective lens: 20×.
Chemosensors 10 00406 g004
Figure 5. (A). SERS spectrum of R6G–ethanol solution with a concentration of 10 nM after dripping a volume of 10 μL on the unmodified HRGB-SERS substrate for SERS detection. Spectra (a) to (c) represent 0, 7, and 31 days after the substrate preparation, respectively. (B). SERS spectrum of pyrene–ethanol solution with a concentration of 10 μM after dropping a volume of 10 μL on the modified HRGB-SERS substrate for SERS detection. Spectra (a) to (e) represent 0, 2, 4, 8, and 10 days after the substrate preparation, respectively. Laser power: 13.8 MW; integration time: 1 s × 1; objective lens: 20×.
Chemosensors 10 00406 g005
Figure 6. (A). (a) SERS spectra of simulated water samples, (b) 1 μM pyrene–ethanol solution, (c) 10 μM anthracene–ethanol solution, (d) 10 μM phenanthrene–ethanol solution, and (e) blank; (B). SERS spectrum of actual mixed water sample (a) and lake water blank (b) after dripping a volume of 10 μL on the 10 mM-KBr-modified RGB-SERS substrate.
Chemosensors 10 00406 g006
Table 1. The stretching modes correspond to the characteristic peak of PAHs.
PAHsBand (cm−1)Stretching Modes [65]
Phenanthrene711Skeletal deformation
1037C–C stretching
1353H–C–C bending
Anthracene752Para-disubstituted benzenes
1042Ring stretching
Pyrene1069C–H rocking
1240C–H in-plane bending
1408C–C stretching
Table 2. Water quality index of lake water.
Temperature/°CpHTurbidityChrominanceElectrical ConductivityCOD/mg·L−1
208.5027.022135.524
Publisher’s Note: MDPI stays neutral with regard to jurisdictional claims in published maps and institutional affiliations.