
Three-Dimensional Reproducibility of the Soft Tissue Landmarks Taken by Structured-Light Facial Scanner in Accordance with the Head Position Change


Abstract
1. Introduction
2. Materials and Methods
3. Results
4. Discussion
Author Contributions
Funding
Institutional Review Board Statement
Informed Consent Statement
Data Availability Statement
Conflicts of Interest
References
- Proffit, W.R.; Fields, H.W.; Sarver, D.M. Contemporary Orthodontics, 5th ed.; Mosby: St. Louis, MO, USA, 2013. [Google Scholar]
- Lane, C.; Harrell, W., Jr. Completing the 3-dimensional picture. Am. J. Orthod. Dentofac. Orthop. 2008, 133, 612–620. [Google Scholar] [CrossRef] [PubMed]
- Scholz, R.P. Considerations in selecting a digital camera for orthodontic records. Am. J. Orthod. Dentofac. Orthop. 1998, 114, 603–605. [Google Scholar] [CrossRef]
- Smith, S.L.; Throckmorton, G.S. A new technique for three-dimensional ultrasound scanning of facial tissues. J. Forensic Sci. 2004, 49, 451–457. [Google Scholar] [CrossRef]
- Kau, C.H.; Richmond, S.; Incrapera, A.; English, J.; Xia, J.J. Three-dimensional surface acquisition systems for the study of facial morphology and their application to maxillofacial surgery. Int. J. Med Robot. Comput. Assist. Surg. 2007, 3, 97–110. [Google Scholar] [CrossRef]
- Zhang, G.X.; Zhao, Z.H.; Wang, B.Y.; Xu, L.J.; Feng, G.C.; Qian, W.Y. The application of multi-slice CT and MRI on maxillofacial region soft tissue measurement. Shanghai J. Stomatol. 2010, 19, 460–463. [Google Scholar]
- Deli, R.; Di Gioia, E.; Galantucci, L.M.; Percoco, G. Automated landmark extraction for orthodontic measurement of faces using the 3-camera photogrammetry methodology. J. Craniofacial Surg. 2010, 21, 87–93. [Google Scholar] [CrossRef]
- Hwang, H.S.; Kim, K.; Moon, D.N.; Kim, J.H.; Wilkinson, C. Reproducibility of facial soft tissue thicknesses for craniofacial reconstruction using cone-beam CT images. J. Forensic Sci. 2012, 57, 443–448. [Google Scholar] [CrossRef] [PubMed]
- Coward, T.J.; Watson, R.M.; Scott, B.J. Laser scanning for the identification of repeatable landmarks of the ears and face. Br. J. Plast. Surg. 1997, 50, 308–314. [Google Scholar] [CrossRef]
- Hill, D.L.; Berg, D.C.; Raso, V.J.; Lou, E.; Durdle, N.G.; Mahood, J.K.; Moreau, M.J. Evaluation of a laser scanner for surface topography. Stud. Health Technol. Inform. 2002, 88, 90–94. [Google Scholar]
- Aldridge, K.; Boyadjiev, S.A.; Capone, G.T.; DeLeon, V.B.; Richtsmeier, J.T. Precision and error of three-dimensional phenotypic measures acquired from 3dMD photogrammetric images. Am. J. Med. Genet. 2005, 138, 247–253. [Google Scholar] [CrossRef]
- Losken, A.; Fishman, I.; Denson, D.D.; Moyer, H.R.; Carlson, G.W. An objective evaluation of breast symmetry and shape differences using 3-dimensional images. Ann. Plast. Surg. 2005, 55, 571–575. [Google Scholar] [CrossRef] [PubMed]
- Weinberg, S.M.; Scott, N.M.; Neiswanger, K.; Brandon, C.A.; Marazita, M.L. Digital three-dimensional photogrammetry: Evaluation of anthropometric precision and accuracy using a Genex 3D camera system. Cleft Palate-Craniofacial J. 2004, 41, 507–518. [Google Scholar] [CrossRef]
- Kimoto, K.; Garrett, N.R. Evaluation of a 3D digital photographic imaging system of the human face. J. Oral Rehabil. 2007, 34, 201–205. [Google Scholar] [CrossRef] [PubMed]
- Othman, S.A.; Ahmad, R.; Mericant, A.F.; Jamaludin, M. Reproducibility of facial soft tissue landmarks on facial images captured on a 3D camera. Aust. Orthod. J. 2013, 29, 58–65. [Google Scholar]
- Toma, A.M.; Zhurov, A.; Playle, R.; Ong, E.; Richmond, S. Reproducibility of facial soft tissue landmarks on 3D laser-scanned facial images. Orthod. Craniofacial Res. 2009, 12, 33–42. [Google Scholar] [CrossRef] [PubMed]
- Kovacs, L.; Zimmermann, A.; Brockmann, G.; Baurecht, H.; Schwenzer-Zimmerer, K.; Papadopulos, N.A.; Papadopoulos, M.A.; Sader, R.; Biemer, E.; Zeilhofer, H.F. Accuracy and precision of the three-dimensional assessment of the facial surface using a 3-D laser scanner. IEEE Trans. Med. Imaging 2006, 25, 742–754. [Google Scholar] [CrossRef]
- Gwilliam, J.R.; Cunningham, S.J.; Hutton, T. Reproducibility of soft tissue landmarks on three-dimensional facial scans. Eur. J. Orthod. 2006, 28, 408–415. [Google Scholar] [CrossRef]
- Kau, C.H.; Richmond, S.; Zhurov, A.I.; Knox, J.; Chestnutt, I.; Hartles, F.; Playle, R. Reliability of measuring facial morphology with a 3-dimensional laser scanning system. Am. J. Orthod. Dentofac. Orthop. 2005, 128, 424–430. [Google Scholar] [CrossRef]
- Ma, L.; Xu, T.; Lin, J. Validation of a three-dimensional facial scanning system based on structured light techniques. Comput. Methods Programs Biomed. 2009, 94, 290–298. [Google Scholar] [CrossRef] [PubMed]
- Fink, M.; Medelnik, J.; Strobel, K.; Hirschfelder, U.; Hofmann, E. Metric precision via soft-tissue landmarks in three-dimensional structured-light scans of human faces. J. Orofac. Orthop. 2014, 75, 133–143. [Google Scholar] [CrossRef]
- R Development Core Team. R: A Language and Environment for Statistical Computing; R Foundation for Statistical Computing: Vienna, Austria, 2013. [Google Scholar]
- Peng, J.X.; Jiang, J.H.; Zhao, Y.J.; Wang, Y.; Li, Z.; Wang, N.N.; Feng, Z.M. Preliminary evaluation on 3-demension changes of facial soft tissue with structure light scanning technique before and after orthognathic surgery of Class III deformities. J. Peking Univ. Health Sci. 2015, 47, 98–103. [Google Scholar]
- Ahn, H.W.; Chang, Y.J.; Kim, K.A.; Joo, S.H.; Park, Y.G.; Park, K.H. Measurement of three-dimensional perioral soft tissue changes in dentoalveolar protrusion patients after orthodontic treatment using a structured light scanner. Angle Orthod. 2014, 84, 795–802. [Google Scholar] [CrossRef] [PubMed]
- Verze, L.; Bianchi, F.A.; Ramieri, G. Three-dimensional laser scanner evaluation of facial soft tissue changes after LeFort I advancement and rhinoplasty surgery: Patients with cleft lip and palate vs patients with nonclefted maxillary retrognathic dysplasia (control group). Oral Surg. Oral Med. Oral Pathol. Oral Radiol. 2014, 117, 416–423. [Google Scholar] [CrossRef] [PubMed]
- Lee, K.M.; Song, H.Y.; Lee, K.H.; Hwang, H.S. Influence of the angles and number of scans on the accuracy of 3D laser scanning. Korean J. Orthod. 2011, 41, 76–86. [Google Scholar] [CrossRef]
- Djordjevic, J.; Toma, A.M.; Zhurov, A.I.; Richmond, S. Three-dimensional quantification of facial symmetry in adolescents using laser surface scanning. Eur. J. Orthod. 2014, 36, 125–132. [Google Scholar] [CrossRef]
- Primozic, J.; Perinetti, G.; Zhurov, A.; Richmond, S.; Ovsenik, M. Assessment of facial asymmetry in growing subjects with a three-dimensional laser scanning system. Orthod. Craniofacial Res. 2012, 15, 237–244. [Google Scholar] [CrossRef] [PubMed]


| Group D−0° | Group D+5° | Group D−5° | Group D+10° | Group D−10° | ||||||||||||||||
|---|---|---|---|---|---|---|---|---|---|---|---|---|---|---|---|---|---|---|---|---|
| Median | IQR | Median | IQR | Median | IQR | Median | IQR | Median | IQR | |||||||||||
| x | y | z | x | y | z | x | y | z | x | y | z | x | y | z | ||||||
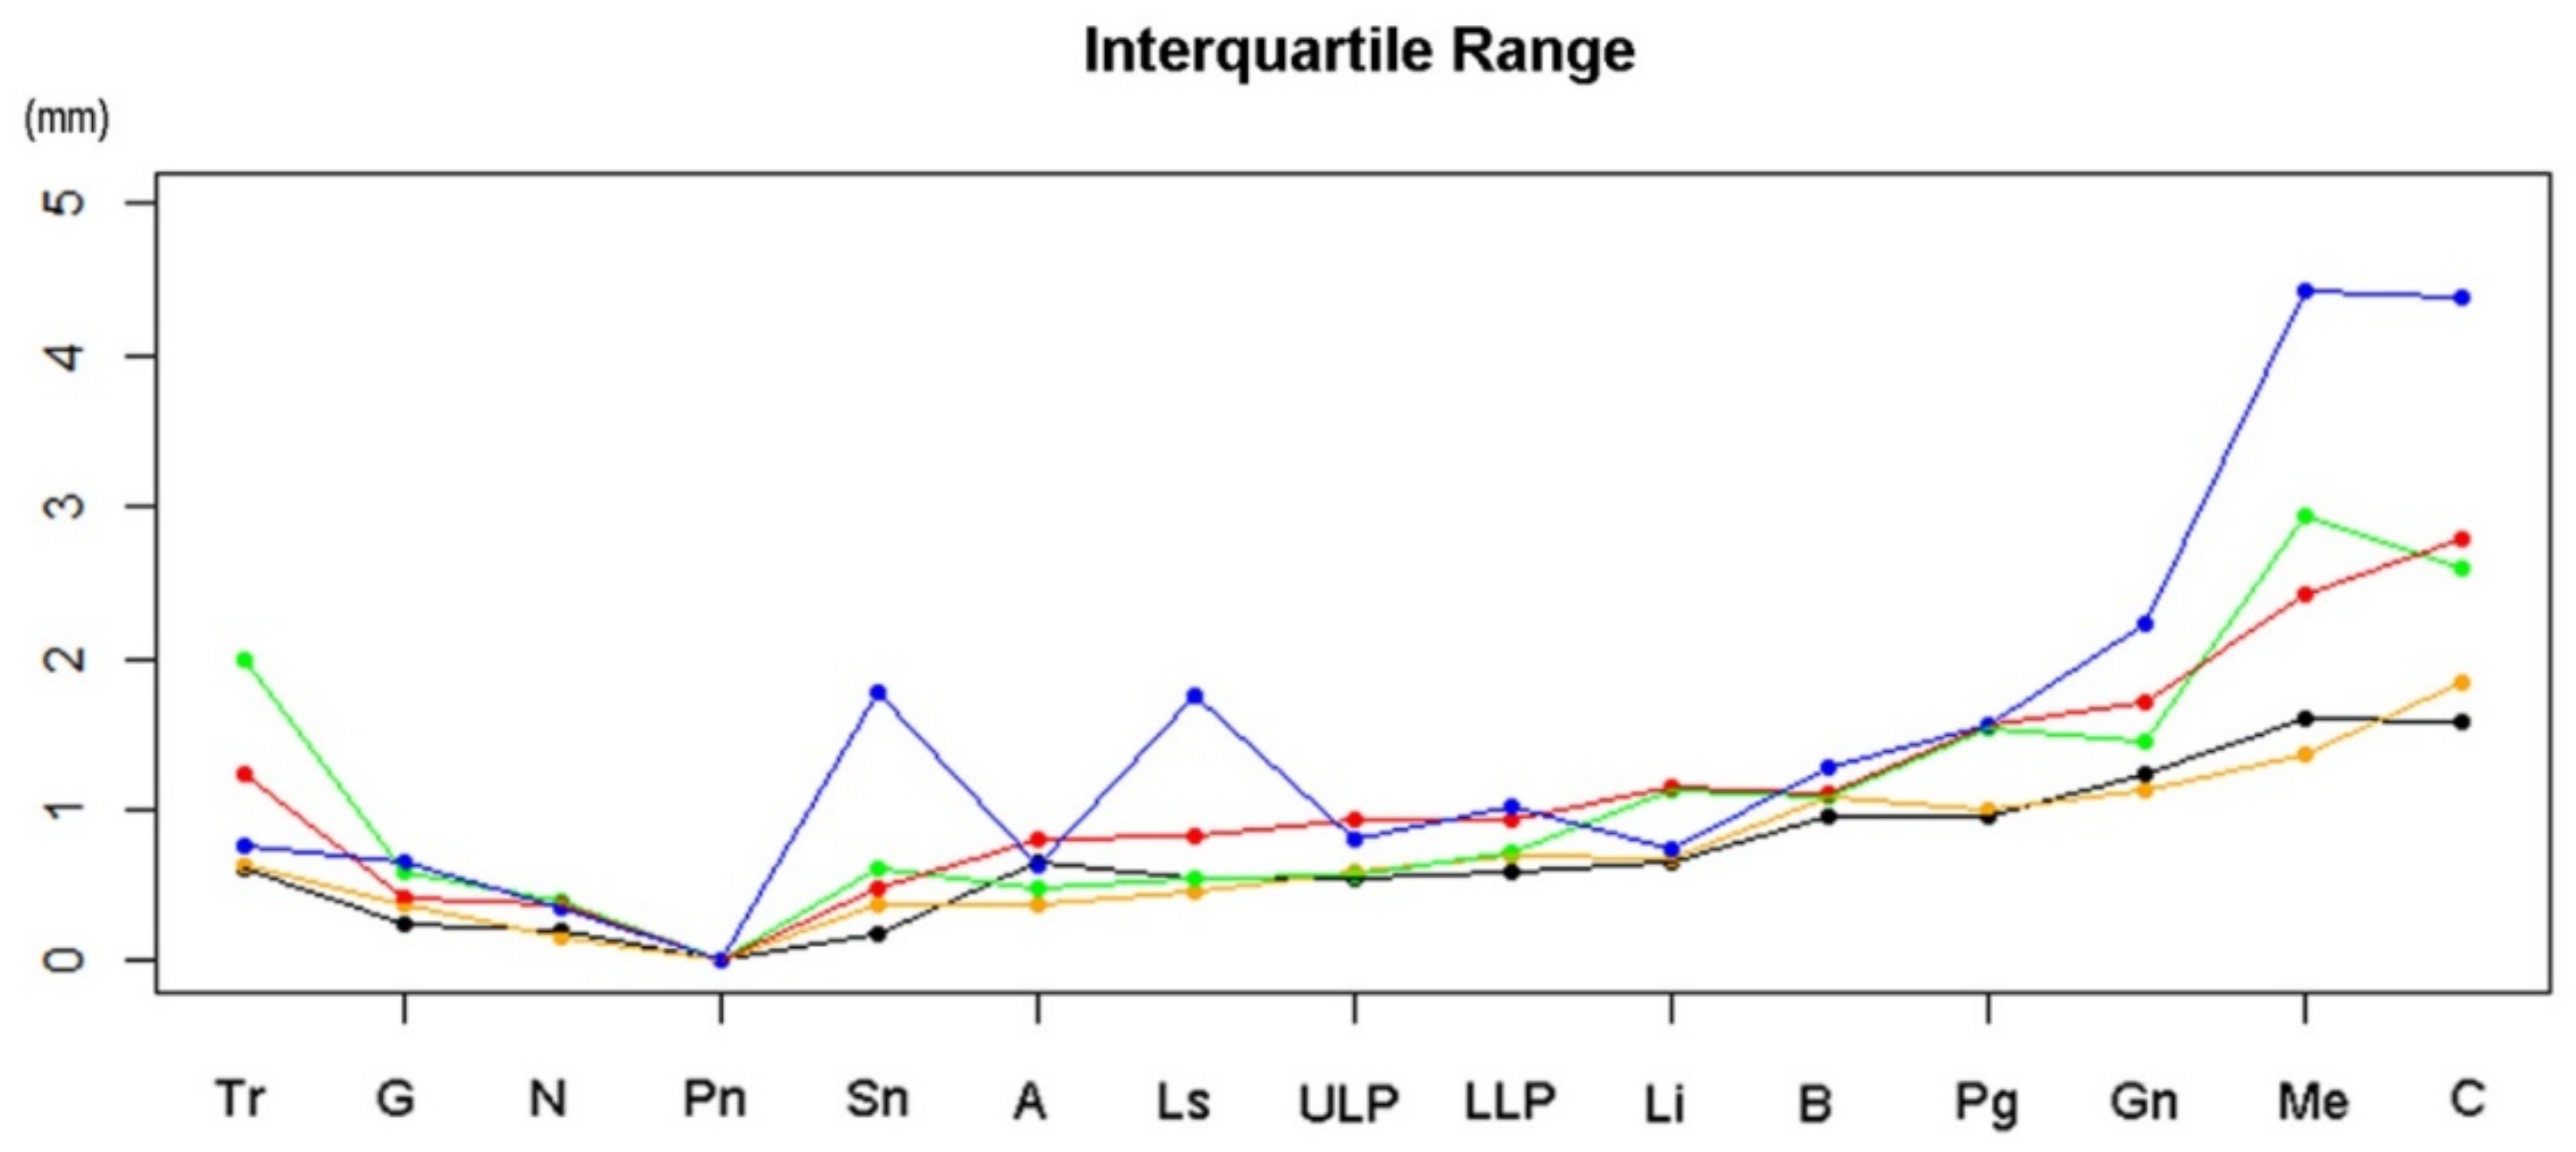
| Tr | −25.59 | 1.40 | 88.60 | 0.61 | −25.69 | 1.32 | 88.73 | 0.64 | −26.82 | 1.32 | 88.30 | 1.99 | −26.43 | 1.38 | 88.20 | 1.24 | −27.18 | 1.68 | 88.21 | 0.76 |
| G | −17.19 | 0.13 | 35.28 | 0.24 | −17.31 | 0.35 | 35.36 | 0.37 | −16.75 | 0.34 | 35.13 | 0.58 | −17.66 | 0.11 | 35.32 | 0.43 | −17.46 | 0.19 | 35.29 | 0.64 |
| N | −16.96 | 0.00 | 29.38 | 0.19 | −17.10 | 0.00 | 29.62 | 0.16 | −16.79 | 0.00 | 29.08 | 0.40 | −17.07 | 0.00 | 29.57 | 0.36 | −17.07 | 0.00 | 29.57 | 0.34 |
| Sn | −7.95 | 0.00 | −12.26 | 0.18 | −7.67 | 0.00 | −12.06 | 0.38 | −7.21 | 0.00 | −12.49 | 0.61 | −7.73 | 0.00 | −11.98 | 0.47 | −7.42 | 0.00 | −12.21 | 1.78 |
| A | −10.55 | 0.23 | −17.53 | 0.65 | −10.29 | 0.40 | −17.62 | 0.38 | −10.47 | 0.40 | −17.89 | 0.49 | −10.32 | 0.50 | −18.17 | 0.80 | −10.19 | 0.16 | −17.67 | 0.64 |
| Ls | −9.01 | 0.25 | −26.27 | 0.56 | −8.60 | 0.12 | −26.26 | 0.45 | −6.61 | 0.21 | −26.08 | 0.55 | −8.02 | 0.10 | −26.56 | 0.82 | −8.47 | −0.52 | −27.68 | 1.76 |
| ULP | −9.53 | 0.21 | −30.30 | 0.55 | −8.83 | 0.09 | −30.40 | 0.59 | −7.82 | 0.05 | −30.00 | 0.56 | −9.56 | 0.37 | −30.60 | 0.93 | −8.91 | −0.30 | −30.68 | 0.80 |
| LLP | −12.40 | 0.31 | −39.41 | 0.58 | −12.12 | 0.47 | −39.22 | 0.70 | −10.89 | 0.65 | −39.39 | 0.73 | −11.48 | 0.22 | −39.43 | 0.92 | −11.76 | −0.37 | −39.19 | 1.03 |
| Li | −15.58 | 0.24 | −44.42 | 0.66 | −14.99 | 0.33 | −44.37 | 0.68 | −13.91 | 0.31 | −45.01 | 1.12 | −14.79 | 0.12 | −44.43 | 1.15 | −14.69 | −0.71 | −44.50 | 0.73 |
| B | −20.91 | 0.24 | −51.92 | 0.95 | −20.69 | 0.68 | −51.86 | 1.08 | −19.00 | 0.29 | −52.29 | 1.09 | −20.14 | 0.04 | −53.00 | 1.10 | −20.20 | −0.28 | −51.88 | 1.28 |
| Pg | −20.75 | 0.57 | −63.45 | 0.95 | −20.40 | 0.99 | −63.23 | 1.01 | −18.30 | 1.07 | −63.54 | 1.53 | −19.77 | 0.39 | −63.45 | 1.55 | −19.76 | −0.09 | −62.81 | 1.57 |
| Gn | −25.92 | 0.58 | −71.56 | 1.24 | −24.51 | 0.85 | −71.59 | 1.13 | −22.40 | 0.52 | −71.93 | 1.46 | −23.83 | 0.36 | −71.83 | 1.72 | −23.97 | −0.04 | −70.91 | 2.23 |
| Me | −36.24 | 1.65 | −75.39 | 1.61 | −34.83 | 2.16 | −75.27 | 1.37 | −34.03 | 1.80 | −75.81 | 2.94 | −33.90 | 1.12 | −75.60 | 2.42 | −35.34 | 0.46 | −75.20 | 4.44 |
| C | −46.41 | 2.27 | −79.49 | 1.59 | −46.12 | 2.75 | −79.82 | 1.84 | −44.84 | 2.09 | −81.69 | 2.60 | −45.32 | 2.18 | −80.31 | 2.80 | −46.66 | 1.17 | −81.53 | 4.39 |
Publisher’s Note: MDPI stays neutral with regard to jurisdictional claims in published maps and institutional affiliations. |
© 2021 by the authors. Licensee MDPI, Basel, Switzerland. This article is an open access article distributed under the terms and conditions of the Creative Commons Attribution (CC BY) license (https://creativecommons.org/licenses/by/4.0/).
Share and Cite
Oh, S.-H.; Park, J.-S.; Ryu, J.-J.; Song, I.-S.; Jung, S.-K. Three-Dimensional Reproducibility of the Soft Tissue Landmarks Taken by Structured-Light Facial Scanner in Accordance with the Head Position Change. Healthcare 2021, 9, 428. https://doi.org/10.3390/healthcare9040428
Oh S-H, Park J-S, Ryu J-J, Song I-S, Jung S-K. Three-Dimensional Reproducibility of the Soft Tissue Landmarks Taken by Structured-Light Facial Scanner in Accordance with the Head Position Change. Healthcare. 2021; 9(4):428. https://doi.org/10.3390/healthcare9040428
Chicago/Turabian StyleOh, Seung-Hoon, Jung-Soo Park, Jae-Jun Ryu, In-Seok Song, and Seok-Ki Jung. 2021. "Three-Dimensional Reproducibility of the Soft Tissue Landmarks Taken by Structured-Light Facial Scanner in Accordance with the Head Position Change" Healthcare 9, no. 4: 428. https://doi.org/10.3390/healthcare9040428
APA StyleOh, S.-H., Park, J.-S., Ryu, J.-J., Song, I.-S., & Jung, S.-K. (2021). Three-Dimensional Reproducibility of the Soft Tissue Landmarks Taken by Structured-Light Facial Scanner in Accordance with the Head Position Change. Healthcare, 9(4), 428. https://doi.org/10.3390/healthcare9040428