Data Analysis Model Design of Health Service Monitoring System for China’s Elderly Population: The Proposal of the F-W Model Based on the Collaborative Governance Theory of Healthy Aging

Abstract
:1. Introduction
2. Materials and Method
2.1. Materials
2.2. Logistic Regression Analysis of the Indicators for the HA
3. Regional Healthy Service Monitoring System Design
4. Discussion
5. Conclusions
Author Contributions
Funding
Institutional Review Board Statement
Informed Consent Statement
Data Availability Statement
Acknowledgments
Conflicts of Interest
Appendix A

| Dependent Variables | Question and Scale Items | Location in CHARLS 2015 |
|---|---|---|
| Y1 | Do you have one of the following disabilities? Including physical disabilities, brain damage, vision problem, etc. Have you been diagnosed with chronic disease? Hypertension, Diabetes or high blood sugar, etc. | Da005, Da008 |
| Y2 | ADL scale; including dressing, showering, eating, getting into or out of bed, using the toilet, controlling urination and defecation, doing household chores, shopping, making phone calls and taking the right portion of medication right on time | From Db010 to Db020 |
| Y3 | Hospital Anxiety and Depression scale; like the objective criteria: I was bothered by things that don’t usually bother me. I had trouble keeping my mind on what I was doing. I felt depressed, etc. | From Dc009 to Dc018 |
| Y4 | How often in the last month do voluntary or charity work, cared for a sick or disabled adult, provided help to family, friends or neighbors, attended an educational or training course, interacted with friends, go to a sport, social or other kind of club, taken part in a community-related organization? Almost daily, almost every week, or not regularly? | Da057 |
| X1 | Interviewer record R’s gender | Ba000_w2_3 |
| X2 | What’s your actual date of birth? | Ba004_w3_1 |
| X3 | Was your address village or city/town? | Bb000_w3_2 |
| X4 | What’s the highest level of education your have attained now? | BD001_W2_4 |
| X5 | What is your marital status? | Be001 |
| X6 | Suppose that in the future, you needed help with basic daily activities like eating or dressing. Do you have relatives or friends (besides your spouse/partner) who would be willing and able to help you over a long period of time? | Db030 |
| X7 | What is the highest level of education (child’s name) have completed? | Cb052_w3_2_ |
| X8 | Where does this (child’s name) normally live now? | Cb053_1_ |
| X9 | What is (child’s name) status? | Cb063_1_ |
| X10 | How is (child’s name) health? Very good, good, fair, poor or very poor? | Cb063_w3_1_1_ |
| X11 | Does (child’s name) own a house? | Cb071_w3_1_ |
| X12 | Approximately how many weeks and how many hours per week did you spend last year taking care of this child’s children? | Cf003_1_1_ |
| Y | Odds Ratio | Std. Err. | z | p > |z| | (95% Conf. Interval) |
|---|---|---|---|---|---|
| X1 | 1.228 | 0.260 | 0.97 | 0.332 | (0.810, 1.860) |
| X2 | 1.697 | 0.383 | 2.34 | 0.019 | (1.090, 2.641) |
| X3 | 1.606 | 0.351 | 2.17 | 0.030 | (1.046, 2.466) |
| X4 | 0.727 | 0.158 | −1.47 | 0.142 | (0.476, 1.113) |
| X5 | 1.046 | 0.273 | 0.18 | 0.860 | (0.628, 1.744) |
| X6 | 1.649 | 0.364 | 2.27 | 0.023 | (1.074, 2.542) |
| X7 | 0.515 | 0.177 | −1.93 | 0.054 | (0.263, 1.011) |
| X8 | 0.879 | 0.185 | −0.61 | 0.542 | (0.582, 1.329) |
| X9 | 1.058 | 0.282 | 0.21 | 0.832 | (0.627, 1.786) |
| X10 | 1.177 | 0.124 | 1.55 | 0.122 | (0.957, 1.447) |
| X11 | 1.226 | 0.275 | 0.91 | 0.364 | (0.789, 1.906) |
| X12 | 0.889 | 0.172 | −0.61 | 0.545 | (0.608, 1.299) |
| _cons | 2.944 | 1.573 | 2.02 | 0.043 | (1.033, 8.390) |
| Y | Odds Ratio | Std. Err. | z | p > |z| | (95% Conf. Interval) |
|---|---|---|---|---|---|
| X1 | 1.236 | 0.258 | 1.02 | 0.309 | (0.821, 1.860) |
| X2 | 1.713 | 0.377 | 2.47 | 0.013 | (1.119, 2.642) |
| X3 | 1.602 | 0.349 | 2.16 | 0.030 | (1.045, 2.456) |
| X4 | 0.725 | 0.156 | −1.49 | 0.136 | (0.475, 1.106) |
| X6 | 1.647 | 0.364 | 2.28 | 0.023 | (1.073, 2.546) |
| X7 | 0.514 | 0.178 | −1.91 | 0.056 | (0.265, 1.018) |
| X8 | 0.877 | 0.182 | −0.67 | 0.502 | (0.575, 1.310) |
| X9 | 1.057 | 0.282 | 0.21 | 0.836 | (0.627, 1.785) |
| X10 | 1.178 | 0.124 | 1.55 | 0.120 | (0.958, 1.448) |
| X11 | 1.221 | 0.272 | 0.88 | 0.378 | (0.786, 1.888) |
| X12 | 0.890 | 0.172 | −0.60 | 0.548 | (0.609, 1.301) |
| _cons | 2.791 | 0.146 | 1.97 | 0.049 | (1.004, 7.755) |
| Y | Odds Ratio | Std. Err. | z | p > |z| | (95% Conf. Interval) |
|---|---|---|---|---|---|
| X1 | 1.239 | 0.258 | 1.03 | 0.304 | (0.823, 1.863) |
| X2 | 1.699 | 0.366 | 2.46 | 0.014 | (1.114, 2.591) |
| X3 | 1.604 | 0.349 | 2.17 | 0.030 | (1.047, 2.458) |
| X4 | 0.725 | 0.156 | −1.49 | 0.136 | (0.475, 1.107) |
| X6 | 1.648 | 0.364 | 2.26 | 0.024 | (1.073, 2.538) |
| X7 | 0.512 | 0.175 | −1.95 | 0.051 | (0.261, 1.002) |
| X8 | 0.871 | 0.181 | −0.66 | 0.508 | (0.579, 1.309) |
| X10 | 1.179 | 0.124 | 1.57 | 0.117 | (0.959, 1.449) |
| X11 | 1.238 | 0.265 | 0.99 | 0.320 | (0.811, 1.884) |
| X12 | 0.890 | 0.172 | −0.60 | 0.548 | (0.609, 1.301) |
| _cons | 3.013 | 1.589 | 2.09 | 0.036 | (1.072, 8.472) |
| Y | Odds Ratio | Std. Err. | z | p > |z| | (95% Conf. Interval) |
|---|---|---|---|---|---|
| X1 | 1.239 | 0.258 | 1.03 | 0.304 | (0.823, 1.863) |
| X2 | 1.705 | 0.367 | 2.48 | 0.013 | (1.117, 2.601) |
| X3 | 1.604 | 0.349 | 2.17 | 0.030 | (1.047, 2.459) |
| X4 | 0.726 | 0.156 | −1.49 | 0.137 | (0.476, 1.107) |
| X6 | 1.653 | 0.364 | 2.28 | 0.023 | (1.073, 2.546) |
| X7 | 0.517 | 0.177 | −1.93 | 0.054 | (0.264, 1.011) |
| X8 | 0.862 | 0.178 | −0.71 | 0.475 | (0.579, 1.295) |
| X10 | 1.179 | 0.124 | 1.57 | 0.118 | (0.959, 1.449) |
| X11 | 1.234 | 0.265 | 0.98 | 0.326 | (0.811, 1.879) |
| _cons | 2.832 | 1.463 | 2.02 | 0.044 | (1.029, 7.796) |
| Y | Odds Ratio | Std. Err. | z | p > |z| | (95% Conf. Interval) |
|---|---|---|---|---|---|
| X1 | 1.232 | 0.256 | 1.00 | 0.316 | (0.819, 1.852) |
| X2 | 1.682 | 0.361 | 2.42 | 0.015 | (1.104, 2.561) |
| X3 | 1.601 | 0.349 | 2.16 | 0.031 | (1.045, 2.453) |
| X4 | 0.723 | 0.156 | −1.51 | 0.132 | (0.474, 1.103) |
| X6 | 1.652 | 0.364 | 2.28 | 0.023 | (1.073, 2.543) |
| X7 | 0.508 | 0.174 | −1.98 | 0.048 | (0.260, 0.993) |
| X10 | 1.173 | 0.123 | 1.52 | 0.127 | (0.955, 1.441) |
| X11 | 1.274 | 0.267 | 1.15 | 0.249 | (0.844, 1.922) |
| _cons | 2.646 | 1.340 | 1.92 | 0.055 | (0.980, 7.142) |
| Y | Odds Ratio | Std. Err. | z | p > |z| | (95% Conf. Interval) |
|---|---|---|---|---|---|
| X2 | 1.631 | 0.346 | 2.30 | 0.021 | (1.076, 2.473) |
| X3 | 1.556 | 0.335 | 2.05 | 0.040 | (1.020, 2.374) |
| X4 | 0.671 | 0.136 | −1.97 | 0.048 | (0.452, 0.997) |
| X6 | 1.643 | 0.362 | 2.26 | 0.024 | (1.068, 2.529) |
| X7 | 0.516 | 0.176 | −1.94 | 0.052 | (0.264, 1.007) |
| X10 | 1.168 | 0.122 | 1.49 | 0.136 | (0.952, 1.434) |
| X11 | 1.268 | 0.266 | 1.13 | 0.257 | (0.841, 1.914) |
| _cons | 3.203 | 1.501 | 2.47 | 0.013 | (1.273, 8.066) |
| Y | Odds Ratio | Std. Err. | z | p > |z| | (95% Conf. Interval) |
|---|---|---|---|---|---|
| X2 | 1.487 | 0.291 | 2.03 | 0.042 | (1.013, 2.182) |
| X3 | 1.543 | 0.333 | 2.01 | 0.044 | (1.011, 2.354) |
| X4 | 0.681 | 0.137 | −1.90 | 0.057 | (0.459, 1.011) |
| X6 | 1.657 | 0.364 | 2.30 | 0.021 | (1.078, 2.549) |
| X7 | 0.511 | 0.174 | −1.97 | 0.049 | (0.262, 0.998) |
| X10 | 1.176 | 0.122 | 1.56 | 0.120 | (0.959, 1.442) |
| _cons | 3.745 | 1.688 | 2.93 | 0.003 | (1.548, 9.059) |
| Y | Odds Ratio | Std. Err. | z | p > |z| | (95% Conf. Interval) |
|---|---|---|---|---|---|
| X2 | 1.554 | 0.300 | 2.28 | 0.023 | (1.064, 2.271) |
| X3 | 1.573 | 0.338 | 2.11 | 0.035 | (1.033, 2.397) |
| X4 | 0.663 | 0.133 | −2.05 | 0.040 | (0.448, 0.982) |
| X6 | 1.697 | 0.372 | 2.42 | 0.016 | (1.105, 2.607) |
| X7 | 0.498 | 0.169 | −2.05 | 0.040 | (0.255, 0.969) |
| _cons | 5.213 | 2.088 | 4.12 | 0.000 | (2.377, 11.432) |
| HA/Factors | Good Physical Health (Y1) | Good Ability of Daily Activities (Y2) | Good Psychological Well-Being (Y3) | Active Social Participation (Y4) |
|---|---|---|---|---|
| X1 | - | + | +, √ | + |
| X2 | + | +, √ | - | +, √ |
| X3 | +, √ | - | - | - |
| X4 | - | + | + | - |
| X5 | +, √ | - | +, √ | + |
| X6 | + | +, √ | + | + |
| X7 | - | -, √ | + | -, √ |
| X8 | + | + | - | - |
| X9 | +, √ | + | +, √ | - |
| X10 | + | + | + | + |
| X11 | - | + | - | - |
References
- Johnson, L.; Shapiro, M.; Mankoff, J. Removing the Mask of Average Treatment Effects in Chronic Lyme Disease Research Using Big Data and Subgroup Analysis. Healthcare 2018, 6, 124. [Google Scholar] [CrossRef] [PubMed] [Green Version]
- Nawaz, A.; Su, X.; Din, Q.M.U.; Khalid, M.I.; Bilal, M.; Shah, S.A.R. Identification of the H&S (Health and Safety Factors) Involved in Infrastructure Projects in Developing Countries—A Sequential Mixed Method Approach of OLMT-Project. Int. J. Environ. Res. Public Health 2020, 17, 635. [Google Scholar]
- Dong, Z.; Tang, C.; Wei, X. Does population ageing intensify income inequality? Evidence from China. J. Asia Pac. Econ. 2018, 23, 1–12. [Google Scholar] [CrossRef]
- Weir, P.L.; Meisner, B.A.; Baker, J. Health aging across the Years: Does One Model Fit Everyone? J. Health Psychol. 2010, 15, 680–687. [Google Scholar] [CrossRef] [PubMed]
- Baihui, L.; Zhiyong, Y. Population ageing Shock and Fiscal Sustainability in China: Mechanism Analysis and Effect Simulation. Singap. Econ. Rev. 2018, 1, 1–22. [Google Scholar] [CrossRef]
- Islam, M.S.; Hasan, M.M.; Wang, X.; Germack, H.D.; Noor-E-Alam, M. A Systematic Review on Healthcare Analytics: Application and Theoretical Perspective of Data Mining. Healthcare 2018, 6, 54. [Google Scholar] [CrossRef] [Green Version]
- Ryu, M.; Lee, S.; Kim, H.; Baek, W.-C.; Kimm, H. Effect of Aerobic Physical Activity on Health-Related Quality of Life in Middle Aged Women with Osteoarthritis: Korea National Health and Nutrition Examination Survey (2016–2017). Int. J. Environ. Res. Public Health 2020, 17, 527. [Google Scholar] [CrossRef] [Green Version]
- Kim, H.; Kim, S.; Yun, Y.-M.; Um, T.-H.; Chang, J.; Lee, K.S.; Chun, S.; Cho, K.-D.; Han, T.-H. Status of Quality Control for Laboratory Tests of Medical Institutions in Korea: Analysis of 10 Years of Data on External Quality Assessment Participation. Healthcare 2020, 8, 75. [Google Scholar] [CrossRef] [Green Version]
- Liu, B.; Guo, S.; Ding, B. Technical Blossom in Medical Care: The Influence of Big Data Platform on Medical Innovation. Int. J. Environ. Res. Public Health 2020, 17, 516. [Google Scholar] [CrossRef] [Green Version]
- Johnson, L.; Shapiro, M.; Stricker, R.B.; Vendrow, J.; Haddock, J.; Needell, D. Antibiotic Treatment Response in Chronic Lyme Disease: Why Do Some Patients Improve While Others Do Not? Healthcare 2020, 8, 383. [Google Scholar] [CrossRef]
- Jiang, Q.; Jesús, J.; Sánchez-Barricarte, J.J. The 4-2-1 family structure in China: A survival analysis based on life tables. Eur. J. Ageing 2011, 8, 119–127. [Google Scholar] [CrossRef] [PubMed] [Green Version]
- Liu, H.; Han, X.; Xiao, Q. Family Structure and Quality of Life of Elders in Rural China: The Role of the New Rural Social Pension. J. Ageing Soc. Policy 2015, 27, 123–138. [Google Scholar] [CrossRef] [PubMed] [Green Version]
- Fu, L.P.; Wang, Y.H.; He, L.P. Factors Associated with the Psychological Health of Caregiving Older Parents and Support from Their Grown Children: Results from the China Health and Retirement Longitudinal Study. Int. J. Environ. Res. Public Health 2020, 17, 556. [Google Scholar] [CrossRef] [PubMed] [Green Version]
- Martin, P.; Kelly, N.; Kahana, B. Defining health aging: A Tangible or Elusive Concept? Gerontologist 2015, 55, 14. [Google Scholar] [CrossRef]
- Cuesta-Briand, B.; Coleman, M.; Ledingham, R.; Moore, S.; Wright, H.; Oldham, D.; Playford, D. Understanding the Factors Influencing Junior Doctors’ Career Decision-Making to Address Rural Workforce Issues: Testing a Conceptual Framework. Int. J. Environ. Res. Public Health 2020, 17, 537. [Google Scholar] [CrossRef] [PubMed] [Green Version]
- Greenhalgh, S. Birth Control in China, 1949–2000: Population Policy and Demographic Development by Thomas Scharping. Am. J. Sociol. 2005, 34, 221. [Google Scholar]
- Zhang, J. The Evolution of China’s One-Child Policy and Its Effects on Family Outcomes. J. Econ. Perspect. 2017, 31, 141–160. [Google Scholar] [CrossRef] [Green Version]
- HAto, Y.; Zenou, Y. How urbanization affect employment and social interactions. Eur. Econ. Rev. 2015, 75, 131–155. [Google Scholar]
- Wang, X.; Wan, G. China’s Urban Employment and Urbanization Rate: A Re-estimation. China World Econ. 2014, 22, 30–44. [Google Scholar] [CrossRef]
- Liang, W.; Lu, M. Growth Led by Human Capital in Big Cities: Exploring Complementarities and Spatial Agglomeration of the Workforce with Various Skills. China Econ. Rev. 2019, 57, 101113. [Google Scholar] [CrossRef]
- Feng, Q.; Son, J.; Zeng, Y. Prevalence and correlates of health aging: A comparative study between China and South Korea. Eur. J. Ageing 2015, 12, 83–94. [Google Scholar] [CrossRef] [PubMed] [Green Version]
- Mortimer, M.C.; Ward, L.; Winefield, H. Health aging by whose definition? Views of older, spiritually affiliated women. Australas. J. Ageing 2008, 27, 200–204. [Google Scholar] [CrossRef] [PubMed]
- Ansell, C.; Gash, A. Collaborative Governance in Theory and Practice. J. Public Adm. Res. Theory 2007, 18, 543–571. [Google Scholar] [CrossRef] [Green Version]
- Bryson, J.M.; Crosby, B.C.; Stone, M.M. Designing and Implementing Cross-Sector Collaborations: Needed and Challenging. Public Adm. Rev. 2015, 75, 647–663. [Google Scholar] [CrossRef]
- Vigoda, E. From Responsiveness to Collaboration: Governance, Citizens, and the Next Generation of Public Administration. Public Adm. Rev. 2003, 62, 527–540. [Google Scholar] [CrossRef]
- Ulibarri, N.; Scott, T.A. Linking Network Structure to Collaborative Governance. J. Public Adm. Res. Theory 2016, 27, 163–181. [Google Scholar] [CrossRef]
- Cheung, C.K.J.; Kwan, Y.H.A. The utility of enhancing filial piety for elder care in China. Ageing China 2012, 2, 127–145. [Google Scholar]
- Fu, L.P.; Wang, Y.H.; He, L.P. Factors Associated with Healthy Ageing, Healthy Status and Community Nursing Needs among the Rural Elderly in an Empty Nest Family: Results from the China Health and Retirement Longitudinal Study. Healthcare 2020, 8, 317. [Google Scholar] [CrossRef]
- Leung, J.T.Y.; Shek, D.T.L. Parental Sacrifice, Filial Piety and Adolescent Life Satisfaction in Chinese Families Experiencing Economic Disadvantage. Appl. Res. Qual. Life 2020, 15, 259–272. [Google Scholar] [CrossRef]
- Scott, C. A case study in collaborative governance: Health care law reform in Georgia. Confl. Resolut. Q. 2011, 28, 441–463. [Google Scholar] [CrossRef]
- Korfmacher, K.S.; Koontz, T.M. Collaboration, Information, and Preservation: The Role of Expertise in Farmland Preservation Task Forces. Policy Sci. 2003, 36, 213–236. [Google Scholar] [CrossRef]
- Fu, L.P.; Sun, Z.H.; He, L.P.; Liu, F.; Jing, X.L. Global long-term care research: A scientometric review. Int. J. Environ. Res. Public Health 2019, 16, 2077. [Google Scholar] [CrossRef] [PubMed] [Green Version]
- Foster, L.; Walker, A. Active and health aging: A European Policy Perspective. Gerontologist 2015, 55, 83–90. [Google Scholar] [CrossRef] [PubMed]
- Phelan, E.A.; Anderson, L.A.; Lacroix, A.Z. Older Adults’ Views of “health aging”—How Do They Compare with Researchers’ Definitions? J. Am. Geriatr. Soc. 2004, 2, 211–216. [Google Scholar] [CrossRef] [PubMed]
- Jopp, D.S.; Wozniak, D.; Damarin, A.K. How Could Lay Perspectives on health aging Complement Scientific Theory? Findings from a U.S. and a German Life-Span sample. Gerontologist 2015, 55, 91–106. [Google Scholar] [CrossRef] [PubMed] [Green Version]
- Stowe, J.D.; Cooney, T.M. Examining Rowe and Kahn’s Concept of health aging: Importance of Taking a Life Course Perspective. Gerontologist 2014, 55, 43–50. [Google Scholar] [CrossRef]
- Jeste, D.V.; HAvla, G.N.; Thompson, W.K. Association between older age and more health aging: Critical role of resilience and depression. Am. J. Psychiatry 2013, 170, 188–196. [Google Scholar] [CrossRef] [Green Version]
- Fredriksen-Goldsen, K.I.; Kim, H.J.; Shiu, C. Health aging Among LGBT Older Adults: Physical and Mental Health-Related Quality of Life by Age Group. Gerontologist 2015, 55, 154–168. [Google Scholar] [CrossRef] [Green Version]
- Wu, M.L.; Yang, Y.; Zhang, D.; Sun, Y.Y.; Xie, H.; Zhang, J.; Jia, J.H.; Su, Y.G. Prevalence and related factors of successful aging among Chinese rural elders living in nursing homes. Eur. J. Ageing 2017, 14, 419–428. [Google Scholar] [CrossRef]
- Britton, A.; Shipley, M.; Singhmanoux, A. Health aging: The contribution of early-life and midlife risk factors. J. Am. Geriatr. Soc. 2010, 56, 1098–1105. [Google Scholar] [CrossRef] [Green Version]
- Andrews, G.; Clark, M.; Luszcz, M. Health aging in the Australian Longitudinal Study of ageing: Applying the MacArthur Model Cross–Nationally. J. Soc. Issues 2002, 58, 749–765. [Google Scholar] [CrossRef]
- Jorm, A.F.; Christensen, H.; Henderson, A.S. Factors Associated with health aging. Australas. J. Ageing 1998, 17, 33–37. [Google Scholar] [CrossRef]
- Han, X.; Li, J.; Wang, N. Spatiotemporal evolution of Chinese ageing from 1992 to 2015 based on an improved Bayesian space-time model. J. BMC Public Health 2018, 18, 502–513. [Google Scholar] [CrossRef] [PubMed] [Green Version]
- Lotvonen, S.; Kyngäs, H.; Koistinen, P. Mental Well-Being of elderly people in Finland during the First Year in Senior Housing and Its Association with Physical Performance. Int. J. Environ. Res. Public Health 2018, 15, 1331. [Google Scholar] [CrossRef] [PubMed] [Green Version]
- MuHAlek, C.; Kirchengast, S. Grip Strength as an Indicator of Health-Related Quality of Life in Old Age—A Pilot Study. Int. J. Environ. Res. Public Health 2017, 14, 1447. [Google Scholar]
- Li, Q.; Wang, Y.; Zhao, Y. The Impact of China’s New Rural Pension Program on Elderly Labor, Grandchild Care, and Old-Age Support. Fem. Econ. 2018, 24, 1–23. [Google Scholar] [CrossRef]
- Smith, J.P.; Strauss, J.; Zhao, Y. Healthy aging in China. J. Econ. Ageing 2014, 4, 37–43. [Google Scholar] [CrossRef] [Green Version]
- Ebenstein, A.; Zhao, Y. Tracking rural-to-urban migration in China: Lessons from the 2005 inter-census population survey. Popul. Stud. 2015, 69, 337–353. [Google Scholar] [CrossRef]
- Han, L.; Li, T.; Zhao, Y. How Status Inheritance Rules Affect Marital Sorting: Theory and Evidence from Urban China. Econ. J. 2015, 125, 1850–1887. [Google Scholar] [CrossRef]

| Characteristics | Specific Indicators | N | % |
|---|---|---|---|
| Good physical health(Y1) | No disability and fewer chronic diseases | 545 | 68.6% |
| Good ability of daily activities (Y2) | Grade 1 or 2 for each activity | 313 | 39.4% |
| Good mental health (Y3) | score of less than or equal to 20 | 673 | 84.7% |
| Good social participation (Y4) | the number of activities attended is no less than two in the last month | 488 | 61.4% |
| Healthy aging (Y) | met the four standards of Y1–Y4 | 137 | 17.2% |
| Variables | Specific Indicators | N | N (%) | N (%) | χ2 | p |
|---|---|---|---|---|---|---|
| Non-HA | HA | |||||
| Gender (X1) | Male | 348 | 282 (42.8%) | 66 (48.1%) | 1.30 | 0.25 |
| Female | 447 | 376 (57.2%) | 71 (51.8%) | |||
| Age (X2) | younger(50–60) | 307 | 239 (36.3%) | 68 (49.6%) | 8.47 | 0.004 |
| older(60–90) | 488 | 419 (63.7%) | 69 (50.4%) | |||
| Residence (X3) | Urban | 177 | 134 (20.3%) | 43 (31.3%) | 7.95 | 0.005 |
| Village | 618 | 524 (79.7%) | 94 (68.7%) | |||
| Educational status (X4) | Literate | 397 | 296 (45%) | 83 (60.6%) | 11.06 | 0.001 |
| Illiterate | 417 | 362 (55%) | 54 (39.4%) | |||
| Marital status (X5) | Married | 602 | 492 (74.7%) | 110 (80.2%) | 1.87 | 0.17 |
| Unmarried | 193 | 166 (25.3%) | 27 (19.7%) | |||
| Expectation of Long-term Care in the future from grown children (X6) | Yes | 528 | 424 (64.4%) | 104 (75.9%) | 6.69 | 0.01 |
| No | 267 | 234 (35.6%) | 33 (24.1%) | |||
| Educational status of grown children (X7) | Literate | 617 | 535 (81.3%) | 126 (91.9%) | 9.200 | 0.002 |
| Illiterate | 134 | 123 (18.6%) | 11 (8%) | |||
| Living place of grown children (X8) | with parents | 312 | 261 (39.6%) | 51 (37.2%) | 0.28 | 0.59 |
| Not with parents | 443 | 367 (60.4%) | 86 (62.8%) | |||
| Marital status of grown children (X9) | Married | 624 | 516 (78.4%) | 108 (78.8%) | 0.01 | 0.91 |
| Unmarried | 171 | 142 (21.6%) | 29 (21.2%) | |||
| Physical condition of grown children (X10) | Good | 467 | 379 (57.5%) | 88 (64.2%) | 10.68 | 0.03 |
| Fair | 328 | 279 (42.5%) | 49 (35.8%) | |||
| Housing Property status of grown children (X11) | Own at least a house | 409 | 338 (51.3%) | 71 (51.8%) | 0.009 | 0.92 |
| No house | 386 | 320 (48.7%) | 66 (48.2%) | |||
| Elderly parents provide Inter-generational care for grown children’s babies (X12) | Yes | 400 | 334 (50.8%) | 66 (48.1%) | 0.30 | 0.58 |
| No or not yet | 395 | 324 (49.2%) | 71 (51.8%) |
| Variables of the First Family | β | OR | 95% CI | Variables of the Second Family | β | OR | 95%CI |
|---|---|---|---|---|---|---|---|
| Gender (ref. female) | 0.16 | 1.17 | (0.78, 1.77) | Educational status of grown children (ref. illiterate) | 0.91 ** | 2.48 ** | (1.29, 4.76) |
| male | literate | ||||||
| Age (ref. 60–90) | 0.49 * | 1.64 * | (1.10, 2.45) | Living place of grown children (ref. not at home) | −0.09 | 0.91 | (0.61, 1.36) |
| 40–60 | live with respondents | ||||||
| Residence (ref. village) | 0.51 * | 1.66 * | (1.08, 2.55) | Marital status of grown children (ref. unmarried) | −0.05 | 0.95 | (0.58, 1.56) |
| urban | married | ||||||
| Educational status (ref. illiterate) | 0.43 * | 1.54 * | (1.02, 2.34) | Physical condition of grown children (ref. not good) | 0.24 * | 1.27 * | (1.05, 1.55) |
| literate | good | ||||||
| Marital status (ref. unmarried) | 0.05 | 1.05 | (0.64, 1.74) | Housing status of grown children (ref. do not) | 0.02 | 1.02 | (0.68, 1.54) |
| married | Own a house | ||||||
| Expectations of long-term health care from grown children (ref. no) | 0.53 * | 1.70 * | (1.11, 2.62) | Elderly parents provide inter-generational care for grown children’s babies (ref. no) | −0.14 | 0.87 | (0.60, 1.27) |
| yes | yes |
| Y(OR/Std. Err.) | First Step | Second Step | Third Step | Forth Step | Fifth Step | Sixth Step | Seventh Step | Last Step |
|---|---|---|---|---|---|---|---|---|
| X1 | 1.228 | 1.236 | 1.239 | 1.239 | 1.232 | |||
| (0.260) | (0.258) | (0.258) | (0.258) | (0.256) | ||||
| X2 | 1.697 * | 1.713 * | 1.699 * | 1.705 * | 1.682 * | 1.631 * | 1.487 * | 1.554 * |
| (0.383) | (0.377) | (0.366) | (0.367) | (0.361) | (0.346) | (0.91) | (0.300) | |
| X3 | 1.606 * | 1.602 * | 1.604 * | 1.604 * | 1.601 * | 1.556 * | 1.543 * | 1.573 * |
| (0.351) | (0.349) | (0.349) | (0.349) | (0.349) | (0.335) | (2.01) | (0.338) | |
| X4 | 0.727 | 0.725 | 0.725 | 0.726 | 0.723 | 0.671 * | 0.681 | 0.663 * |
| (1.158) | (0.156) | (0.156) | (0.156) | (0.156) | (0.136) | (−1.90) | (0.133) | |
| X5 | 1.046 | |||||||
| (0.273) | ||||||||
| X6 | 1.649 * | 1.647 * | 1.648 * | 1.653 * | 1.652 * | 1.643 * | 1.657 * | 1.697 * |
| (0.364) | (0.364) | (0.364) | (0.364) | (0.364) | (0.362) | (2.30) | (0.372) | |
| X7 | 0.515 | 0.514 | 0.512 | 0.517 | 0.508 * | 0.516 | 0.511 * | 0.497 * |
| (0.177) | (0.178) | (0.175) | (0.177) | (0.174) | (0.176) | (0.174) | (2.088) | |
| X8 | 0.879 | 0.877 | 0.871 | 0.862 | ||||
| (0.185) | (0.182) | (0.171) | (0.178) | |||||
| X9 | 1.058 | 1.057 | ||||||
| (0.282) | (0.282) | |||||||
| X10 | 1.177 | 1.178 | 1.179 | 1.179 | 1.173 | 1.168 | 1.176 | |
| (0.124) | (0.124) | (0.124) | (0.124) | (0.123) | (0.122) | (0.122) | ||
| X11 | 1.226 | 1.221 | 1.238 | 1.234 | 1.274 | 1.268 | ||
| (0.275) | (0.272) | (0.265) | (0.256) | (0.267) | (0.266) | |||
| X12 | 0.889 | 0.890 | 0.890 | |||||
| (0.172) | (0.172) | (0.172) | ||||||
| _cons | 2.769 | 2.791 | 3.013 | 2.832 | 2.646 | 3.203 | 3.745 | 5.21 |
| (0.145) | (0.146) | (1.589) | (1.463) | (1.340) | (1.501) | (1.688) | (0.000) |
| Variables | No Disability and Fewer Chronic Diseases | Good Social Participation | Good Ability of Daily Activities | Good Mental Health |
|---|---|---|---|---|
| Age (X2) | 1.33 | 1.24 | 2.13 ** | 0.78 |
| Residence (X3) | 0.86 | 1.56 * | 1.48 | 1.26 |
| Educational status (X4) | 0.99 | 0.99 | 0.63 * | 0.56 *** |
| Expectations of long-term health care from grown children (X6) | 0.93 | 1.20 | 0.99 | 2.40 *** |
| Educational status of grown children (X7) | 1.06 | 0.73 | 0.57 * | 0.85 |
| Physical health of grown children (X10) | 1.21 * | 1.01 | 0.99 | 1.31 *** |
| Criteria/Indicators | CHARLS Data from Academic Civil National Investigation (Factors from Micro-Perspective) | Weighs (β) | Regional Data from National Statistical Database (Factors from Macro-Perspective) | Weighs (w) |
|---|---|---|---|---|
| Criterion I | Age (X2) | 0.44 (β2) | Regional aging level (F1) | 0.44 (w1) |
| Criterion II | Residence (X3) | 0.45 (β3) | Regional urbanization level (F3) | 0.45 (w2) |
| Criterion III | Educational status (X4, X7) | 0.41 (β4), 0.69 (β7) | Regional educational level (F2) | 0.41 × 1/3 + 0.69 × 2/3 (w3) |
| Criterion IV | Expectation for the long-term health care (X6) | 0.53 (β6) | Regional level of family care (F4) | 0.53 (w4) |
| Four Types of Region | Corresponding Provinces in China |
|---|---|
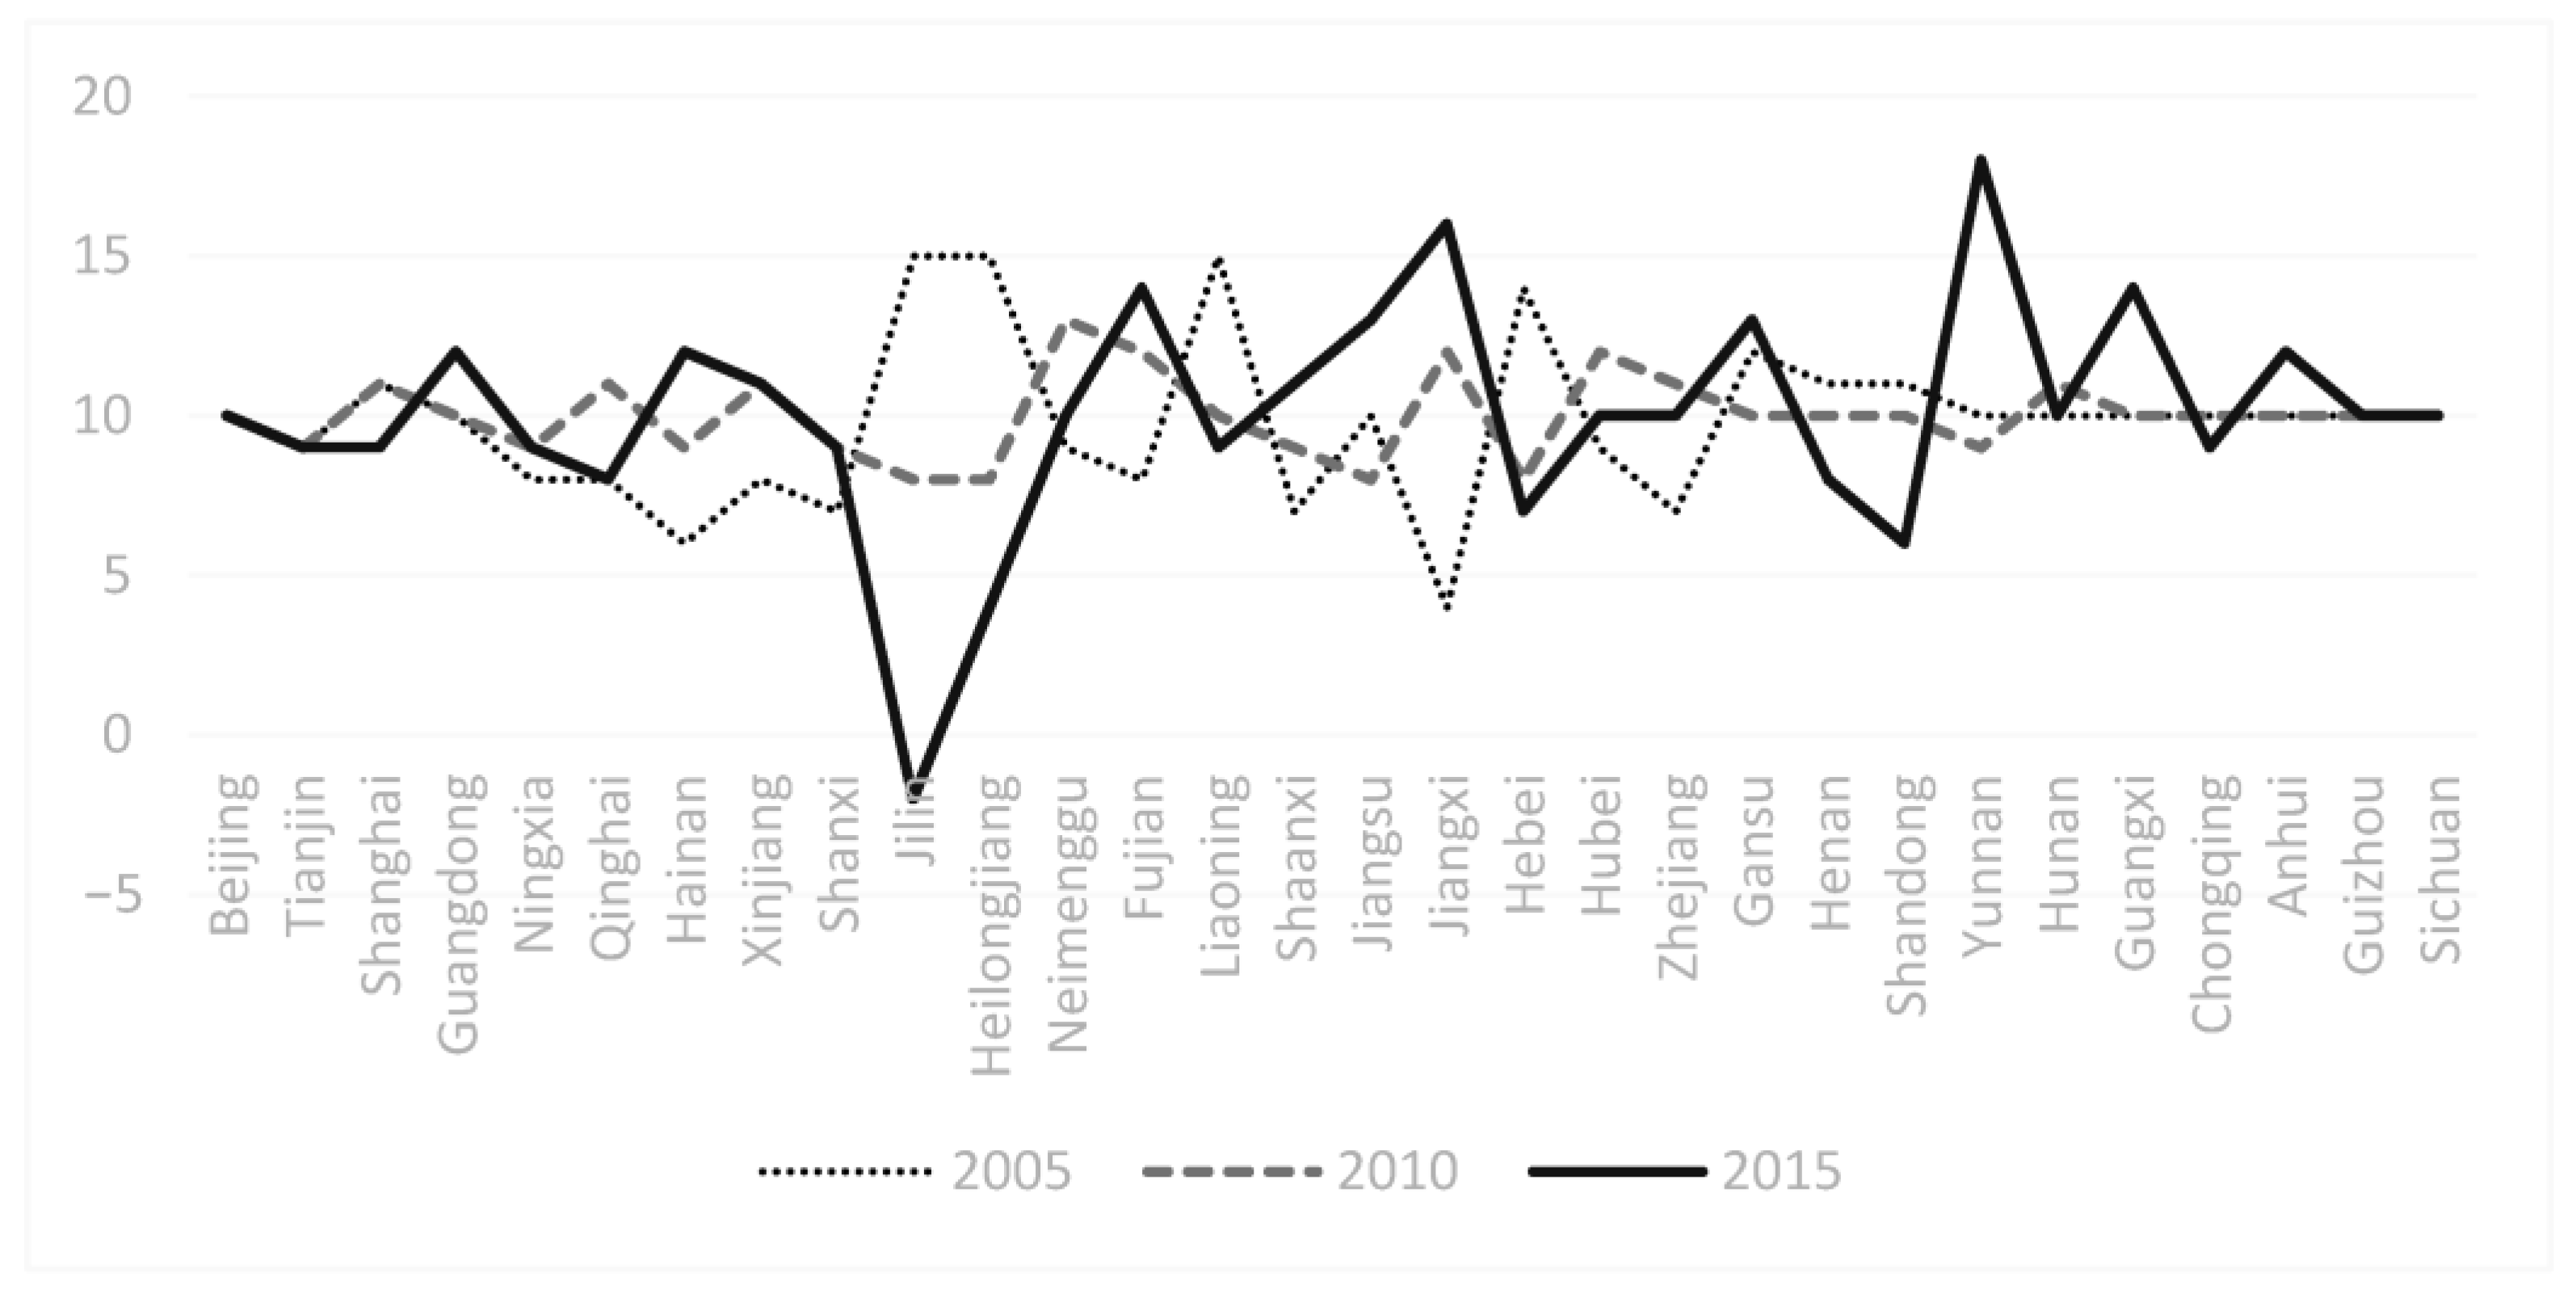
| Region 1: HA score goes up first from 2005 to 2010 and then down from 2010 to 2015 | Beijing, Heilongjiang, Shaanx and Zhejiang province |
| region 2: HA score has been falling from 2005 to 2015 | Tianjin, Shanghai, Qinghai, Jilin, Inner Mongolia, Liaoning, Hebei and Shandong province |
| region 3: HA score goes down first from 2005 to 2010 and then up from 2010 to 2015 | Guangdong, Ningxia, Hainan, Xinjiang, Shanxi, Hubei, Gansu, Henan, Yunnan, Guangxi, Chongqing and Guizhou province |
| region 4: HA score keeps going up from 2005 to 2010 | Hunan, Fujian, Jiangsu, Jiangxi, Anhui and Sichuan province |
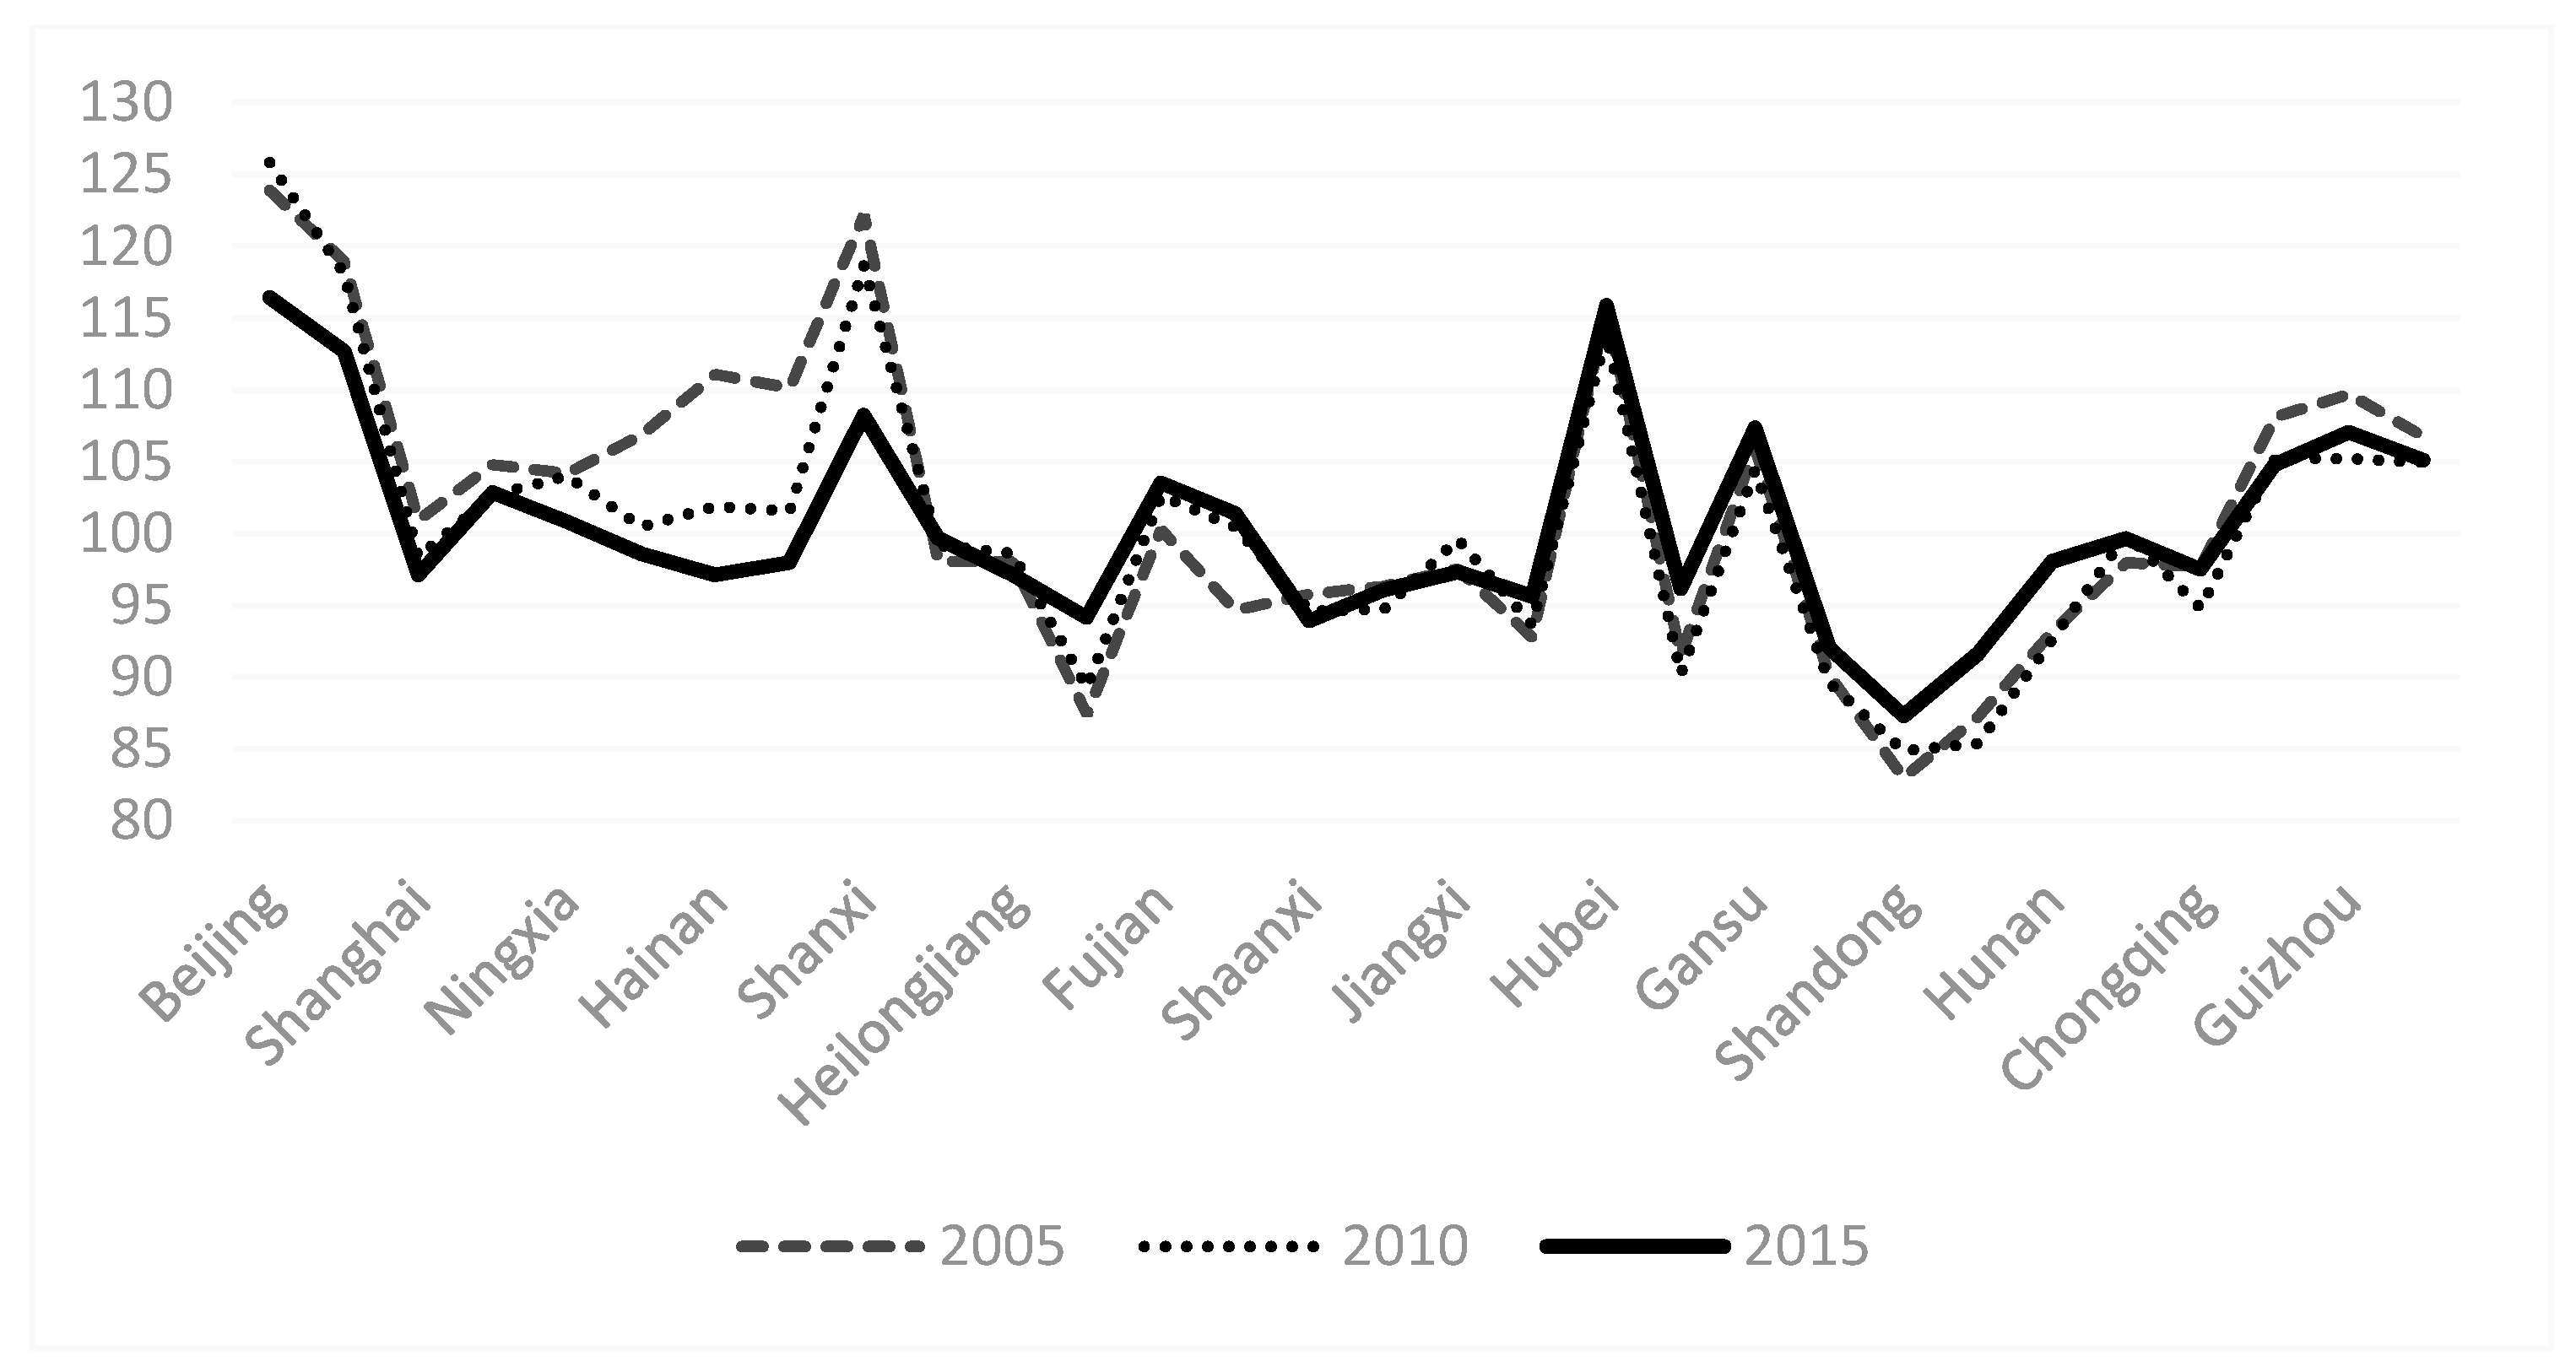
| Eight Economic Zones of China | HA Index in 2005 | HA Index in 2010 | HA Index in 2015 | Average HA Index from 2005–2015 |
|---|---|---|---|---|
| Beijing-Tianjin-Hebei | 114.60 | 114.11 | 108.75 | 112.49 |
| Five North China Provinces Including Beijing, Tianjin and Hebei | 110.56 | 109.80 | 105.99 | 108.79 |
| Three Northeast Provinces | 109.37 | 101.33 | 97.90 | 102.87 |
| Yangtze River Delta Region | 106.10 | 105.51 | 101.70 | 104.43 |
| East China Coastal Area | 94.54 | 96.77 | 98.25 | 96.52 |
| Central Plains Region | 95.56 | 96.01 | 96.33 | 95.97 |
| Pearl River Delta Region | 104.36 | 102.86 | 106.45 | 104.56 |
| Southwest China | 88.39 | 88.13 | 92.27 | 89.60 |
| Five Northwest Provinces | 104.06 | 102.05 | 102.83 | 102.98 |
Publisher’s Note: MDPI stays neutral with regard to jurisdictional claims in published maps and institutional affiliations. |
© 2020 by the authors. Licensee MDPI, Basel, Switzerland. This article is an open access article distributed under the terms and conditions of the Creative Commons Attribution (CC BY) license (http://creativecommons.org/licenses/by/4.0/).
Share and Cite
Fu, L.; Teng, T.; Wang, Y.; He, L. Data Analysis Model Design of Health Service Monitoring System for China’s Elderly Population: The Proposal of the F-W Model Based on the Collaborative Governance Theory of Healthy Aging. Healthcare 2021, 9, 9. https://doi.org/10.3390/healthcare9010009
Fu L, Teng T, Wang Y, He L. Data Analysis Model Design of Health Service Monitoring System for China’s Elderly Population: The Proposal of the F-W Model Based on the Collaborative Governance Theory of Healthy Aging. Healthcare. 2021; 9(1):9. https://doi.org/10.3390/healthcare9010009
Chicago/Turabian StyleFu, Liping, Tao Teng, Yuhui Wang, and Lanping He. 2021. "Data Analysis Model Design of Health Service Monitoring System for China’s Elderly Population: The Proposal of the F-W Model Based on the Collaborative Governance Theory of Healthy Aging" Healthcare 9, no. 1: 9. https://doi.org/10.3390/healthcare9010009