Can Simple Tests Prior to Endoscopy Predict the OLGA Stage of Gastritis?

 , ,
, ,
Abstract
1. Introduction
2. Methods and Materials
2.1. Sedation
2.2. Monitoring
2.3. Endoscopy Procedure
2.4. Sample Size Calculation:
2.5. Data Collection
- NRS;
- NRS end points (0–10);
- Frequency of administration of the test;
- Time period to be rated;
- Type of pain intensity rated by the participant (average, least, worst and current);
- Pain location in another part of the body.
2.6. Statistical Methods
3. Results
4. Discussion
5. Conclusions
Author Contributions
Funding
Conflicts of Interest
References
- Parsonnet, J.; Vandersteen, D.; Goates, J.; Sibley, R.K.; Pritikin, J.; Chang, Y. Helicobacter pylori infection in intestinal-and diffuse-type gastric adenocarcinomas. J. Natl. Cancer Inst. 1991, 83, 640–643. [Google Scholar] [CrossRef] [PubMed]
- Rugge, M.; Fassan, M.; Pizzi, M.; Zorzetto, V.; Maddalo, G.; Realdon, S.; De Bernard, M.; Betterle, C.; Cappellesso, R.; Pennelli, G.; et al. Autoimmune gastritis: Histology phenotype and OLGA staging. Aliment. Pharmacol. Ther. 2012, 35, 1460–1466. [Google Scholar] [CrossRef] [PubMed]
- Marcos-Pinto, R.; Carneiro, F.; Dinis-Ribeiro, M.; Wen, X.; Lopes, C.; Figueiredo, C.; Machado, J.C.; Ferreira, R.M.; Reis, C.A.; Ferreira, J.; et al. First-degree relatives of patients with early-onset gastric carcinoma show even at young ages a high prevalence of advanced OLGA/OLGIM stages and dysplasia. Aliment. Pharmacol. Ther. 2012, 35, 1451–1459. [Google Scholar] [CrossRef] [PubMed]
- Rugge, M.; Correa, P.; Di Mario, F.; El-Omar, E.; Fiocca, R.; Geboes, K.; Genta, R.M.; Graham, D.Y.; Hattori, T.; Malfertheiner, P.; et al. OLGA staging for gastritis: A tutorial. Dig. Liver Dis. 2008, 40, 650–658. [Google Scholar] [CrossRef] [PubMed]
- Dirican, A.; Kucukzeybek, B.B.; Alacacioglu, A.; Kucukzeybek, Y.; Erten, C.; Varol, U.; Somali, I.; Demir, L.; Bayoglu, I.V.; Yildiz, Y.; et al. Do the derived neutrophil to lymphocyte ratio and the neutrophil to lymphocyte ratio predict prognosis in breast cancer? Int. J. Clin. Oncol. 2015, 20, 70–81. [Google Scholar] [CrossRef]
- Chen, J.; Chen, M.-H.; Li, S.; Guo, Y.L.; Zhu, C.G.; Xu, R.X.; Zhang, Y.; Sun, J.; Qing, P.; Liu, G.; et al. Usefulness of the neutrophil-to-lymphocyte ratio in predicting the severity of coronary artery disease: A Gensini score assessment. J. Atheroscler. Thromb. 2014, 21, 25940. [Google Scholar] [CrossRef]
- Afsar, B. The relationship between neutrophil lymphocyte ratio with urinary protein albumin excretion in newly diagnosed patients with type 2 diabetes. Am. J. Med. 2014, 347, 217–220. [Google Scholar] [CrossRef]
- Bekdas, M.; Goksugur, S.B.; Sarac, E.G.; Erkocoglu, M.; Demircioglu, F. Neutrophil/lymphocyte and C-reactive protein/mean platelet volume ratios in differentiating between viral and bacterial pneumonias and diagnosing early complications in children. Saudi Med. J. 2014, 35, 442–447. [Google Scholar]
- Cassaro, M.; Rugge, M.; Gutierrez, O.; Leandro, G.; Graham, D.Y.; Genta, R.M. Topographic patterns of intestinal metaplasia and gastric cancer. Am. J. Gastroenterol. 2000, 95, 1431–1438. [Google Scholar] [CrossRef]
- Correa, P. Human gastric carcinogenesis: A multistep and multifactorial process—First American Cancer Society award lecture on cancer epidemiology and prevention. Cancer Res. 1992, 52, 6735–6740. [Google Scholar]
- Pinho-Ribeiro, F.A.; Verri, W.A., Jr.; Chiu, I.M. Nociceptor sensory neuron–immune interactions in pain and inflammation. Trends Immunol. 2017, 38, 5–19. [Google Scholar] [CrossRef] [PubMed]
- Bentley, F. Observations on visceral pain:(1) Visceral tenderness. Ann. Surg. 1948, 128, 881. [Google Scholar] [CrossRef] [PubMed]
- Gerbershagen, H.J.; Rothaug, J.; Kalkman, C.; Meissner, W. Determination of moderate-to-severe postoperative pain on the numeric rating scale: A cut-off point analysis applying four different methods. Br. J. Anaesth. 2011, 107, 619–626. [Google Scholar] [CrossRef] [PubMed]
- Rugge, M.; Meggio, A.; Pennelli, G.; Piscioli, F.; Giacomelli, L.; De Pretis, G.; Graham, D.Y. Gastritis staging in clinical practice: The OLGA staging system. Gut 2007, 56, 631–636. [Google Scholar] [CrossRef]
- Rugge, M.; Kim, J.G.; Mahachai, V.; Miehlke, S.; Pennelli, G.; Russo, V.M.; Perng, C.L.; Chang, F.Y.; Tandon, R.K.; Singal, D.K.; et al. OLGA gastritis staging in young adults and country-specific gastric cancer risk. Int. J. Surg. Pathol. 2008, 16, 150–154. [Google Scholar] [CrossRef] [PubMed]
- Rugge, M.; de Boni, M.; Pennelli, G.; de Bona, M.; Giacomelli, L.; Fassan, M.; Basso, D.; Plebani, M.; Graham, D.Y. Gastritis OLGA-staging and gastric cancer risk: A twelve-year clinico-pathological follow-up study. Aliment. Pharmacol. Ther. 2010, 31, 1104–1111. [Google Scholar] [CrossRef]
- Posul, E.; Yilmaz, B.; Aktas, G.; Kurt, M. Does neutrophil-to-lymphocyte ratio predict active ulcerative colitis? Wien Klin. Wochenschr. 2015, 127, 262–265. [Google Scholar] [CrossRef]
- Lee, S.K.; Lee, S.C.; Park, J.W.; Kim, S.-J. The utility of the preoperative neutrophil-to-lymphocyte ratio in predicting severe cholecystitis: A retrospective cohort study. BMC Surg. 2014, 14, 100. [Google Scholar] [CrossRef]
- Li, M.X.; Liu, X.M.; Zhang, X.F.; Zhang, J.F.; Wang, W.L.; Zhu, Y.; Dong, J.; Cheng, J.W.; Liu, Z.W.; Ma, L.; et al. Prognostic role of neutrophil-to-lymphocyte ratio in colorectal cancer: A systematic review and meta-analysis. Int. J. Cancer 2014, 134, 2403–2413. [Google Scholar] [CrossRef]
- Galizia, G.; Lieto, E.; Zamboli, A.; De Vita, F.; Castellano, P.; Romano, C.; Auricchio, A.; Cardella, F.; De Stefano, L.; Orditura, M. Neutrophil to lymphocyte ratio is a strong predictor of tumor recurrence in early colon cancers: A propensity score-matched analysis. Surgery 2015, 158, 112–120. [Google Scholar] [CrossRef]
- Forget, P.; Khalifa, C.; Defour, J.-P.; Latinne, D.; Van Pel, M.-C.; De Kock, M. What is the normal value of the neutrophil-to-lymphocyte ratio? BMC Res. Notes 2017, 10, 12. [Google Scholar] [CrossRef] [PubMed]
- Guarner, J.; Mohar, A.; Parsonnet, J.; Halperin, D. The association of Helicobacter pylori with gastric cancer and preneoplastic gastric lesions in Chiapas, Mexico. Cancer 1993, 71, 297–301. [Google Scholar] [CrossRef]
- Bellolio, E.; Riquelme, I.; Riffo-Campos, A.L.; Rueda, C.; Ferreccio, C.; Villaseca, M.; Brebi, P.; Muñoz, S.; Araya, J.C. Assessment of gastritis and gastric cancer risk in the Chilean population using the OLGA system. Pathol. Oncol. Res. 2019, 25, 1135–1142. [Google Scholar] [CrossRef] [PubMed]
- Reifen, R.; Rasooly, I.; Drumm, B.; Murphy, K.; Sherman, P. Helicobacter pylori infection in children. Dig. Dis. Sci. 1994, 39, 1488–1492. [Google Scholar] [CrossRef] [PubMed]
- Fiedorek, S.C.; Casteel, H.B.; Pumphrey, C.L.; Evans, D.J., Jr.; Evans, D.G.; Klein, P.D.; Graham, D.Y. The role of Helicobacter pylori in recurrent, functional abdominal pain in children. Am. J. Gastroenterol. 1992, 87, 347–349. [Google Scholar] [PubMed]
- Kaplan, M.; Ates, I.; Yuksel, M.; Arikan, M.F.; Aydog, G.; Turhan, N.; Gökbulut, V.; Kayacetin, E. The role of the PLR-NLR combination in the prediction of the presence of Helicobacter pylori and its associated complications. Saudi J. Gastroenterol. 2018, 24, 294–300. [Google Scholar] [CrossRef]
- Harewood, G.; Ryan, H.; Murray, F.; Patchett, S. Potential impact of enhanced practice efficiency on endoscopy waiting times. Ir. Med. J. 2009, 178, 187–192. [Google Scholar] [CrossRef]


| A Score | C Score | OLGA Stage | Intestinal Metaplasia | Inflammation | Activity | ||
|---|---|---|---|---|---|---|---|
| NRS | R | 0.377 * | 0.396 * | 0.469 * | 0.223 * | 0.072 | 0.080 |
| p | <0.001 | <0.001 | <0.001 | 0.005 | 0.374 | 0.320 | |
| A Score | C Score | OLGA Stage | Intestinal Metaplasia | Inflammation | Activity | ||
|---|---|---|---|---|---|---|---|
| NLR | R | 0.106 | 0.258 * | 0.208 * | 0.080 | 0.118 | 0.096 |
| p | 0.191 | 0.001 | 0.009 | 0.325 | 0.145 | 0.234 | |
| HP | Total | p Values | |||
|---|---|---|---|---|---|
| − | + | ||||
| NLR | Normal (≤3.5) | 72 | 62 | 134 | 0.354 |
| 53.7% | 46.3% | 100% | |||
| High (>3.5) | 9 | 12 | 21 | ||
| 42.9% | 57.1% | 100% | |||
| NRS | Normal (<4) | 21 | 27 | 48 | 0.156 |
| 43.8% | 56.2% | 100% | |||
| High (≥4) | 60 | 47 | 107 | ||
| 56.1% | 43.9% | 100% | |||
| NRS and NLR | Negative | 76 | 65 | 141 | 0.194 |
| 53.9% | 46.1% | 100% | |||
| Positive | 5 | 9 | 14 | ||
| 35.7% | 64.3% | 100% | |||
| Total | 81 | 74 | 155 | ||
| 52.3% | 47.7% | 100% | |||
| NLR and NRS | N | Mean ± SD | Median (min–max) | p Values | |
|---|---|---|---|---|---|
| A score | − | 141 | 1.43 ± 0.55 | 1 (0–3) | 0.131 |
| + | 14 | 1.64 ± 0.49 | 2 (1–2) | ||
| C score | − | 141 | 1.07 ± 0.48 | 1 (0–3) | 0.001 * |
| + | 14 | 1.5 ± 0.51 | 1.5 (1–2) | ||
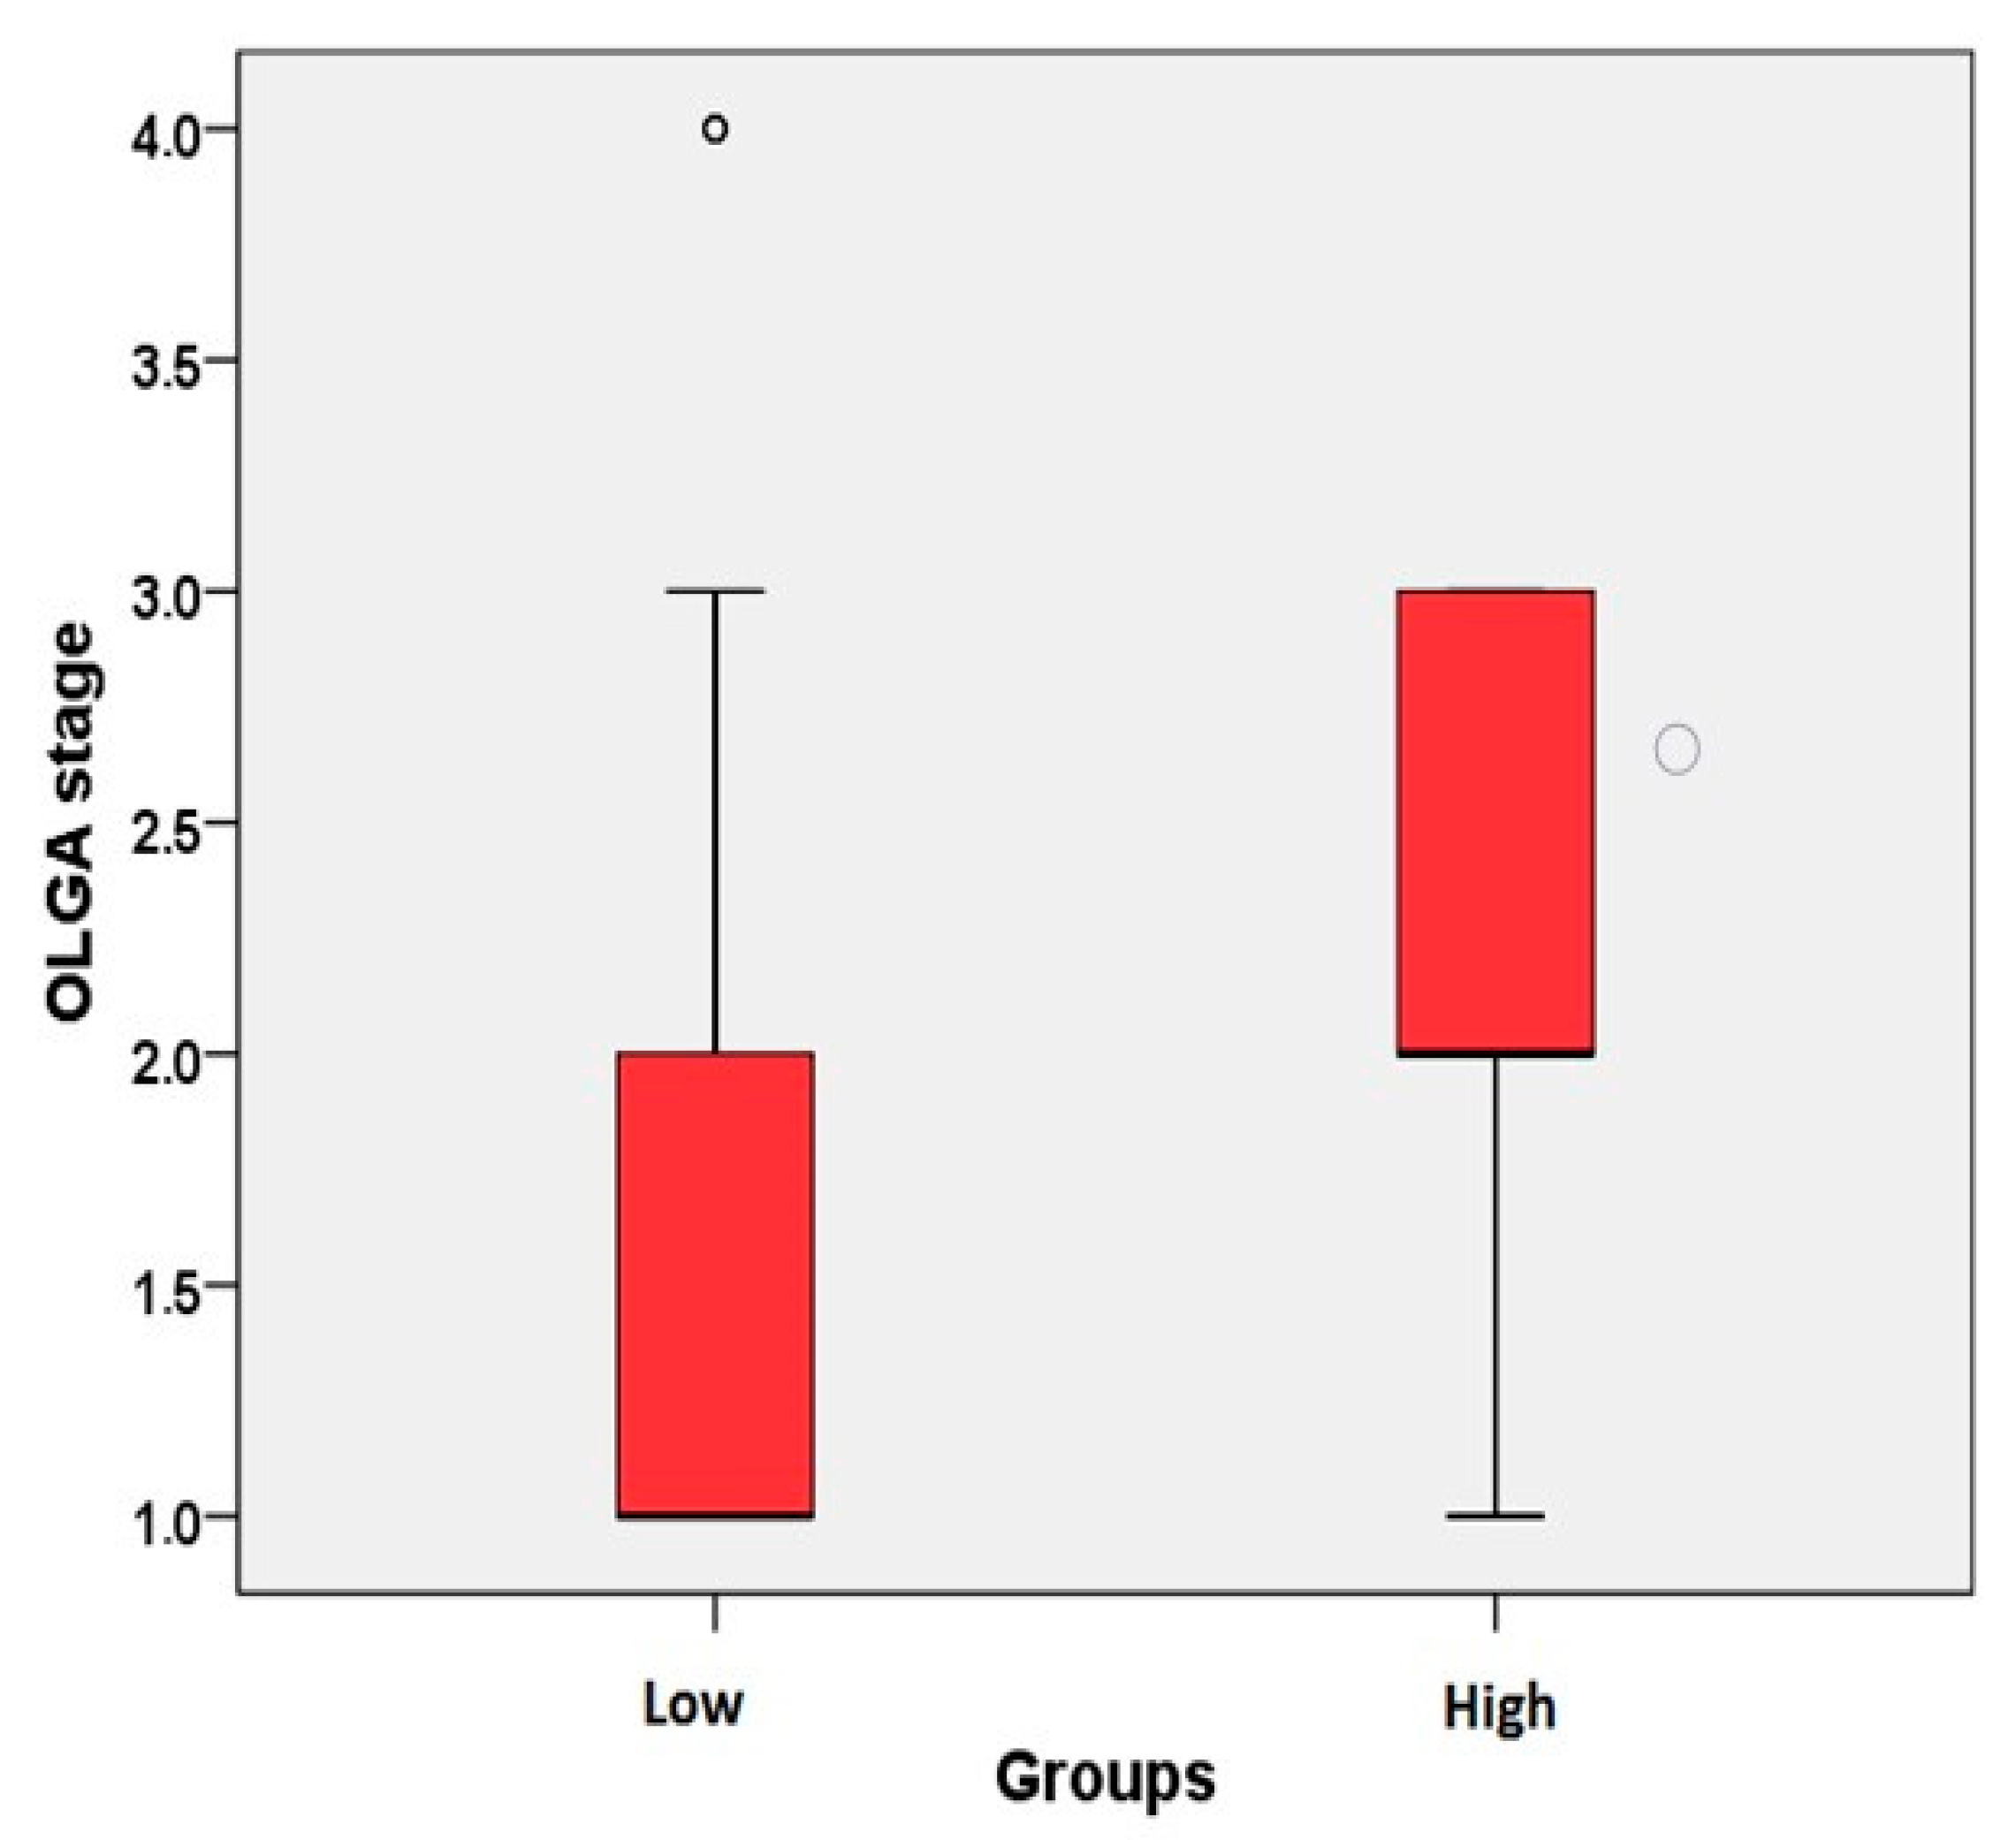
| OLGA stage | − | 141 | 1.59 ± 0.73 | 1 (1–4) | 0.007 * |
| + | 14 | 2.14 ± 0.77 | 2 (1–3) | ||
| Intestinal metaplasia | − | 141 | 0.25 ± 0.52 | 0 (0–3) | 0.578 |
| + | 14 | 0.29 ± 0.46 | 0 (0–1) | ||
| Inflammation | − | 141 | 2.21 ± 0.63 | 2 (1–3) | 0.106 |
| + | 14 | 2.50 ± 0.51 | 2.5 (2–3) | ||
| Activity | − | 141 | 1.23 ± 1.01 | 1 (0–3) | 0.244 |
| + | 14 | 1.57 ± 1.08 | 2 (0–3) |
| n (%)/Mean ± SD (min–max) | ||
|---|---|---|
| Gender | ||
| Female | 84 (54.2%) | |
| Male | 71 (45.8%) | |
| OLGA | ||
| 1 | 79 (51%) | |
| 2 | 56 (36.1%) | |
| 3 | 17 (11%) | |
| 4 | 3 (1.9%) | |
| Age | 49.1 ± 15.2 (18–81) |
© 2020 by the authors. Licensee MDPI, Basel, Switzerland. This article is an open access article distributed under the terms and conditions of the Creative Commons Attribution (CC BY) license (http://creativecommons.org/licenses/by/4.0/).
Share and Cite
Bulbuloglu, E.; Dagmura, H.; Daldal, E.; Deresoy, A.; Bakir, H.; Ozsoy, U.; Saglam, A.I.; Demir, O. Can Simple Tests Prior to Endoscopy Predict the OLGA Stage of Gastritis? Healthcare 2020, 8, 230. https://doi.org/10.3390/healthcare8030230
Bulbuloglu E, Dagmura H, Daldal E, Deresoy A, Bakir H, Ozsoy U, Saglam AI, Demir O. Can Simple Tests Prior to Endoscopy Predict the OLGA Stage of Gastritis? Healthcare. 2020; 8(3):230. https://doi.org/10.3390/healthcare8030230
Chicago/Turabian StyleBulbuloglu, Ertan, Hasan Dagmura, Emin Daldal, Alev Deresoy, Huseyin Bakir, Ugur Ozsoy, Ali Ihsan Saglam, and Osman Demir. 2020. "Can Simple Tests Prior to Endoscopy Predict the OLGA Stage of Gastritis?" Healthcare 8, no. 3: 230. https://doi.org/10.3390/healthcare8030230
APA StyleBulbuloglu, E., Dagmura, H., Daldal, E., Deresoy, A., Bakir, H., Ozsoy, U., Saglam, A. I., & Demir, O. (2020). Can Simple Tests Prior to Endoscopy Predict the OLGA Stage of Gastritis? Healthcare, 8(3), 230. https://doi.org/10.3390/healthcare8030230