3.1. Section 1. General Characteristics of the Study Sample
The analysis of respondents’ distribution according to gender demonstrated a predominance of female participants within the studied sample. Thus, 67.0% of participants were female (n = 73), while 33.0% were male (n = 36). This distribution reflects the current structure of the dental professional workforce, in which female participation is considerably increased, and provides adequate representativeness for the analysis of perceptions regarding the investigated periodontal therapies.
The analysis of the sample structure according to professional specialization revealed a predominance of general dental practitioners, who represented 51.4% of respondents (n = 56). Periodontology residents accounted for 22.0% of the sample (n = 24), reflecting the increased interest of this professional category in the study topic. Participants with other dental specialties represented 23.9% of the sample (n = 26), providing a multidisciplinary perspective regarding the investigation of the therapeutic approaches. A smaller proportion, namely 2.8%, consisted of certified specialists or senior specialists in periodontology (n = 3), which may be explained by the more limited numerical distribution of this professional category. Overall, the sample structure provided adequate professional diversity relevant to evaluating perceptions regarding periodontal therapy.
The analysis of respondents’ distribution according to years of professional experience in dental practice demonstrated a marked predominance of early-career practitioners. Most participants, namely 91.7% (n = 100), reported less than 5 years of professional experience, while 8.3% (n = 9) indicated between 5 and 10 years of experience. This distribution suggests that the sample consisted predominantly of young dentists actively engaged in professional development and adaptation to contemporary clinical guidelines and practices, an aspect particularly relevant for the evaluation of perceptions regarding modern therapeutic approaches in periodontology.
The analysis of the primary professional practice setting showed that most respondents were active in the private sector. Thus, 42.2% of participants (n = 46) worked in multidisciplinary private clinics, while 34.9% (n = 38) practiced in individual dental offices. A smaller proportion, namely 11.0% (n = 12), worked in hospitals or university clinics, whereas 11.9% (n = 13) reported other forms of professional practice organization. This distribution reflects the diversity of dental practice environments and provides a relevant context for interpreting perceptions regarding the applicability of periodontal therapies across different clinical settings.
The analysis of participation in postgraduate courses or continuing education programs in periodontology during the previous five years revealed variable levels of educational involvement among respondents. More than half of the participants (54.1%, n = 59) reported that they had not attended such courses during the evaluated period. In contrast, 27.5% (n = 30) indicated occasional participation in continuing education programs, while 18.3% (n = 20) reported consistent participation, defined as attending at least one course per year. This distribution suggests the existence of a gap between the need for continuous professional updating and the actual level of access or interest in postgraduate training, an aspect relevant for interpreting perceptions regarding the implementation of contemporary guidelines and periodontal therapies in clinical practice.
3.2. Section 2. Perception of Modern Non-Surgical Periodontal Therapies
The section evaluating the perception of modern non-surgical periodontal therapies demonstrated good internal consistency, with Cronbach’s alpha coefficient of 0.86 across the 7 analyzed items, indicating satisfactory reliability of the research instrument as illustrated in
Table 1.
Descriptive analysis revealed generally high levels of agreement across all items, with mean scores ranging from 3.89 to 4.11 in
Table 2. The highest level of agreement was observed for Item 11, while the lowest mean score was recorded for Item 7.
The Item–Total statistics analysis for the section evaluating the perception of modern non-surgical periodontal therapies is presented in
Table A1 and demonstrated an adequate contribution of all items to the internal consistency of the scale. Corrected item–total correlation values ranged between 0.49 and 0.75, exceeding the minimum acceptable threshold of 0.30, indicating that each item was relevant and appropriately correlated with the total scale score.
Cronbach’s alpha values if item deleted ranged between 0.82 and 0.87. The removal of none of the items resulted in a substantial increase in the alpha coefficient compared with the initial scale value (α = 0.86), confirming that all items were appropriately integrated and necessary for maintaining the reliability of the instrument.
Item–total analysis supported the retention of all seven items within the questionnaire structure, as all corrected item–total correlations exceeded the recommended threshold and no item deletion improved the overall reliability of the scale.
The psychometric evaluation of the scale dedicated to the perception of modern non-surgical periodontal therapies as seen in
Table A2 demonstrated good reliability, with a Cronbach’s alpha coefficient of 0.86, supporting the internal consistency of the instrument. Item–total correlation analysis further supported the retention of all seven items within the scale.
Repeated measures ANOVA revealed statistically significant differences between items (F = 2.62;
p = 0.01), indicating variability in responses across the evaluated aspects of non-surgical periodontal therapy in
Table A2. The overall mean score was 4.001, reflecting a generally positive perception of the concepts investigated.
The Intraclass Correlation Coefficient (ICC) analysis for the scale evaluating the perception of modern non-surgical periodontal therapies, presented in
Table A3, demonstrated good measurement reliability, particularly when the average item score was used.
The ICC for Single Measures was 0.46 (95% CI: 0.38–0.55), indicating moderate agreement, whereas the ICC for Average Measures reached 0.86 (95% CI: 0.81–0.89), indicating high reliability of the overall scale. The associated F-test was statistically significant (F = 7.13; p < 0.001), supporting the consistency of the measurements. These findings further support the reliability of the instrument for assessing perceptions regarding modern non-surgical periodontal therapies.
3.3. Section 3. Perception of Surgical Periodontal Therapy
The internal consistency of the scale evaluating the perception of surgical periodontal therapy was assessed using Cronbach’s alpha coefficient. As presented in
Table 3, the six-item scale demonstrated good internal consistency, with Cronbach’s alpha value of 0.78.
The descriptive statistical analysis of the six items included in the section dedicated to the perception of surgical periodontal therapy, presented in
Table 4, indicated a high level of agreement among respondents, with mean values ranging between 3.90 and 4.23 in a sample of 109 participants.
Respondents generally expressed positive perceptions regarding periodontal surgical therapy. The highest levels of agreement were observed for items related to the management of vertical bone defects, deep periodontal pockets, and the use of minimally invasive surgical approaches. Overall, mean scores indicate favorable attitudes toward the application of surgical therapy in accordance with contemporary clinical guidelines.
The Item–Total statistics analysis for the section dedicated to the perception of surgical periodontal therapy, presented in
Table A4 and
Table A5, indicated an adequate contribution of most items to the internal consistency of the scale. Corrected item–total correlation values ranged from 0.36 to 0.69, all exceeding the recommended threshold of 0.30, indicating an adequate contribution of each item to the overall scale.
The item addressing the application of surgical therapy only after failure of non-surgical treatment, according to the S3 Guidelines, demonstrated the lowest item–total correlation; however, the value remained acceptable and may reflect variability in clinical opinion among respondents. Cronbach’s alpha values if item deleted ranged between 0.72 and 0.82, and the removal of none of the items resulted in a substantial improvement of the global alpha coefficient (α = 0.78). This finding supports the retention of all items within the scale structure and confirms its conceptual homogeneity and psychometric stability.
The ANOVA analysis demonstrated statistically significant differences between the items of the scale evaluating perceptions regarding surgical periodontal therapy (F = 6.36;
p < 0.001), indicating that respondents evaluated specific aspects of this therapeutic approach differently. Nevertheless, the high overall mean value (Grand Mean = 4.10) reflects a generally favorable attitude toward periodontal surgical therapy. These findings confirm the ability of the scale to discriminate between different clinical dimensions while maintaining the coherence and psychometric relevance of the instrument, as illustrated in
Table A6.
The Intraclass Correlation Coefficient (ICC) analysis for the section evaluating perceptions regarding surgical periodontal therapy, presented in
Table A7, demonstrated acceptable to good reliability of the scale, particularly when the average item score was used. For Single Measures, the ICC value was 0.38 (95% CI: 0.30–0.47), indicating a moderate level of agreement between items, which reflects the diversity of clinical opinions regarding different aspects of surgical periodontal therapy.
In contrast, for Average Measures, the ICC reached a value of 0.78 (95% CI: 0.72–0.84), corresponding to a good level of reliability. The associated F-test was statistically significant (F = 4.72; p < 0.001), confirming the presence of genuine agreement between items and valid differentiation between respondents. These findings are consistent with the Cronbach’s alpha coefficient obtained for this section and support the use of the scale as a composite instrument for evaluating perceptions regarding surgical periodontal therapy. Overall, the ICC analysis confirmed that the scale demonstrates adequate psychometric stability and is suitable for further statistical analyses in clinical research.
3.4. Section 4. Comparison Between Non-Surgical and Surgical Approaches
The section dedicated to the comparison between non-surgical and surgical approaches demonstrated good internal consistency, with Cronbach’s alpha coefficient of 0.77 for the 5 analyzed items, as illustrated in
Table 5.
The descriptive statistical analysis of the five items included in the section dedicated to the comparison between non-surgical and surgical approaches, presented in
Table 6, revealed a high level of agreement among respondents, with mean values ranging between 3.71 and 4.43 in a sample of 109 participants. The highest level of agreement was observed for the statement regarding the staged integration of the two therapeutic approaches in complex cases, suggesting a clear orientation toward combined and personalized treatment strategies. In addition, non-surgical treatment was perceived as being better accepted by patients compared with surgical therapy, highlighting the importance of patient compliance and comfort in therapeutic decision-making.
Descriptive analysis indicated generally positive perceptions regarding the relationship between non-surgical and surgical periodontal therapies. Greater variability was observed for items addressing the comparability of clinical outcomes and the timing of surgical intervention, whereas stronger agreement was recorded for the role of non-surgical therapy and supportive periodontal care in preventing the need for surgery.
The Item–Total statistics analysis for the section dedicated to the comparison between non-surgical and surgical approaches, presented in
Table A8, demonstrated an adequate contribution of all five items to the internal consistency of the scale. Corrected item–total correlation values ranged between 0.41 and 0.64, exceeding the minimum acceptable threshold of 0.30, thereby confirming that each item was relevant and appropriately correlated with the overall scale score.
Corrected item–total correlation values supported the contribution of all items to the overall scale. Cronbach’s alpha if item deleted ranged from 0.69 to 0.77, indicating that the removal of any individual item did not substantially improve the reliability of the instrument. Therefore, all items were retained within the final scale structure.
Repeated measures ANOVA revealed statistically significant differences between items (F = 38.12; p < 0.001), indicating variability in responses across the evaluated statements. The overall mean score was 4.08, reflecting generally positive perceptions regarding the integration of non-surgical and surgical periodontal therapies.
The Intraclass Correlation Coefficient (ICC) analysis for the section comparing non-surgical and surgical approaches, presented in
Table A9, demonstrated good reliability of the scale, particularly when the composite score was used. The ICC value for Single Measures indicated a moderate level of agreement between items, reflecting the variety of aspects evaluated, whereas the ICC for Average Measures reached a value of 0.77, corresponding to a good level of reliability. The associated F-test was statistically significant (
p < 0.001), confirming measurement stability and genuine differentiation between respondents. These findings are consistent with the Cronbach’s alpha coefficient and support the use of the scale as a reliable psychometric instrument for evaluating comparative perceptions regarding the two therapeutic approaches.
The results of the KMO and Bartlett’s tests, presented in
Table 7, indicated that the dataset was appropriate for factor analysis. The Kaiser–Meyer–Olkin (KMO) value of 0.77 suggested a good level of sampling adequacy, indicating sufficient correlations between items for the identification of latent factors. At the same time, Bartlett’s test of sphericity was statistically significant (χ
2 = 693.63; df = 78;
p < 0.001), confirming that the correlation matrix differed significantly from an identity matrix. Overall, these findings support the suitability of conducting exploratory factor analysis and indicate a coherent latent structure among the analyzed items.
The communality values obtained through exploratory factor analysis (PCA), presented in
Table 8, indicated an adequate representation of all items within the factorial structure, with extraction values ranging between 0.65 and 0.80. These findings demonstrate that a substantial proportion of the variance of each item was explained by the extracted factors, exceeding the minimum acceptable threshold for inclusion in the model.
The items related to the use of modern technologies, the acceptability of non-surgical treatment, the staged integration of therapeutic approaches, and the advantages of periodontal surgery demonstrated particularly high communalities, indicating strong coherence with the latent structure of the evaluated construct. Overall, the results support the retention of all items in the analysis and confirm the construct validity and adequacy of the instrument used.
The analysis of total variance explained indicated that, following exploratory factor analysis using the Principal Component Analysis (PCA) method, four components with eigenvalues greater than 1 were identified, supporting their retention within the final factorial structure. Together, these four components explained 73.94% of the total variance of the dataset, representing a high percentage and indicating a good capacity of the factorial model to capture the information contained within the questionnaire items.
The first component explained 34.97% of the total variance and demonstrated a dominant contribution to the structure of the instrument, suggesting the presence of a central dimension well represented by a coherent set of items. The second component contributed 17.61% of the variance, while the third explained 13.42%, indicating additional conceptually distinct and clinically relevant dimensions that substantially complemented the questionnaire structure. The fourth component accounted for 7.94% of the total variance and reflected an additional dimension with a clearly defined role, although with a lower contribution compared with the first three components.
Following Varimax rotation in
Table 9, the explained variance became more evenly redistributed across the final components without modifying the cumulative percentage of explained variance. Thus, the first rotated component explained 22.64% of the variance, the second 19.01%, the third 18.53%, and the fourth 13.77%, indicating a more balanced distribution of information among factors. This redistribution confirms the role of rotation in clarifying the factorial structure and facilitating the conceptual interpretation of each dimension.
Components with eigenvalues below 1 were not retained, as their individual contribution to variance explanation was limited and did not provide a meaningful additional contribution to the factorial structure of the model. Overall, the high percentage of variance explained by the four retained components supports the adequacy of the factorial solution and indicates that the questionnaire is well structured, effectively capturing the main dimensions of the investigated clinical attitudes and practices.
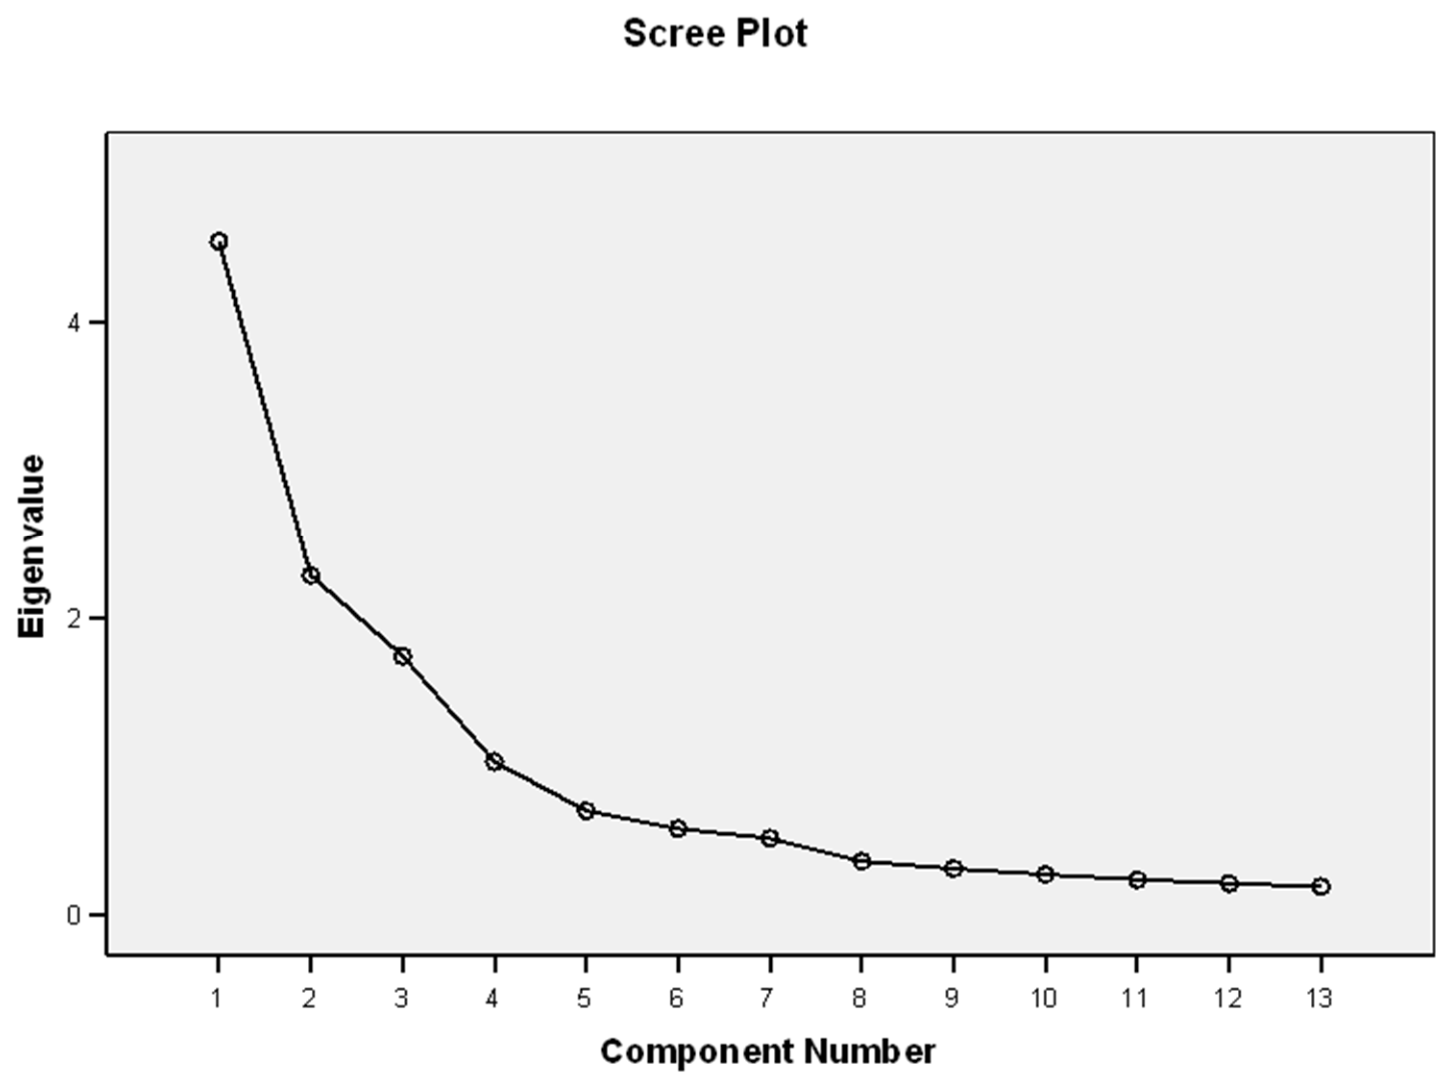
The scree plot analysis performed for the questionnaire items, presented in
Figure 2, revealed a clear inflection point after the third component, followed by a gradual decrease in eigenvalues. However, according to the Kaiser criterion, four components presented eigenvalues greater than 1 (4.54, 2.28, 1.74, and 1.03), together explaining 73.94% of the total variance presented in
Table 9. Although visual inspection of the scree plot suggested a possible three-factor solution, the fourth component also met the retention criterion and contributed additional explanatory value. Therefore, a four-factor solution was retained and further explored through Varimax rotation. The resulting structure demonstrated satisfactory interpretability and conceptual coherence, supporting the retention of four factors in the final model.
The unrotated component matrix, presented in
Table 10, revealed factor loadings distributed across multiple components, with numerous cross-loadings between items, indicating an insufficiently differentiated factorial structure at this stage of the analysis. This type of distribution is characteristic of the pre-rotation phase of exploratory factor analysis and does not allow a clear conceptual interpretation of the factors. Therefore, Varimax rotation was applied in order to obtain a clearer factorial structure and facilitate the interpretation of the latent dimensions.
The application of Varimax rotation with Kaiser normalization clarified the initial factorial structure and resulted in the identification of four distinct components reflecting conceptually relevant dimensions of periodontal clinical management, as illustrated in
Table 11. The distribution of items across components demonstrated coherent organization, characterized by predominantly high factor loadings and minimal overlap between factors, thereby facilitating conceptual interpretation and supporting the construct validity of the instrument.
The first component grouped items related to the effectiveness and optimization of non-surgical periodontal treatment, including the use of local antiseptics, modern adjunctive technologies, rigorous application of the subgingival instrumentation phase according to the S3 Guidelines, and the judicious administration of systemic antibiotics in selected cases. The high factor loadings associated with these items indicate that respondents perceive modern guideline-based non-surgical treatment as an effective and predictable therapeutic strategy.
The second component reflected the role of periodontal surgical therapy and the criteria supporting its clinical indication. The items defining this factor addressed the preference for minimally invasive approaches, the advantages of surgical intervention in areas inaccessible to non-surgical therapy, and the necessity of surgery in the management of vertical bone defects or deep periodontal pockets. This structure suggests a differentiated understanding of surgical indications based on case selection and the clinical benefits of intervention.
The third component grouped items expressing a patient-centered conservative approach and a staged therapeutic strategy. This dimension included the perception of greater patient acceptability of non-surgical treatment, the importance of maintenance therapy and rigorous reevaluation in preventing the need for surgical intervention, and the progressive integration of non-surgical and surgical therapies in complex cases. This factor reflects a pragmatic clinical approach focused on balancing therapeutic effectiveness with patient comfort.
The fourth component captured the relationship between clinical practice and the recommendations of the S3 Guidelines, highlighting both the perception of comparable outcomes between non-surgical and surgical therapies in moderate forms of periodontitis and the tendency toward earlier use of surgery in routine clinical practice than recommended by current guidelines. This component reveals the existence of a discrepancy between theoretical recommendations and their practical implementation, emphasizing decision-making variability according to clinical context and professional experience.
Overall, the obtained factorial structure demonstrates that the questionnaire items are organized into distinct and conceptually well-defined dimensions reflecting essential aspects of periodontal decision-making. The high factor loadings and coherent distribution of items across factors support the methodological adequacy of the exploratory factor analysis and confirm that the instrument is capable of validly and distinctly capturing the investigated clinical attitudes and practices.
The component transformation matrix describes the manner in which the initial components were reoriented through the application of Varimax rotation with Kaiser normalization in order to obtain a clearer and more easily interpretable factorial structure. The presented values represent the transformation coefficients between the initial and rotated components, indicating the contribution of each initial component to the definition of the final factors.
The distribution of coefficients demonstrates that each rotated factor resulted from a linear combination of multiple initial components, without a single initial component exclusively dominating the final structure. This redistribution of variance is characteristic of orthogonal rotations and confirms that the Varimax rotation maximized relevant factor loadings while minimizing overlap between latent dimensions.
The presence of both positive and negative coefficients with varying magnitudes reflects the reorientation of the factorial axes so that each factor captures as accurately as possible a distinct conceptual dimension of the questionnaire. Furthermore, the orthogonal nature of the rotation indicates that the final factors are independent from one another, supporting their interpretation as separate dimensions of periodontal decision-making.
Within the context of the present questionnaire, this matrix confirms that the final factorial structure is not the result of arbitrary organization, but rather of a controlled statistical transformation intended to better reflect the actual relationships between items. Thus, the transformation matrix supports the stability and robustness of the factorial solution and reinforces the construct validity of the instrument, demonstrating that the identified dimensions are well differentiated and appropriate for evaluating the investigated clinical attitudes and practices (
Table 12).
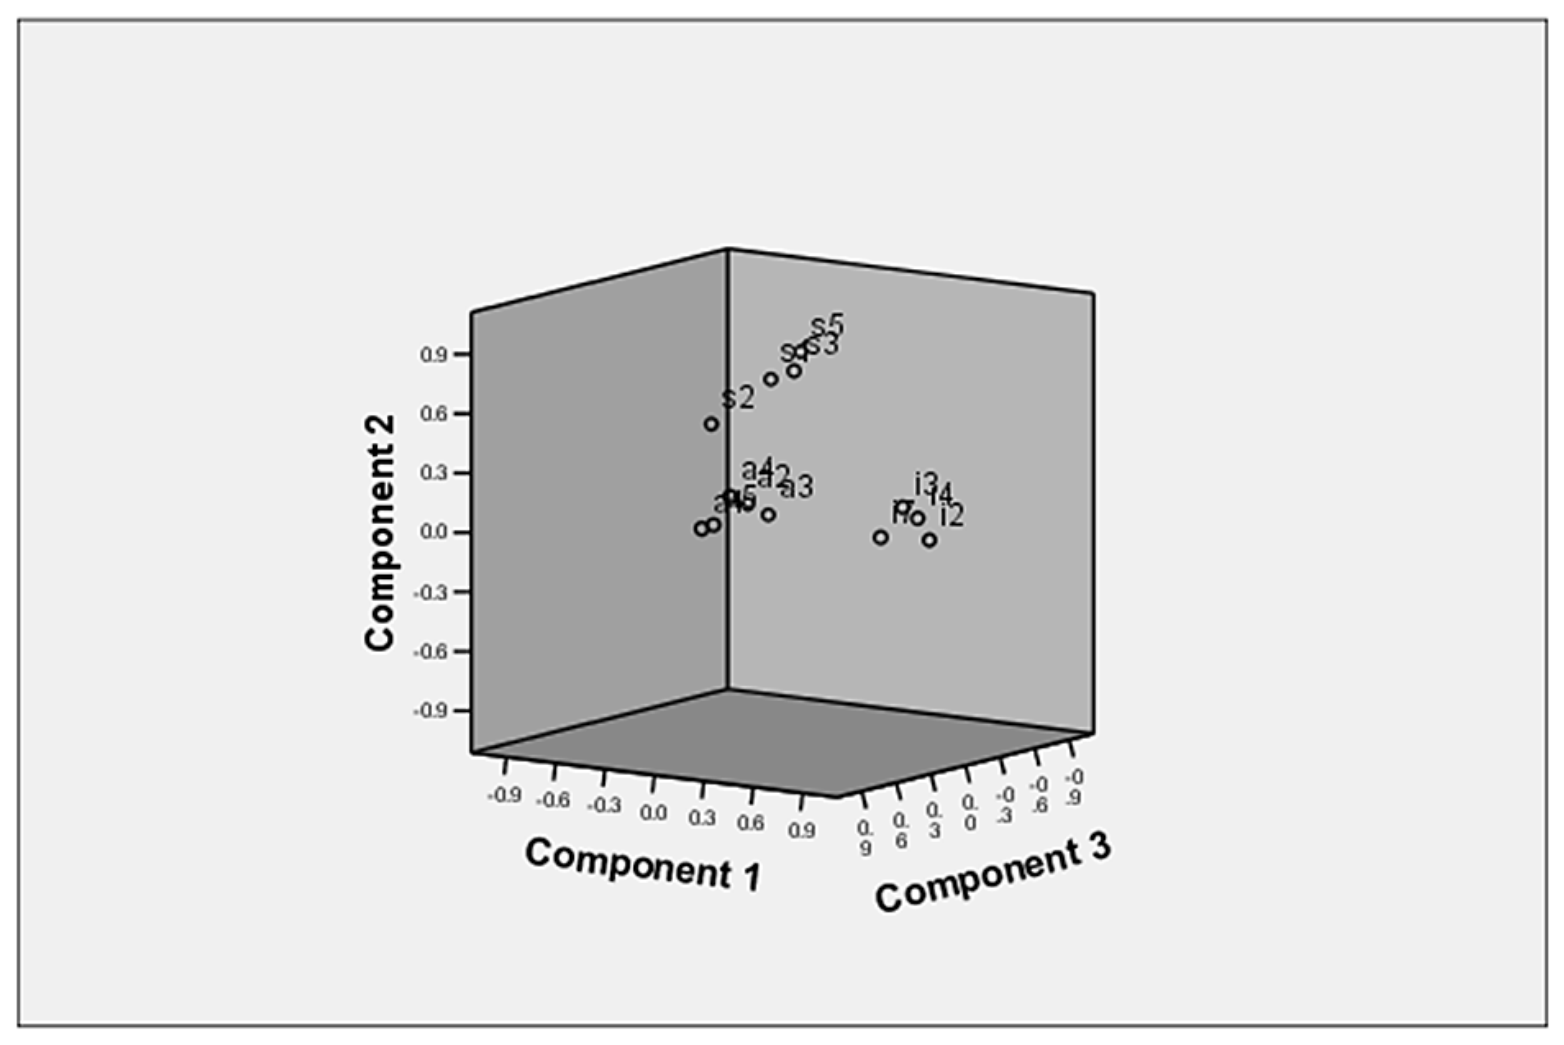
The graphical representation of the items in the rotated component space, presented in
Figure 3, demonstrated a coherent organization of the items around the axes corresponding to the extracted components, thereby confirming the factorial structure identified through exploratory factor analysis. Following the application of Varimax rotation, the items tended to form distinct clusters, with a clear visual separation between latent dimensions, indicating a substantial reduction in overlap between factors.
Items positioned in close proximity to the same axis represented questions measuring the same clinical construct and were perceived by respondents as belonging to the same decisional dimension. The clusters observed in the graph reflected a clear differentiation between attitudes toward non-surgical periodontal treatment, the indications and role of surgical therapy, and the alignment of clinical practice with treatment guideline recommendations. This distribution suggests that respondents consistently distinguished between conservative therapeutic strategies, surgical interventions, and protocol-guided clinical approaches.
Items located closer to the center of the graph indicated dimensions with a more general or transversal character, potentially influencing multiple aspects of clinical decision-making without being exclusively associated with a single factor. Nevertheless, these items did not compromise the overall separation of the components but rather reflected the complexity of decision-making in periodontology.
Overall, the Component Plot in rotated space provides additional visual support for the validation of the final factorial structure, demonstrating that the questionnaire items are well anchored within distinct and coherent dimensions. This organization confirms that the instrument is capable of distinctly capturing the investigated clinical attitudes and practices, thereby supporting the construct validity and practical usefulness of the questionnaire.



 ,
,