2.1. Data Source
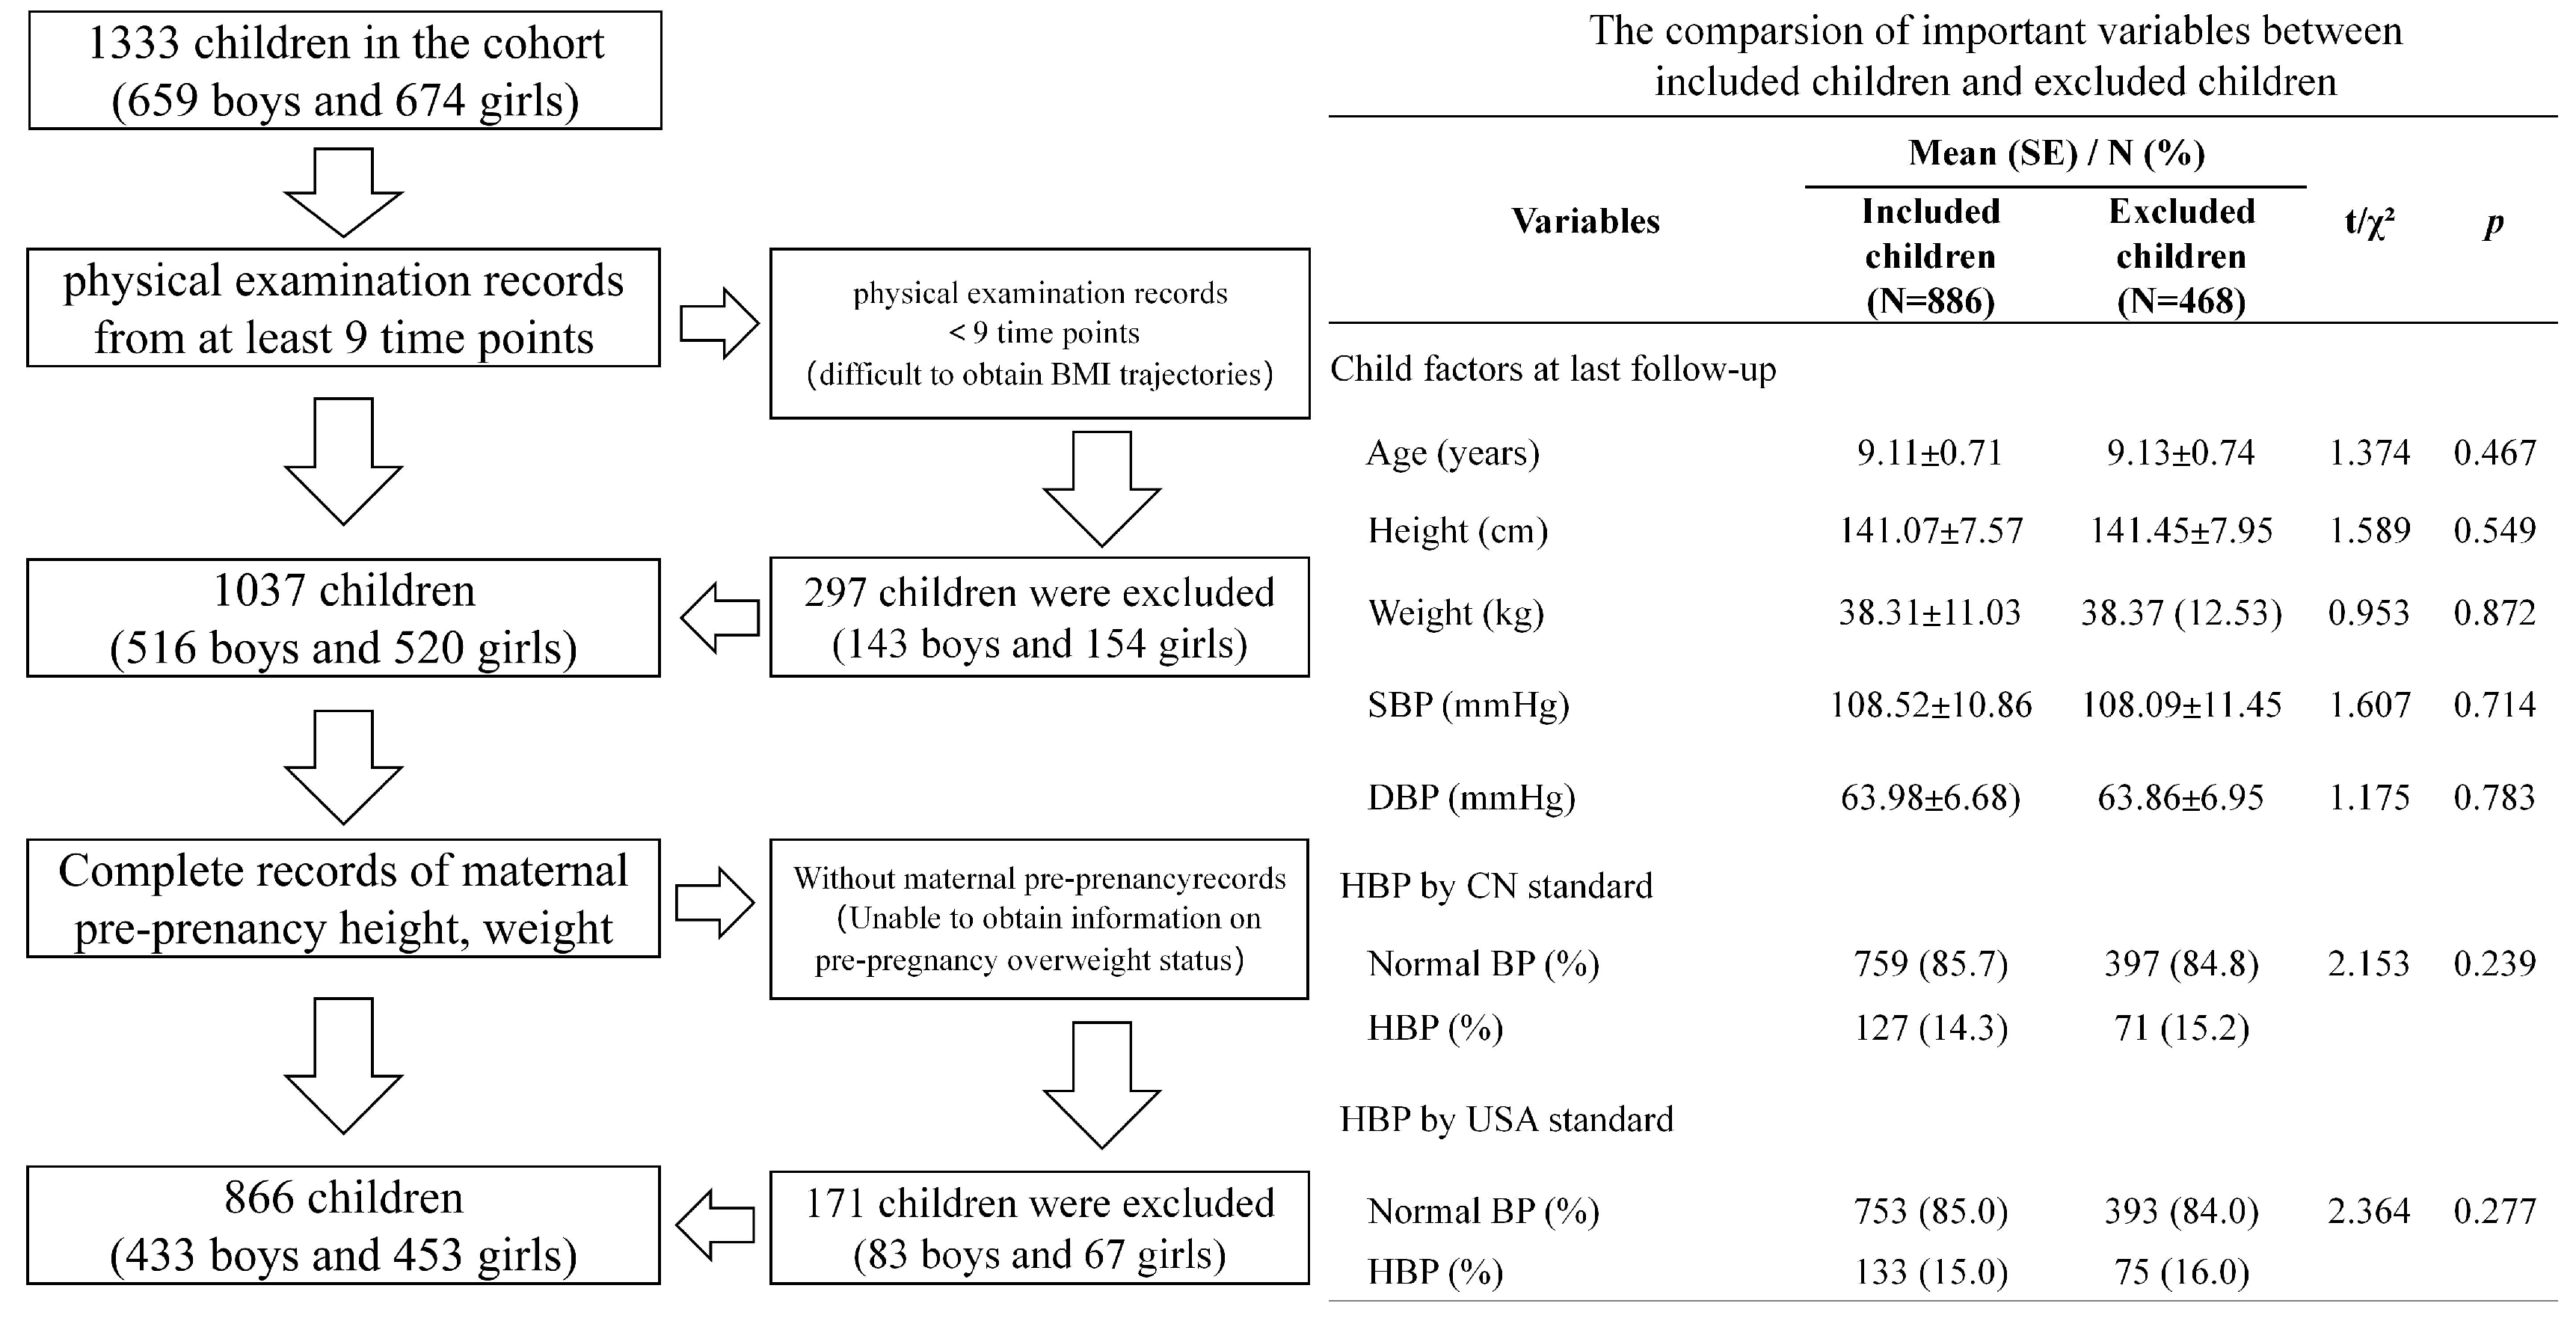
A cluster sampling strategy was employed to recruit all students in grades 1–2 from three elementary schools in Tianjin, China. Data collected prior to school enrollment were obtained from the Tianjin Women and Children’s Health Center. These records included general maternal information, clinical measurements, and data from twelve physical examinations of the offspring conducted from birth through preschool age. To ensure data completeness, children were required to have physical examination records for at least 9 time-points, including mandatory measurements of height and weight at birth and at the final follow-up assessment. Based on these criteria, 296 children were excluded. Additionally, complete records of maternal pre-pregnancy height, weight, and BP were required; an additional 171 children were excluded due to missing maternal information. A flowchart of participant selection is presented in
Appendix A (
Figure A1). No significant differences in height, weight, and BP at the last survey were observed between the excluded and included children. Ultimately, a total of 886 children were included in the final analysis (mean age = 9.11 years, standard deviation [SD] = 0.71), as detailed in
Table 1. Following school entry, participants underwent annual physical examination and completed self-administered questionnaires at each visit. These data were linked to early-life healthcare records through a unique healthcare identification number assigned to each child.
2.2. Maternal Measurements and GWG
Maternal pre-pregnancy weight and height were obtained from clinical measurements. Pre-pregnancy BMI was calculated as weight in kilograms divided by height in meters squared (kg/m
2), and categorized as underweight (BMI ≤ 18.5; 109/886, 12.3%), normal weight (18.5 ≤ BMI < 25; 590/886, 66.6%), overweight (25 ≤ BMI < 30; 149/886, 16.8%), and obese (BMI ≥ 30; 38/886, 4.3%) [
10]. For subsequent analyses, these categories were grouped into non-overweight (BMI < 25) and overweight (BMI ≥ 25).
Prepartum weight was measured without shoes and in light clothing using a beam balance scale (RGZ-120, Jiangsu Suhong Medical Instruments Co., Changzhou, China). GWG was calculated as the difference between prepartum weight and pre-pregnancy weight. GWG was categorized as inadequate, adequate, or excessive according to the Institute of Medicine (IOM) guidelines [
11]. Specifically, adequate GWG was defined as 12.5–18.0 kg for underweight women, 11.5–16.0 kg for normal weight women, 7.0–11.5 kg for overweight women, and 5.0–9.0 kg for women with obesity. GWG values below or above these ranges were classified as inadequate or excessive, respectively.
2.3. Child Anthropometric and BP Measurements
Anthropometric and BP measurements were obtained following standardized protocols throughout the follow-up period, with all instruments calibrated prior to use. Children were assessed without shoes and in light clothing. Measurements were conducted from birth to approximately 9 years of age, with data collected four times during infancy (within the first 12 months), twice annually at ages 2 and 3, and once per year thereafter.
Weight was measured to the nearest 0.1 kg using a digital scale (TCS-60, Tianjin Weighing Apparatus Co., Ltd., Tianjin, China). Recumbent length in infants was measured using a length stadiometer (YSC-2, Beijing Guowangxingda, Beijing, China), while standing height in older children was measured using a portable stadiometer; both instruments were accurate to 0.1 cm. During height assessments, children were instructed to stand upright and barefoot with heels together. Each anthropometric measurement was taken twice; if the discrepancy exceeded 0.1 kg for weight or 0.1 cm for height, a third measurement was obtained, and the two closest values were averaged.
BP was measured using an OMRON electronic sphygmomanometer with an appropriately sized cuff. Participants rested in a seated position for at least five minutes before measurement. Systolic BP (SBP) and diastolic BP (DBP) were measured at least twice, with a five-minute interval between readings. If the discrepancy between consecutive readings exceeded 10 mmHg, additional measurements were taken until the discrepancy between the final two readings was within 10 mmHg. The mean of the two closest readings was used in subsequent analyses. As the diagnosis of hypertension typically requires BP measurements on three separate occasions, and measurements in this study were obtained only at the final survey, only screening for HBP was conducted. HBP screening at the final follow-up was performed according to two standards: the Reference of Screening for Elevated Blood Pressure Among Children and Adolescents Aged 7~18 Years (CN standard) and the 2017 Clinical Practice Guideline for Screening and Management of High Blood Pressure in Children and Adolescents (USA standard) [
12,
13]. Based on both standards, HBP was defined as SBP and/or DBP at or above the 95th percentile for age, sex, and height.
All data collection methods were non-invasive. Written informed consent was obtained from all participants with parental assistance. This study was approved by the Ethics Committee of Peking University (IRB00001052-19099).
2.4. Covariates
Maternal covariates were obtained via self-report at the first antenatal care visit, including maternal age, ethnicity, education level, abortion history, last menstrual period, smoking status, and alcohol consumption. Additional information was extracted from medical records, including age at delivery, breastfeeding status (categorized as exclusive breastfeeding, exclusive formula feeding, or mixed feeding), pregnancy outcomes (mode of delivery), and gestational duration (calculated as the interval between the last menstrual period and the delivery date).
Child-related covariates were collected using a structured questionnaire administered at the final follow-up. These included child age, sex, singleton status (singleton or multiple birth), vegetable intake, and frequency of moderate-intensity physical activity. To ensure data accuracy, questionnaires were completed by the children with parental assistance, acknowledging that some items may have been difficult for younger participants to understand independently.
2.5. Statistical Analysis
Continuous variables were compared using Student’s t-test, as appropriate. Categorical variables were compared using the chi-squared (χ2) test.
Children’s BMI at each time point was converted into age- and sex- specific BMI-Z scores. A group-based trajectory model (GBTM) was conducted in Stata 17.0 (StataCorp LLC, College Station, TX, USA) to identify BMI trajectory groups from birth to the final follow-up [
14]. Successive BMI Z-scores were modeled using a Tobit model, with age as the time metric. Linear, quadratic and cubic polynomial functions were initially fitted, and the optimal polynomial degree was selected based on Bayesian information criteria (BIC) values. The cubic polynomial model demonstrated the best fit. Subsequently, cubic models with 2 to 5 trajectory groups were estimated, and the final five-group model was selected based on (1) the lowest absolute value of BIC, and (2) an average posterior probability ≥ 0.7 (
Table A1).
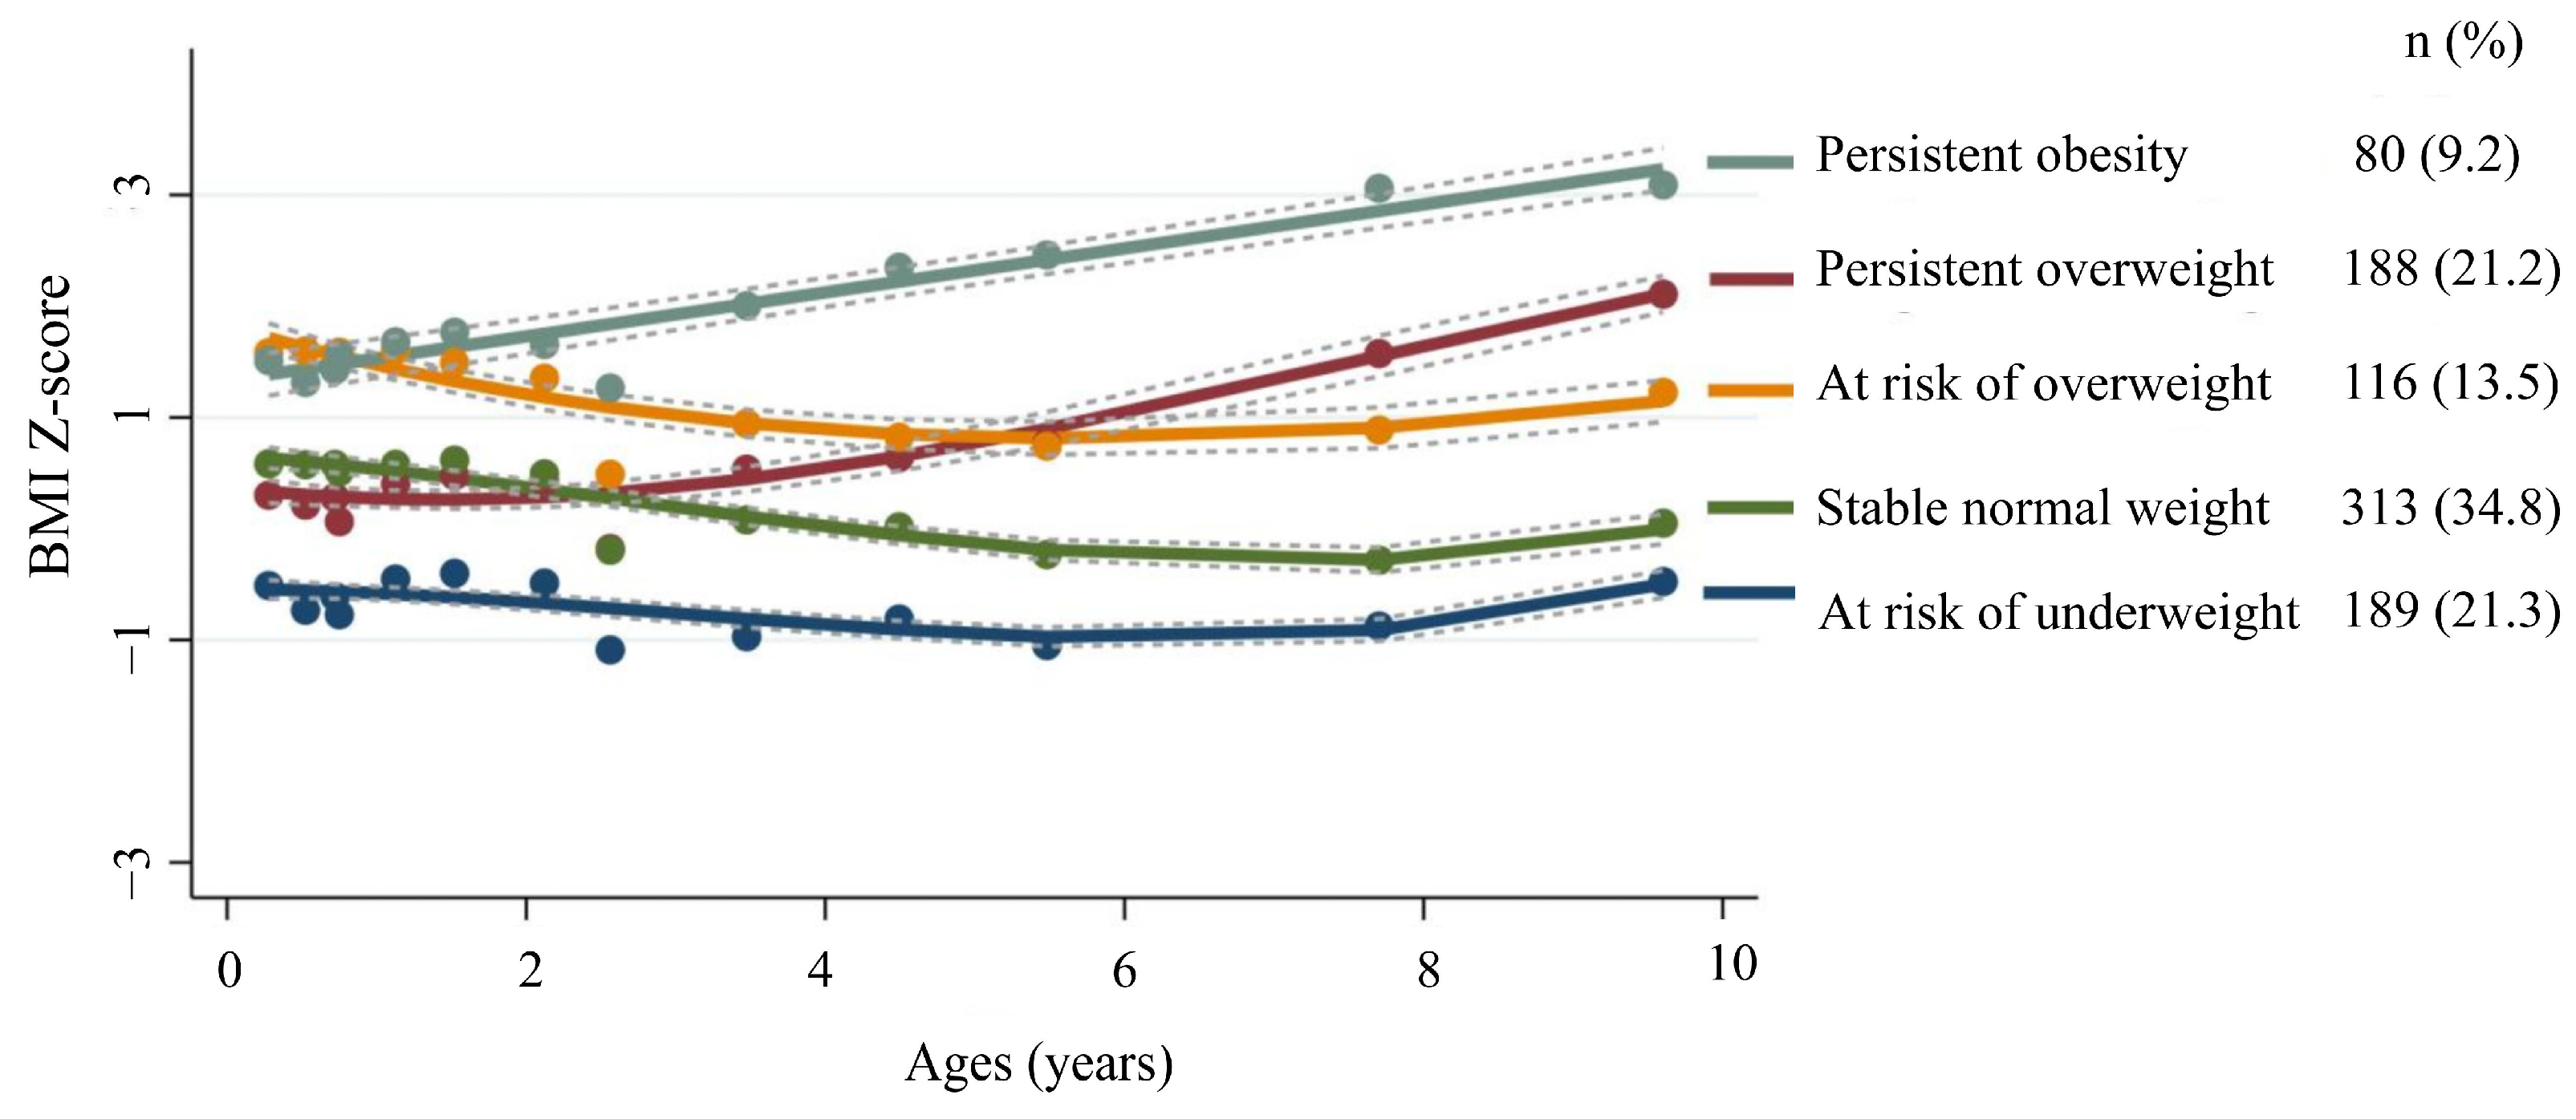
Five distinct BMI trajectories were identified (
Figure 1): stable normal weight (
n = 313, 34.8%), at risk of underweight (
n = 189, 21.3%), at risk of overweight (
n = 116, 13.5%), persistent overweight (
n = 188, 21.2%), and persistent obesity (
n = 80, 9.2%). The “at risk of underweight” group had BMI-Z scores consistently below −1.28 and was typically observed in premature or low-birth-weight infants. The “stable normal weight” group maintained the BMI-Z scores between −1.28 and +1.04 stably and generally served as the reference group. The “at risk of overweight” group showed BMI-Z scores within the upper normal range (+0.5 to +1.04) with a gradual upward trend. The “persistent overweight” group demonstrated BMI-Z scores exceeding +1.04 with a continued increase (an average annual increase > 0.4). The “persistent obesity” group had BMI-Z scores exceeding +1.88 (P97) at an early age, and continued to rise. This trajectory typically manifests before school age and may contribute to endocrine disorders and cardiovascular complications, imposing a substantial long-term healthcare burden [
15,
16].
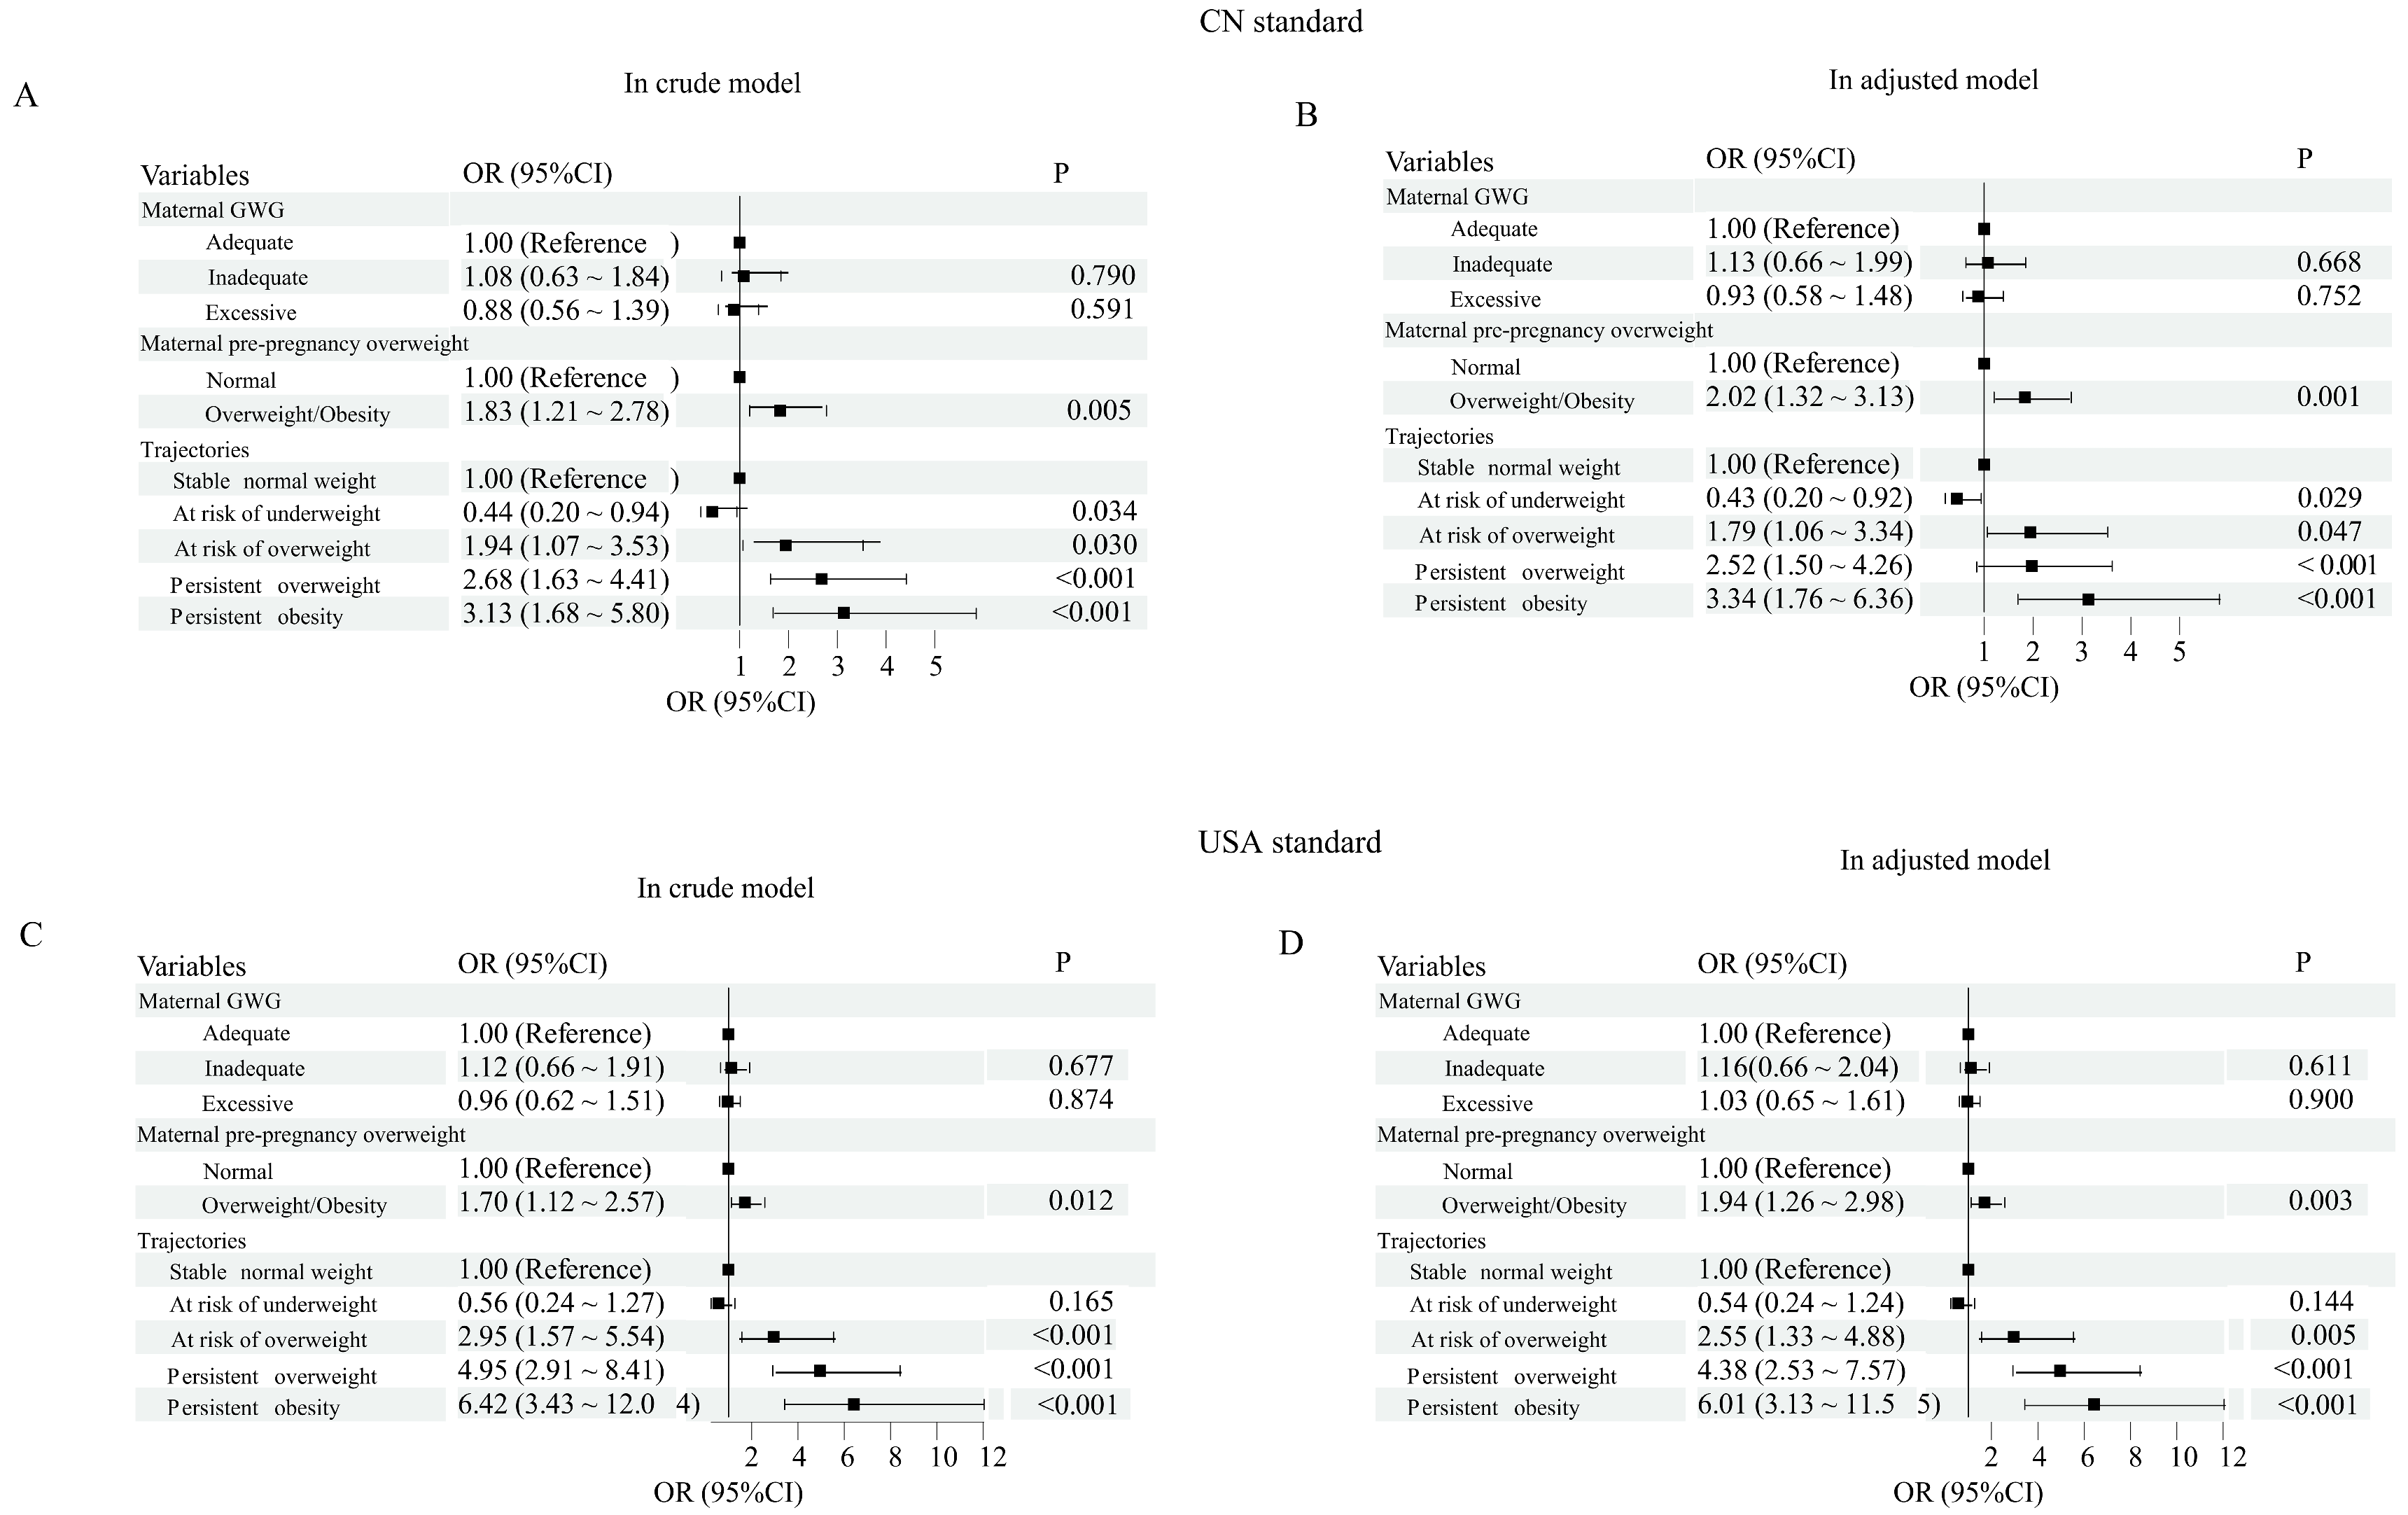
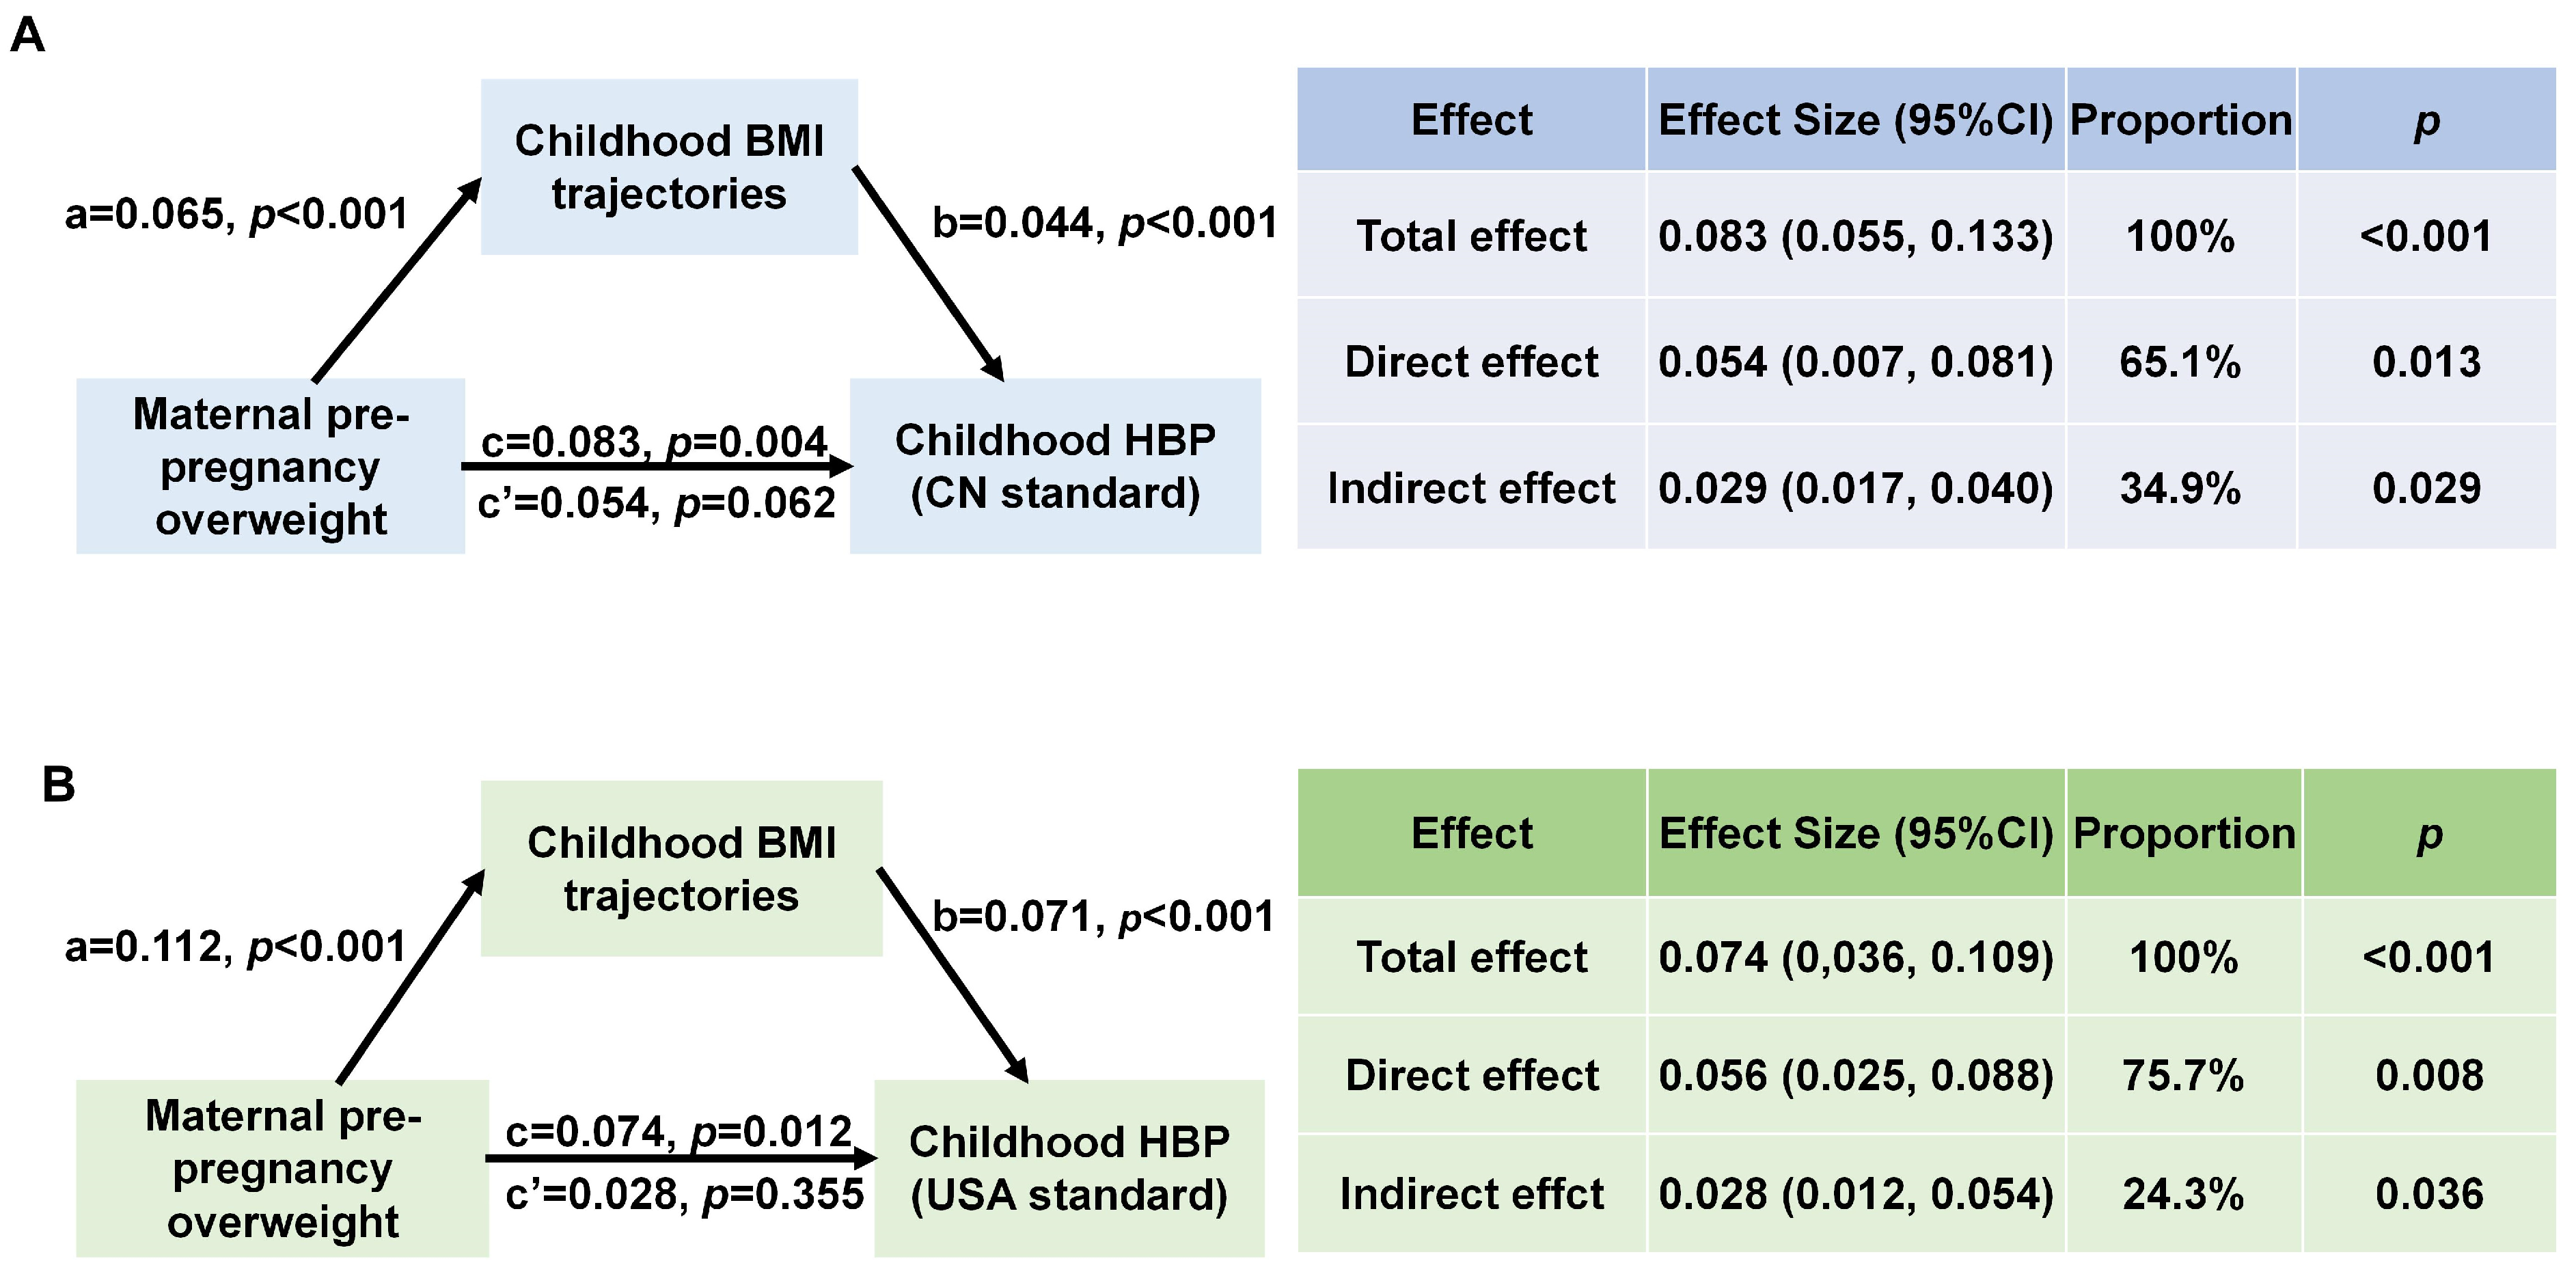
Binomial logistic regression analyses were performed using SPSS version 21.0 (IBM Corp., Armonk, NY, USA) to assess the associations of maternal pre-pregnancy overweight, GWG and BMI trajectories with childhood HBP. The associations were examined in both crude models (Model 1; unadjusted) and adjusted models (Model 2: adjusted for ethnicity, age, children’s diet and exercise habits, maternal breastfeeding, maternal BP during pregnancy, maternal history of hypertension and other diseases, and singleton status). Mediation analysis was conducted using the PROCESS macro (version 4.1) in SPSS. Prior to the mediation analysis, pairwise correlations among the independent variable, mediator, and outcome were examined by binomial logistic regression analyses; mediation analysis was subsequently conducted only if all pairwise correlations were statistically significant. Within this framework, path
a represents the association between the independent variable and the mediator, path
b represents the association between the mediator and the outcome, and path
c (total effect) and path
c’ (direct effect) represent the total and direct effects of the independent variable on the outcome, respectively. A mediation effect was considered present when both paths a and b were statistically significant (
p < 0.05). A reduction in the effect size from
c to
c’ indicated partial mediation, whereas a non-significant
c’ indicated complete mediation [
17].
Based on different maternal pre-pregnancy overweight status and childhood BMI trajectories, participants were further classified into ten subgroups to estimate the combined effect of maternal pre-pregnancy overweight and childhood BMI trajectories on childhood HBP. The subgroups were: (1) stable normal weight without maternal pre-pregnancy overweight (reference group), (2) stable normal weight with maternal pre-pregnancy overweight, (3) at risk of underweight without maternal pre-pregnancy overweight, (4) at risk of underweight with maternal pre-pregnancy overweight, (5) at risk of overweight without pre-pregnancy overweight, (6) at risk of overweight with pre-pregnancy overweight, (7) persistent overweight without maternal pre-pregnancy overweight, (8) persistent overweight with maternal pre-pregnancy overweight, (9) persistent obesity without maternal pre-pregnancy overweight, and (10) persistent obesity with maternal pre-pregnancy overweight.
All statistical tests were two-sided, and a p-value of <0.05 was considered statistically significant.




 ,
,