
Differences in Plasma Lactoferrin Concentrations Between Subjects with Normal Cognitive Function and Mild Cognitive Impairment: An Observational Study

 , , , , , , and
Abstract
1. Introduction
2. Materials and Methods
2.1. Ethics
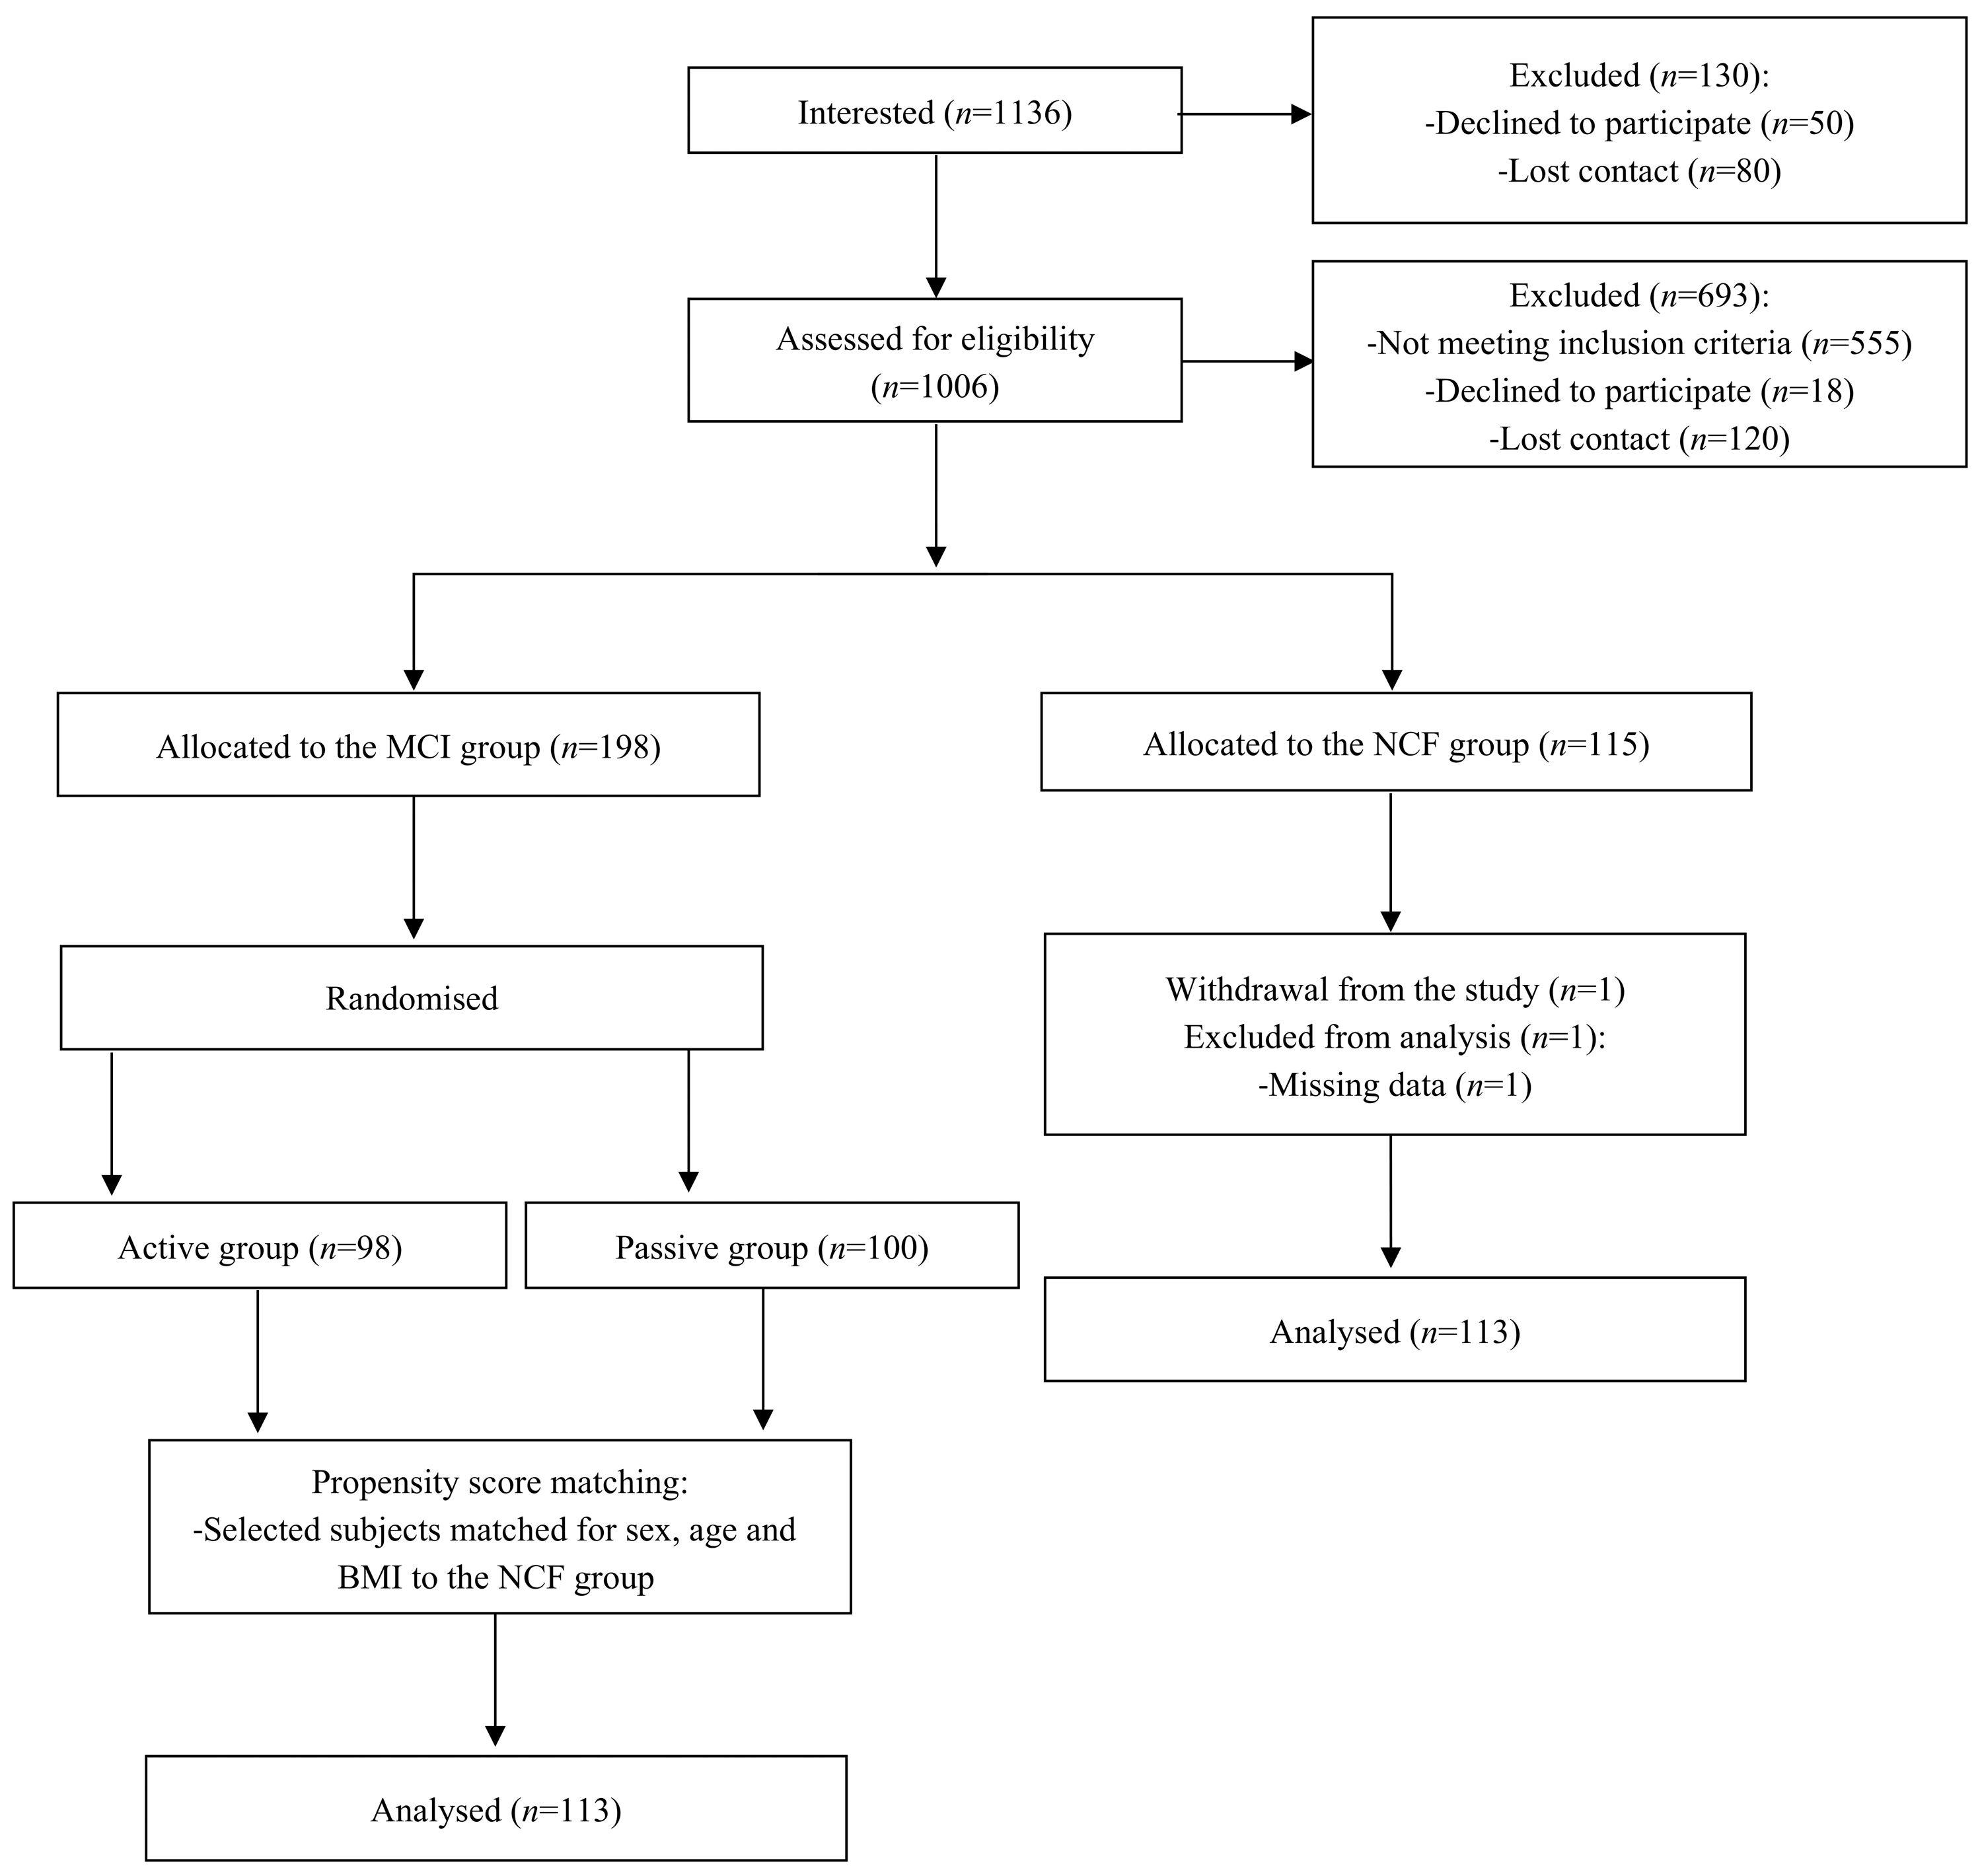
2.2. Study Population
2.3. Montreal Cognitive Assessment Scale
2.4. Hamilton Depression Rating Scale
2.5. Medical History Questionnaire
2.6. Anthropometric Parameters
2.7. Body Composition
2.8. Physical Activity
2.9. Blood Pressure
2.10. Biochemical Parameters
2.11. Sociodemographic Questionnaire
2.12. Minimum Sample Size Calculation
2.13. Statistical Analysis
3. Results
3.1. Comparison of Subjects with Normal Cognitive Function and Mild Cognitive Impairment
3.2. Comparison of Study Population According to the Montreal Cognitive Assessment Scale Tertiles
3.3. Association of Selected Variables with the Prevalence of Mild Cognitive Impairment
3.4. Correlations Between the Montreal Cognitive Assessment Scale Results and Selected Variables
3.5. Association of Selected Variables with Lactoferrin Levels
3.6. Correlations Between Lactoferrin Levels and Selected Variables
4. Discussion
5. Conclusions
Supplementary Materials
Author Contributions
Funding
Institutional Review Board Statement
Informed Consent Statement
Data Availability Statement
Conflicts of Interest
Abbreviations
| AD | Alzheimer’s disease |
| aMCI | Amnestic mild cognitive impairment |
| ATPIII | Adult Treatment Panel III |
| BMI | Body mass index |
| BP | Blood pressure |
| CI | Confidence interval |
| DBP | Diastolic blood pressure |
| FM | Fat mass |
| HAM-D | Hamilton depression rating scale |
| HDL-C | High-density lipoprotein cholesterol |
| HOMA-IR | Homeostatic model assessment of insulin resistance |
| hs-CRP | High-sensitivity C-reactive protein |
| LDL-C | Low-density lipoprotein cholesterol |
| LF | Lactoferrin |
| MCI | Mild cognitive impairment |
| MET | Metabolic equivalent task |
| MoCA | Montreal Cognitive Assessment |
| NCF | Normal cognitive function |
| OR | Odds ratio |
| Q1–Q3 | 25th–75th percentile |
| SBP | Systolic blood pressure |
| STROBE | Strengthening the Reporting of Observational Studies in Epidemiology |
| TC | Total cholesterol |
| TG | Triglycerides |
| VAT | Visceral adipose tissue |
| WHO | World Health Organization |
| WHR | Waist-to-hip ratio |
References
- World Health Organization Ageing Data Portal. Available online: https://platform.who.int/data/maternal-newborn-child-adolescent-ageing/ageing-data (accessed on 6 August 2023).
- Petersen, R.C.; Lopez, O.; Armstrong, M.J.; Getchius, T.S.D.; Ganguli, M.; Gloss, D.; Gronseth, G.S.; Marson, D.; Pringsheim, T.; Day, G.S.; et al. Practice Guideline Update Summary: Mild Cognitive Impairment: Report of the Guideline Development, Dissemination, and Implementation Subcommittee of the American Academy of Neurology. Neurology 2018, 90, 126–135. [Google Scholar] [CrossRef] [PubMed]
- Bai, W.; Chen, P.; Cai, H.; Zhang, Q.; Su, Z.; Cheung, T.; Jackson, T.; Sha, S.; Xiang, Y.T. Worldwide Prevalence of Mild Cognitive Impairment among Community Dwellers Aged 50 Years and Older: A Meta-Analysis and Systematic Review of Epidemiology Studies. Age Ageing 2022, 51, afac173. [Google Scholar] [CrossRef] [PubMed]
- Zhang, N.J.; Qian, Z.D.; Zeng, Y.B.; Gu, J.N.; Jin, Y.; Li, W.; Li, W.; Jin, Y. Incidence and Risk Factors Associated with Progression to Mild Cognitive Impairment among Middle-Aged and Older Adults. Eur. Rev. Med. Pharmacol. Sci. 2022, 26, 8852–8859. [Google Scholar] [CrossRef] [PubMed]
- PolSenior2. Badanie Poszczególnych Obszarów Stanu Zdrowia Osób Starszych, w Tym Jakości Życia Związanej Ze Zdrowiem [PolSenior2. Study of Specific Areas of the Health Status of Older People, Including Health-Related Quality of Life]; Błędowski, P., Grodzicki, T., Mossakowska, M., Zdrojewski, T., Eds.; Gdański Uniwersytet Medyczny: Gdańsk, Poland, 2021. [Google Scholar]
- Roberts, R.O.; Knopman, D.S.; Mielke, M.M.; Cha, R.H.; Pankratz, V.S.; Christianson, T.J.H.; Geda, Y.E.; Boeve, B.F.; Ivnik, R.J.; Tangalos, E.G.; et al. Higher Risk of Progression to Dementia in Mild Cognitive Impairment Cases Who Revert to Normal. Neurology 2014, 82, 317–325. [Google Scholar] [CrossRef]
- Boyle, P.A.; Wilson, R.S.; Aggarwal, N.T.; Tang, Y.; Bennett, D.A. Mild Cognitive Impairment: Risk of Alzheimer Disease and Rate of Cognitive Decline. Neurology 2006, 67, 441–445. [Google Scholar] [CrossRef]
- Legrand, D.; Pierce, A.; Elass, E.; Carpentier, M.; Mariller, C.; Mazurier, J. Lactoferrin Structure and Functions. Adv. Exp. Med. Biol. 2008, 606, 163–194. [Google Scholar] [CrossRef]
- Lönnerdal, B.; Iyer, S. Lactoferrin: Molecular Structure and Biological Function. Annu. Rev. Nutr. 1995, 15, 93–110. [Google Scholar] [CrossRef]
- Fillebeen, C.; Dexter, D.; Mitchell, V.; Benaissa, M.; Beauvillain, J.C.; Spik, G.; Pierce, A. Lactoferrin Is Synthesized by Mouse Brain Tissue and Its Expression Is Enhanced after MPTP Treatment. Adv. Exp. Med. Biol. 1998, 443, 293–300. [Google Scholar] [CrossRef]
- Ji, B.; Maeda, J.; Higuchi, M.; Inoue, K.; Akita, H.; Harashima, H.; Suhara, T. Pharmacokinetics and Brain Uptake of Lactoferrin in Rats. Life Sci. 2006, 78, 851–855. [Google Scholar] [CrossRef]
- Hu, K.; Li, J.; Shen, Y.; Lu, W.; Gao, X.; Zhang, Q.; Jiang, X. Lactoferrin-Conjugated PEG-PLA Nanoparticles with Improved Brain Delivery: In Vitro and in Vivo Evaluations. J. Control. Release 2009, 134, 55–61. [Google Scholar] [CrossRef]
- Mohamed, W.A.; Salama, R.M.; Schaalan, M.F. A Pilot Study on the Effect of Lactoferrin on Alzheimer’s Disease Pathological Sequelae: Impact of the p-Akt/PTEN Pathway. Biomed. Pharmacother. 2019, 111, 714–723. [Google Scholar] [CrossRef] [PubMed]
- Carro, E.; Bartolomé, F.; Bermejo-Pareja, F.; Villarejo-Galende, A.; Molina, J.A.; Ortiz, P.; Calero, M.; Rabano, A.; Cantero, J.L.; Orive, G. Early Diagnosis of Mild Cognitive Impairment and Alzheimer’s Disease Based on Salivary Lactoferrin. Alzheimers Dement 2017, 8, 131–138. [Google Scholar] [CrossRef]
- González-Sánchez, M.; Bartolome, F.; Antequera, D.; Puertas-Martín, V.; González, P.; Gómez-Grande, A.; Llamas-Velasco, S.; Herrero-San Martín, A.; Pérez-Martínez, D.; Villarejo-Galende, A.; et al. Decreased Salivary Lactoferrin Levels Are Specific to Alzheimer’s Disease. EBioMedicine 2020, 57, 102834. [Google Scholar] [CrossRef] [PubMed]
- Sawicka-Gutaj, N.; Gruszczyński, D.; Guzik, P.; Mostowska, A.; Walkowiak, J. Publication Ethics of Human Studies in the Light of the Declaration of Helsinki—A Mini-Review. JMS 2022, 91, e700. [Google Scholar] [CrossRef]
- von Elm, E.; Altman, D.G.; Egger, M.; Pocock, S.J.; Gøtzsche, P.C.; Vandenbroucke, J.P. The Strengthening the Reporting of Observational Studies in Epidemiology (STROBE) Statement: Guidelines for Reporting Observational Studies. J. Clin. Epidemiol. 2008, 61, 344–349. [Google Scholar] [CrossRef]
- Jamka, M.; Makarewicz, A.; Wasiewicz-Gajdzis, M.; Brylak, J.; Wielińska-Wiśniewska, H.; Pawlak, Z.; Nowak, J.K.; Herzig, K.-H.; Mądry, E.; Walkowiak, J. App-Assured Essential Physical Activity for the Prevention of Cognitive Decline: Changing Paradigms in Public Health—A Study Protocol for a Randomised Controlled Trial: A Study Protocol of the PA PROTECT Study. JMS 2021, 90, e530. [Google Scholar] [CrossRef]
- Nasreddine, Z.S.; Phillips, N.A.; Bédirian, V.; Charbonneau, S.; Whitehead, V.; Collin, I.; Cummings, J.L.; Chertkow, H. The Montreal Cognitive Assessment, MoCA: A Brief Screening Tool for Mild Cognitive Impairment. J. Am. Geriatr. Soc. 2005, 53, 695–699. [Google Scholar] [CrossRef]
- Hamilton, M. A Rating Scale for Depression. J. Neurol. Neurosurg. Psychiatry 1960, 23, 56–62. [Google Scholar] [CrossRef]
- Handbook of Psychiatric Measures; Rush, J., First, M., Blacker, D., Eds.; American Psychiatric Publishing Inc.: Arlington, MA, USA, 2008. [Google Scholar]
- World Health Organization. A Healthy Lifestyle—WHO Recommendations. Available online: https://www.who.int/europe/news-room/fact-sheets/item/a-healthy-lifestyle---who-recommendations (accessed on 1 April 2024).
- World Health Organization. Waist Circumference and Waist-Hip Ratio: Report of a WHO Expert Consultation; World Health Organization: Genewa, Switzerland, 2008. [Google Scholar]
- American Council on Exercise Percent Body Fat Calculator. Available online: https://www.acefitness.org/education-and-resources/lifestyle/tools-calculators/percent-body-fat-calculator/ (accessed on 16 November 2020).
- Biernat, E. International Physical Activity Questionnaire—Polish Long Version. Pol. J. Sport. Med. 2013, 29, 7. [Google Scholar]
- Hills, A.P.; Mokhtar, N.; Byrne, N.M. Assessment of Physical Activity and Energy Expenditure: An Overview of Objective Measures. Front. Nutr. 2014, 1, 5. [Google Scholar] [CrossRef]
- Mancia, G.; Kreutz, R.; Brunström, M.; Burnier, M.; Grassi, G.; Januszewicz, A.; Muiesan, M.L.; Tsioufis, K.; Agabiti-Rosei, E.; Algharably, E.A.E.; et al. 2023 ESH Guidelines for the Management of Arterial Hypertension The Task Force for the Management of Arterial Hypertension of the European Society of Hypertension Endorsed by the European Renal Association (ERA) and the International Society of Hypertension (ISH). J. Hypertens 2023, 41, 1874. [Google Scholar] [CrossRef] [PubMed]
- Elsayed, N.A.; Aleppo, G.; Aroda, V.R.; Bannuru, R.R.; Brown, F.M.; Bruemmer, D.; Collins, B.S.; Hilliard, M.E.; Isaacs, D.; Johnson, E.L.; et al. 2. Classification and Diagnosis of Diabetes: Standards of Care in Diabetes-2023. Diabetes Care 2023, 46, S19–S40. [Google Scholar] [CrossRef]
- Matthews, D.R.; Hosker, J.P.; Rudenski, A.S.; Naylor, B.A.; Treacher, D.F.; Turner, R.C. Homeostasis Model Assessment: Insulin Resistance and β-Cell Function from Fasting Plasma Glucose and Insulin Concentrations in Man. Diabetologia 1985, 28, 412–419. [Google Scholar] [CrossRef]
- Gayoso-Diz, P.; Otero-González, A.; Rodriguez-Alvarez, M.X.; Gude, F.; García, F.; De Francisco, A.; Quintela, A.G. Insulin Resistance (HOMA-IR) Cut-off Values and the Metabolic Syndrome in a General Adult Population: Effect of Gender and Age: EPIRCE Cross-Sectional Study. BMC Endocr. Disord. 2013, 13, 47. [Google Scholar] [CrossRef]
- National Cholesterol Education Program (NCEP) Expert Panel on Detection; Treatment Evaluation and Treatment of High Blood Cholesterol in Adults (Adult Treatment Panel III). Third Report of the National Cholesterol Education Program (NCEP) Expert Panel on Detection, Evaluation, and Treatment of High Blood Cholesterol in Adults (Adult Treatment Panel III) Final Report. Circulation 2002, 106, 3143–3421. [Google Scholar] [CrossRef]
- Myers, G.L.; Rifai, N.; Tracy, R.P.; Roberts, W.L.; Alexander, R.W.; Biasucci, L.M.; Catravas, J.D.; Cole, T.G.; Cooper, G.R.; Khan, B.V.; et al. CDC/AHA Workshop on Markers of Inflammation and Cardiovascular Disease: Application to Clinical and Public Health Practice: Report from the Laboratory Science Discussion Group. Circulation 2004, 110, e545–e549. [Google Scholar] [CrossRef]
- Gleerup, H.S.; Jensen, C.S.; Høgh, P.; Hasselbalch, S.G.; Simonsen, A.H. Lactoferrin in Cerebrospinal Fluid and Saliva Is Not a Diagnostic Biomarker for Alzheimer’s Disease in a Mixed Memory Clinic Population. EBioMedicine 2021, 67, 103361. [Google Scholar] [CrossRef]
- Antequera, D.; Carrero, L.; Gonzalez-Sanchez, M.; Cantero, J.; Orive, G.; Municio, C.; Carro, E. Reduced Salivary Lactoferrin Levels in Early-Onset Alzheimer’s Disease. Aging Dis. 2024, 15, 945–947. [Google Scholar] [CrossRef]
- Reseco, L.; Atienza, M.; Fernandez-Alvarez, M.; Carro, E.; Cantero, J.L. Salivary Lactoferrin Is Associated with Cortical Amyloid-Beta Load, Cortical Integrity, and Memory in Aging. Alzheimers Res. Ther. 2021, 13, 150. [Google Scholar] [CrossRef]
- Antequera, D.; Moneo, D.; Carrero, L.; Bartolome, F.; Ferrer, I.; Proctor, G.; Carro, E. Salivary Lactoferrin Expression in a Mouse Model of Alzheimer’s Disease. Front. Immunol. 2021, 12, 749468. [Google Scholar] [CrossRef]
- Nijakowski, K.; Owecki, W.; Jankowski, J.; Surdacka, A. Salivary Biomarkers for Alzheimer’s Disease: A Systematic Review with Meta-Analysis. Int. J. Mol. Sci. 2024, 25, 1168. [Google Scholar] [CrossRef] [PubMed]
- Prinz, M.; Priller, J. The Role of Peripheral Immune Cells in the CNS in Steady State and Disease. Nat. Neurosci. 2017, 20, 136–144. [Google Scholar] [CrossRef] [PubMed]
- Bermejo-Pareja, F.; del Ser, T.; Valentí, M.; de la Fuente, M.; Bartolome, F.; Carro, E. Salivary Lactoferrin as Biomarker for Alzheimer’s Disease: Brain-Immunity Interactions. Alzheimers Dement. 2020, 16, 1196–1204. [Google Scholar] [CrossRef] [PubMed]
- Kamer, A.R.; Dasanayake, A.P.; Craig, R.G.; Glodzik-Sobanska, L.; Bry, M.; De Leon, M.J. Alzheimer’s Disease and Peripheral Infections: The Possible Contribution from Periodontal Infections, Model and Hypothesis. J. Alzheimers Dis. 2008, 13, 437–449. [Google Scholar] [CrossRef]
- Sweeney, M.D.; Zhao, Z.; Montagne, A.; Nelson, A.R.; Zlokovic, B.V. Blood-Brain Barrier: From Physiology to Disease and Back. Physiol. Rev. 2019, 99, 21–78. [Google Scholar] [CrossRef]
- Abdelhamid, M.; Jung, C.G.; Zhou, C.; Abdullah, M.; Nakano, M.; Wakabayashi, H.; Abe, F.; Michikawa, M. Dietary Lactoferrin Supplementation Prevents Memory Impairment and Reduces Amyloid-β Generation in J20 Mice. J. Alzheimers Dis. 2020, 74, 245–259. [Google Scholar] [CrossRef]
- Guo, C.; Yang, Z.H.; Zhang, S.; Chai, R.; Xue, H.; Zhang, Y.H.; Li, J.Y.; Wang, Z.Y. Intranasal Lactoferrin Enhances α-Secretase-Dependent Amyloid Precursor Protein Processing via the ERK1/2-CREB and HIF-1α Pathways in an Alzheimer’s Disease Mouse Model. Neuropsychopharmacology 2017, 42, 2504–2515. [Google Scholar] [CrossRef]
- He, Q.; Zhang, L.L.; Li, D.; Wu, J.; Guo, Y.X.; Fan, J.; Wu, Q.; Wang, H.P.; Wan, Z.; Xu, J.Y.; et al. Lactoferrin Alleviates Western Diet-Induced Cognitive Impairment through the Microbiome-Gut-Brain Axis. Curr. Res. Food Sci. 2023, 7, 100533. [Google Scholar] [CrossRef]
- Ran, L.; Shi, J.; Lin, Y.; Xu, C.; Han, Z.; Tian, S.; Qin, X.; Li, Q.; Zhang, T.; Li, H.; et al. Evaluation of the Protective Bioactivity and Molecular Mechanism Verification of Lactoferrin in an Alzheimer’s Mouse Model with Ulcerative Enteritis. J. Dairy. Sci. 2024, 107, 8796–8810. [Google Scholar] [CrossRef]
- Zhou, H.H.; Wang, G.; Luo, L.; Ding, W.; Xu, J.Y.; Yu, Z.; Qin, L.Q.; Wan, Z. Dietary Lactoferrin Has Differential Effects on Gut Microbiota in Young versus Middle-Aged APPswe/PS1dE9 Transgenic Mice but No Effects on Cognitive Function. Food Nutr. Res. 2021, 65, 10-29219. [Google Scholar] [CrossRef]
- Herath, P.M.; Cherbuin, N.; Eramudugolla, R.; Anstey, K.J. The Effect of Diabetes Medication on Cognitive Function: Evidence from the PATH through Life Study. Biomed. Res. Int. 2016, 2016, 7208429. [Google Scholar] [CrossRef] [PubMed]
- Wennberg, A.M.V.; Hagen, C.E.; Edwards, K.; Roberts, R.O.; Machulda, M.M.; Knopman, D.S.; Petersen, R.C.; Mielke, M.M. Association of Antidiabetic Medication Use, Cognitive Decline, and Risk of Cognitive Impairment in Older People with Type 2 Diabetes: Results from the Population-Based Mayo Clinic Study of Aging. Int. J. Geriatr. Psychiatry 2018, 33, 1114–1120. [Google Scholar] [CrossRef] [PubMed]
- Jones, A.; Ali, M.U.; Kenny, M.; Mayhew, A.; Mokashi, V.; He, H.; Lin, S.; Yavari, E.; Paik, K.; Subramanian, D.; et al. Potentially Modifiable Risk Factors for Dementia and Mild Cognitive Impairment: An Umbrella Review and Meta-Analysis. Dement. Geriatr. Cogn. Disord. 2024, 53, 91–106. [Google Scholar] [CrossRef]
- Lao, Y.; Hou, L.; Li, J.; Hui, X.; Yan, P.; Yang, K. Association between Alcohol Intake, Mild Cognitive Impairment and Progression to Dementia: A Dose-Response Meta-Analysis. Aging Clin. Exp. Res. 2021, 33, 1175–1185. [Google Scholar] [CrossRef]
- Chen, M.; Hu, C.; Dong, H.; Yan, H.; Wu, P. A History of Cigarette Smoking Is Associated with Faster Functional Decline and Reduction of Entorhinal Cortex Volume in Mild Cognitive Impairment. Aging 2021, 13, 6205–6213. [Google Scholar] [CrossRef]
- Sofi, F.; Valecchi, D.; Bacci, D.; Abbate, R.; Gensini, G.F.; Casini, A.; Macchi, C. Physical Activity and Risk of Cognitive Decline: A Meta-Analysis of Prospective Studies. J. Intern. Med. 2011, 269, 107–117. [Google Scholar] [CrossRef]
- Makarewicz, A.; Jamka, M.; Wasiewicz-Gajdzis, M.; Bajerska, J.; Miśkiewicz-Chotnicka, A.; Kwiecień, J.; Lisowska, A.; Gagnon, D.; Herzig, K.H.; Mądry, E.; et al. Comparison of Subjective and Objective Methods to Measure the Physical Activity of Non-Depressed Middle-Aged Healthy Subjects with Normal Cognitive Function and Mild Cognitive Impairment—A Cross-Sectional Study. Int. J. Env. Res. Public. Health 2021, 18, 8042. [Google Scholar] [CrossRef]
- Martin, R.C.; Gerstenecker, A.; Triebel, K.L.; Falola, M.; McPherson, T.; Cutter, G.; Marson, D.C. Declining Financial Capacity in Mild Cognitive Impairment: A Six-Year Longitudinal Study. Arch. Clin. Neuropsychol. 2019, 34, 152–161. [Google Scholar] [CrossRef] [PubMed]
- Mimmack, K.J.; Sprague, E.H.; Amariglio, R.E.; Vannini, P.; Marshall, G.A. Longitudinal Evolution of Financial Capacity and Cerebral Tau and Amyloid Burden in Older Adults with Normal Cognition or Mild Cognitive Impairment. J. Prev. Alzheimers Dis. 2024, 11, 966–974. [Google Scholar] [CrossRef]
- Zhang, J.; Feng, Y.; Zhang, X.; Wang, J.; Cheng, H.; Wang, Y.; Wang, J. Association of Low Socioeconomic Status with Cognitive Decline among Older Persons in Underdeveloped Areas in China—A Data Analysis of the Gansu Aging Study. BMC Geriatr. 2024, 24, 908. [Google Scholar] [CrossRef]
- Klee, M.; Leist, A.K.; Veldsman, M.; Ranson, J.M.; Llewellyn, D.J. Socioeconomic Deprivation, Genetic Risk, and Incident Dementia. Am. J. Prev. Med. 2023, 64, 621–630. [Google Scholar] [CrossRef] [PubMed]
- Ong, K.L.; Morris, M.J.; McClelland, R.L.; Hughes, T.M.; Maniam, J.; Fitzpatrick, A.L.; Martin, S.S.; Luchsinger, J.A.; Rapp, S.R.; Hayden, K.M.; et al. Relationship of Lipids and Lipid-Lowering Medications with Cognitive Function: The Multi-Ethnic Study of Atherosclerosis. Am. J. Epidemiol. 2018, 187, 767–776. [Google Scholar] [CrossRef]
- Power, M.C.; Rawlings, A.; Sharrett, A.R.; Bandeen-Roche, K.; Coresh, J.; Ballantyne, C.M.; Pokharel, Y.; Michos, E.D.; Penman, A.; Alonso, A.; et al. Association of Midlife Lipids with 20-Year Cognitive Change: A Cohort Study. Alzheimers Dement. 2018, 14, 167–177. [Google Scholar] [CrossRef]
- Reynolds, C.A.; Gatz, M.; Prince, J.A.; Berg, S.; Pedersen, N.L. Serum Lipid Levels and Cognitive Change in Late Life. J. Am. Geriatr. Soc. 2010, 58, 501–509. [Google Scholar] [CrossRef] [PubMed]
- Ancelin, M.L.; Ripoche, E.; Dupuy, A.M.; Barberger-Gateau, P.; Auriacombe, S.; Rouaud, O.; Berr, C.; Carrière, I.; Ritchie, K. Sex Differences in the Associations between Lipid Levels and Incident Dementia. J. Alzheimers Dis. 2013, 34, 519–528. [Google Scholar] [CrossRef] [PubMed]
- Qu, Y.; Hu, H.Y.; Ou, Y.N.; Shen, X.N.; Xu, W.; Wang, Z.T.; Dong, Q.; Tan, L.; Yu, J.T. Association of Body Mass Index with Risk of Cognitive Impairment and Dementia: A Systematic Review and Meta-Analysis of Prospective Studies. Neurosci. Biobehav. Rev. 2020, 115, 189–198. [Google Scholar] [CrossRef]
- Hovens, I.B.; Dalenberg, J.R.; Small, D.M. A Brief Neuropsychological Battery for Measuring Cognitive Functions Associated with Obesity. Obesity 2019, 27, 1988–1996. [Google Scholar] [CrossRef]
- Jamka, M.; Krzyżanowska-Jankowska, P.; Mądry, E.; Lisowska, A.; Bogdański, P.; Walkowiak, J. No Difference in Lactoferrin Levels between Metabolically Healthy and Unhealthy Obese Women. Nutrients 2019, 11, 1976. [Google Scholar] [CrossRef]
- Gong, L.; Sun, J.; Cong, S. Levels of Iron and Iron-Related Proteins in Alzheimer’s Disease: A Systematic Review and Meta-Analysis. J. Trace Elem. Med. Biol. 2023, 80, 127304. [Google Scholar] [CrossRef]
- Steffens, D.C. Depressive Symptoms and Mild Cognitive Impairment in the Elderly: An Ominous Combination. Biol. Psychiatry 2012, 71, 762–764. [Google Scholar] [CrossRef]
- Lin, J.S.; O’Connor, E.; Rossom, C.; Perdue, L.A.; Eckstrom, E. Screening for Cognitive Impairment in Older Adults: A Systematic Review for the U.S. Preventive Services Task Force. Ann. Intern. Med. 2013, 159, 601–612. [Google Scholar] [CrossRef] [PubMed]
- Roalf, D.R.; Moberg, P.J.; Xie, S.X.; Wolk, D.A.; Moelter, S.T.; Arnold, S.E. Comparative Accuracies of Two Common Screening Instruments for Classification of Alzheimer’s Disease, Mild Cognitive Impairment, and Healthy Aging. Alzheimers Dement. 2013, 9, 529–537. [Google Scholar] [CrossRef] [PubMed]
- Gillum, T.; Kuennen, M.; McKenna, Z.; Castillo, M.; Jordan-Patterson, A.; Bohnert, C. Exercise Increases Lactoferrin, but Decreases Lysozyme in Salivary Granulocytes. Eur. J. Appl. Physiol. 2017, 117, 1047–1051. [Google Scholar] [CrossRef] [PubMed]
- Heerman, W.J.; Bennett, W.L.; Kraschnewski, J.L.; Nauman, E.; Staiano, A.E.; Wallston, K.A. Willingness to Participate in Weight-Related Research as Reported by Patients in PCORnet Clinical Data Research Networks. BMC Obes. 2018, 5, 10. [Google Scholar] [CrossRef]

| Median (Q1–Q3) | p | |||
|---|---|---|---|---|
| Total (n = 226) | NCF (n = 113) | MCI (n = 113) | ||
| Age [years] | 56 (53–61) | 56 (53–61) | 56 (52–61) | 0.6449 |
| BMI [kg/m2] | 27.33 (24.14–31.40) | 27.51 (23.53–32.88) | 27.05 (24.49–30.00) | 0.6744 |
| Waist circumference [cm] | 93 (84–103) | 93 (80–106) | 93 (85–100) | 0.8980 |
| Hip circumference [cm] | 105 (100–113) | 105.5 (99–118) | 105 (101–112) | 0.6157 |
| WHR | 0.87 (0.81–0.91) | 0.86 (0.80–0.91) | 0.87 (0.82–0.91) | 0.2827 |
| FM [%] | 37.8 (32.2–42.5) | 37 (31.1–42.6) | 39.1 (33.9–42.1) | 0.2470 |
| VAT [g] | 632 (410–896) | 610 (385–934) | 640 (463–809) | 0.9675 |
| n (%) | p | ||||
|---|---|---|---|---|---|
| Total (n = 226) | NCF (n = 113) | MCI (n = 113) | |||
| Sex | Women | 179 (79.20%) | 88 (77.88%) | 91 (80.53%) | 0.6229 |
| Men | 47 (20.80%) | 25 (22.12%) | 22 (19.47%) | ||
| Place of residence | Village | 47 (20.80%) | 21 (18.58%) | 26 (23.01%) | 0.1521 |
| City < 50,000 inhabitants | 22 (9.73%) | 7 (6.20%) | 15 (13.27%) | ||
| City of 50,000–500,000 inhabitants | 18 (7.96%) | 8 (7.08%) | 10 (8.85%) | ||
| City > 500,000 inhabitants | 139 (61.50%) | 77 (68.14%) | 62 (54.87%) | ||
| Education | Vocational | 4 (1.77%) | 1 (0.89%) | 3 (2.65%) | 0.2832 |
| Secondary | 37 (16.37%) | 15 (13.27%) | 22 (19.47%) | ||
| High | 185 (81.86%) | 97 (85.84%) | 88 (77.88%) | ||
| Socio-occupational status | Employed | 199 (88.05%) | 96 (84.96%) | 103 (91.15%) | 0.3990 |
| Unemployed | 3 (1.33%) | 2 (1.77%) | 1 (0.88%) | ||
| Pensioner | 24 (10.62%) | 15 (12.27%) | 9 (7.97%) | ||
| Financial situation | Very good | 20 (8.85%) | 12 (10.62%) | 8 (7.08%) | 0.0990 |
| Good | 147 (65.05%) | 77 (68.14%) | 70 (61.95%) | ||
| Mediocre | 57 (25.22%) | 22 (19.47%) | 35 (30.97%) | ||
| Bad | 2 (0.88%) | 2 (1.77%) | 0 (0.00%) | ||
| Current smoking | Yes | 25 (11.06%) | 8 (7.08%) | 17 (15.04%) | 0.0563 |
| No | 201 (88.94%) | 105 (92.92%) | 96 (84.96%) | ||
| Past smoking | Yes | 84 (37.17%) | 33 (29.20%) | 51 (45.13%) | 0.0190 |
| No | 142 (62.83%) | 80 (70.80%) | 62 (54.87%) | ||
| Alcohol consumption | Yes | 145 (64.16%) | 62 (54.87%) | 83 (73.45%) | 0.0036 |
| No | 81 (35.84%) | 51 (45.13%) | 30 (26.55%) | ||
| Antihypertensive drugs | Yes | 69 (30.53%) | 32 (28.32%) | 37 (32.74%) | 0.4702 |
| No | 157 (67.47%) | 81 (71.68%) | 76 (67.26%) | ||
| Hypolipidemic drugs | Yes | 27 (11.95%) | 13 (11.50%) | 14 (12.39%) | 0.8375 |
| No | 199 (88.05%) | 100 (88.50%) | 99 (87.61%) | ||
| Hypoglycaemic drugs | Yes | 18 (7.97%) | 4 (3.54%) | 14 (12.39%) | 0.0140 |
| No | 208 (92.03%) | 109 (96.46%) | 99 (87.61%) | ||
| Hypothyroidism drugs | Yes | 36 (15.93%) | 23 (20.35%) | 13 (11.50%) | 0.0691 |
| No | 190 (84.07%) | 90 (79.65%) | 100 (88.50%) | ||
| Hormone replacement therapy 1 | Yes | 10 (5.59%) | 5 (5.68%) | 5 (5.49%) | 1.0000 |
| No | 169 (94.41%) | 83 (94.32%) | 86 (94.51%) | ||
| Median (Q1–Q3) | p | |||
|---|---|---|---|---|
| Total (n = 226) | NCF (n = 113) | MCI (n = 113) | ||
| Moderate activity [MET-min/day] | 152 (64–312) | 167 (69–313) | 137 (58–283) | 0.5778 |
| Moderate activity [min/day] | 46 (20–86) | 51 (21–86) | 39 (19–86) | 0.4921 |
| Vigorous activity [MET-min/day] | 0 (0–0) | 0 (0–11) | 0 (0–0) | 0.0223 |
| Vigorous activity [min/day] | 0 (0–0) | 0 (0–1) | 0 (0–0) | 0.0133 |
| Sedentary behaviour [min/day] | 446 (300–549) | 411 (300–514) | 463 (343–557) | 0.2185 |
| Total physical activity [MET-min/day] | 328 (190–537) | 356 (218–551) | 292 (162–499) | 0.0779 |
| Total physical activity [min/day] | 95 (56–154) | 101 (60–163) | 90 (46–143) | 0.1097 |
| Energy expenditure associated with activity [kcal/day] | 420 (229–681) | 490 (285–717) | 393 (201–632) | 0.0287 |
| Median (Q1–Q3) | p | |||
|---|---|---|---|---|
| Total (n = 226) | NCF (n = 113) | MCI (n = 113) | ||
| SBP [mmHg] 1 | 127 (116–141) | 127 (115–140) | 125 (117–142) | 0.8448 |
| DBP [mmHg] 1 | 80 (73–87) | 80 (72–86) | 80 (73–88) | 0.8645 |
| Glucose [mg/dL] | 94 (88–101) | 94 (88–101) | 94 (89–101) | 0.5832 |
| Insulin [µIU/mL] | 6.4 (4.6–9.3) | 6.3 (4.9–10) | 6.6 (4.4–9.1) | 0.7640 |
| HOMA-IR | 1.52 (1.09–2.26) | 1.52 (1.11–2.35) | 1.55 (1.04–2.16) | 0.9780 |
| TC [mg/dL] | 214 (189–237) | 213 (193–237) | 216 (189–237) | 0.9619 |
| HDL-C [mg/dL] | 57 (47–64) | 56 (46–65) | 58 (47–64) | 0.5735 |
| LDL-C [mg/dL] | 133 (113–156) | 133 (114–157) | 133 (111–153) | 0.8843 |
| TG [mg/dL] | 101 (74–142) | 103 (80–143) | 100 (73–138) | 0.5758 |
| hsCRP [mg/L] | 1.15 (0.58–2.54) | 1.15 (0.57–2.55) | 1.15 (0.58–2.14) | 0.7687 |
| LF [ng/mL] | 195.8 (147.2–269.6) | 224.4 (167.0–294.0) | 172.8 (127.3–223.2) | <0.0001 |
| I MOCA ≤ 25 (n = 73) | II MOCA: 26–27 (n = 77) | III MOCA ≥ 28 (n = 76) | p | p Trend | ||
|---|---|---|---|---|---|---|
| n (%) | ||||||
| Sex | Women | 60 (82.19%) | 58 (75.32%) | 61 (80.26%) | 0.5624 | 0.7811 |
| Men | 13 (17.81%) | 19 (24.68%) | 15 (19.74%) | |||
| Place of residence | Village | 20 (27.40%) | 12 (15.58%) | 15 (19.74%) | 0.6471 | - |
| City < 50,000 inhabitants | 8 (10.96%) | 7 (9.09%) | 7 (9.21%) | |||
| City of 50,000–500,000 inhabitants | 6 (8.22%) | 7 (9.09%) | 5 (6.58%) | |||
| City > 500,000 inhabitants | 39 (53.42%) | 51 (66.24%) | 49 (64.47%) | |||
| Education | Vocational | 2 (2.74%) | 1 (1.30%) | 1 (1.32%) | 0.0041 1 | - |
| Secondary | 20 (27.40%) | 5 (6.49%) | 12 (15.79%) | |||
| High | 51 (69.86%) | 71 (92.21%) | 63 (82.89%) | |||
| Socio-occupational status | Employed | 66 (90.41%) | 70 (90.90%) | 63 (82.90%) | 0.4141 | - |
| Unemployed | 1 (1.37%) | 0 (0.00%) | 2 (2.63%) | |||
| Pensioner | 6 (8.22%) | 7 (9.10%) | 11 (14.47%) | |||
| Financial situation | Very good | 2 (2.74%) | 10 (12.99%) | 8 (10.53%) | 0.0082 2 | - |
| Good | 43 (58.90%) | 52 (67.53%) | 52 (68.42%) | |||
| Mediocre | 28 (38.36%) | 15 (19.48%) | 14 (18.42%) | |||
| Bad | 0 (0.00%) | 0 (0.00%) | 2 (2.63%) | |||
| Current smoking | Yes | 9 (12.33%) | 11 (14.29%) | 5 (6.58%) | 0.2887 | 0.2578 |
| No | 64 (87.67%) | 66 (85.71%) | 71 (93.42%) | |||
| Past smoking | Yes | 32 (43.84%) | 30 (38.96%) | 22 (28.95%) | 0.1576 | 0.0594 |
| No | 41 (56.16%) | 47 (61.04%) | 54 (71.05%) | |||
| Alcohol consumption | Yes | 54 (73.97%) | 47 (61.04%) | 44 (57.90%) | 0.0963 | 0.0416 |
| No | 19 (26.03%) | 30 (38.96%) | 32 (42.10%) | |||
| Antihypertensive drugs | Yes | 25 (34.25%) | 19 (24.68%) | 25 (32.89%) | 0.3828 | 0.8706 |
| No | 48 (65.75%) | 58 (75.32%) | 51 (67.11%) | |||
| Hypolipidemic drugs | Yes | 9 (12.33%) | 10 (12.99%) | 8 (10.53%) | 0.8891 | 0.7315 |
| No | 64 (87.67%) | 67 (87.01%) | 68 (89.47%) | |||
| Hypoglycaemic drugs | Yes | 10 (13.70%) | 4 (5.19%) | 4 (5.26%) | 0.0891 | 0.0590 |
| No | 63 (86.30%) | 73 (94.81%) | 72 (94.74%) | |||
| Hypothyroidism drugs | Yes | 11 (15.07%) | 9 (11.69%) | 16 (21.05%) | 0.2775 | 0.3113 |
| No | 62 (84.93%) | 68 (88.31%) | 60 (78.95%) | |||
| Hormone replacementtherapy 3 | Yes | 3 (5.00%) | 3 (5.17%) | 4 (6.56%) | 1.0000 | 0.7086 |
| No | 57 (95.00%) | 55 (94.83%) | 57 (93.44%) | |||
| Moderate activity [MET-min/day] | 120 (51–270) | 158 (74–360) | 152 (76–273) | 0.4300 | 0.3302 | |
| Moderate activity [min/day] | 34 (17–73) | 51 (26–94) | 48 (26–86) | 0.2779 | 0.1072 | |
| Vigorous activity [MET-min/day] | 0 (0–0) | 0 (0–0) | 0 (0–9) | 0.1610 | 0.0585 | |
| Vigorous activity [min/day] | 0 (0–0) | 0 (0–0) | 0 (0–1) | 0.1568 | 0.0604 | |
| Sedentary behaviour [min/day] | 450 (343–540) | 480 (369–600) | 388 (283–491) | 0.0109 4 | 0.0373 | |
| Total physical activity [MET-min/day] | 260 (139–464) | 355 (221–566) | 359 (217–575) | 0.0304 5 | 0.0163 | |
| Total physical activity [min/day] | 72 (43–131) | 101 (59–163) | 104 (61–163) | 0.0308 6 | 0.0148 | |
| Energy expenditure associated with activity [kcal/day] | 343 (188–553) | 451 (279–695) | 487 (274–721) | 0.0170 7 | 0.0070 | |
| Age [years] | 57 (53–61) | 56 (52–62) | 56 (53–60) | 0.8874 | 0.6778 | |
| BMI [kg/m2] | 27.34 (24.86–30.82) | 26.70 (24.13–31.14) | 27.92 (22.92–32.44) | 0.8331 | 0.9717 | |
| Waist circumference [cm] | 93 (87–98) | 91 (83–104) | 93 (80–105) | 0.9945 | 0.8899 | |
| Hip circumference [cm] | 106 (101–113) | 105 (99–113) | 106 (100–116) | 0.8015 | 0.7195 | |
| WHR | 0.87 (0.81–0.91) | 0.86 (0.82–0.92) | 0.86 (0.79–0.91) | 0.4779 | 0.3307 | |
| FM [%] | 39.3 (33.9–42.3) | 37.2 (32.3–41.7) | 36.7 (31.1–42.6) | 0.5110 | 0.3174 | |
| VAT [g] | 637 (469–809) | 632 (420–905) | 595 (376–922) | 0.9719 | 0.8605 | |
| SBP [mmHg] 8 | 129 (119–144) | 125 (117–140) | 126 (114–138) | 0.4047 | 0.2210 | |
| DBP [mmHg] 8 | 80 (73–90) | 79 (73–87) | 79 (71–86) | 0.5820 | 0.3339 | |
| Glucose [mg/dL] | 93 (88–100) | 95 (89–101) | 93 (88–101) | 0.7681 | 0.7470 | |
| Insulin [µIU/mL] | 6.9 (5.1–9.5) | 6.4 (4.4–8.6) | 6.3 (5.1–9.5) | 0.6826 | 0.8284 | |
| HOMA-IR | 1.60 (1.10–2.27) | 1.53 (0.98–2.11) | 1.45 (1.11–2.31) | 0.7467 | 0.5969 | |
| TC [mg/dL] | 209 (185–234) | 218 (195–246) | 208 (193–229) | 0.1829 | 0.7771 | |
| HDL-C [mg/dL] | 57 (46–64) | 56 (48–64) | 56 (48–66) | 0.8344 | 0.5781 | |
| LDL-C [mg/dL] | 131 (105–153) | 136 (118–158) | 131 (113–155) | 0.2803 | 0.8393 | |
| TG [mg/dL] | 97 (73–138) | 111 (76–145) | 97 (73–129) | 0.3606 | 0.7878 | |
| hsCRP [mg/L] | 1.17 (0.65–2.76) | 1.05 (0.51–1.86) | 1.18 (0.56–2.82) | 0.6956 | 0.9501 | |
| LF [ng/mL] | 183.5 (124.5–244.1) | 178.4 (143.8–271.0) | 219.0 (178.4–278.2) | 0.0189 9 | 0.0056 | |
| OR | 95% CI | p | |
|---|---|---|---|
| Sex 1 | 0.922 | 0.669–1.273 | 0.6321 |
| Place of residence 2 | 1.144 | 0.829–1.580 | 0.4132 |
| Education 3 | 0.762 | 0.539–1.076 | 0.1289 |
| Socio-occupational status 4 | 1.824 | 0.796–4.179 | 0.1554 |
| Financial situation 5 | 0.775 | 0.574–1.047 | 0.0973 |
| Current or past smoking 6 | 1.438 | 1.093–1.891 | 0.0095 |
| Alcohol consumption 6 | 1.509 | 1.141–1.994 | 0.0039 |
| Antihypertensive drugs 6 | 1.111 | 0.836–1.474 | 0.4704 |
| Hypolipidemic drugs 6 | 1.043 | 0.698–1.559 | 0.8375 |
| Hypoglycaemic drugs 6 | 1.963 | 1.108–3.478 | 0.0208 |
| Hypothyroidism drugs 6 | 0.713 | 0.493–1.031 | 0.0724 |
| Hormone replacement therapy 6 | 1.000 | 0.530–1.885 | 1.0000 |
| Total physical activity [min/day] | 0.997 | 0.994–0.999 | 0.0458 |
| Age [years] | 0.990 | 0.943–1.040 | 0.6981 |
| BMI [kg/m2] | 0.975 | 0.929–1.024 | 0.3174 |
| Waist circumference [cm] | 0.994 | 0.977–1.012 | 0.5089 |
| Hip circumference [cm] | 0.984 | 0.960–1.009 | 0.2155 |
| WHR | 1.616 | 0.097–28.866 | 0.7380 |
| FM [%] | 1.027 | 0.988–1.067 | 0.1709 |
| VAT [g] | 0.999 | 0.998–1.000 | 0.4198 |
| SBP [mmHg] | 1.002 | 0.987–1.016 | 0.8329 |
| DBP [mmHg] | 0.999 | 0.974–1.024 | 0.9362 |
| Glucose [mg/dL] | 1.008 | 0.986–1.030 | 0.4669 |
| Insulin [µIU/mL] | 0.990 | 0.964–1.017 | 0.4835 |
| HOMA-IR | 0.973 | 0.897–1.055 | 0.5073 |
| TC [mg/dL] | 0.999 | 0.992–1.006 | 0.8189 |
| HDL-C [mg/dL] | 1.001 | 0.982–1.021 | 0.8967 |
| LDL-C [mg/dL] | 0.999 | 0.992–1.007 | 0.7970 |
| TG [mg/dL] | 0.999 | 0.995–1.004 | 0.6999 |
| hsCRP [mg/L] | 0.992 | 0.910–1.082 | 0.8631 |
| LF [ng/mL] | 0.996 | 0.994–0.999 | 0.0113 |
| OR | 95% CI | p | |
|---|---|---|---|
| Financial situation 1 | 0.610 | 0.319–1.166 | 0.1350 |
| Current or past smoking 2 | 1.731 | 0.948–3.16 | 0.0741 |
| Alcohol consumption 2 | 2.031 | 1.116–3.696 | 0.0203 |
| Hypoglycaemic drugs 2 | 3.517 | 1.025–12.062 | 0.0455 |
| Hypothyroidism drugs 2 | 0.458 | 0.204–1.031 | 0.0593 |
| Total physical activity [min/day] | 0.997 | 0.994–1.001 | 0.1200 |
| LF [ng/mL] | 0.997 | 0.995–0.999 | 0.0382 |
| Total (n = 226) | NCF (n = 113) | MCI (n = 113) | ||||
|---|---|---|---|---|---|---|
| rho | p | rho | p | rho | p | |
| Age [years] | −0.0023 | 0.9723 | −0.0513 | 0.5897 | −0.0669 | 0.4814 |
| BMI [kg/m2] | 0.0032 | 0.9620 | −0.0473 | 0.6182 | −0.0651 | 0.4934 |
| Waist circumference [cm] | −0.0034 | 0.9596 | −0.0623 | 0.5121 | 0.0068 | 0.9429 |
| Hip circumference [cm] | 0.0115 | 0.8638 | −0.0094 | 0.9209 | −0.0598 | 0.5294 |
| WHR | −0.0590 | 0.3776 | −0.0881 | 0.3534 | 0.1066 | 0.2613 |
| FM [%] | −0.0753 | 0.2593 | 0.0342 | 0.7192 | −0.0594 | 0.5317 |
| VAT [g] | −0.0055 | 0.9342 | −0.0514 | 0.5888 | 0.0056 | 0.9534 |
| SBP [mmHg] 1 | −0.0746 | 0.2694 | −0.1189 | 0.2140 | −0.1373 | 0.1525 |
| DBP [mmHg] 1 | −0.0543 | 0.4216 | −0.1126 | 0.2393 | −0.1568 | 0.1018 |
| Moderate activity [MET-min/day] | 0.0391 | 0.5585 | −0.0364 | 0.7019 | 0.0635 | 0.5037 |
| Moderate activity [min/day] | 0.0585 | 0.3812 | −0.0203 | 0.8307 | 0.0895 | 0.3458 |
| Vigorous activity [MET-min/day] | 0.1202 | 0.0714 | −0.0337 | 0.7233 | −0.0234 | 0.8060 |
| Vigorous activity [min/day] | 0.1246 | 0.0616 | −0.0337 | 0.7233 | −0.0565 | 0.5518 |
| Sedentary behaviour [min/day] | −0.1256 | 0.0594 | −0.2194 | 0.0195 | 0.0130 | 0.8911 |
| Total physical activity [MET-min/day] | 0.1273 | 0.0559 | 0.0006 | 0.9951 | 0.1019 | 0.2830 |
| Total physical activity [min/day] | 0.1253 | 0.0600 | 0.0153 | 0.8721 | 0.1107 | 0.2433 |
| Energy expenditure associated with activity [kcal/day] | 0.1494 | 0.0247 | −0.0181 | 0.8489 | 0.1033 | 0.2762 |
| Glucose [mg/dL] | −0.0275 | 0.6808 | −0.0543 | 0.5678 | 0.0765 | 0.4207 |
| Insulin [µIU/mL] | −0.0139 | 0.8351 | −0.0335 | 0.7246 | −0.0877 | 0.3556 |
| HOMA-IR | −0.0331 | 0.6201 | −0.0584 | 0.5392 | −0.0757 | 0.4252 |
| TC [mg/dL] | 0.0422 | 0.5277 | −0.0181 | 0.8494 | 0.1708 | 0.0704 |
| HDL-C [mg/dL] | 0.0456 | 0.4947 | 0.2113 | 0.0246 | 0.1061 | 0.2633 |
| LDL-C [mg/dL] | 0.0306 | 0.6471 | −0.0446 | 0.6389 | 0.1328 | 0.1611 |
| TG [mg/dL] | 0.0052 | 0.9374 | −0.2010 | 0.0328 | 0.0671 | 0.4803 |
| hsCRP [mg/L] | 0.0249 | 0.7094 | 0.1052 | 0.2673 | −0.0725 | 0.4453 |
| LF [ng/mL] | 0.1997 | 0.0026 | −0.0622 | 0.5129 | −0.1900 | 0.0437 |
| β | SE of β | t | p | |
|---|---|---|---|---|
| Sex 1 | 0.0200 | 0.0668 | 0.2996 | 0.7647 |
| Place of residence 2 | −0.0441 | 0.0667 | −0.6600 | 0.5099 |
| Education 3 | 0.0830 | 0.0666 | 1.2468 | 0.2137 |
| Socio-occupational status 4 | 0.0152 | 0.0668 | 0.2274 | 0.8203 |
| Financial situation 5 | 0.0549 | 0.0667 | 0.8233 | 0.4112 |
| Current or past smoking 6 | −0.0434 | 0.0667 | −0.06508 | 0.5158 |
| Alcohol consumption 6 | −0.1231 | 0.0664 | −1.8571 | 0.0646 |
| Antihypertensive drugs 6 | 0.0396 | 0.0667 | 0.5925 | 0.5541 |
| Hypolipidemic drugs 6 | −0.0214 | 0.0668 | −0.3209 | 0.7486 |
| Hypoglycaemic drugs 6 | −0.0776 | 0.0666 | −1.1643 | 0.2455 |
| Hypothyroidism drugs 6 | −0.0305 | 0.0668 | −0.4596 | 0.6481 |
| Hormone replacement therapy 6 | −0.0166 | 0.0668 | −0.2491 | 0.8035 |
| Total physical activity [MET-min/day] | 0.0256 | 0.0668 | 0.3829 | 0.7021 |
| Total physical activity [min/day] | 0.0248 | 0.0668 | 0.3711 | 0.7109 |
| Moderate activity [MET-min/day] | −0.0016 | 0.0668 | −0.0244 | 0.9806 |
| Moderate activity [min/day] | 0.0188 | 0.0668 | 0.2810 | 0.7790 |
| Vigorous activity [MET-min/day] | −0.0087 | 0.0668 | −0.1308 | 0.8961 |
| Vigorous activity [min/day] | −0.0074 | 0.0668 | −0.1107 | 0.9119 |
| Sedentary behaviour [min/day] | −0.0055 | 0.0668 | −0.0829 | 0.9339 |
| Energy expenditure associated with activity [kcal/day] | 0.0473 | 0.0667 | 0.7096 | 0.4787 |
| Age [years] | 0.0379 | 0.0668 | 0.5681 | 0.5705 |
| BMI [kg/m2] | 0.1153 | 0.0664 | 1.7369 | 0.0838 |
| Waist circumference [cm] | 0.1087 | 0.0664 | 1.6371 | 0.1030 |
| Hip circumference [cm] | 0.1525 | 0.0660 | 2.3105 | 0.0218 |
| WHR | 0.0308 | 0.0668 | 0.4611 | 0.6452 |
| FM [%] | 0.1286 | 0.0663 | 1.9412 | 0.0535 |
| VAT [g] | 0.1435 | 0.0661 | 2.1709 | 0.0310 |
| SBP [mmHg] | −0.0194 | 0.0676 | −0.2869 | 0.7745 |
| DBP [mmHg] | 0.0213 | 0.0675 | 0.3156 | 0.7526 |
| Glucose [mg/dL] | 0.0210 | 0.0668 | 0.3149 | 0.7531 |
| Insulin [µIU/mL] | −0.0099 | 0.0668 | −0.1490 | 0.8816 |
| HOMA-IR | −0.0135 | 0.0668 | −0.2022 | 0.8399 |
| TC [mg/dL] | −0.1212 | 0.0663 | −1.8279 | 0.0689 |
| HDL-C [mg/dL] | −0.0706 | 0.0666 | −1.0586 | 0.2909 |
| LDL-C [mg/dL] | −0.0924 | 0.0665 | −1.3887 | 0.1663 |
| TG [mg/dL] | −0.0515 | 0.0667 | −0.7717 | 0.4411 |
| hsCRP [mg/L] | 0.0305 | 0.0668 | 0.4569 | 0.6482 |
| MOCA [points] | 0.1043 | 0.0665 | 1.5697 | 0.1179 |
| Group 7 | −0.1802 | 0.0657 | −2.7419 | 0.0066 |
| β | SE of β | t | p | |
|---|---|---|---|---|
| Model 1 | ||||
| Alcohol consumption 1 | −0.0872 | 0.0665 | −1.3123 | 0.1908 |
| BMI [kg/m2] | 0.0848 | 0.0664 | 1.2774 | 0.2028 |
| TC [mg/dL] | −0.1054 | 0.0663 | −1.5896 | 0.1133 |
| Group 2 | −0.1593 | 0.0666 | −2.3915 | 0.0176 |
| Model 2 | ||||
| Alcohol consumption 1 | −0.0909 | 0.0662 | −1.3738 | 0.1709 |
| Hip circumference [cm] | 0.1276 | 0.0656 | 1.9441 | 0.0531 |
| TC [mg/dL] | −0.1039 | 0.0656 | −1.5878 | 0.1138 |
| Group 2 | −0.1536 | 0.0664 | −2.314 | 0.0215 |
| Model 3 | ||||
| Alcohol consumption 1 | −0.0694 | 0.0665 | −1.0435 | 0.2979 |
| FM [%] | 0.1379 | 0.0655 | 2.1054 | 0.0364 |
| TC [mg/dL] | −0.1212 | 0.0648 | −1.8703 | 0.0627 |
| Group 2 | 0.1812 | 0.0664 | 2.7270 | 0.0069 |
| Model 4 | ||||
| Alcohol consumption 1 | −0.0928 | 0.0663 | −1.3997 | 0.1630 |
| VAT [g] | 0.1222 | 0.0659 | 1.8559 | 0.0648 |
| TC [mg/dL] | −0.1011 | 0.0658 | −1.5373 | 0.1256 |
| Group 2 | 0.1572 | 0.0663 | 2.3709 | 0.0186 |
| rho | p | |
|---|---|---|
| Age [years] | −0.0313 | 0.6399 |
| BMI [kg/m2] | 0.1628 | 0.0143 |
| Waist circumference [cm] | 0.1466 | 0.0276 |
| Hip circumference [cm] | 0.2191 | <0.0001 |
| WHR | −0.0199 | 0.7658 |
| FM [%] | 0.1400 | 0.0353 |
| VAT [g] | 0.1879 | 0.0046 |
| SBP [mmHg] 1 | 0.0151 | 0.8231 |
| DBP [mmHg] 1 | −0.0164 | 0.8085 |
| Moderate activity [MET-min/day] | 0.08667 | 0.3614 |
| Moderate activity [min/day] | 0.0131 | 0.8449 |
| Vigorous activity [MET-min/day] | 0.0068 | 0.9183 |
| Vigorous activity [min/day] | 0.1298 | 0.8462 |
| Sedentary behaviour [min/day] | −0.0329 | 0.6226 |
| Total physical activity [MET-min/day] | 0.0641 | 0.3372 |
| Total physical activity [min/day] | 0.0563 | 0.3991 |
| Energy expenditure associated with activity [kcal/day] | 0.1116 | 0.0941 |
| Glucose [mg/dL] | 0.0344 | 0.6074 |
| Insulin [µIU/mL] | 0.1407 | 0.0345 |
| HOMA-IR | 0.1280 | 0.0547 |
| TC [mg/dL] | −0.1155 | 0.0831 |
| HDL-C [mg/dL] | −0.0571 | 0.3928 |
| LDL-C [mg/dL] | −0.0815 | 0.2224 |
| TG [mg/dL] | 0.0350 | 0.6010 |
| hsCRP [mg/L] | 0.1081 | 0.1051 |
| MOCA [points] | 0.1997 | 0.0026 |
Disclaimer/Publisher’s Note: The statements, opinions and data contained in all publications are solely those of the individual author(s) and contributor(s) and not of MDPI and/or the editor(s). MDPI and/or the editor(s) disclaim responsibility for any injury to people or property resulting from any ideas, methods, instructions or products referred to in the content. |
© 2025 by the authors. Licensee MDPI, Basel, Switzerland. This article is an open access article distributed under the terms and conditions of the Creative Commons Attribution (CC BY) license (https://creativecommons.org/licenses/by/4.0/).
Share and Cite
Jamka, M.; Makarewicz-Bukowska, A.; Popek, J.; Krzyżanowska-Jankowska, P.; Wielińska-Wiśniewska, H.; Miśkiewicz-Chotnicka, A.; Kurek, S.; Walkowiak, J. Differences in Plasma Lactoferrin Concentrations Between Subjects with Normal Cognitive Function and Mild Cognitive Impairment: An Observational Study. Healthcare 2025, 13, 872. https://doi.org/10.3390/healthcare13080872
Jamka M, Makarewicz-Bukowska A, Popek J, Krzyżanowska-Jankowska P, Wielińska-Wiśniewska H, Miśkiewicz-Chotnicka A, Kurek S, Walkowiak J. Differences in Plasma Lactoferrin Concentrations Between Subjects with Normal Cognitive Function and Mild Cognitive Impairment: An Observational Study. Healthcare. 2025; 13(8):872. https://doi.org/10.3390/healthcare13080872
Chicago/Turabian StyleJamka, Małgorzata, Aleksandra Makarewicz-Bukowska, Joanna Popek, Patrycja Krzyżanowska-Jankowska, Hanna Wielińska-Wiśniewska, Anna Miśkiewicz-Chotnicka, Szymon Kurek, and Jarosław Walkowiak. 2025. "Differences in Plasma Lactoferrin Concentrations Between Subjects with Normal Cognitive Function and Mild Cognitive Impairment: An Observational Study" Healthcare 13, no. 8: 872. https://doi.org/10.3390/healthcare13080872
APA StyleJamka, M., Makarewicz-Bukowska, A., Popek, J., Krzyżanowska-Jankowska, P., Wielińska-Wiśniewska, H., Miśkiewicz-Chotnicka, A., Kurek, S., & Walkowiak, J. (2025). Differences in Plasma Lactoferrin Concentrations Between Subjects with Normal Cognitive Function and Mild Cognitive Impairment: An Observational Study. Healthcare, 13(8), 872. https://doi.org/10.3390/healthcare13080872