
Intended and Unintended Impacts of ‘4+7’ Volume-Based Drug Procurement on the Use of Drugs in China: A Natural Experimental Study

Abstract
1. Introduction
1.1. Overview of ‘4+7’ Volume-Based Drug Procurement in China
1.2. Original and Generic Drugs
1.3. City-Level and County-Level Hospitals
1.4. Literature Review Regarding the Impact of ‘4+7’ Volume-Based Drug Procurement on the Use of Drugs
1.5. Purpose and Hypotheses of This Study
2. Methods
2.1. Study Setting
2.2. Data Source
2.3. Sample Selection
- (1)
- The time period: The ‘4+7’ policy was implemented at the end of March 2019 in Xi’an, Shaanxi. Taking the influence of two additional policies into consideration, the Medical Service Price Reform in Shaanxi Province (April 2017), and the first-round CVBDP in Shaanxi Province (December 2019), this study delimited the time period from April 2017 to November 2019. Thus, 32 months were involved.
- (2)
- The scope of cities: according to the drug procurement order records in the SDACPP, this study contained 12 cities: Xi’an, Xianyang, Shangluo, Ankang, Baoji, Yanan, Yangling, Yulin, Hanzhong, Weinan, Tongchuan, and Hancheng. Xi’an was the pilot city.
- (3)
- The scope of healthcare institutions: we divided hospitals into city-level and county-level according to the SDACPP.
- (4)
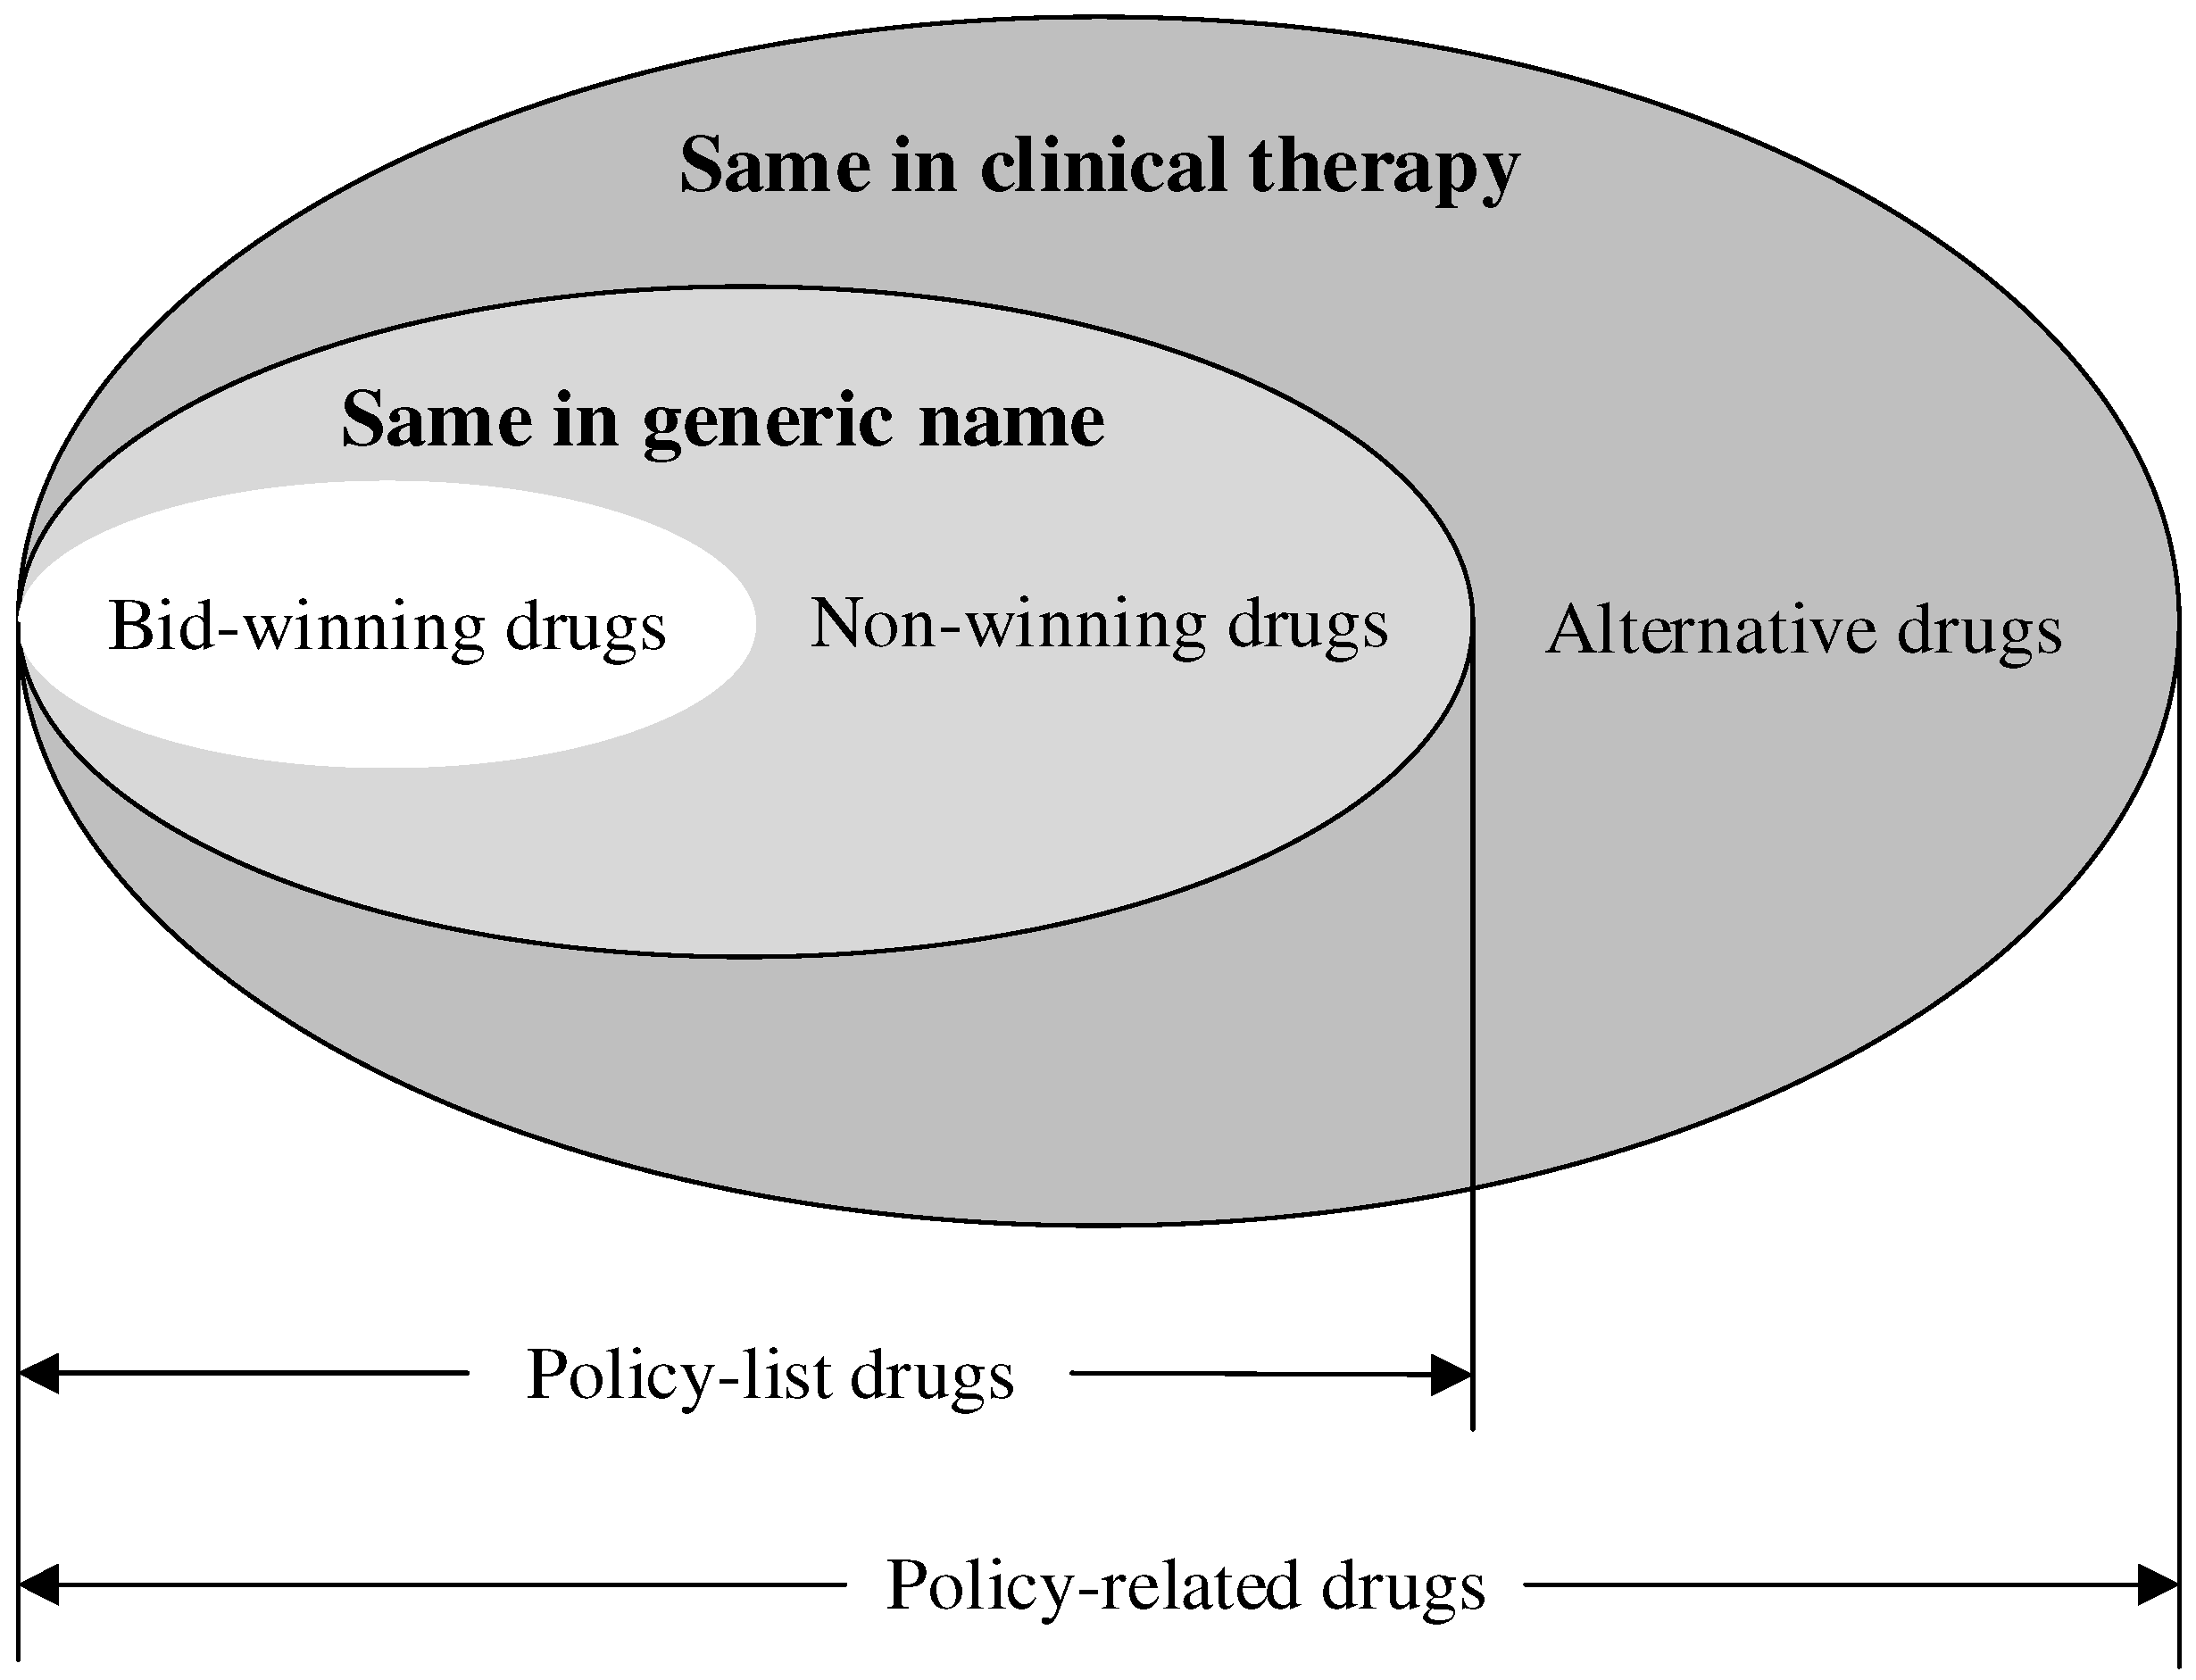
- The scope of drugs: Referring to previous studies [26,27,37], the ‘4+7’ policy-related drugs were analyzed in this study, containing the ‘4+7’ policy-list drugs and their alternative drugs. The ‘4+7’ policy-list drugs were 25 drugs (by generic name) in the ‘4+7’ procurement list, which were further divided into bid-winning drugs and non-winning drugs. Bid-winning drugs were products that won the tender, which were listed in the ‘4+7’ procurement bid-winning results [38]. Meanwhile, non-winning drugs were those with the same generic name but which lost the tender. The alternative drugs referred to the drugs that are clinically substitutable with the ‘4+7’ policy-list drugs, which were selected according to an official file [39]. Figure 1 indicates the relationship between each type of drug. All the drugs included in this study are listed in Table S1. In addition, all the drugs were classified into original and generic drugs.
2.4. Outcome Indicators
2.5. Explanatory and Control Variables
2.6. Statistical Analysis
3. Results
3.1. The Change in the Use of Drugs in the Pilot City Pre- and Post-‘4+7’ Policy
3.2. The Impact of the ‘4+7’ Policy on the Use of Drugs
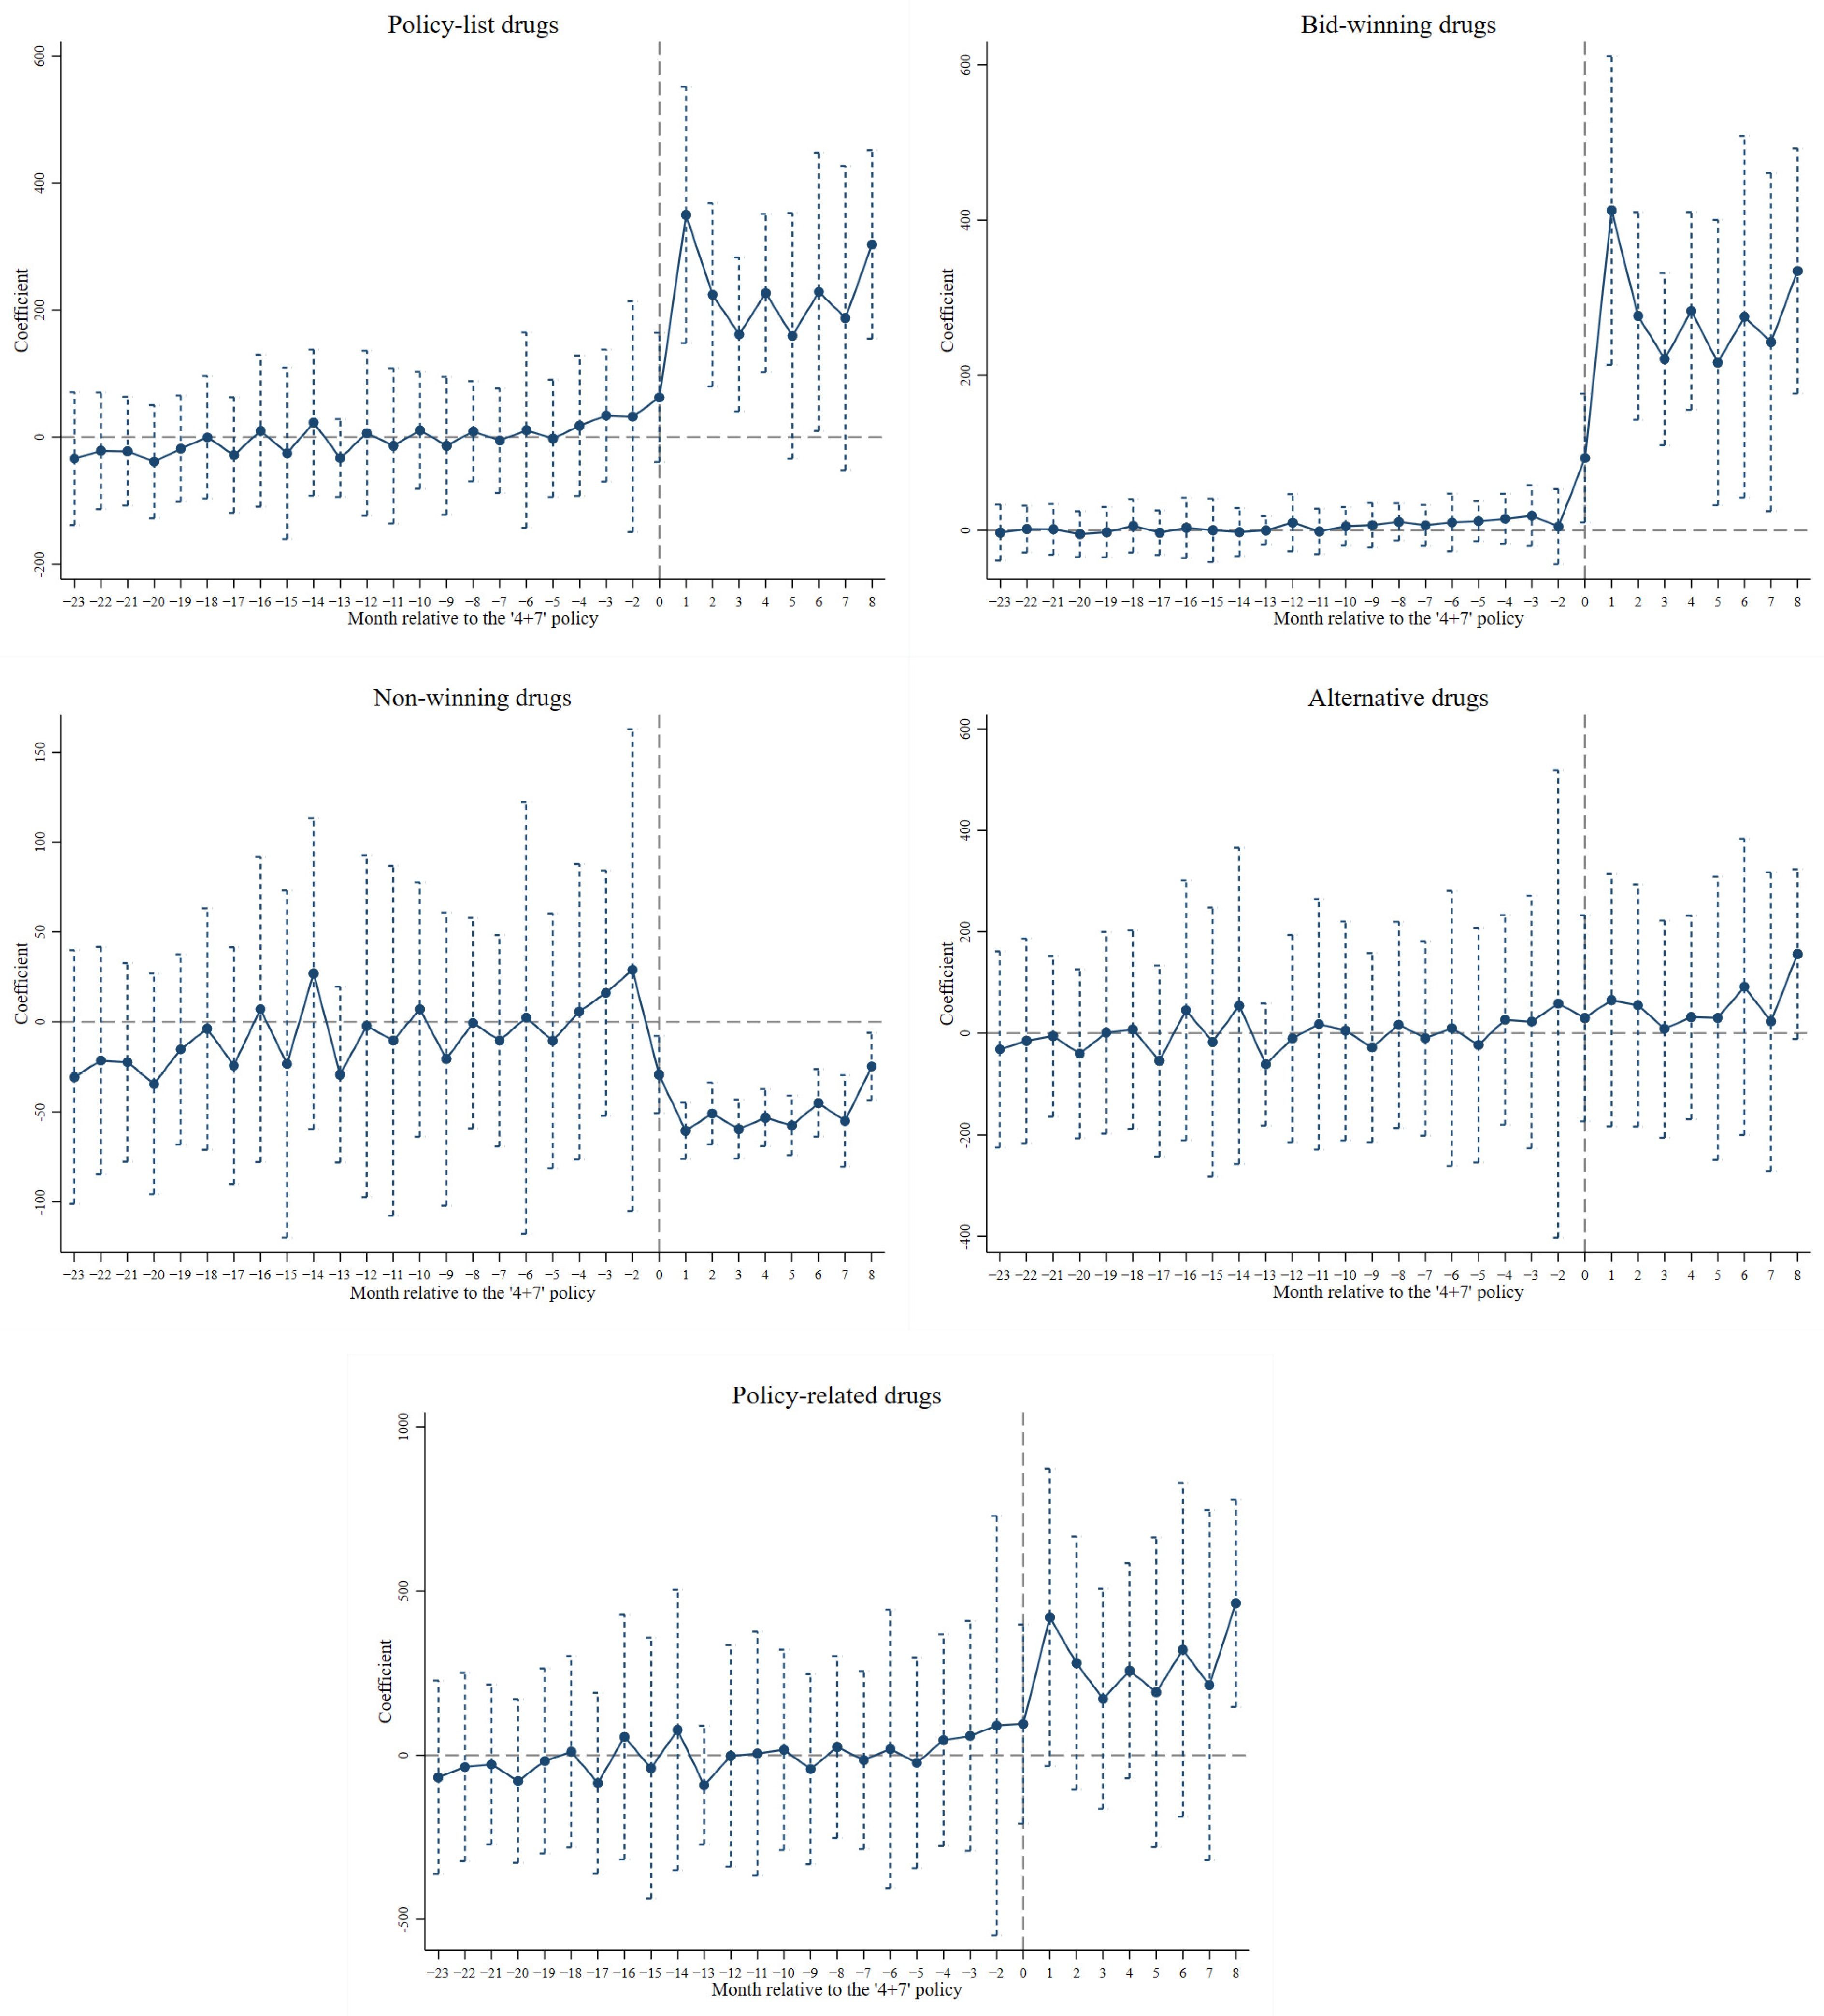
3.3. Parallel Trend Test and Placebo Test
4. Discussion
5. Conclusions
Supplementary Materials
Author Contributions
Funding
Institutional Review Board Statement
Informed Consent Statement
Data Availability Statement
Acknowledgments
Conflicts of Interest
Abbreviations
References
- Smith, R.D.; Correa, C.; Oh, C. Trade, TRIPS, and pharmaceuticals. Lancet 2009, 373, 684–691. [Google Scholar] [CrossRef] [PubMed]
- Zhang, Y.; Wan, Q.; Zhai, T.; Wang, C.; Guo, F.; Wei, Q.; Chai, P.; Zhao, Y. Results and Analysis of Chinese National Health Accounts in 2011. Chin. Health Econ. 2013, 32, 5–9. (In Chinese) [Google Scholar]
- Li, Y.; Zhang, Y.; Wan, Q.; Fu, X.; Zhai, T.; Chai, P.; Guo, F.; Wang, R.; Chen, C.; Li, T. Results and Analysis of Chinese National Health Accounts in 2020. Chin. Health Econ. 2022, 39, 2–6. (In Chinese) [Google Scholar]
- OECD. Pharmaceutical Spending (Indicator). Available online: https://data.oecd.org/healthres/pharmaceutical-spending.htm (accessed on 20 September 2024).
- Ess, S.M.; Schneeweiss, S.; Szucs, T.D. European Healthcare Policies for Controlling Drug Expenditure. PharmacoEconomics 2003, 21, 89–103. [Google Scholar]
- Fu, H.; Li, L.; Yip, W. Intended and unintended impacts of price changes for drugs and medical services: Evidence from China. Soc. Sci. Med. 2018, 211, 114–122. [Google Scholar]
- Wang, J.; Liu, X.; Wang, S.; Chen, H.; Wang, X.; Zhou, W.; Wang, L.; Zhu, Y.; Zheng, X.; Hao, M. Short-term differences in drug prices after implementation of the national essential medicines system: A case study in rural Jiangxi Province, China. Indian J. Pharmacol. 2015, 47, 535–539. [Google Scholar]
- Zhang, R.; Qiao, J.; Mao, Z.; Cui, D. A review on the current situation of centralized drug procurement in China’s public medical institutions. Chin. J. Pharmacoepidemiol. 2019, 28, 199–204. (In Chinese) [Google Scholar]
- Fu, H.; Chen, X.; Zhang, X.; He, C. The analysis of key problems and countermeasure about drug centralized procurement. Health Econ. Res. 2015, 9, 7–9. (In Chinese) [Google Scholar]
- Gabriel, S.; Rifat, A. Do changes to supply chains and procurement processes yield cost savings and improve availability of pharmaceuticals, vaccines or health products? A systematic review of evidence from low-income and middle-income countries. BMJ Glob. Health 2017, 2, e000243. [Google Scholar]
- General Office of the State Council of the People’s Republic of China. Pilot Program for National Centralized Drug Procurement and Use. Available online: https://www.gov.cn/zhengce/content/2019-01/17/content_5358604.htm (accessed on 10 September 2024).
- Wen, X.; Yin, S.; Cui, L.; Mao, L.; Lin, Z.; Yaermaimaiti, Z.; Geng, X.; Li, Y.; Yang, Y.; Cui, D.; et al. The Effects of the National Centralized Drug Purchasing Pilot Program on Nucleos(t)ide Analogs in Shenzhen City: An Interrupted Time Series Analysis. Front. Public Health 2021, 9, 718013. [Google Scholar]
- Joint Procurement Office. Notice on the Results of the Selection of Centralized Drug Procurement in 4+7 Cities. Available online: https://www.smpaa.cn/gjsdcg/2018/12/17/8580.shtml (accessed on 10 September 2024).
- Bian, Z.; Chen, S.; Cheng, C.; Wang, J.; Xiao, H.; Qin, H. Developing new drugs from annals of Chinese medicine. Acta Pharm. Sin. B 2012, 2, 1–7. [Google Scholar] [CrossRef]
- Dunne, S.; Shannon, B.; Dunne, C.; Cullen, W. A review of the differences and similarities between generic drugs and their originator counterparts, including economic benefits associated with usage of generic medicines, using Ireland as a case study. BMC Pharmacol. Toxicol. 2013, 14, 1. [Google Scholar] [CrossRef]
- Jalali, R.K.; Rasaily, D. Chapter 20—Generic Drug and Bioequivalence Studies. In Pharmaceutical Medicine and Translational Clinical Research; Vohora, D., Singh, G., Eds.; Academic Press: Boston, MA, USA, 2018; pp. 327–339. [Google Scholar]
- Dunne, S.S.; Dunne, C.P. What do people really think of generic medicines? A systematic review and critical appraisal of literature on stakeholder perceptions of generic drugs. BMC Med. 2015, 13, 173. [Google Scholar] [CrossRef]
- Chen, Y.; Yin, Z.; Xie, Q. Suggestions to ameliorate the inequity in urban/rural allocation of healthcare resources in China. Int. J. Equity Health 2014, 13, 34. [Google Scholar] [CrossRef] [PubMed]
- Oladipo, J.A. Utilization of health care services in rural and urban areas: A determinant factor in planning and managing health care delivery systems. Afr. Health Sci. 2014, 14, 322–333. [Google Scholar] [CrossRef]
- Babitsch, B.; Gohl, D.; von Lengerke, T. Re-revisiting Andersen’s Behavioral Model of Health Services Use: A systematic review of studies from 1998–2011. Psycho-Soc. Med. 2012, 9, Doc11. [Google Scholar]
- Cai, J.; Coyte, P.C.; Zhao, H. Decomposing the causes of socioeconomic-related health inequality among urban and rural populations in China: A new decomposition approach. Int. J. Equity Health 2017, 16, 128. [Google Scholar] [CrossRef]
- Zhao, D.; Zhou, Z.; Shen, C.; Nawaz, R.; Li, D.; Ren, Y.; Zhao, Y.; Cao, D.; Zhai, X. Rural and urban differences in patient experience in China: A coarsened exact matching study from the perspective of residents. BMC Health Serv. Res. 2021, 21, 330. [Google Scholar] [CrossRef]
- Fei, X.; Wu, J.; Kong, Z.; Christakos, G. Urban-Rural Disparity of Breast Cancer and Socioeconomic Risk Factors in China. PLoS ONE 2015, 10, e0117572. [Google Scholar] [CrossRef]
- Miao, J.; Wu, X. Urbanization, socioeconomic status and health disparity in China. Health Place 2016, 42, 87–95. [Google Scholar] [CrossRef]
- Li, X.; Song, J.; Lin, T.; Dixon, J.; Zhang, G.; Ye, H. Urbanization and health in China, thinking at the national, local and individual levels. Environ. Health 2016, 15, S32. [Google Scholar]
- Jing, W.; Ying, Y.; Luxinyi, X.; Yuan, S.; Xiaotong, W.; Lining, M.; Quan, W.; Dan, C.; Zongfu, M. Impact of ‘4+7’ volume-based drug procurement on the use of policy-related original and generic drugs: A natural experimental study in China. BMJ Open 2022, 12, e054346. [Google Scholar]
- Yang, Y.; Tong, R.; Yin, S.; Mao, L.; Xu, L.; Hao, S.; Mao, Z. The impact of “4 + 7” volume-based drug procurement on the volume, expenditures, and daily costs of antihypertensive drugs in Shenzhen, China: An interrupted time series analysis. BMC Health Serv. Res. 2021, 21, 1275. [Google Scholar]
- Chen, L.; Yang, Y.; Luo, M.; Hu, B.; Yin, S.; Mao, Z. The Impacts of National Centralized Drug Procurement Policy on Drug Utilization and Drug Expenditures: The Case of Shenzhen, China. Int. J. Environ. Res. Public Health 2020, 17, 9415. [Google Scholar] [CrossRef]
- Yang, Y.; Chen, L.; Ke, X.; Mao, Z.; Zheng, B. The impacts of Chinese drug volume-based procurement policy on the use of policy-related antibiotic drugs in Shenzhen, 2018–2019: An interrupted time-series analysis. BMC Health Serv. Res. 2021, 21, 668. [Google Scholar]
- Pérez, A.V.; Trujillo, A.J.; Mejia, A.E.; Contreras, J.D.; Sharfstein, J.M. Evaluating the centralized purchasing policy for the treatment of hepatitis C: The Colombian CASE. Pharmacol. Res. Perspect. 2019, 7, e00552. [Google Scholar] [PubMed]
- Baldi, S.; Vannoni, D. The impact of centralization on pharmaceutical procurement prices: The role of institutional quality and corruption. Reg. Stud. 2017, 51, 426–438. [Google Scholar]
- Roy Chaudhury, R.; Parameswar, R.; Gupta, U.; Sharma, S.; Tekur, U.; Bapna, J.S. Quality medicines for the poor: Experience of the Delhi programme on rational use of drugs. Health Policy Plan. 2005, 20, 124–136. [Google Scholar] [CrossRef]
- Vandoros, S.; Stargardt, T. Reforms in the Greek pharmaceutical market during the financial crisis. Health Policy 2013, 109, 1–6. [Google Scholar]
- Al-Abbadi, I.; Qawwas, A.; Jaafreh, M.; Abosamen, T.; Saket, M. One-Year assessment of joint procurement of pharmaceuticals in the public health sector in Jordan. Clin. Ther. 2009, 31, 1335–1344. [Google Scholar]
- The Statistics Bureau of Shaanxi Provincie. Shaanxi Statistical Yearbook in 2020. Available online: https://tjj.shaanxi.gov.cn/tjsj/ndsj/tjnj/sxtjnj/index.html?2020 (accessed on 14 October 2024).
- Health Commission of Shaanxi Province. Shaanxi Health Statistical Yearbook in 2020. Available online: https://sxwjw.shaanxi.gov.cn/ywgz/ghxx_866/wstjnj/202411/t20241120_3198130.html (accessed on 14 October 2024).
- Wang, N.; Yang, Y.; Xu, L.; Mao, Z.; Cui, D. Influence of Chinese National Centralized Drug Procurement on the price of policy-related drugs: An interrupted time series analysis. BMC Public Health 2021, 21, 1883. [Google Scholar]
- Shaanxi Public Resources Trading Center. Bid-Winning Results of the 4+7 Centralized Drug Procurement. Available online: http://sxsyxcg.sxggzyjy.cn/HomePage/ShowDetailNew.aspx?InfoId=1959 (accessed on 14 October 2024).
- Xi’an Healthcare Security Administration. Notice on the Monitoring Plan for the 4+7 Pilot Work of the National Centralized Volume-Based Drug Procurement and Use from the Leading Group Office in Xi’an. Available online: http://sxsyxcg.sxggzyjy.cn/HomePage/ShowDetailNew.aspx?InfoId=1972 (accessed on 14 October 2024).
- Gerdtham, U.-G.; Johannesson, M.; Gunnarsson, B.; Marcusson, M.; Henriksson, F. Price Indices of Drugs and the Switching to New Drugs. PharmacoEconomics 1998, 13, 71–80. [Google Scholar] [CrossRef]
- WHO Collaborating Centre for Drug Statistics Methodology. Definition and General Considerations. Available online: https://www.whocc.no/ddd/definition_and_general_considera/ (accessed on 14 October 2024).
- WHO Collaborating Centre for Drug Statistics Methodology. ATC/DDD Index 2024. Available online: https://www.whocc.no/atc_ddd_index/ (accessed on 14 December 2024).
- Chen, X.; Jin, Y.; Tang, G. Newly Pharmacology, 17th ed.; People’s Medical Publishing House Co., LTD.: Beijing, China, 2011. [Google Scholar]
- Bertrand, M.; Duflo, E.; Mullainathan, S. How Much Should We Trust Differences-in-Differences Estimates? Q. J. Econ. 2004, 119, 249–275. [Google Scholar]
- Dette, H.; Schumann, M. Testing for equivalence of pre-trends in Difference-in-Differences estimation. J. Bus. Econ. Stat. 2024, 42, 1289–1301. [Google Scholar]
- O’Neill, S.; Kreif, N.; Grieve, R.; Sutton, M.; Sekhon, J.S. Estimating causal effects: Considering three alternatives to difference-in-differences estimation. Health Serv. Outcomes Res. Methodol. 2016, 16, 1–21. [Google Scholar]
- Ding, F.; Zhuang, G. Has the establishment of National Key Ecological Function Areas promoted economic development? Evaluation of the policy effects based on a DID study. China Popul. Resour. Environ. 2021, 31, 19–28. [Google Scholar]
- Shen, K.; Jin, G.; Gong, H. The Policy Effects of the Environmental Governance of Chinese Local Governments: A StudyBased on the Progress of the River Chief System. Soc. Sci. China 2020, 41, 87–105. [Google Scholar]
- Abadie, A.; Diamond, A.; Hainmueller, J. Comparative Politics and the Synthetic Control Method. Am. J. Political Sci. 2015, 59, 495–510. [Google Scholar]
- Abadie, A.; Diamond, A.; Hainmueller, J. Synthetic Control Methods for Comparative Case Studies: Estimating the Effect of California’s Tobacco Control Program. J. Am. Stat. Assoc. 2010, 105, 493–505. [Google Scholar] [CrossRef]
- Chen, Q.; Yan, G. A mixed placebo test for synthetic control method. Econ. Lett. 2023, 224, 111004. [Google Scholar] [CrossRef]
- Tang, D.; Laporte, A.; Gao, X.; Coyte, P.C. The effect of the two-child policy on cesarean section in China: Identification using difference-in-differences techniques. Midwifery 2022, 107, 103260. [Google Scholar] [CrossRef]
- Adesina, A.; Wirtz, V.J.; Dratler, S. Reforming antiretroviral price negotiations and public procurement: The Mexican experience. Health Policy Plan. 2013, 28, 1–10. [Google Scholar] [CrossRef]
- Duan, F.; Wen, X.; Liu, Y.; Wang, Y.; Luo, J.; Mao, Z. Analysis of the Usage Characteristics of the Antitumor Drugs with the National Centralized Volume-based Drug Procurement Policy. China Health Insur. 2023, 5, 104–109. (In Chinese) [Google Scholar]
- Huang, Z.; Liu, S.; Wei, X.; Wang, D.; Wang, X.; Sun, J. Originals and Generics Utilization Analysis of Cardiovascular Medicines in 85 Secondary andTertiary Public Hospitals in Beijing. Chin. J. Pharmacoepidemiol. 2017, 26, 490–495. [Google Scholar]
- Hu, S. Theoretical basis of health economics and optimizing suggestions on national centralized drug procurement. Chin. Health Resour. 2021, 24, 12–14+23. (In Chinese) [Google Scholar]
- Han, J. The Research on the Influence of Purchasing Policy with Quantityon the Price, Quantity and Cost of National Centralized Purchasingdrugs in a Tertiary-Grade Class A Hospital. Master’s Thesis, Shandong University, Jinan, China, 2021. [Google Scholar]
- Colgan, S.; Faasse, K.; Martin, L.R.; Stephens, M.H.; Grey, A.; Petrie, K.J. Perceptions of generic medication in the general population, doctors and pharmacists: A systematic review. BMJ Open 2015, 5, e008915. [Google Scholar] [CrossRef] [PubMed]
- Goldszmidt, R.B.; Buttendorf, A.R.; Schuldt Filho, G.; Souza, J.M., Jr.; Bianchini, M.A. The impact of generic labels on the consumption of and adherence to medication: A randomized controlled trial. Eur. J. Public Health 2019, 29, 12–17. [Google Scholar] [CrossRef]
- Liu, Y.-M.; Hsieh, C.-R. Profit-Seeking Behavior of Medical Providers and Generic Competition in the Pharmaceutical Market: Evidence from Taiwan. B.E. J. Econ. Anal. Policy 2014, 14, 241–275. [Google Scholar] [CrossRef]

| Group | Pre- | Post- | Post-Minus Pre-(Net Effect) |
|---|---|---|---|
| Control group | β0 | β0 + β2 | β2 |
| Treatment group | β0 + β1 | β0 + β1 + β2 + β3 | β2 + β3 |
| Treatment group–control group | β1 | β1 + β3 | β3 |
| Variables | Volume (Ten Thousand DDDs) | Expenditure (Ten Thousand CNY) | ||||
|---|---|---|---|---|---|---|
| Pre- | Post- | GR (%) | Pre- | Post- | GR (%) | |
| Policy-list drugs | 2855.98 | 6914.72 | 142.11 | 29,783.08 | 23,291.81 | −21.80 |
| Bid-winning drugs | 800.98 | 5518.49 | 588.97 | 9395.72 | 11,743.49 | 24.99 |
| Non-winning drugs | 2054.99 | 1396.23 | −32.06 | 20,387.36 | 11,548.32 | −43.36 |
| Alternative drugs | 5126.65 | 6508.79 | 26.96 | 25,612.09 | 31,730.16 | 23.89 |
| Policy-related drugs | 7982.63 | 13,423.51 | 68.16 | 55,395.17 | 55,021.97 | −0.67 |
| Variables | Volume (Ten Thousand DDDs) | Expenditure (Ten Thousand CNY) | ||||
|---|---|---|---|---|---|---|
| Pre- | Post- | GR (%) | Pre- | Post- | GR (%) | |
| Difference in drugs | ||||||
| Policy-list drugs | ||||||
| Original | 1146.32 | 1045.83 | −8.77 | 11,019.16 | 7652.33 | −30.55 |
| Generic | 1709.66 | 5868.89 | 243.28 | 18,763.92 | 15,639.48 | −16.65 |
| Bid-winning drugs | ||||||
| Original | 2.53 | 28.57 | 1029.25 | 11.88 | 39.52 | 232.66 |
| Generic | 798.45 | 5489.93 | 587.57 | 9383.84 | 11,703.97 | 24.72 |
| Non-winning drugs | ||||||
| Original | 1143.79 | 1017.26 | −11.06 | 11,007.28 | 7612.81 | −30.84 |
| Generic | 911.21 | 378.96 | −58.41 | 9380.08 | 3935.50 | −58.04 |
| Alternative drugs | ||||||
| Original | 3007.24 | 3884.51 | 29.17 | 7023.01 | 10,983.38 | 56.39 |
| Generic | 2119.41 | 2624.28 | 23.82 | 18,589.08 | 20,746.78 | 11.61 |
| Policy-related drugs | ||||||
| Original | 4153.56 | 4930.34 | 18.70 | 18,042.17 | 18,635.71 | 3.29 |
| Generic | 3829.07 | 8493.17 | 121.81 | 37,353.00 | 36,386.26 | −2.59 |
| Difference in hospitals | ||||||
| Policy-list drugs | ||||||
| County-level | 378.23 | 1043.38 | 175.86 | 2506.32 | 1567.46 | −37.46 |
| City-level | 2477.74 | 5871.34 | 136.96 | 27,276.75 | 21,724.34 | −20.36 |
| Bid-winning drugs | ||||||
| County-level | 92.63 | 979.86 | 957.82 | 626.56 | 1068.78 | 70.58 |
| City-level | 708.35 | 4538.63 | 540.73 | 8769.16 | 10,674.71 | 21.73 |
| Non-winning drugs | ||||||
| County-level | 285.60 | 63.51 | −77.76 | 1879.76 | 498.69 | −73.47 |
| City-level | 1769.39 | 1332.71 | −24.68 | 18,507.60 | 11,049.63 | −40.30 |
| Alternative drugs | ||||||
| County-level | 1002.84 | 1102.50 | 9.94 | 2720.05 | 3100.91 | 14.00 |
| City-level | 4123.81 | 5406.29 | 31.10 | 22,892.05 | 28,629.26 | 25.06 |
| Policy-related drugs | ||||||
| County-level | 1381.07 | 2145.88 | 55.38 | 5226.37 | 4668.37 | −10.68 |
| City-level | 6601.55 | 11,277.64 | 70.83 | 50,168.80 | 50,353.60 | 0.37 |
| Variables | Pre- | Post- | Diff | GR |
|---|---|---|---|---|
| Policy-list drugs | ||||
| Subtotal | 59.86 | 84.88 | 25.02 | 41.78 |
| County-level hospitals | 84.50 | 95.71 | 11.21 | 13.26 |
| City-level hospitals | 56.10 | 82.95 | 26.85 | 47.86 |
| Policy-related drugs | ||||
| Subtotal | 47.97 | 63.27 | 15.30 | 31.90 |
| County-level hospitals | 61.43 | 70.56 | 9.13 | 14.86 |
| City-level hospitals | 45.15 | 61.88 | 16.73 | 37.06 |
| Variables | Volume (Ten Thousand DDDs) | Expenditure (Ten Thousand CNY) | ||
|---|---|---|---|---|
| Model 1 | Model 2 | Model 1 | Model 2 | |
| Policy-list drugs | ||||
| Treat × Time | 221.30 *** | 204.76 *** | −319.95 * | −414.11 ** |
| (29.77) | (31.30) | (119.11) | (124.14) | |
| Month fixed effect | Yes | Yes | Yes | Yes |
| Hospital attribute fixed effect | Yes | Yes | Yes | Yes |
| R2 | 0.789 | 0.805 | 0.335 | 0.385 |
| Bid-winning drugs | ||||
| Treat × Time | 262.95 ** | 256.72 ** | 173.81 *** | 140.11 ** |
| (57.71) | (58.96) | (9.89) | (31.26) | |
| Month fixed effect | Yes | Yes | Yes | Yes |
| Hospital attribute fixed effect | Yes | Yes | Yes | Yes |
| R2 | 0.827 | 0.830 | 0.472 | 0.523 |
| Non-winning drugs | ||||
| Treat × Time | −41.87 | −50.87 | −494.56 ** | −551.47 ** |
| (28.37) | (30.14) | (121.04) | (131.33) | |
| Month fixed effect | Yes | Yes | Yes | Yes |
| Hospital attribute fixed effect | Yes | Yes | Yes | Yes |
| R2 | 0.386 | 0.426 | 0.485 | 0.509 |
| Alternative drugs | ||||
| Treat × Time | 64.49 *** | 44.05 * | 310.34 *** | 181.87 * |
| (12.58) | (15.11) | (42.57) | (79.67) | |
| Month fixed effect | Yes | Yes | Yes | Yes |
| Hospital attribute fixed effect | Yes | Yes | Yes | Yes |
| R2 | 0.463 | 0.506 | 0.428 | 0.472 |
| Policy-related drugs | ||||
| Treat × Time | 285.79 *** | 250.97 *** | −9.61 | −229.90 |
| (41.60) | (44.85) | (151.71) | (213.13) | |
| Month fixed effect | Yes | Yes | Yes | Yes |
| Hospital attribute fixed effect | Yes | Yes | Yes | Yes |
| R2 | 0.665 | 0.693 | 0.341 | 0.394 |
| Variables | County-Level Hospitals | City-Level Hospitals | ||||||
|---|---|---|---|---|---|---|---|---|
| Original | Generic | Original | Generic | |||||
| Model 1 | Model 2 | Model 1 | Model 2 | Model 1 | Model 2 | Model 1 | Model 2 | |
| Policy-list drugs | ||||||||
| Treat × Time | −4.94 ** | −5.33 * | 67.31 *** | 61.11 *** | −2.58 | −8.95 | 197.06 *** | 188.44 *** |
| (1.08) | (2.05) | (2.71) | (5.38) | (6.71) | (7.90) | (7.00) | (9.83) | |
| Month fixed effect | Yes | Yes | Yes | Yes | Yes | Yes | Yes | Yes |
| Hospital attribute fixed effect | Yes | Yes | Yes | Yes | Yes | Yes | Yes | Yes |
| R2 | 0.375 | 0.422 | 0.736 | 0.759 | 0.155 | 0.206 | 0.854 | 0.859 |
| Bid-winning drugs | ||||||||
| Treat × Time | / | / | 96.39 *** | 91.67 *** | 1.37 ** | 1.02 * | 214.38 *** | 210.35 *** |
| / | / | (1.26) | (2.66) | (0.24) | (0.34) | (19.40) | (10.87) | |
| Month fixed effect | Yes | Yes | Yes | Yes | Yes | Yes | Yes | Yes |
| Hospital attribute fixed effect | Yes | Yes | Yes | Yes | Yes | Yes | Yes | Yes |
| R2 | / | / | 0.864 | 0.869 | 0.836 | 0.843 | 0.874 | 0.877 |
| Non-winning drugs | ||||||||
| Treat × Time | −5.01 ** | −5.40 * | −29.11 *** | −30.63 *** | −3.94 | −10.22 | −17.44 | −22.01 |
| (1.08) | (2.03) | (1.55) | (2.89) | (6.90) | (8.08) | (12.43) | (12.26) | |
| Month fixed effect | Yes | Yes | Yes | Yes | Yes | Yes | Yes | Yes |
| Hospital attribute fixed effect | Yes | Yes | Yes | Yes | Yes | Yes | Yes | Yes |
| R2 | 0.374 | 0.420 | 0.579 | 0.610 | 0.158 | 0.208 | 0.350 | 0.381 |
| Alternative drugs | ||||||||
| Treat × Time | 6.82 * | 3.15 | −15.90 ** | −19.58 ** | 49.22 *** | 38.36 *** | 25.87 * | 16.40 † |
| (2.61) | (4.20) | (4.05) | (5.15) | (3.92) | (5.13) | (10.88 | (9.04) | |
| Month fixed effect | Yes | Yes | Yes | Yes | Yes | Yes | Yes | Yes |
| Hospital attribute fixed effect | Yes | Yes | Yes | Yes | Yes | Yes | Yes | Yes |
| R2 | 0.391 | 0.400 | 0.461 | 0.486 | 0.383 | 0.411 | 0.341 | 0.387 |
| Policy-related drugs | ||||||||
| Treat × Time | 1.88 | −2.17 | 51.41 *** | 41.54 *** | 46.64 ** | 29.47 * | 222.93 *** | 204.84 *** |
| (3.36) | (3.67) | (4.97) | (6.49) | (10.64) | (12.27) | (17.84) | (18.60) | |
| Month fixed effect | Yes | Yes | Yes | Yes | Yes | Yes | Yes | Yes |
| Hospital attribute fixed effect | Yes | Yes | Yes | Yes | Yes | Yes | Yes | Yes |
| R2 | 0.430 | 0.443 | 0.619 | 0.646 | 0.310 | 0.344 | 0.800 | 0.811 |
Disclaimer/Publisher’s Note: The statements, opinions and data contained in all publications are solely those of the individual author(s) and contributor(s) and not of MDPI and/or the editor(s). MDPI and/or the editor(s) disclaim responsibility for any injury to people or property resulting from any ideas, methods, instructions or products referred to in the content. |
© 2025 by the authors. Licensee MDPI, Basel, Switzerland. This article is an open access article distributed under the terms and conditions of the Creative Commons Attribution (CC BY) license (https://creativecommons.org/licenses/by/4.0/).
Share and Cite
Zhao, D.; Zhou, Z. Intended and Unintended Impacts of ‘4+7’ Volume-Based Drug Procurement on the Use of Drugs in China: A Natural Experimental Study. Healthcare 2025, 13, 686. https://doi.org/10.3390/healthcare13060686
Zhao D, Zhou Z. Intended and Unintended Impacts of ‘4+7’ Volume-Based Drug Procurement on the Use of Drugs in China: A Natural Experimental Study. Healthcare. 2025; 13(6):686. https://doi.org/10.3390/healthcare13060686
Chicago/Turabian StyleZhao, Dantong, and Zhongliang Zhou. 2025. "Intended and Unintended Impacts of ‘4+7’ Volume-Based Drug Procurement on the Use of Drugs in China: A Natural Experimental Study" Healthcare 13, no. 6: 686. https://doi.org/10.3390/healthcare13060686
APA StyleZhao, D., & Zhou, Z. (2025). Intended and Unintended Impacts of ‘4+7’ Volume-Based Drug Procurement on the Use of Drugs in China: A Natural Experimental Study. Healthcare, 13(6), 686. https://doi.org/10.3390/healthcare13060686