

Physical Activity and Psychological Symptoms in University Teachers Improved Post-COVID-19 Lockdown, but Sedentary Behavior Persisted

 ,
,
Abstract
1. Introduction
2. Materials and Methods
2.1. Study Design
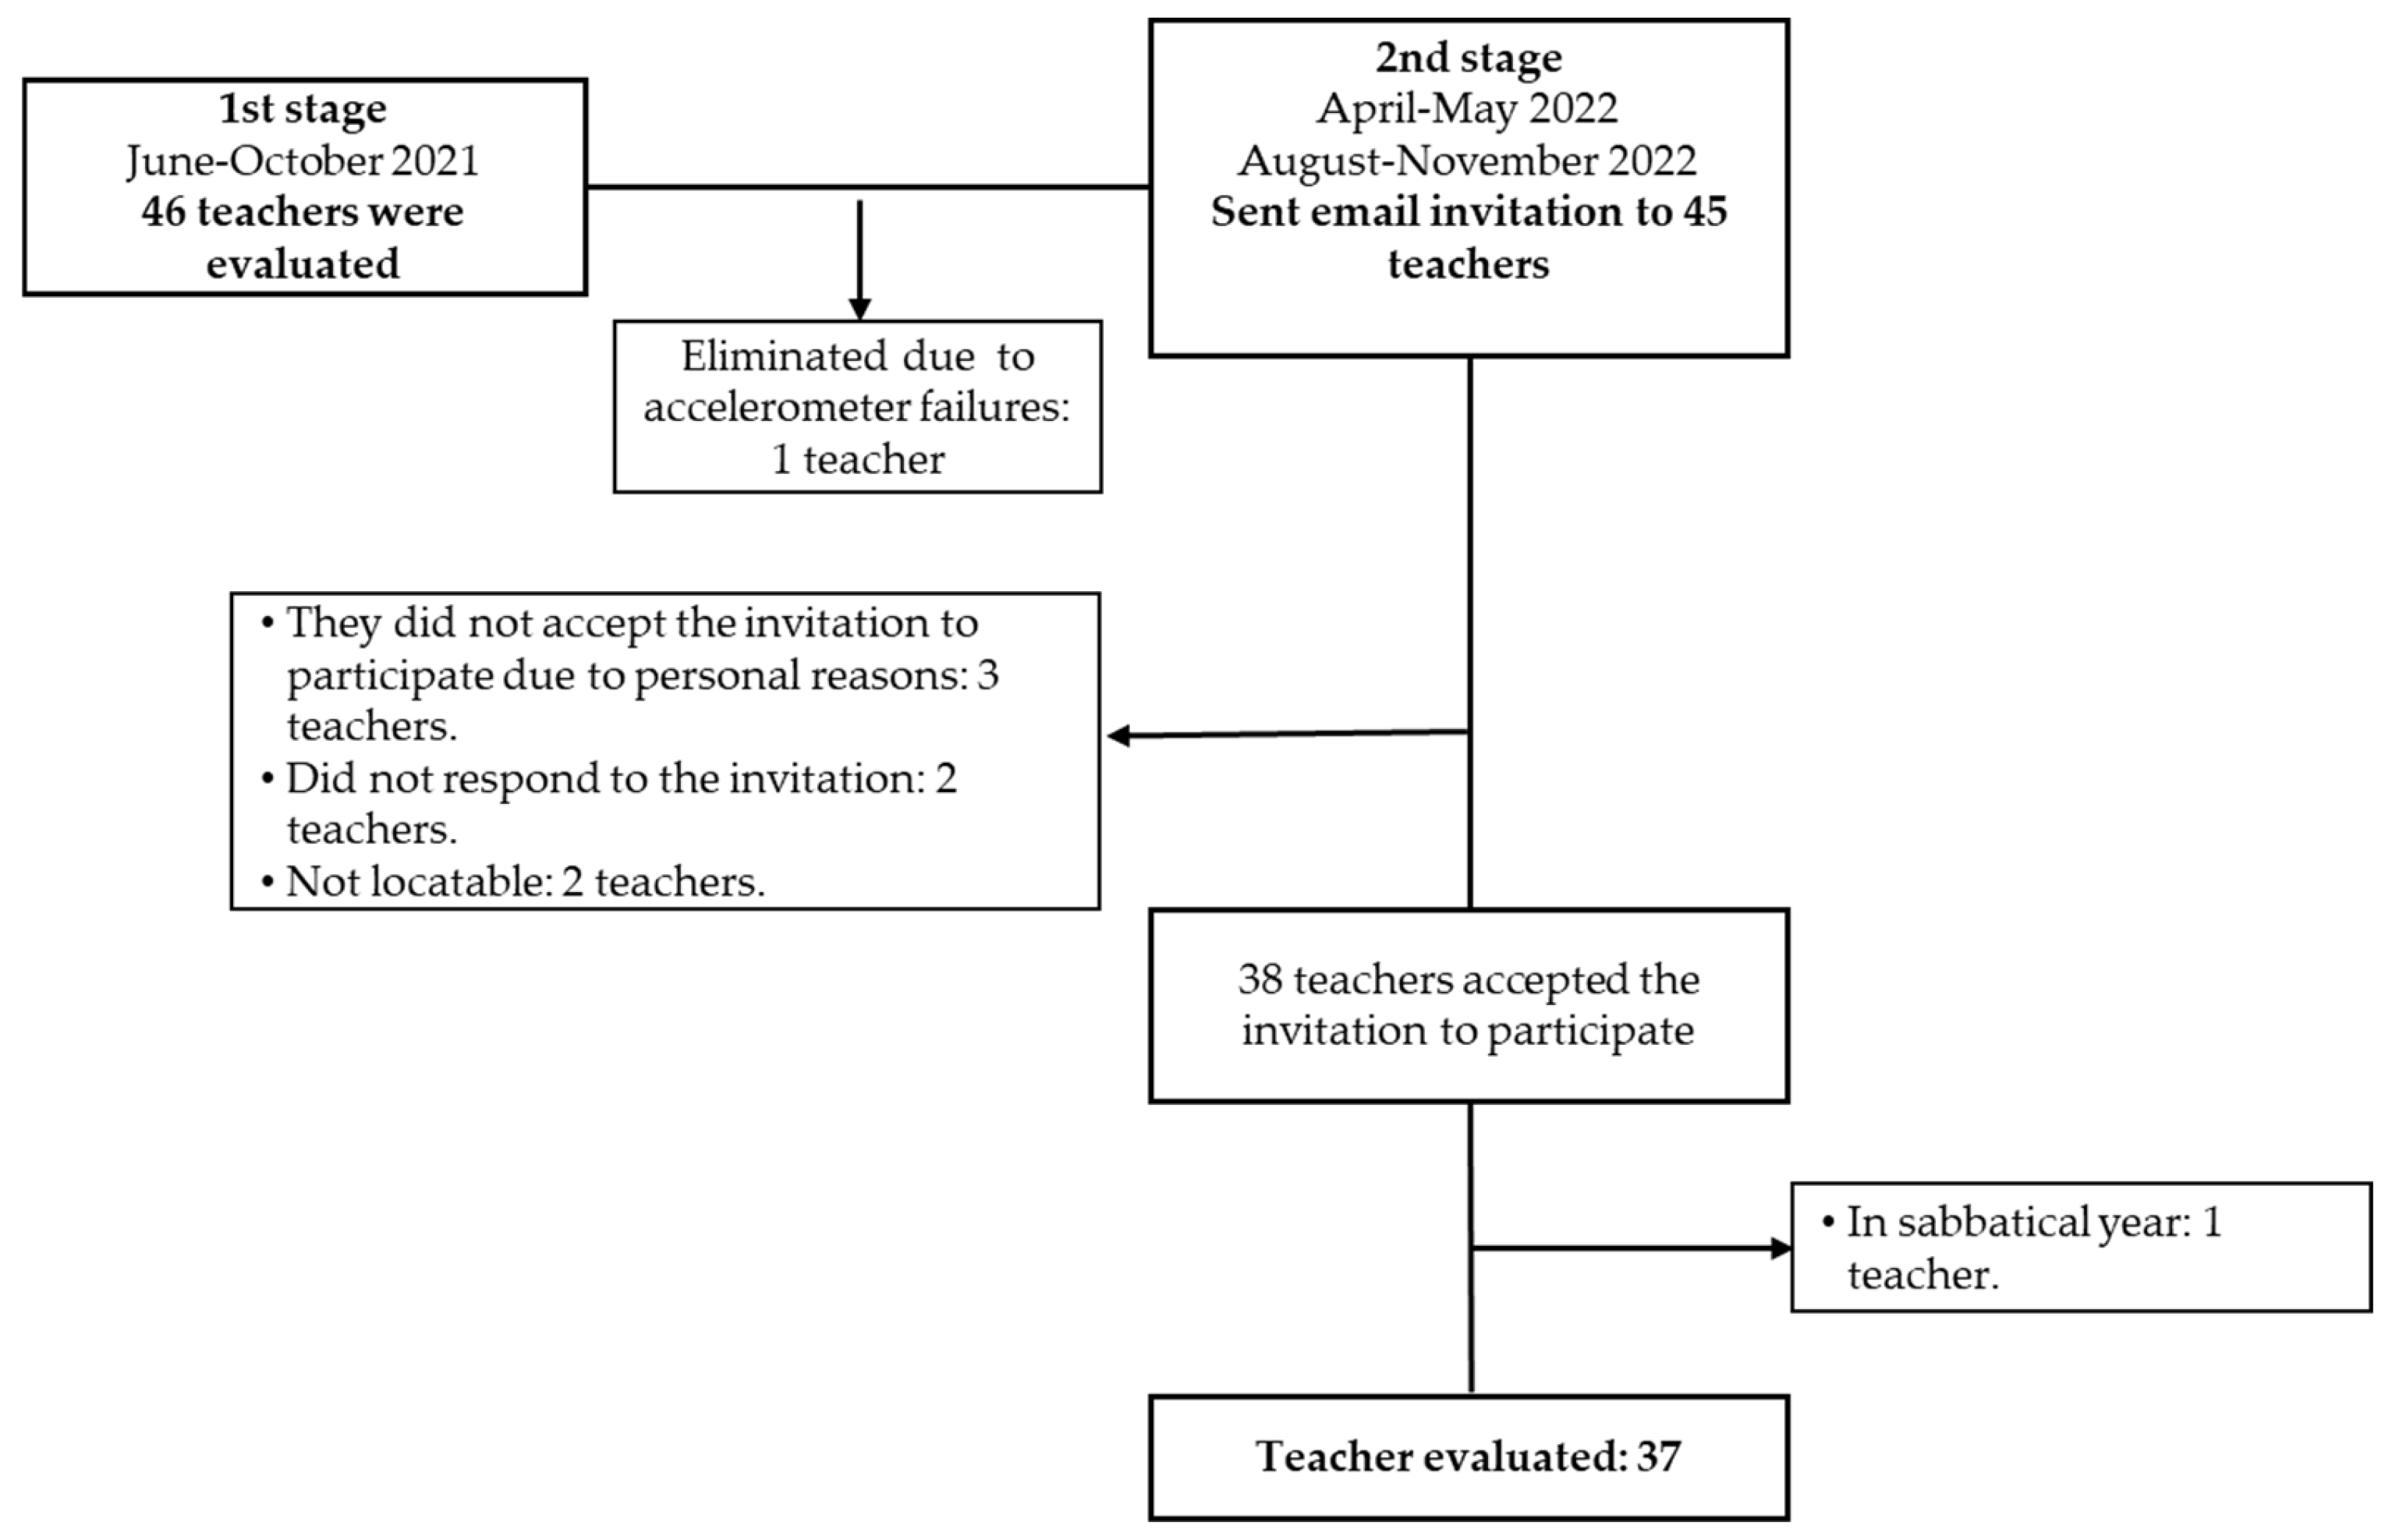
2.2. Participants
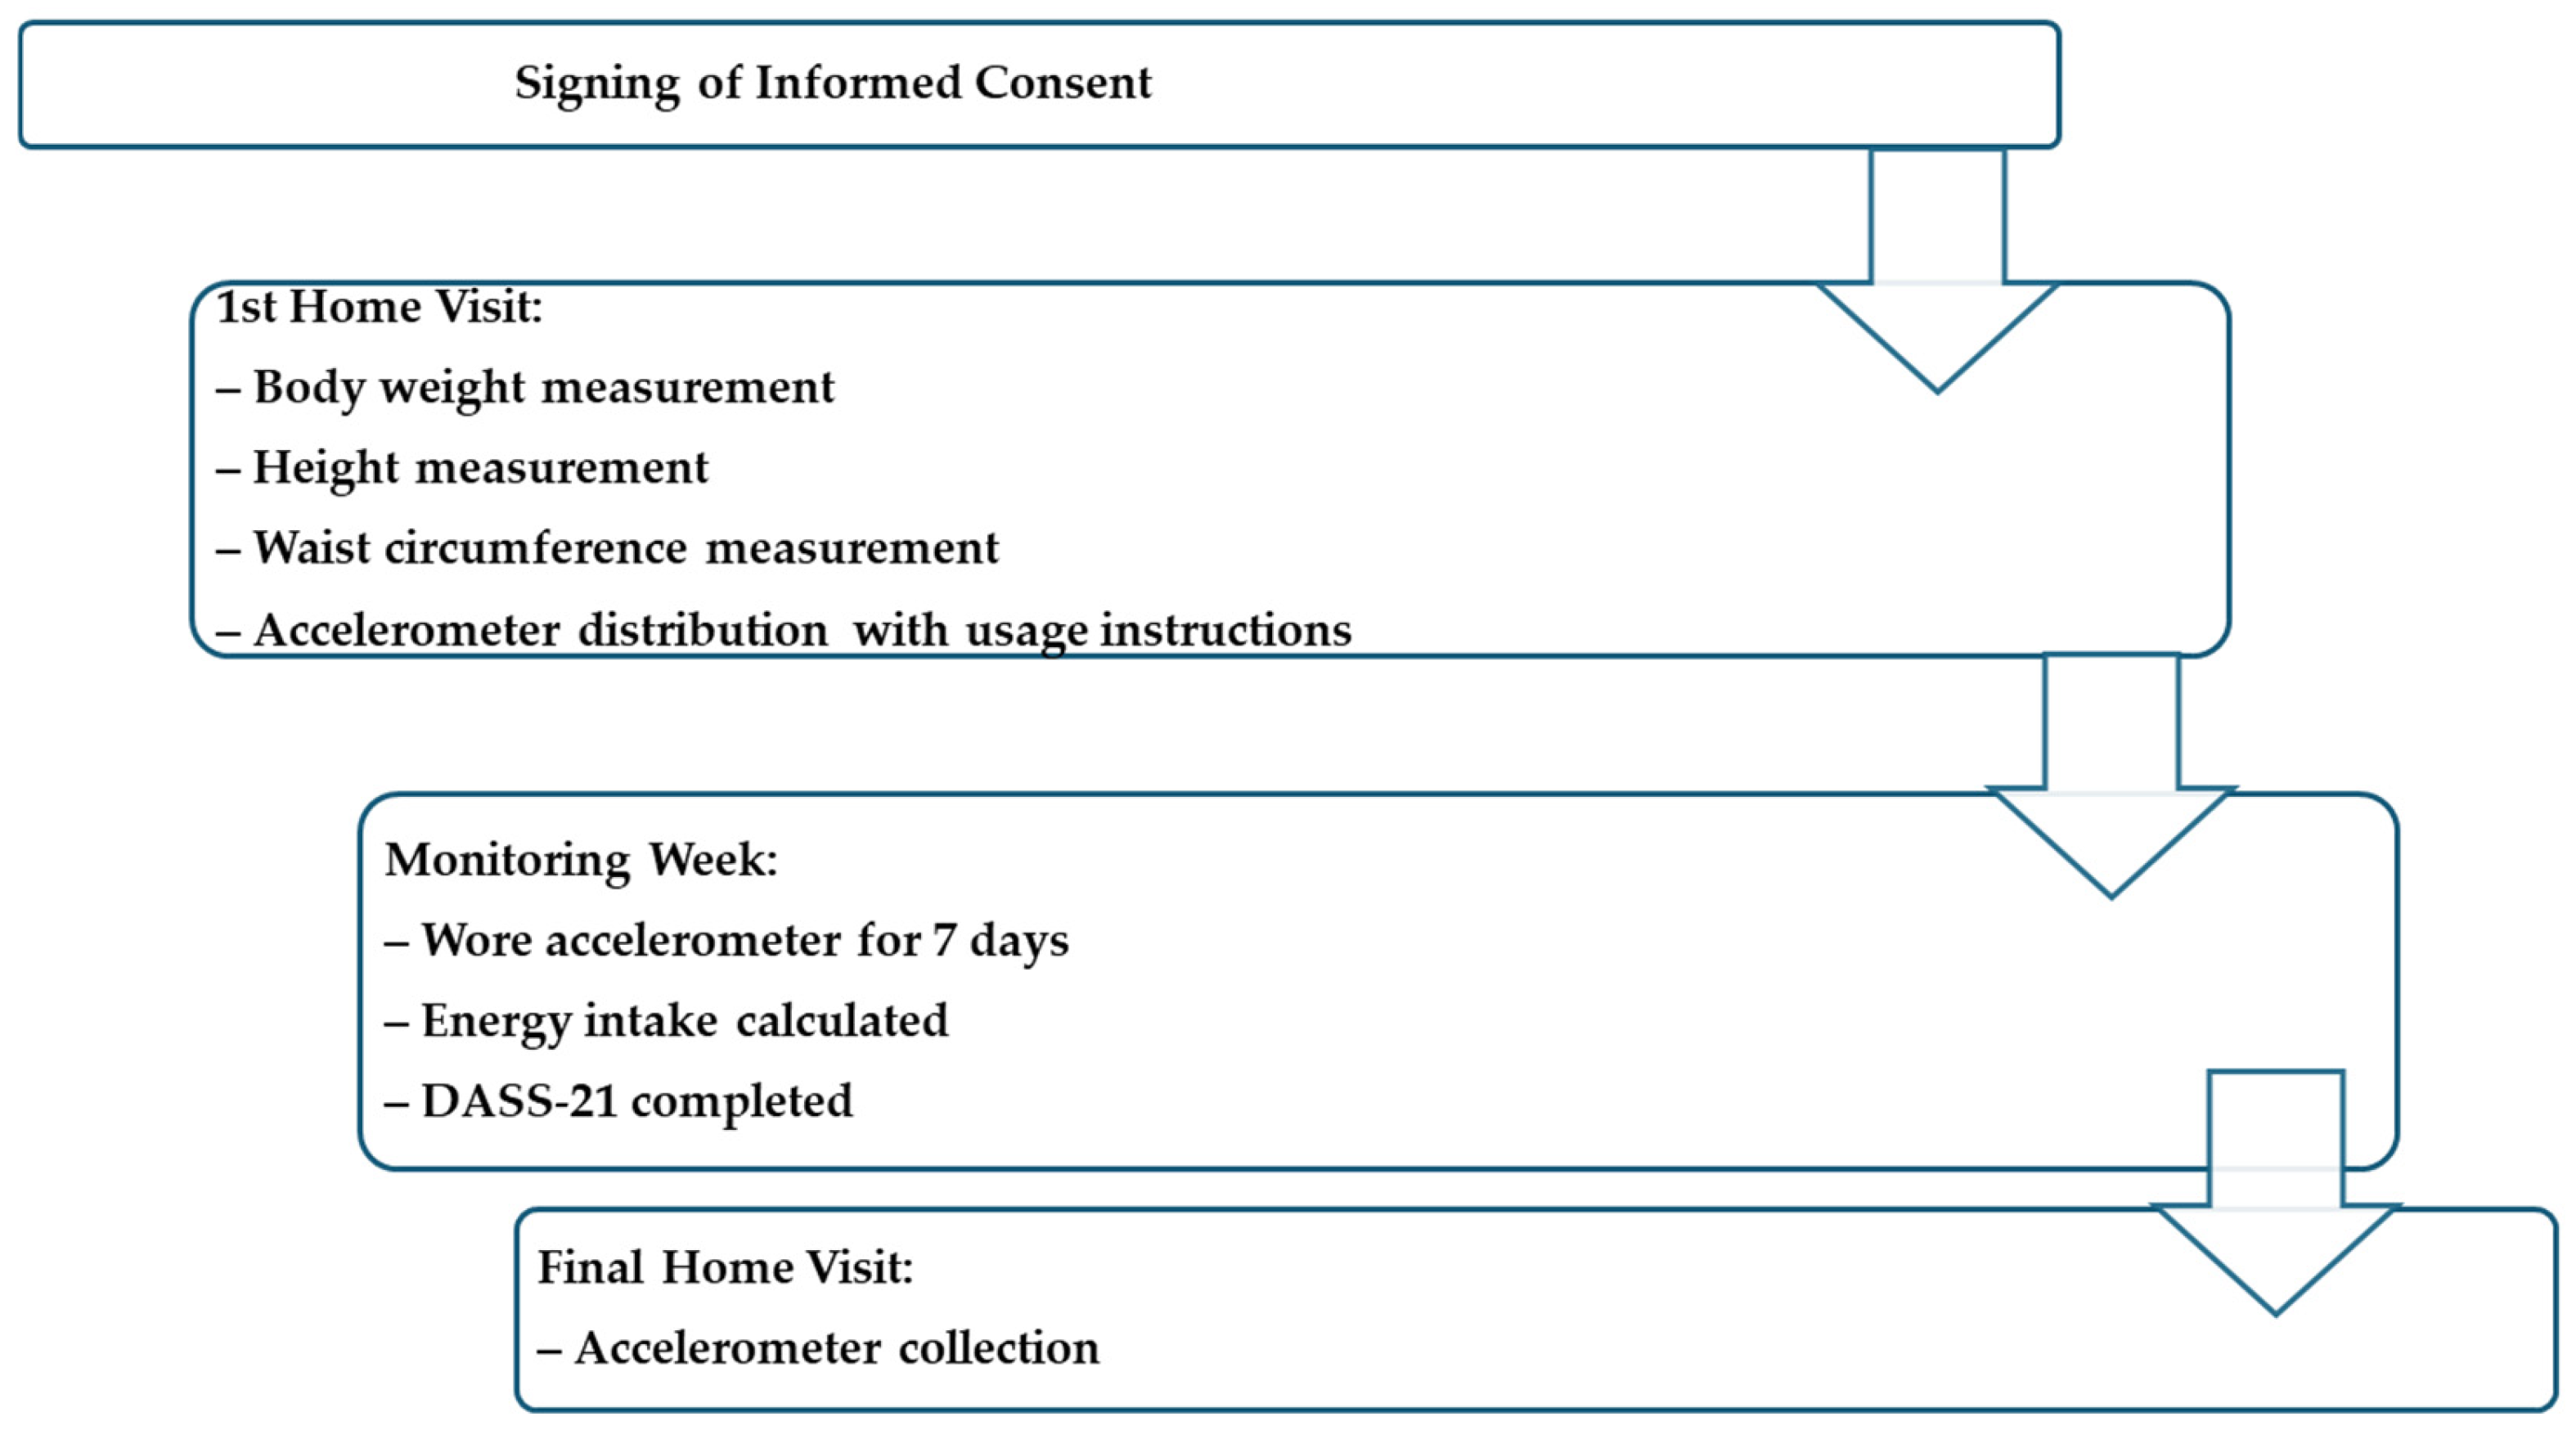
2.3. Procedures
2.4. Objective Assessment of PA, SBT, and ABs
2.5. Description of Depression, Anxiety, and Stress Symptpms
2.6. Statical Analysis
3. Results
3.1. Participants
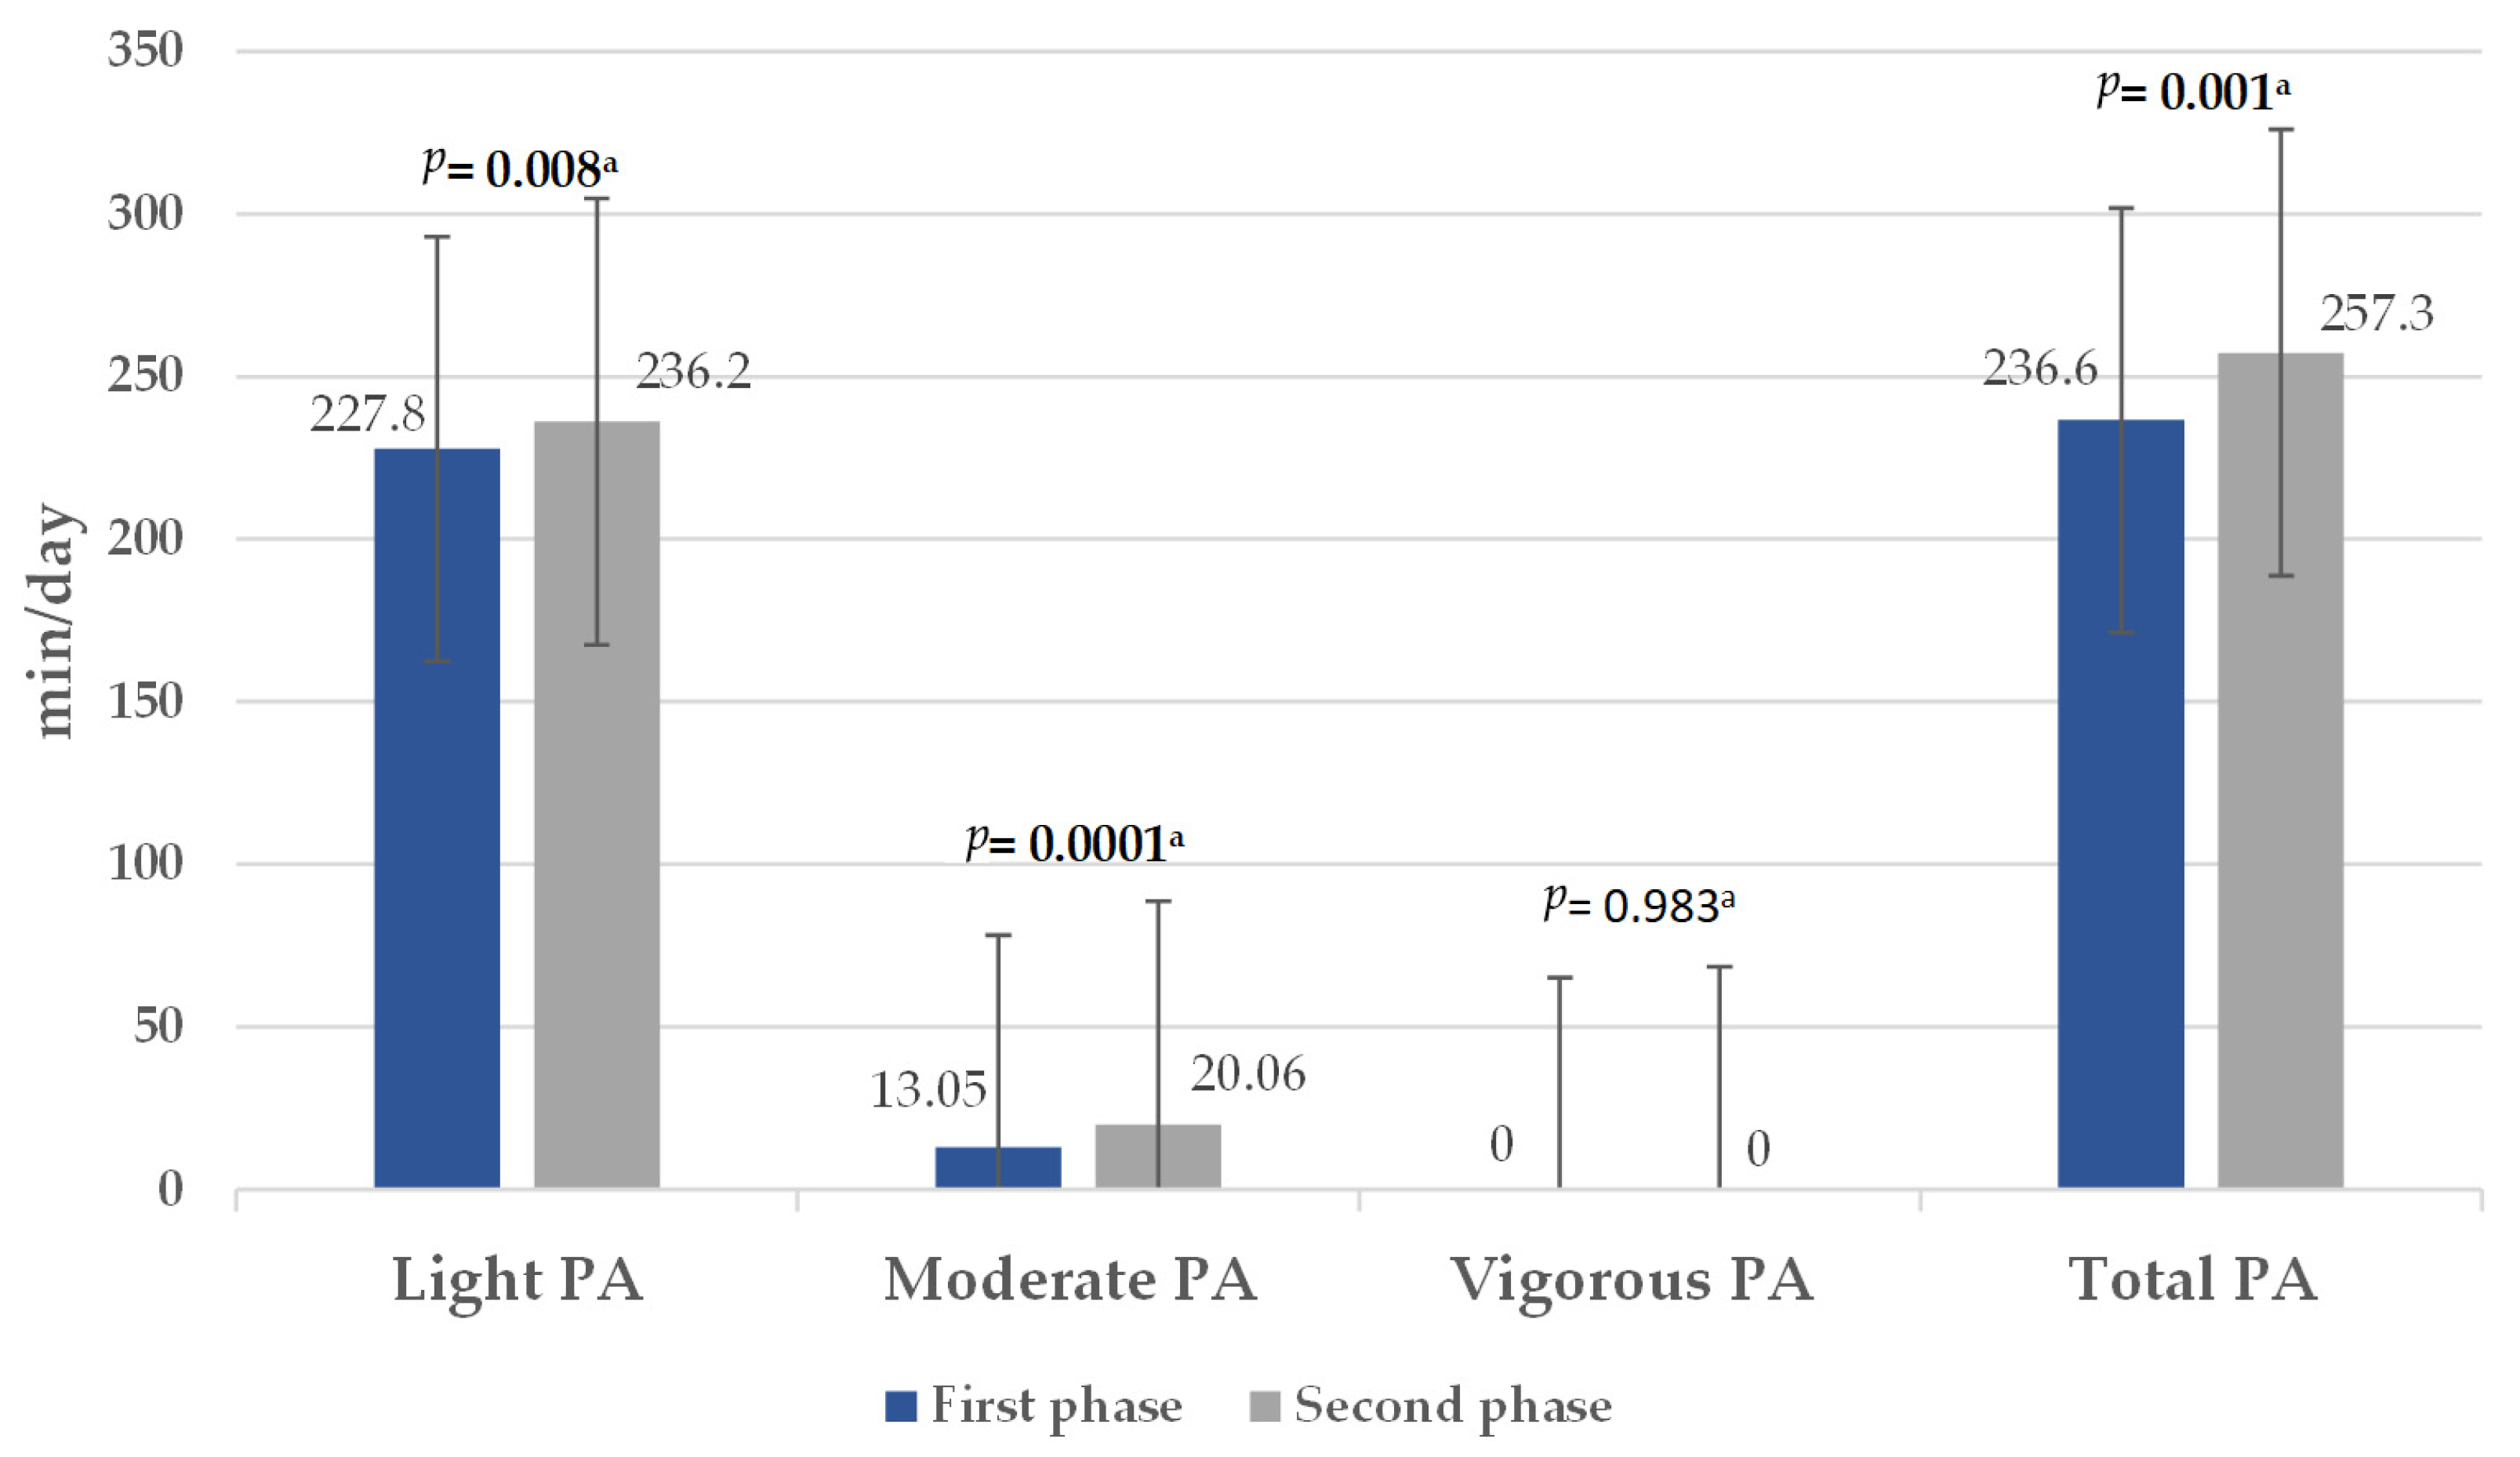
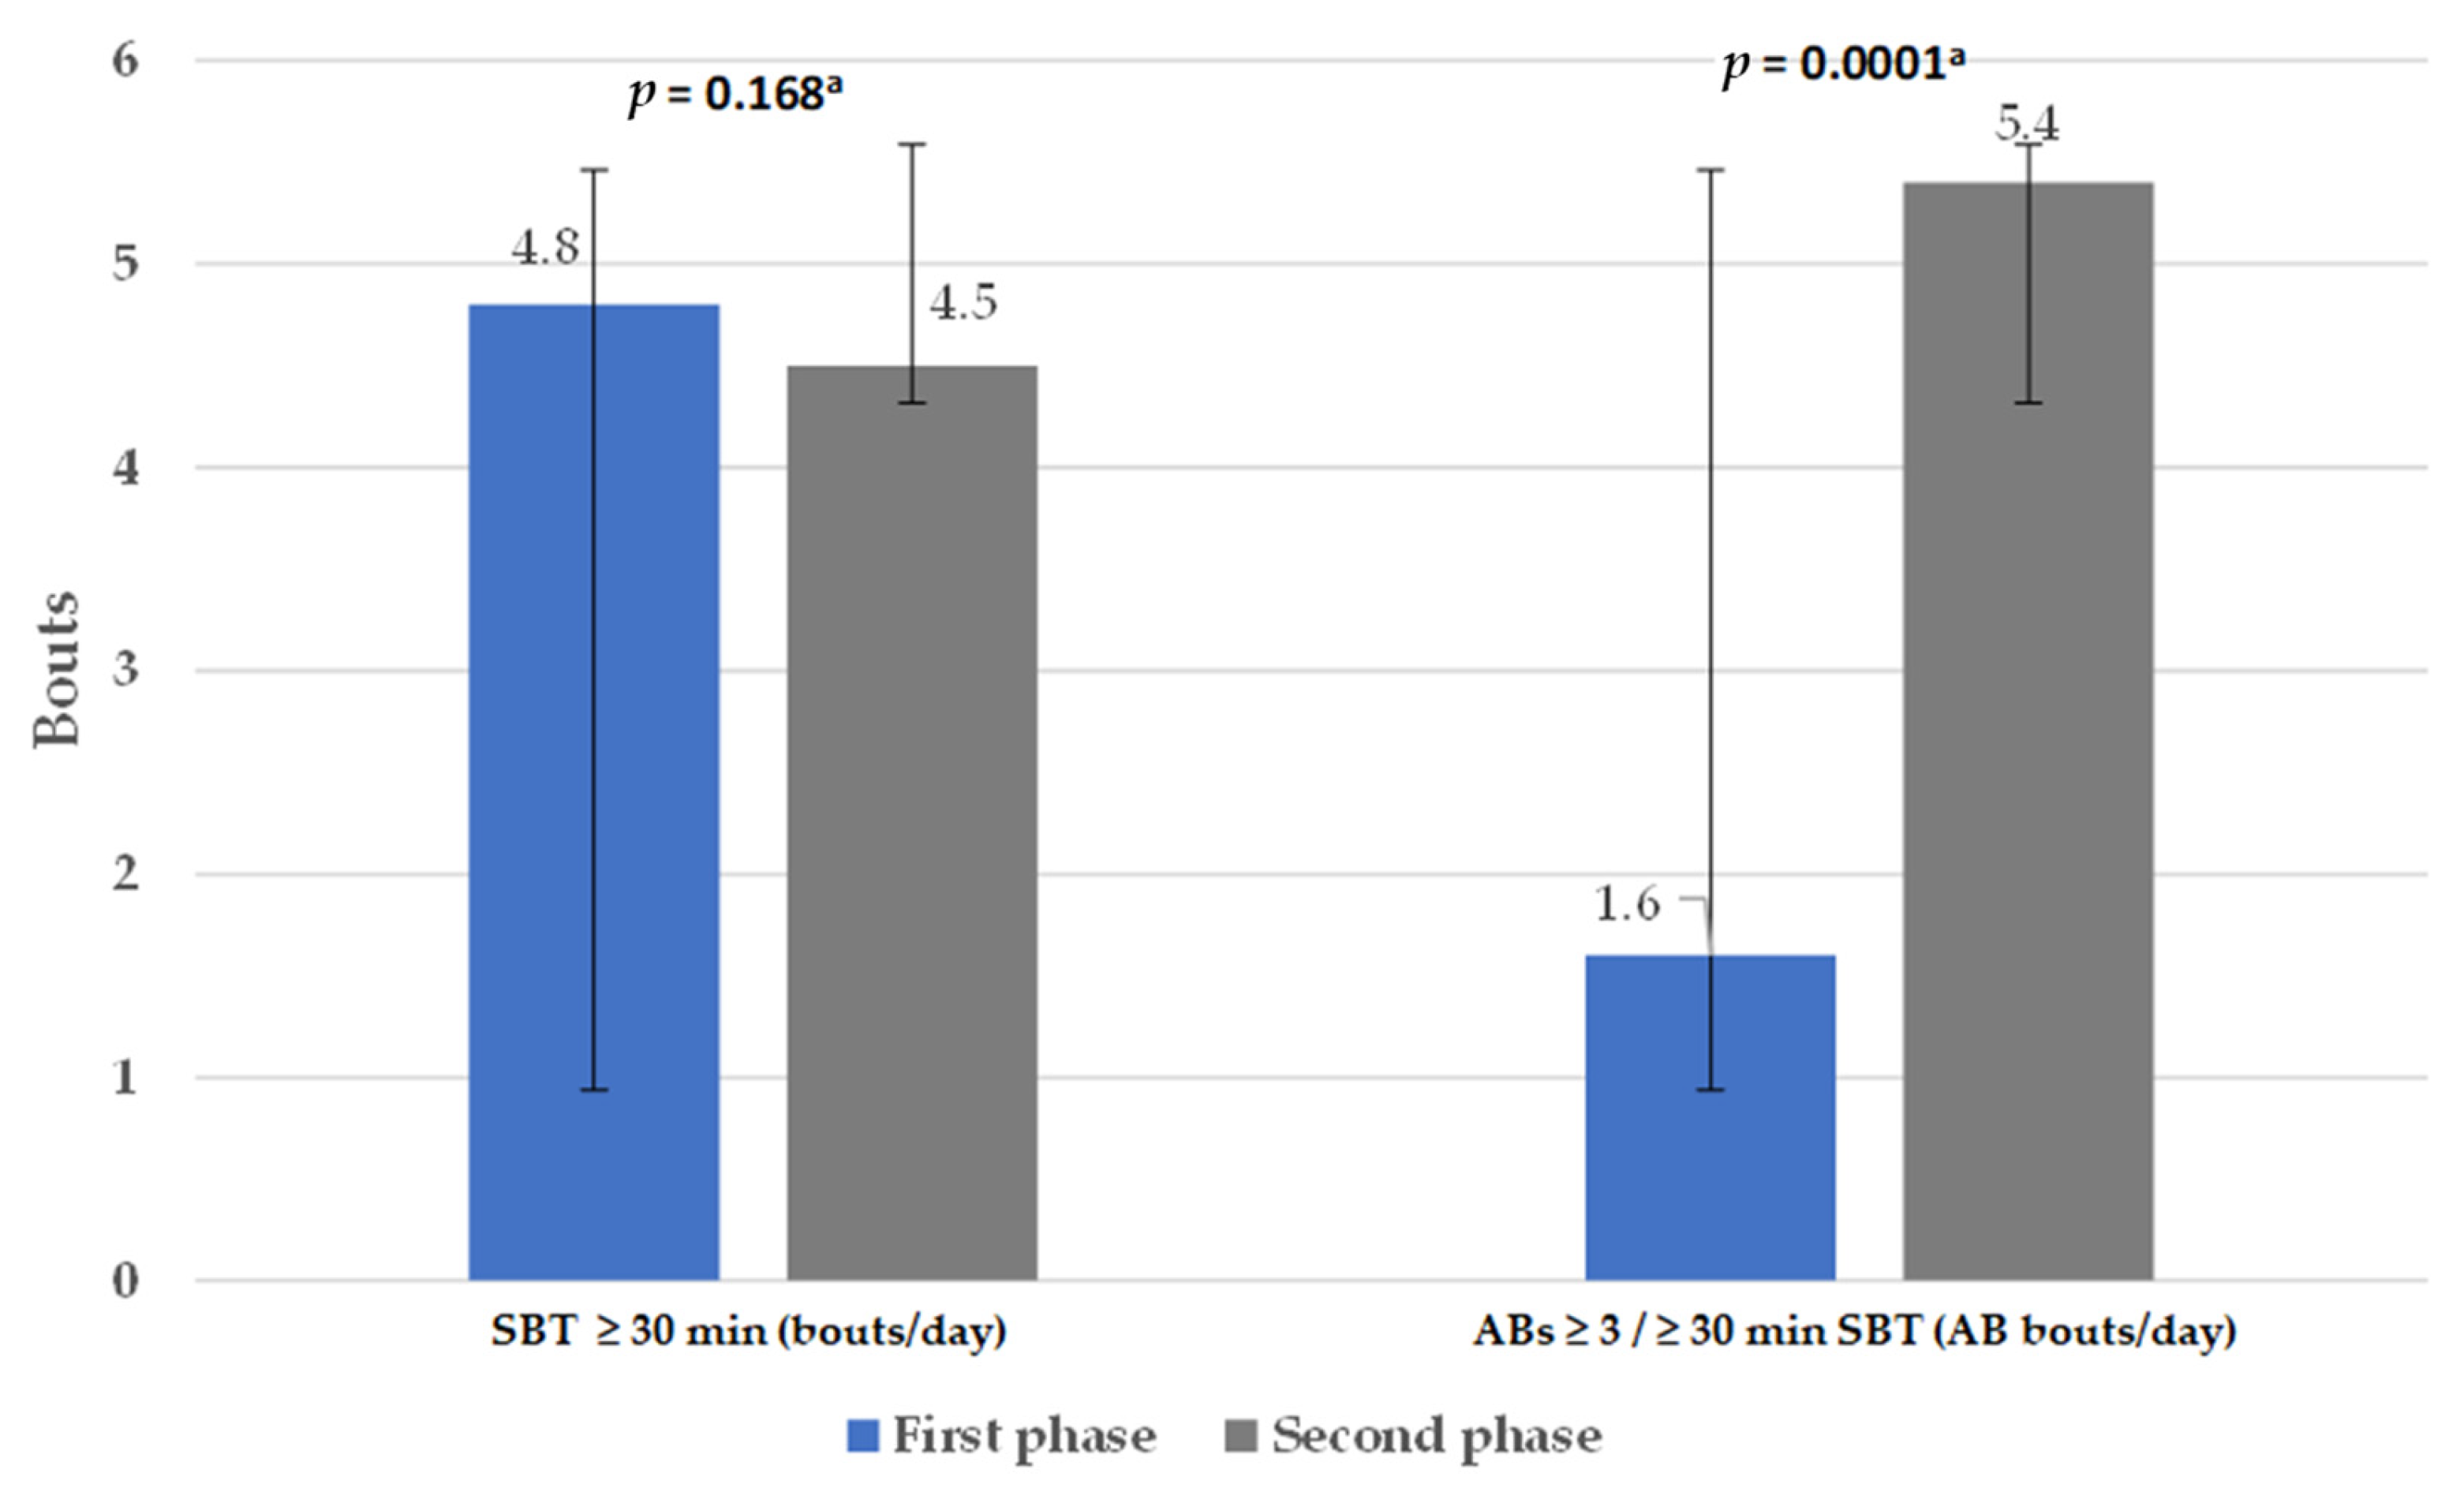
3.2. Physical Activity Level, Sedentary Behavior Time, and Active Breaks
3.3. Depression, Anxiety, and Stress Symptoms
3.4. Correlation Between Physical Activity Level, Sedentary Behavior Time, and Active Breaks with Mental Health Status and Body Measurements During the Second Phase of the Study
4. Discussion
4.1. Physical Activity and Sedentary Behavior
4.2. Depression, Anxiety, and Stress
5. Conclusions
Author Contributions
Funding
Institutional Review Board Statement
Informed Consent Statement
Data Availability Statement
Acknowledgments
Conflicts of Interest
Abbreviations
| PA | Physical activity |
| SBT | Sedentary behavior time |
| ABs | Active breaks |
| WC | Waist circumference |
| LPA | Light physical activity |
| MPA | Moderate physical activity |
| VPA | Vigorous physical activity |
| MVPA | Moderate and vigorous physical activity |
| BMI | Body mass index |
| COVID-19 | Coronavirus disease 2019 |
| WHO | World Health Organization |
| CVD | Cardiovascular disease |
| T2D | Type 2 diabetes |
References
- Islam, M.S.; Rahman, K.M.; Sun, Y.; Qureshi, M.O.; Abdi, I.; Chughtai, A.A.; Seale, H. Current knowledge of COVID-19 and infection prevention and control strategies in healthcare settings: A global analysis. Infect. Control Hosp. Epidemiol. 2020, 41, 1196–1206. [Google Scholar] [CrossRef] [PubMed]
- Zheng, C.; Huang, W.Y.; Sheridan, S.; Sit, C.H.-P.; Chen, X.-K.; Wong, S.H.-S. COVID-19 Pandemic Brings a Sedentary Lifestyle in Young Adults: A Cross-Sectional and Longitudinal Study. Int. J. Environ. Res. Public Health 2020, 17, 6035. [Google Scholar] [CrossRef] [PubMed]
- McDowell, C.P.; Herring, M.P.; Lansing, J.; Brower, C.; Meyer, J.D. Working From Home and Job Loss Due to the COVID-19 Pandemic Are Associated With Greater Time in Sedentary Behaviors. Front. Public Health 2020, 8, 597619. [Google Scholar] [CrossRef]
- Tremblay, M.S.; Aubert, S.; Barnes, J.D.; Saunders, T.J.; Carson, V.; Latimer-Cheung, A.E.; Chastin, S.F.M.; Altenburg, T.M.; Chinapaw, M.J.M. Sedentary Behavior Research Network (SBRN)—Terminology Consensus Project process and outcome. Int. J. Behav. Nutr. Phys. Act. 2017, 14, 75. [Google Scholar] [CrossRef]
- Maugeri, G.; Castrogiovanni, P.; Battaglia, G.; Pippi, R.; D’Agata, V.; Palma, A.; Di Rosa, M.; Musumeci, G. The impact of physical activity on psychological health during COVID-19 pandemic in Italy. Heliyon 2020, 6, e04315. [Google Scholar] [CrossRef]
- Cheval, B.; Sivaramakrishnan, H.; Maltagliati, S.; Fessler, L.; Forestier, C.; Sarrazin, P.; Orsholits, D.; Chalabaev, A.; Sander, D.; Ntoumanis, N.; et al. Relationships between changes in self-reported physical activity, sedentary behaviour and health during the coronavirus (COVID-19) pandemic in France and Switzerland. J. Sports Sci. 2021, 39, 699–704. [Google Scholar] [CrossRef]
- Browne, R.A.V.; Macêdo, G.A.D.; Cabral, L.L.P.; Oliveira, G.T.A.; Vivas, A.; Fontes, E.B.; Elsangedy, H.M.; Costa, E.C. Initial impact of the COVID-19 pandemic on physical activity and sedentary behavior in hypertensive older adults: An accelerometer-based analysis. Exp. Gerontol. 2020, 142, 111121. [Google Scholar] [CrossRef]
- da Silva Santos, A.M.; Rossi, F.E.; Dos Santos Nunes de Moura, H.P.; de Sousa Junior, A.V.M.; Machado, D.C.D.; Neves, L.M.; Brito, A.S.; Moura, P.; Monteiro, P.A.; Freitas Junior, I.F.; et al. COVID-19 pandemic impacts physical activity levels and sedentary time but not sleep quality in young badminton athletes. Sport Sci. Health 2021, 17, 969–977. [Google Scholar] [CrossRef]
- Mishra, R.; Park, C.; York, M.K.; Kunik, M.E.; Wung, S.-F.; Naik, A.D.; Najafi, B. Decrease in Mobility during the COVID-19 Pandemic and Its Association with Increase in Depression among Older Adults: A Longitudinal Remote Mobility Monitoring Using a Wearable Sensor. Sensors 2021, 21, 3090. [Google Scholar] [CrossRef]
- Vetrovsky, T.; Frybova, T.; Gant, I.; Semerad, M.; Cimler, R.; Bunc, V.; Siranec, M.; Miklikova, M.; Vesely, J.; Griva, M.; et al. The detrimental effect of COVID-19 nationwide quarantine on accelerometer-assessed physical activity of heart failure patients. ESC Heart Fail. 2020, 7, 2093–2097. [Google Scholar] [CrossRef]
- Rezende, D.A.N.; Pinto, A.J.; Goessler, K.F.; Nicoletti, C.F.; Sieczkowska, S.M.; Meireles, K.; Esteves, G.P.; Genario, R.; Oliveira Júnior, G.N.; Santo, M.A.; et al. Influence of Adherence to Social Distancing Due to the COVID-19 Pandemic on Physical Activity Level in Post-bariatric Patients. Obes. Surg. 2021, 31, 1372–1375. [Google Scholar] [CrossRef]
- Maylor, B.D.; Zakrzewski-Fruer, J.K.; Stensel, D.J.; Orton, C.J.; Bailey, D.P. Effects of Frequency and Duration of Interrupting Sitting on Cardiometabolic Risk Markers. Int. J. Sports Med. 2019, 40, 818–824. [Google Scholar] [CrossRef]
- Dempsey, P.C.; Larsen, R.N.; Sethi, P.; Sacre, J.W.; Straznicky, N.E.; Cohen, N.D.; Cerin, E.; Lambert, G.W.; Owen, N.; Kingwell, B.A.; et al. Benefits for Type 2 Diabetes of Interrupting Prolonged Sitting With Brief Bouts of Light Walking or Simple Resistance Activities. Diabetes Care 2016, 39, 964–972. [Google Scholar] [CrossRef]
- Vai, B.; Mazza, M.G.; Colli, C.D.; Foiselle, M.; Allen, B.; Benedetti, F.; Borsini, A.; Dias, M.C.; Tamouza, R.; Leboyer, M.; et al. Mental disorders and risk of COVID-19-related mortality, hospitalisation, and intensive care unit admission: A systematic review and meta-analysis. Lancet Psychiatry 2021, 8, 797–812. [Google Scholar] [CrossRef]
- Sallis, R.; Young, D.R.; Tartof, S.Y.; Sallis, J.F.; Sall, J.; Li, Q.; Smith, G.N.; Cohen, D.A. Physical inactivity is associated with a higher risk for severe COVID-19 outcomes: A study in 48 440 adult patients. Br. J. Sports Med. 2021, 55, 1099–1105. [Google Scholar] [CrossRef] [PubMed]
- Young, D.R.; Sallis, J.F.; Baecker, A.; Cohen, D.A.; Nau, C.L.; Smith, G.N.; Sallis, R.E. Associations of Physical Inactivity and COVID-19 Outcomes Among Subgroups. Am. J. Prev. Med. 2023, 64, 492–502. [Google Scholar] [CrossRef] [PubMed]
- Burdorf, A.; Porru, F.; Rugulies, R. The COVID-19 (Coronavirus) pandemic: Consequences for occupational health. Scand. J. Work. Environ. Health 2020, 46, 229–230. [Google Scholar] [CrossRef] [PubMed]
- Bouziri, H.; Smith, D.R.M.; Descatha, A.; Dab, W.; Jean, K. Working from home in the time of COVID-19: How to best preserve occupational health? Occup. Environ. Med. 2020, 77, 509–510. [Google Scholar] [CrossRef]
- Odriozola-González, P.; Planchuelo-Gómez, Á.; Irurtia, M.J.; de Luis-García, R. Psychological effects of the COVID-19 outbreak and lockdown among students and workers of a Spanish university. Psychiatry Res. 2020, 290, 113108. [Google Scholar] [CrossRef]
- Fernández-García, Á.I.; Marin-Puyalto, J.; Gómez-Cabello, A.; Matute-Llorente, Á.; Subías-Perié, J.; Pérez-Gómez, J.; Lozano-Berges, G.; Mañas, A.; Guadalupe-Grau, A.; González-Gross, M.; et al. Impact of the Home Confinement Related to COVID-19 on the Device-Assessed Physical Activity and Sedentary Patterns of Spanish Older Adults. BioMed Res. Int. 2021, 2021, 5528866. [Google Scholar] [CrossRef]
- Trombert, A.R. La Declaración de Helsinki de Fortaleza (Brasil) 2013: Avances, retrocesos y retos pendientes. (A declaração de helsinki de fortaleza (brasil) 2013: Avanços, recuos e futuros desafios). Rev. Binacional Bras. Diálogo Ciênc. 2015, 4, 207–229. [Google Scholar]
- Sasaki, J.; Coutinho, A.; Santos, C.; Bertuol, C.; Minatto, G.; Berria, J.; Tonosaki, L.; Lima, L.; Marchesan, M.; Silveira, P.; et al. Orientações para utilização de acelerômetros no Brasil. Rev. Bras. Atividade Fís. Saúde 2017, 22, 110–126. [Google Scholar] [CrossRef]
- Freedson, P.S.; Melanson, E.; Sirard, J. Calibration of the Computer Science and Applications, Inc. accelerometer. Med. Sci. Sports Exerc. 1998, 30, 777–781. [Google Scholar] [CrossRef] [PubMed]
- Gurrola, P.G.M.; Balcázar, N.P.; Bonilla, M.M.P.; Virseda, H.A. Estrucura factorial y consistencia interna de la Escala de Ansiedad, Depresión y Estrés (DASS-21) en una muestra no clínica. Psicol. Cienc. Soc. 2006, 8, 3–7. [Google Scholar]
- Lovibond, S.H.; Lovibond, P.F.; Psychology Foundation of Australia. Manual for the Depression Anxiety Stress Scales, 2nd ed.; Psychology Foundation of Australia: Sydney, Australia, 1995; Available online: https://worldcat.org/title/222009504 (accessed on 8 July 2024).
- Mathieu, E.; Ritchie, H.; Ortiz-Ospina, E.; Roser, M.; Hasell, J.; Appel, C.; Giattino, C.; Rodés-Guirao, L. A global database of COVID-19 vaccinations. Nat. Hum. Behav. 2021, 5, 947–953. [Google Scholar] [CrossRef]
- Rees-Punia, E.; Newton, C.C.; Rittase, M.H.; Hodge, R.A.; Nielsen, J.; Cunningham, S.; Teras, L.R.; Patel, A. Prospective changes in physical activity, sedentary time and sleep during the COVID-19 pandemic in a US-based cohort study. BMJ Open 2021, 11, e053817. [Google Scholar] [CrossRef]
- Howard, B.; Winkler, E.A.H.; Sethi, P.; Carson, V.; Ridgers, N.D.; Salmon, J.; Healy, G.N.; Owen, N.; Dunstan, D.W. Associations of Low- and High-Intensity Light Activity with Cardiometabolic Biomarkers. Med. Sci. Sports Exerc. 2015, 47, 2093–2101. [Google Scholar] [CrossRef]
- Opdal, I.M.; Larsen, L.S.; Hopstock, L.A.; Schirmer, H.; Lorem, G.F. A prospective study on the effect of self-reported health and leisure time physical activity on mortality among an ageing population: Results from the Tromsø study. BMC Public Health 2020, 20, 575. [Google Scholar] [CrossRef]
- Xie, B.; Cai, X.; Zhu, Y.; Sun, Z.; Qiu, S.; Wu, T. Accelerometer-measured light-intensity physical activity and the risk of cardiovascular disease or death in older adults: A meta-analysis. Kardiol. Pol. 2022, 80, 774–781. [Google Scholar] [CrossRef]
- Ekelund, U.; Tarp, J.; Steene-Johannessen, J.; Hansen, B.H.; Jefferis, B.; Fagerland, M.W.; Whincup, P.; Diaz, K.M.; Hooker, S.P.; Chernofsky, A.; et al. Dose-response associations between accelerometry measured physical activity and sedentary time and all cause mortality: Systematic review and harmonised meta-analysis. BMJ 2019, 366, l4570. [Google Scholar] [CrossRef]
- Sadarangani, K.P.; De Roia, G.F.; Lobo, P.; Chavez, R.; Meyer, J.; Cristi-Montero, C.; Martinez-Gomez, D.; Ferrari, G.; Schuch, F.B.; Gil-Salmerón, A.; et al. Changes in Sitting Time, Screen Exposure and Physical Activity during COVID-19 Lockdown in South American Adults: A Cross-Sectional Study. Int. J. Environ. Res. Public Health 2021, 18, 5239. [Google Scholar] [CrossRef] [PubMed]
- Rapisarda, V.; Loreto, C.; De Angelis, L.; Simoncelli, G.; Lombardo, C.; Resina, R.; Mucci, N.; Matarazzo, A.; Vimercati, L.; Ledda, C. Home Working and Physical Activity during SARS-CoV-2 Pandemic: A Longitudinal Cohort Study. Int. J. Environ. Res. Public Health 2021, 18, 13021. [Google Scholar] [CrossRef] [PubMed]
- McCarthy, H.; Potts, H.W.W.; Fisher, A. Physical Activity Behavior Before, During, and After COVID-19 Restrictions: Longitudinal Smartphone-Tracking Study of Adults in the United Kingdom. J. Med. Internet Res. 2021, 23, e23701. [Google Scholar] [CrossRef] [PubMed]
- Barone Gibbs, B.; Kline, C.E.; Huber, K.A.; Paley, J.L.; Perera, S. COVID-19 shelter-at-home and work, lifestyle and well-being in desk workers. Occup. Med. 2021, 71, 86–94. [Google Scholar] [CrossRef]
- Salway, R.; Foster, C.; de Vocht, F.; Tibbitts, B.; Emm-Collison, L.; House, D.; Williams, J.G.; Breheny, K.; Reid, T.; Walker, R.; et al. Accelerometer-measured physical activity and sedentary time among children and their parents in the UK before and after COVID-19 lockdowns: A natural experiment. Int. J. Behav. Nutr. Phys. Act. 2022, 19, 51. [Google Scholar] [CrossRef]
- OMS. Available online: https://www.who.int/es/publications/i/item/9789240014886 (accessed on 8 July 2024).
- Myers, J.; Kokkinos, P.; Nyelin, E. Physical Activity, Cardiorespiratory Fitness, and the Metabolic Syndrome. Nutrients 2019, 11, 1652. [Google Scholar] [CrossRef]
- Booth, F.W.; Roberts, C.K.; Thyfault, J.P.; Ruegsegger, G.N.; Toedebusch, R.G. Role of Inactivity in Chronic Diseases: Evolutionary Insight and Pathophysiological Mechanisms. Physiol. Rev. 2017, 97, 1351–1402. [Google Scholar] [CrossRef]
- Katzmarzyk, P.T.; Friedenreich, C.; Shiroma, E.J.; Lee, I.M. Physical inactivity and non-communicable disease burden in low-income, middle-income and high-income countries. Br. J. Sports Med. 2022, 56, 101–106. [Google Scholar] [CrossRef]
- Tudor-Locke, C.; Craig, C.; Brown, W.; Clemes, S.; De Cocker, K.; Giles-Corti, B.; Hatano, Y.; Inoue, S.; Matsudo, S.; Mutrie, N.; et al. How many steps are enough? For adults. Int. J. Behav. Nutr. Phys. Act. 2011, 8, 79. [Google Scholar] [CrossRef]
- Rowlands, A.V.; Henson, J.J.; Coull, N.A.; Edwardson, C.L.; Brady, E.; Hall, A.; Khunti, K.; Davies, M.; Yates, T. The impact of COVID-19 restrictions on accelerometer-assessed physical activity and sleep in individuals with type 2 diabetes. Diabet. Med. 2021, 38, e14549. [Google Scholar] [CrossRef]
- Hall, K.S.; Hyde, E.T.; Bassett, D.R.; Carlson, S.A.; Carnethon, M.R.; Ekelund, U.; Evenson, K.R.; Galuska, D.A.; Kraus, W.E.; Lee, I.M.; et al. Systematic review of the prospective association of daily step counts with risk of mortality, cardiovascular disease, and dysglycemia. Int. J. Behav. Nutr. Phys. Act. 2020, 17, 78. [Google Scholar] [CrossRef] [PubMed]
- Dwyer, T.; Pezic, A.; Sun, C.; Cochrane, J.; Venn, A.; Srikanth, V.; Jones, G.; Shook, R.P.; Sui, X.; Ortaglia, A.; et al. Objectively Measured Daily Steps and Subsequent Long Term All-Cause Mortality: The Tasped Prospective Cohort Study. PLoS ONE 2015, 10, e0141274. [Google Scholar] [CrossRef]
- Climie, R.E.; Grace, M.S.; Larsen, R.L.; Dempsey, P.C.; Oberoi, J.; Cohen, N.D.; Owen, N.; Kingwell, B.A.; Dunstan, D.W. Regular brief interruptions to sitting after a high-energy evening meal attenuate glycemic excursions in overweight/obese adults. Nutr. Metab. Cardiovasc. Dis. 2018, 28, 909–916. [Google Scholar] [CrossRef] [PubMed]
- Quinn, T.D.; Gabriel, K.P.; Siddique, J.; Aaby, D.; Whitaker, K.M.; Lane-Cordova, A.; Sidney, S.; Sternfield, B.; Gibbs, B.B. Sedentary behavior and physical activity across occupational classifications. Am. J. Health Promot. 2019, 34, 247–256. [Google Scholar] [CrossRef]
- Hooker, S.P.; Diaz, K.M.; Blair, S.N.; Colabianchi, N.; Hutto, B.; McDonnell, M.N.; Vena, J.E.; Howard, V.J. Association of Accelerometer-Measured Sedentary Time and Physical Activity With Risk of Stroke Among US Adults. JAMA Netw. Open 2022, 5, e2215385. [Google Scholar] [CrossRef]
- Ekelund, U.; Brown, W.J.; Steene-Johannessen, J.; Fagerland, M.W.; Owen, N.; Powell, K.E.; Bauman, A.E.; Lee, I.-M. Do the associations of sedentary behaviour with cardiovascular disease mortality and cancer mortality differ by physical activity level? A systematic review and harmonised meta-analysis of data from 850 060 participants. Br. J. Sports Med. 2019, 53, 886–894. [Google Scholar] [CrossRef]
- Bjørk Petersen, C.; Bauman, A.; Grønbæk, M.; Wulff Helge, J.; Thygesen, L.C.; Tolstrup, J.S. Total sitting time and risk of myocardial infarction, coronary heart disease and all-cause mortality in a prospective cohort of Danish adults. Int. J. Behav. Nutr. Phys. Act. 2014, 11, 13. [Google Scholar] [CrossRef]
- Silva, F.M.; Petrica, J.; Serrano, J.; Paulo, R.; Ramalho, A.; Lucas, D.; Ferreira, J.P.; Duarte-Mendes, P. The Sedentary Time and Physical Activity Levels on Physical Fitness in the Elderly: A Comparative Cross Sectional Study. Int. J. Environ. Res. Public Health 2019, 16, 3697. [Google Scholar] [CrossRef]
- Gennuso, K.P.; Gangnon, R.E.; Matthews, C.E.; Thraen-Borowski, K.M.; Colbert, L.H. Sedentary behavior, physical activity, and markers of health in older adults. Med. Sci. Sports Exerc. 2013, 45, 1493–1500. [Google Scholar] [CrossRef]
- Le Roux, E.; De Jong, N.P.; Blanc, S.; Simon, C.; Bessesen, D.H.; Bergouignan, A. Physiology of physical inactivity, sedentary behaviors and non exercise activity: Insights from space bedrest model. J. Physiol. 2022, 600, 1037–1051. [Google Scholar] [CrossRef]
- Buffey, A.J.; Herring, M.P.; Langley, C.K.; Donnelly, A.E.; Carson, B.P. The Acute Effects of Interrupting Prolonged Sitting Time in Adults with Standing and Light-Intensity Walking on Biomarkers of Cardiometabolic Health in Adults: A Systematic Review and Meta-analysis. Sports Med. 2022, 52, 1765–1787. [Google Scholar] [CrossRef]
- Ozamiz-Etxebarria, N.; Berasategi Santxo, N.; Idoiaga Mondragon, N.; Dosil Santamaría, M. The Psychological State of Teachers During the COVID-19 Crisis: The Challenge of Returning to Face-to-Face Teaching. Front. Psychol. 2020, 11, 620718. [Google Scholar] [CrossRef]
- Stults-Kolehmainen, M.A.; Sinha, R. The effects of stress on physical activity and exercise. Sports Med. 2014, 44, 81–121. [Google Scholar] [CrossRef]
- Schuch, F.B.; Vancampfort, D.; Firth, J.; Rosenbaum, S.; Ward, P.B.; Silva, E.S.; Hallgren, M.; De Leon, A.P.; Dunn, A.L.; Deslandes, A.C.; et al. Physical Activity and Incident Depression: A Meta-Analysis of Prospective Cohort Studies. Am. J. Psychiatry 2018, 175, 631–648. [Google Scholar] [CrossRef]
- Meng, Y.; Ma, N.; Shi, Y.; Zhang, N.; Wu, J.; Cui, X.; Niu, W. The association of physical activity and sedentary behavior with depression in US adults: NHANES 2007–2018. Front. Public Health 2024, 12, 1404407. [Google Scholar] [CrossRef]

| Features | First Phase (n = 37) Mean ± SD or n (%) | Second Phase (n = 37) Mean ± SD or n (%) | p |
|---|---|---|---|
| Male | 19 (51.4) | 19 (51.4) | N/A |
| Female | 18 (48.6) | 18 (48.6) | N/A |
| Age (years) | 46.27 ± 7.0 | 47.27 ± 7.1 | N/A |
| Weight (kg) | 73.95 ± 13.1 | 74.35 ± 14.5 | 0.62 a |
| Body Mass Index (kg/m2) | 27.20 ± 4.1 | 27.41 ± 4.8 | 0.50 a |
| Normal weight Overweight Obesity | 8 (22.2) 22 (59.5) 7 (18.9) | 11 (29.7) 19 (51.4) 7 (18.9) | 0.001 b |
| Waist circumference (cm) | 92.42 ± 11.45 | 88.18 ± 12.35 | 0.0001 a |
| Energy consumption (kcal/día) | 1762.08 ± 481.4 | 1881.8 ± 476.9 | 0.62 a |
| Carbohydrates (%) | 48.43 ± 7.98 | 40.07 ± 14.63 | 0.006 a |
| Proteins (%) | 18.25 ± 3.97 | 21.45 ± 7.74 | 0.031 a |
| Lipids (%) | 33.30 ± 7.17 | 38.67 ± 9.35 | 0.007 a |
| Days wearing the accelerometer | n = 45 | n = 37 | |
| 7 days | 30 (66.6) | 23 (62.16) | N/A |
| 6 days | 14 (31.1) | 11 (29.7) | N/A |
| 5 days | 1 (2.2) | 2 (5.40) | N/A |
| 4 days | 1 (2.7) | N/A | |
| Average time wearing the accelerometer (min/day) | 854.0 (719.0–1140.8) | 875.64 (653.0–1366.0) | N/A |
| Psychological Aspects | First Phase (n = 37) n (%) | Second Phase (n = 37) n (%) | p b |
|---|---|---|---|
| Depression | |||
| Normal | 29 (78.3) | 34 (91.9) | 0.0001 |
| Mild | 1 (2.7) | 2 (5.4) | |
| Moderate | 5 (13.5) | (0) | |
| Severe | 0 (0) | 1 (2.7) | |
| Extremely severe | 2 (5.6) | 0 (0) | |
| Anxiety | |||
| Normal | 31 (83.3) | 29 (78.4) | 0.0001 |
| Mild | 0 (0) | 4 (10.8) | |
| Moderate | 4 (10.8) | 3 (8.1) | |
| Severe | 0 (0) | 0 (0) | |
| Extremely severe | 2 (5.4) | 1 (2.7) | |
| Stress | |||
| Normal | 28 (75) | 29 (78.4) | 0.0001 |
| Mild | 2 (5.4) | 4 (10.8) | |
| Moderate | 4 (10.8) | 1 (2.7) | |
| Severe | 3 (8.1) | 2 (5.4) | |
| Extremely severe | 0 (0) | 1 (2.7) | |
| Variable | Depression (r) | Anxiety (r) | Stress (r) | BMI (kg/m2) (r) | WC (cm) (r) |
|---|---|---|---|---|---|
| Steps per day | 0.153 | 0.027 | −0.055 | −0.497 ** | −0.411 * |
| 95% CI | [−0.206, 0.457] | [−0.286, 0.339] | [−0.336, 0.302] | [−0.696, −0.225] | [−0.648, −0.094] |
| Light PA (min/day) | −0.074 | −0.016 | −0.284 | 0.163 | 0.062 |
| 95% CI | [−0.389, 0.222] | [−0.357, 0.362] | [−0.574, 0.090] | [−0.115, 0.450] | [−0.254, 0.408] |
| Moderate PA (min/day) | 0.174 | −0.073 | −0.006 | −0.474 ** | −0.278 |
| 95% CI | [−0.174, 0.302] | [−0.416, 0.256] | [−0.323, 0.311] | [−0.689, −0.225] | [−0.589, 0.084] |
| Vigorous PA (min/day) | 0.411 | 0.126 | 0.304 | −0.418 ** | −0.325 * |
| 95% CI | [0.084, 0.669] | [−0.227, 0.451] | [0.001, 0.553] | [−0.673, −0.132] | [−0.610, −0.019] |
| MVPA (min/week) | 0.213 | −0.035 | −0.033 | −0.534 ** | −0.324 * |
| 95% CI | [−0.133, 0.520] | [−0.364, 0.290] | [−0.280, 0.345] | [−0.711, −0.301] | [−0.631, 0.039] |
| Total PA (min/day) | −0.047 | −0.071 | −0.249 | −0.026 | −0.081 |
| 95% CI | [−0.376, 0.267] | [−0.395, 0.295] | [−0.549, 0.094] | [−0.327, 0.296] | [−0.393, 0.253] |
| SBT (min/day) | 0.187 | 0.119 | 0.022 | 0.163 | 0.300 * |
| 95% CI | [−0.137, 0.461] | [−0.211, 0.445] | [−0.315, 0.416] | [−0.133, 0.480] | [−0.043, 0.581] |
| SBT ≥ 30 min (periods/day) | 0.163 | 0.105 | 0.096 | −0.010 | 0.019 |
| 95% CI | [−0.286, 0.353] | [−0.322, 0.357] | [−0.259, 0.458] | [−0.303, 0.383] | [−0.275, 0.396] |
| ABs ≥ 3 min (bouts/day) | 0.280 | −0.014 | −0.001 | −0.280 | −0.132 |
| 95% CI | [−0.278, 0.384] | [−0.384, 0.283] | [−0.426, 0.336] | [−0.243, 0.358] | [−0.244, 0.395] |
| Depression (points) | 1.000 | 0.484 ** | 0.511 ** | −0.176 | −0.111 |
| 95% CI | [1.000, 1.000] | [0.181, 0.713] | [0.177, 0.756] | [−0.520, 0.234] | [−0.413, 0.269] |
| Anxiety (points) | 0.488 ** | 1.000 | 0.660 ** | −0.036 | 0.012 |
| 95% CI | [0.181, 0.713] | [1.000, 1.000] | [0.375, 0.822] | [−0.377, 0.320] | [−0.306, 0.332] |
| Stress (points) | 0.511 ** | 0.660 ** | 1.000 | −0.087 | 0.043 |
| 95% CI | [0.177, 0.756] | [0.375, 0.822] | [1.000, 1.000] | [−0.420, 0.271] | [−0.284, 0.374] |
| Dependent Variable | Independent Variable | β | p |
|---|---|---|---|
| Stress | LPA (min/day) | −0.027 | 0.03 |
| BMI (kg/m2) | MVPA (min/day) | −0.116 | 0.01 |
| BMI (kg/m2) | Steps per day | −0.0007 | 0.02 |
| Waist circumference (cm) | Steps per day | −0.002 | 0.04 |
| Waist circumference (cm) | SBT (min/día) | 0.0351 | 0.05 |
Disclaimer/Publisher’s Note: The statements, opinions and data contained in all publications are solely those of the individual author(s) and contributor(s) and not of MDPI and/or the editor(s). MDPI and/or the editor(s) disclaim responsibility for any injury to people or property resulting from any ideas, methods, instructions or products referred to in the content. |
© 2025 by the authors. Licensee MDPI, Basel, Switzerland. This article is an open access article distributed under the terms and conditions of the Creative Commons Attribution (CC BY) license (https://creativecommons.org/licenses/by/4.0/).
Share and Cite
Navarro-Flores, L.M.; Vivas-Sánchez, B.J.; De La Roca-Chiapas, J.M.; Rodrigues Matsudo, V.K.; Macias, M.H.; Vargas-Ortiz, K. Physical Activity and Psychological Symptoms in University Teachers Improved Post-COVID-19 Lockdown, but Sedentary Behavior Persisted. Healthcare 2025, 13, 1772. https://doi.org/10.3390/healthcare13151772
Navarro-Flores LM, Vivas-Sánchez BJ, De La Roca-Chiapas JM, Rodrigues Matsudo VK, Macias MH, Vargas-Ortiz K. Physical Activity and Psychological Symptoms in University Teachers Improved Post-COVID-19 Lockdown, but Sedentary Behavior Persisted. Healthcare. 2025; 13(15):1772. https://doi.org/10.3390/healthcare13151772
Chicago/Turabian StyleNavarro-Flores, Laura M., Brajan J. Vivas-Sánchez, Jose María De La Roca-Chiapas, Victor K. Rodrigues Matsudo, Maciste H. Macias, and Katya Vargas-Ortiz. 2025. "Physical Activity and Psychological Symptoms in University Teachers Improved Post-COVID-19 Lockdown, but Sedentary Behavior Persisted" Healthcare 13, no. 15: 1772. https://doi.org/10.3390/healthcare13151772
APA StyleNavarro-Flores, L. M., Vivas-Sánchez, B. J., De La Roca-Chiapas, J. M., Rodrigues Matsudo, V. K., Macias, M. H., & Vargas-Ortiz, K. (2025). Physical Activity and Psychological Symptoms in University Teachers Improved Post-COVID-19 Lockdown, but Sedentary Behavior Persisted. Healthcare, 13(15), 1772. https://doi.org/10.3390/healthcare13151772