_MD__MPH_PhD.png)
Unpacking Digital Dashboards’ Influence on Preventive Health Behavior Among Young Adults †


Abstract
1. Introduction
1.1. Psychosocial Beliefs, PHBs, and Dashboards
1.1.1. Dashboards as a Health Intervention
1.1.2. Actionable Dashboards and PHBs
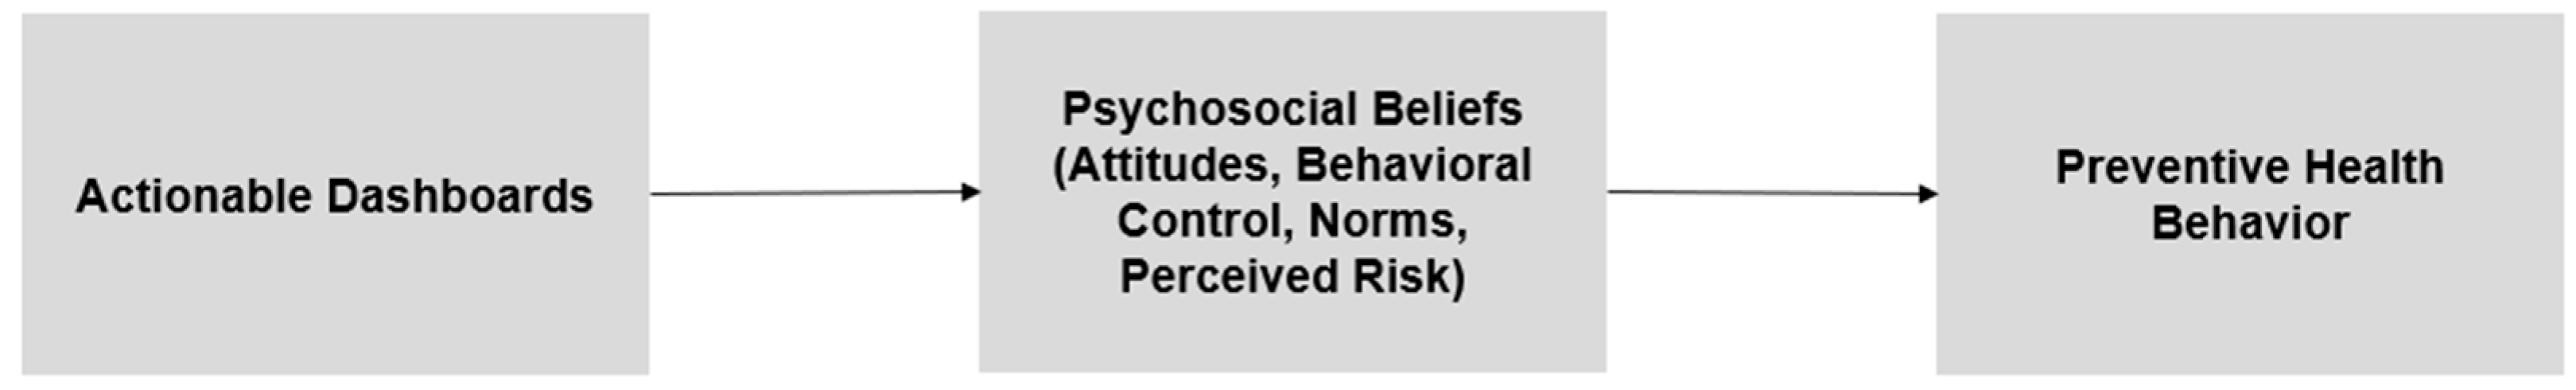
1.1.3. Dashboards, Psychosocial Beliefs, and PHBs
1.2. Overview of Experimental Studies
2. Materials and Methods—Study 1
2.1. Design and Participants
2.2. Procedure and Dashboard Intervention
2.3. Measures
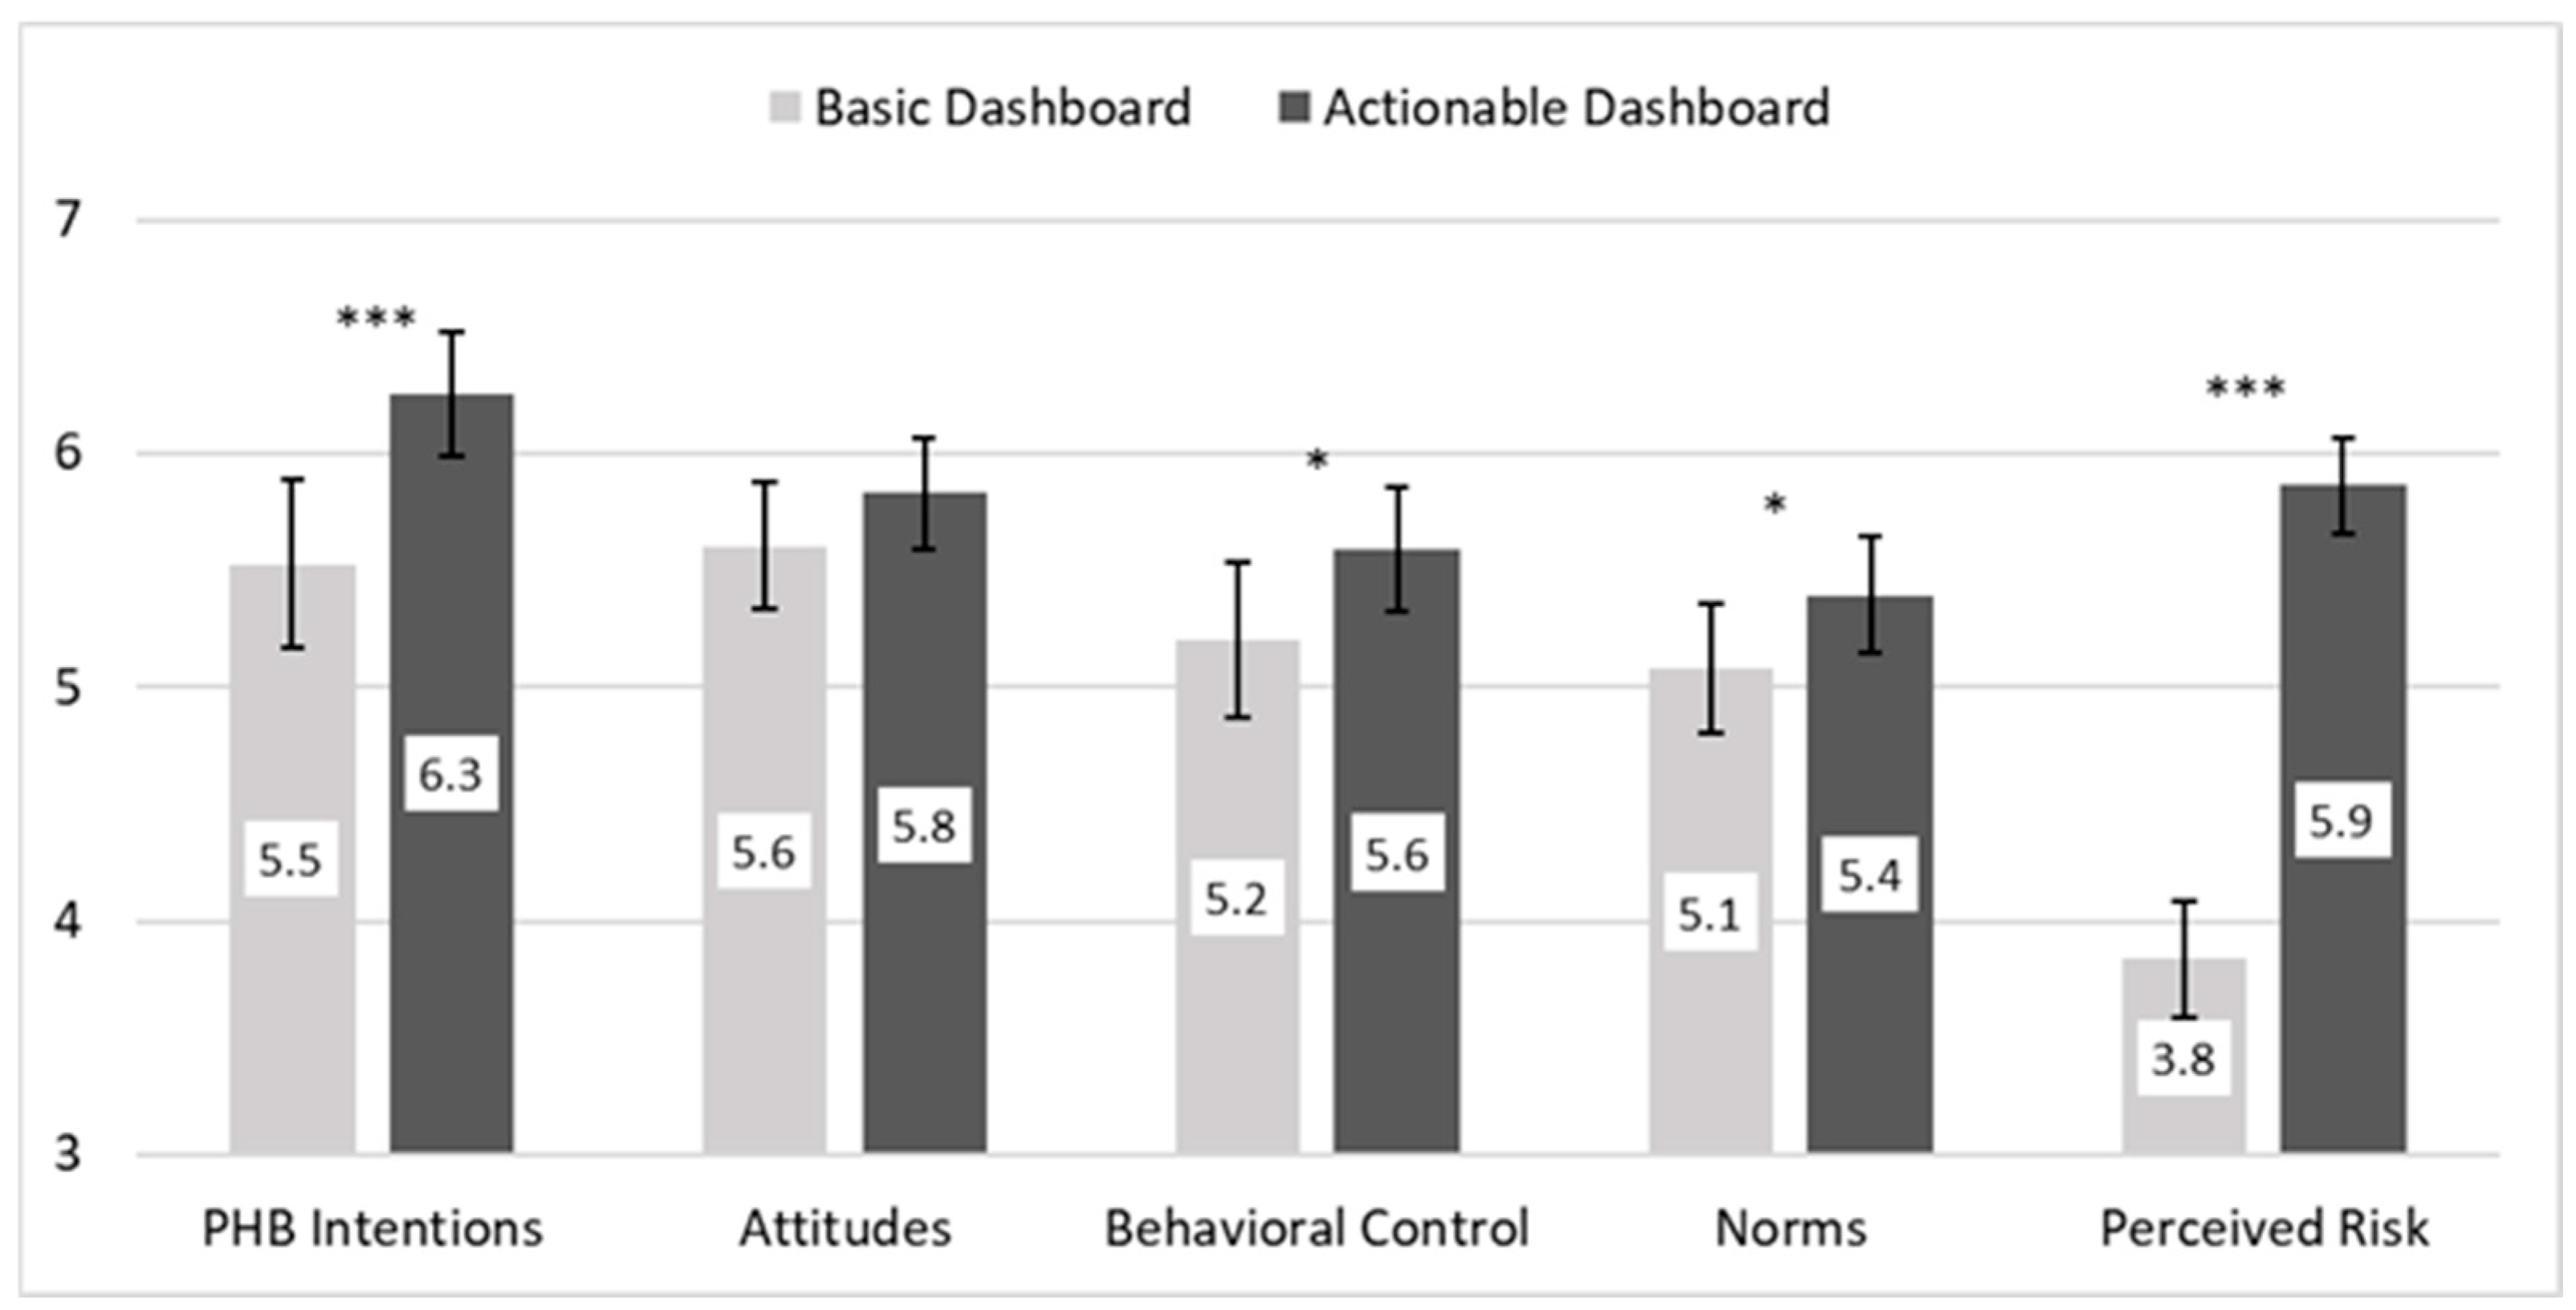
3. Results—Study 1
4. Discussion—Study 1 and Segue to Study 2
5. Materials and Methods—Study 2
5.1. Design and Participants
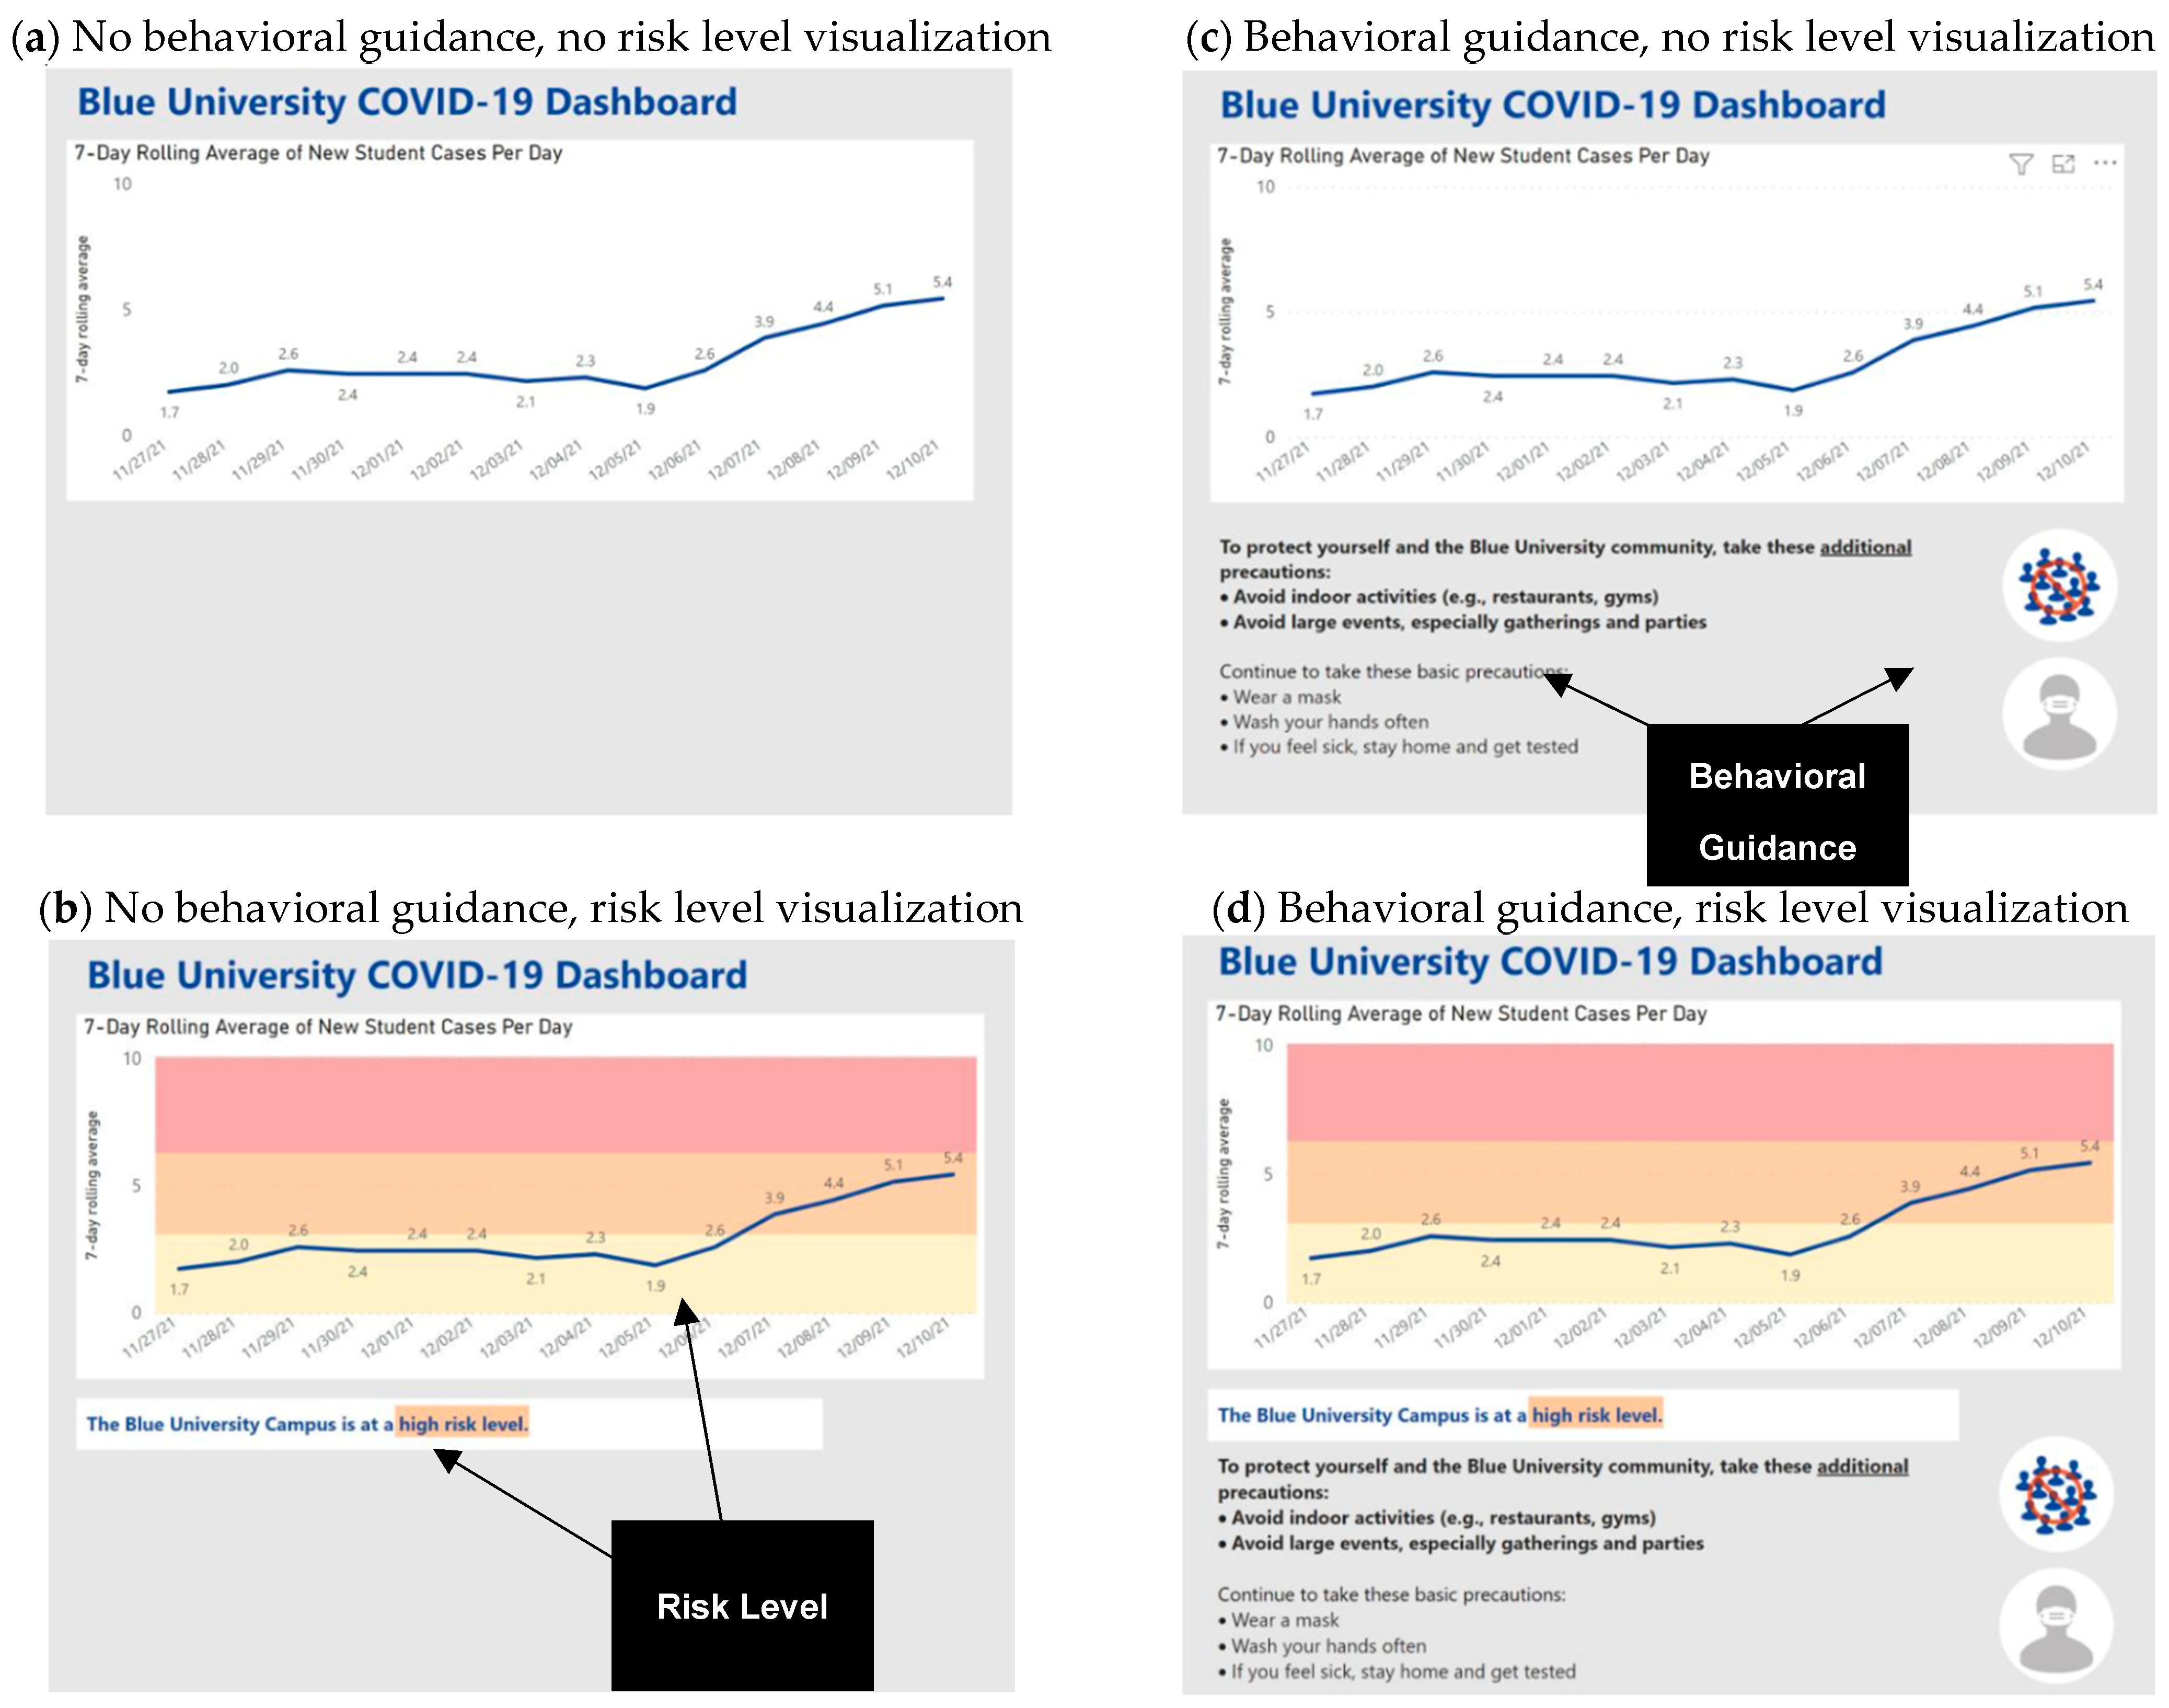
5.2. Procedure and Dashboard Interventions
5.3. Measures
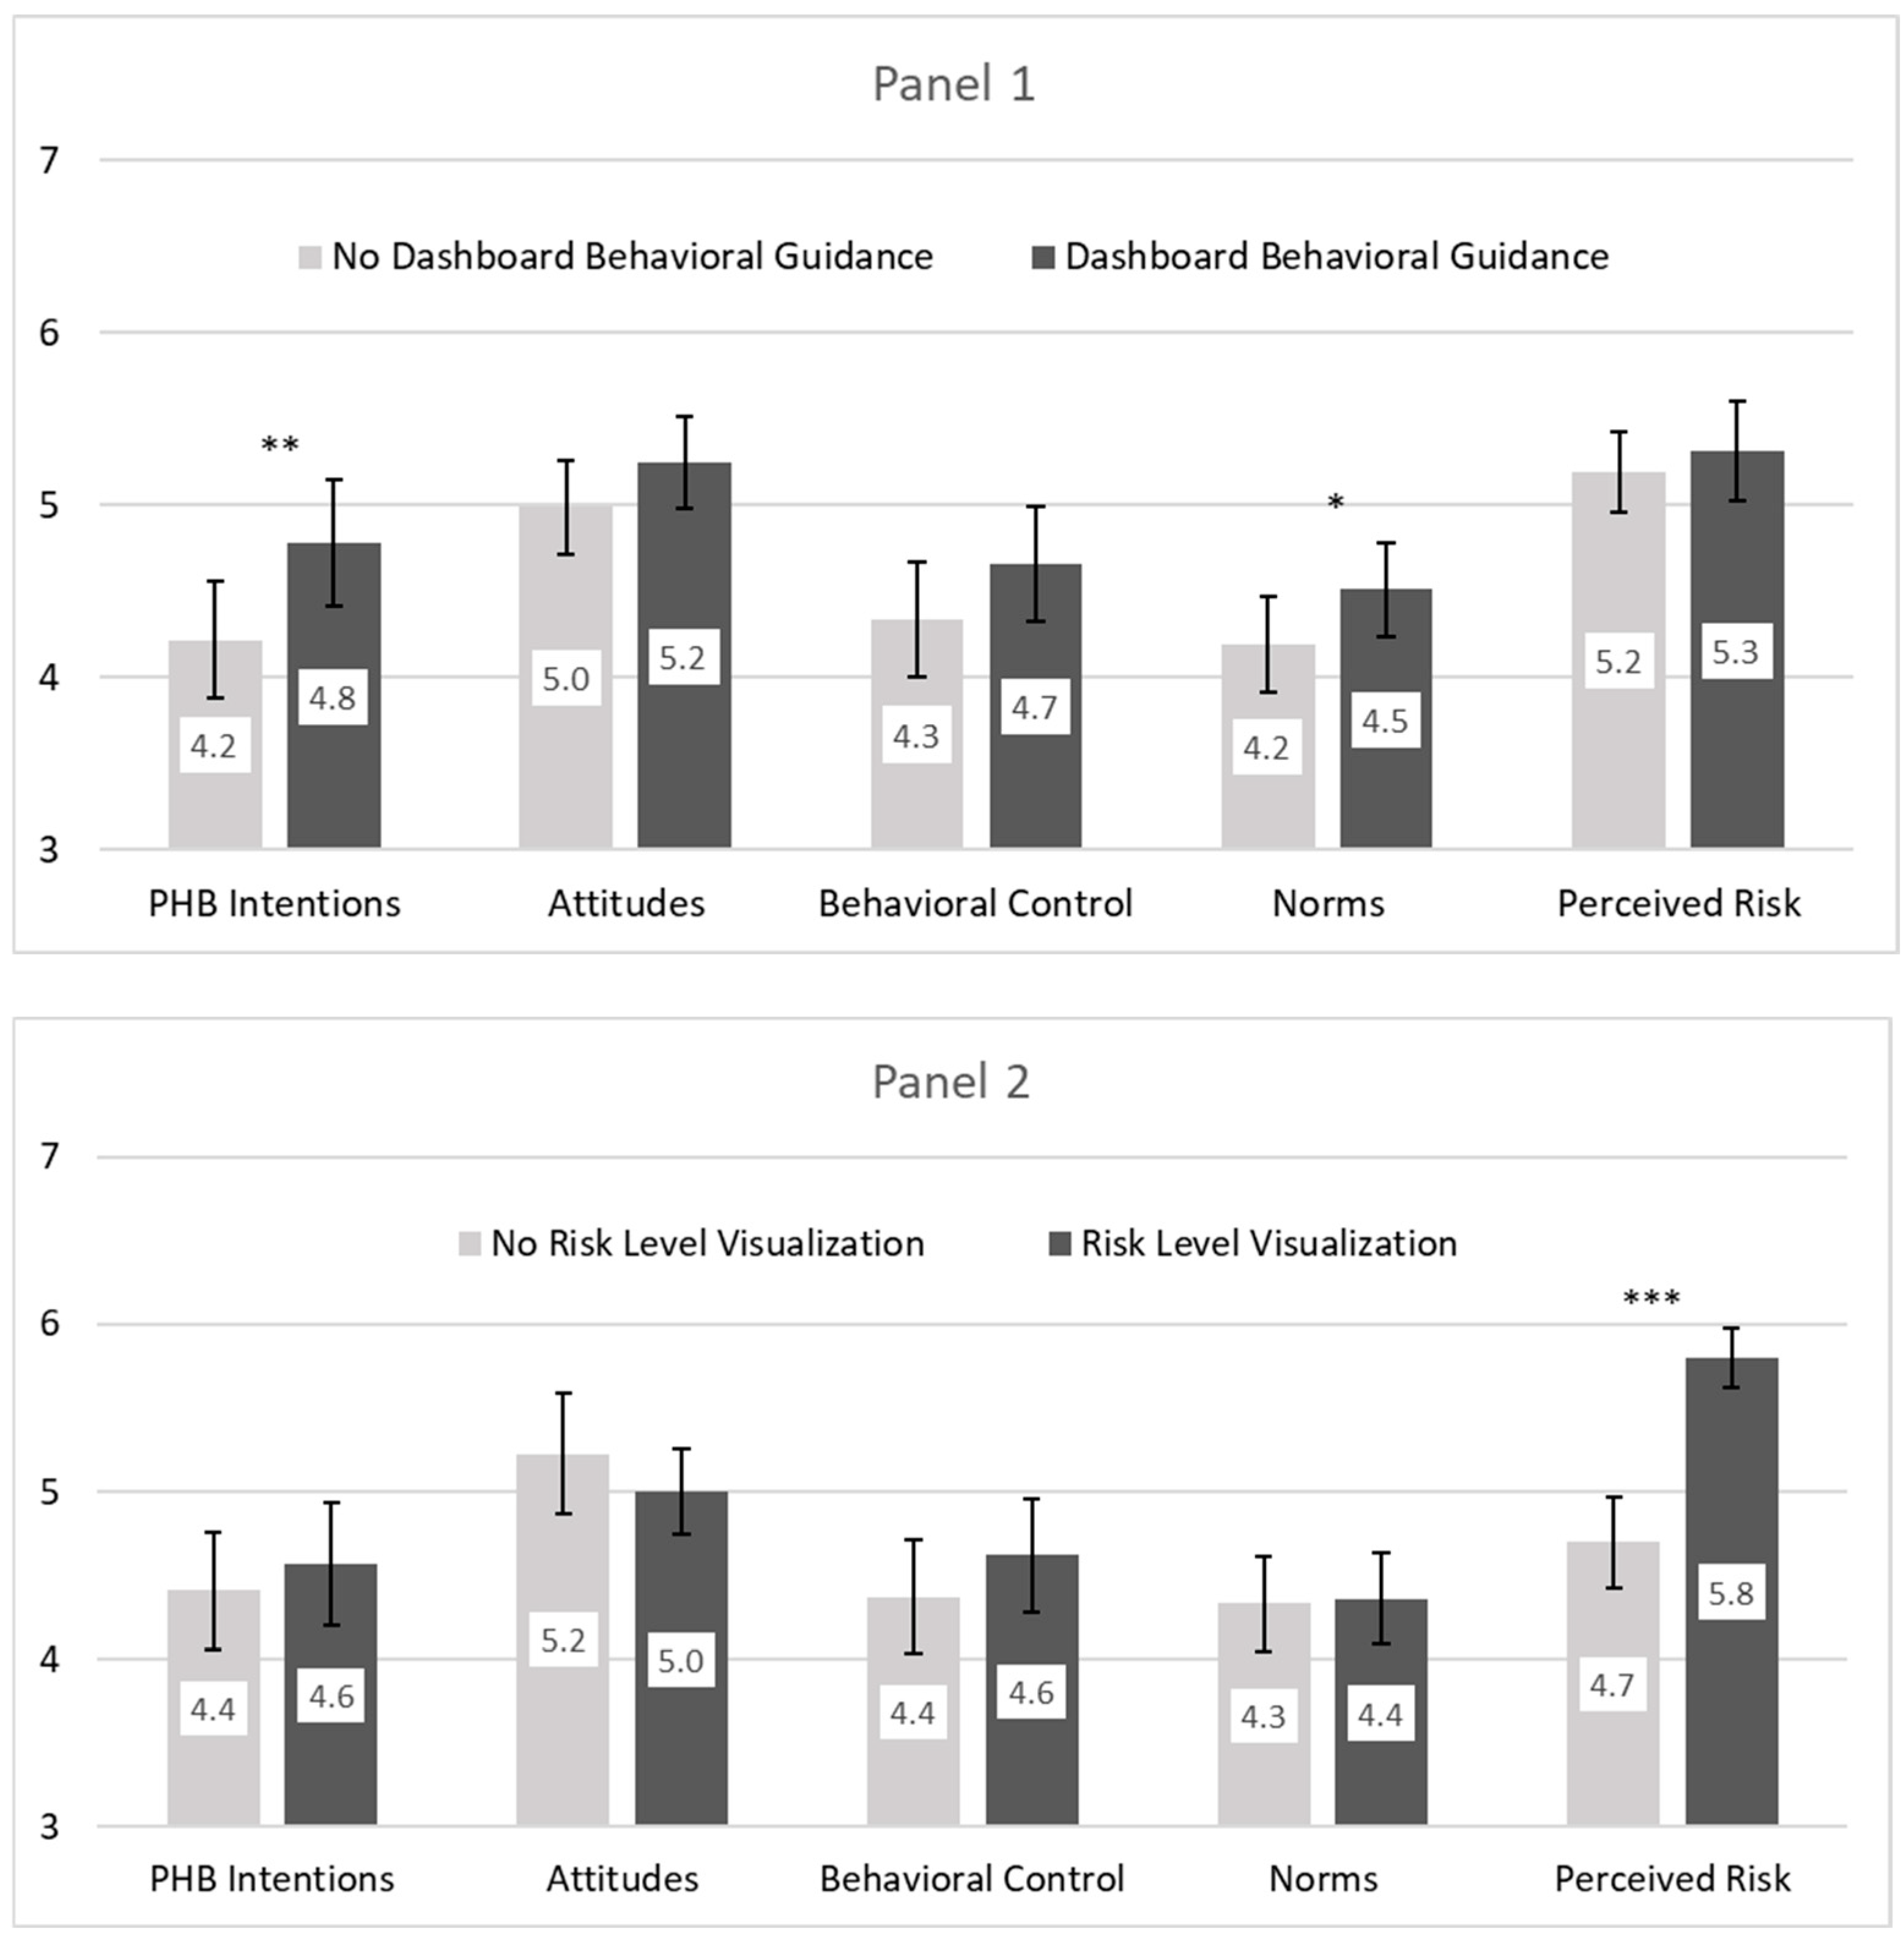
6. Results—Study 2
7. Discussion
7.1. Actionable Dashboards and the Importance of Behavioral Guidance
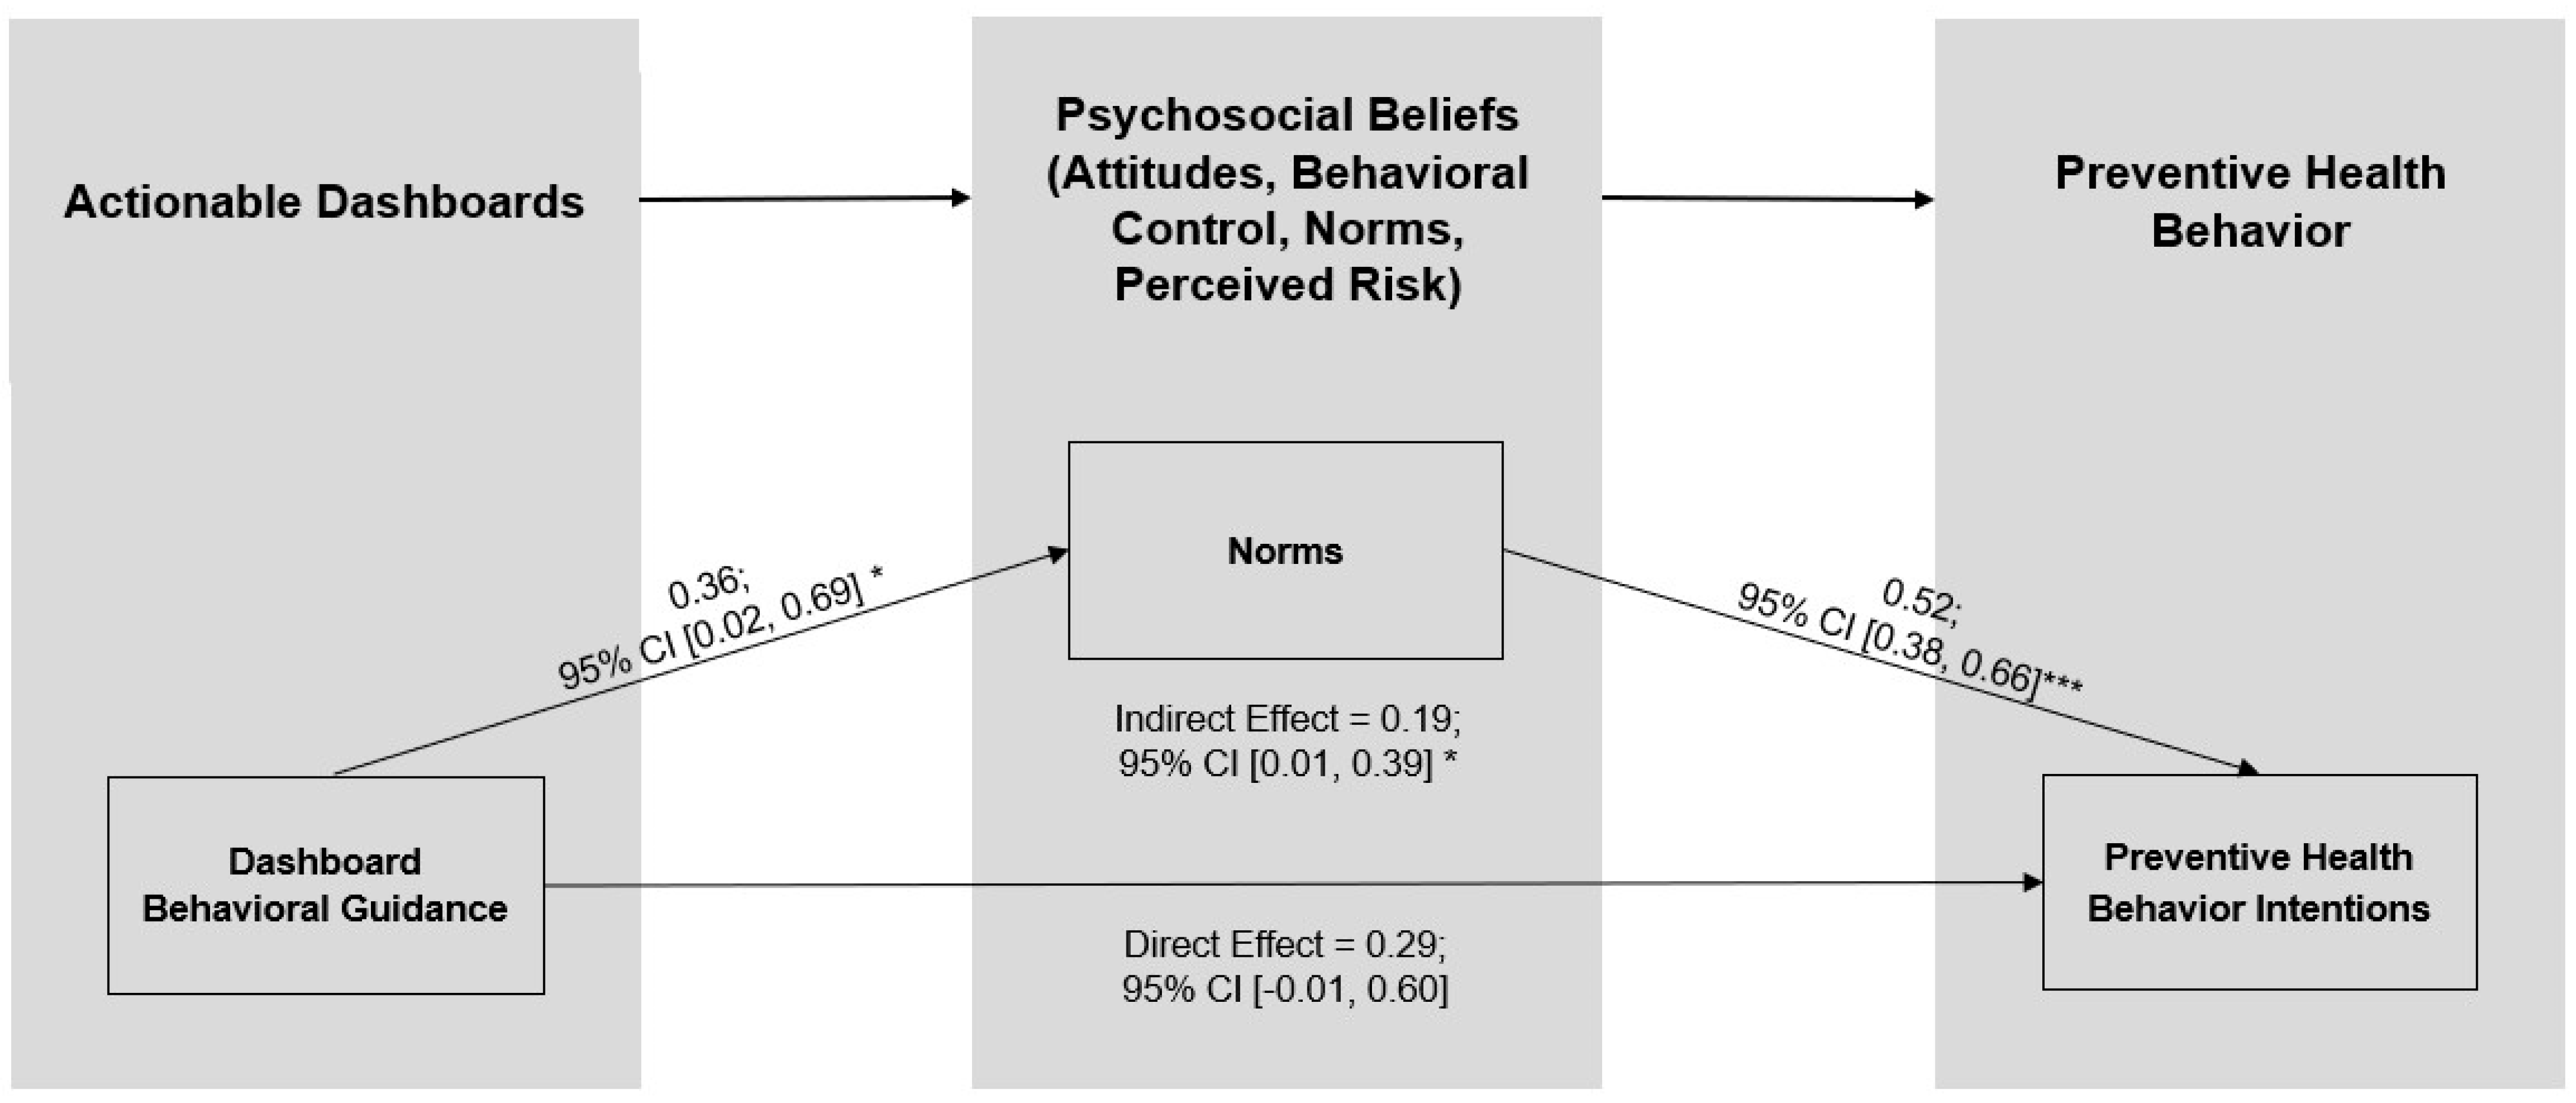
7.2. Actionable Dashboards, TPB Psychosocial Beliefs, and the Mediating Role of Norms
7.3. Limitations and Future Research
8. Conclusions
Author Contributions
Funding
Institutional Review Board Statement
Informed Consent Statement
Data Availability Statement
Acknowledgments
Conflicts of Interest
Abbreviations
| PHB | Preventive health behavior |
| TPB | Theory of planned behavior |
Appendix A

| M | SD | 1 | 2 | 3 | 4 | 5 | 6 | 7 | 8 | ||
|---|---|---|---|---|---|---|---|---|---|---|---|
| 1 | Actionable dashboard | 0.00 | 0.50 | - | |||||||
| 2 | Male gender | −0.02 | 0.50 | −0.08 | - | ||||||
| 3 | Fear of COVID | 3.18 | 1.70 | −0.12 | −0.32 *** | - | |||||
| 4 | Attitudes | 5.72 | 1.27 | 0.09 | −0.21 ** | 0.35 *** | - | ||||
| 5 | Behavioral control | 5.40 | 1.52 | 0.12 | −0.14 | 0.31 *** | 0.61 *** | - | |||
| 6 | Norms | 5.24 | 1.32 | 0.12 | −0.22 ** | 0.33 *** | 0.63 *** | 0.53 *** | - | ||
| 7 | Perceived risk | 4.83 | 1.53 | 0.67 *** | −0.11 | 0.04 | 0.17 * | 0.11 | 0.29 *** | - | |
| 8 | PHB intentions | 5.89 | 1.62 | 0.22 ** | −0.25 *** | 0.32 *** | 0.60 *** | 0.55 *** | 0.66 *** | 0.31 *** | - |
| M | SD | 1 | 2 | 3 | 4 | 5 | 6 | 7 | 8 | 9 | ||
|---|---|---|---|---|---|---|---|---|---|---|---|---|
| 1 | Behavioral guidance | −0.02 | 0.50 | - | ||||||||
| 2 | Risk level visualization | 0.00 | 0.50 | 0.02 | - | |||||||
| 3 | Male | −0.04 | 0.50 | −0.06 | 0.01 | - | ||||||
| 4 | Fear of COVID | 2.71 | 1.52 | −0.04 | −0.04 | −0.30 *** | - | |||||
| 5 | Attitudes | 5.11 | 1.43 | 0.09 | −0.08 | −0.21 ** | 0.28 *** | - | ||||
| 6 | Behavioral control | 4.49 | 1.78 | 0.09 | 0.07 | −0.16 * | 0.32 *** | 0.54 *** | - | |||
| 7 | Norms | 4.35 | 1.47 | 0.11 | 0.01 | −0.25 *** | 0.46 *** | 0.53 *** | 0.58 *** | - | ||
| 8 | Perceived risk | 5.25 | 1.34 | 0.05 | 0.41 *** | −0.13 | 0.18 ** | 0.27 *** | 0.22 ** | 0.31 *** | - | |
| 9 | PHB intentions | 4.49 | 1.90 | 0.15 * | 0.04 | −0.27 *** | 0.51 *** | 0.50 *** | 0.61 *** | 0.73 *** | 0.41 *** | - |
References
- Margraf, J.; Brailovskaia, J.; Schneider, S. Adherence to behavioral COVID-19 mitigation measures strongly predicts mortality. PLoS ONE 2021, 16, e0249392. [Google Scholar] [CrossRef] [PubMed]
- Banholzer, N.; van Weenen, E.; Lison, A.; Cenedese, A.; Seeliger, A.; Kratzwald, B.; Tschernutter, D.; Salles, J.P.; Bottrighi, P.; Lehtinen, S.; et al. Estimating the effects of non-pharmaceutical interventions on the number of new infections with COVID-19 during the first epidemic wave. PLoS ONE 2021, 16, e0252827. [Google Scholar] [CrossRef] [PubMed]
- Centers for Disease Control and Prevention. How to Protect Yourself and Others. 2022. Available online: https://www.cdc.gov/coronavirus/2019-ncov/prevent-getting-sick/prevention.html (accessed on 25 January 2022).
- Mukhtar, H.; Ahmad, H.F.; Khan, M.Z.; Ullah, N. Analysis and Evaluation of COVID-19 Web Applications for Health Professionals: Challenges and Opportunities. Healthcare 2020, 8, 466. [Google Scholar] [CrossRef]
- Alhewiti, A. eHealth Literacy and Trust in Health Information Sources. Healthcare 2025, 13, 616. [Google Scholar] [CrossRef]
- Zhao, B.; Kim, M.; Nam, E.W. Information disclosure contents of the COVID-19 data dashboard websites for South Korea, China, and Japan: A comparative study. Healthcare 2021, 9, 1487. [Google Scholar] [CrossRef]
- Leung, G.M.; Lam, T.-H.; Ho, L.-M.; Ho, S.-Y.; Chan, B.H.Y.; Wong, I.O.L.; Hedley, A.J. The impact of community psychological responses on outbreak control for severe acute respiratory syndrome in Hong Kong. J. Epidemiol. Community Health 2003, 57, 857–863. [Google Scholar] [CrossRef]
- Norman, P.; Wilding, S.; Conner, M. Reasoned action approach and compliance with recommended behaviours to prevent the transmission of the SARS-CoV-2 virus in the UK. Br. J. Health Psychol. 2020, 25, 1006–1019. [Google Scholar] [CrossRef]
- Kulikowski, K.; Przytuła, S.; Sułkowski, Ł.; Rašticová, M. Technostress of students during COVID-19-a sign of the time? Hum. Technol. 2022, 18, 234–249. [Google Scholar] [CrossRef]
- O’Toole, T.; Burke, M.D.; Denny, T. COVID-19 Testing Strategies for Colleges and Universities; National Academies of Sciences, Engineering, and Medicine: Washington, DC, USA, 2020. [Google Scholar]
- Zalaznick, M. 14 Colleges Get Top Marks for COVID Dashboards; University Business: Beach, FL, USA, 2020. [Google Scholar]
- Schulze, A.; Brand, F.; Geppert, J.; Böl, G.-F. Digital dashboards visualizing public health data: A systematic review. Front. Public Health 2023, 11, 999958. [Google Scholar] [CrossRef]
- Oh, J.; Lim, H.S.; Copple, J.G.; Chadraba, E.K. Harnessing the persuasive potential of data: The combinatory effects of data visualization and interactive narratives on obesity perceptions and policy attitudes. Telemat. Inform. 2018, 35, 1755–1769. [Google Scholar] [CrossRef]
- Cotter, L.M.; Yang, S. Are interactive and tailored data visualizations effective in promoting flu vaccination among the elderly? Evidence from a randomized experiment. J. Am. Med. Inform. Assoc. 2024, 31, 317–328. [Google Scholar] [CrossRef] [PubMed]
- Montano, D.E.; Kasprzyk, D. Theory of reasoned action, theory of planned behavior, and the integrated behavioral model. In Health Behavior and Health Education: Theory, Research and Practice; Glanz, K., Rimer, B.K., Viswanath, K., Eds.; John Wiley & Sons: San Francisco, CA, USA, 2008; pp. 67–96. [Google Scholar]
- Ajzen, I. The theory of planned behavior. Organ. Behav. Hum. Decis. Process. 1991, 50, 179–211. [Google Scholar] [CrossRef]
- Rosenstock, I.M. The health belief model and preventive health behavior. Health Educ. Monogr. 1974, 2, 354–386. [Google Scholar] [CrossRef]
- Bandura, A. Human agency in social cognitive theory. Am. Psychol. 1989, 44, 1175–1184. [Google Scholar] [CrossRef]
- Farias, J.; Pilati, R. Violating social distancing amid the COVID-19 pandemic: Psychological factors to improve compliance. J. Appl. Soc. Psychol. 2022, 52, 233–245. [Google Scholar] [CrossRef]
- Hagger, M.S.; Smith, S.R.; Keech, J.J.; A Moyers, S.; Hamilton, K. Predicting social distancing intention and behavior during the COVID-19 pandemic: An integrated social cognition model. Ann. Behav. Med. 2020, 54, 713–727. [Google Scholar] [CrossRef]
- Lin, C.-Y.; Imani, V.; Majd, N.R.; Ghasemi, Z.; Griffiths, M.D.; Hamilton, K.; Hagger, M.S.; Pakpour, A.H. Using an integrated social cognition model to predict COVID-19 preventive behaviours. Br. J. Health Psychol. 2020, 25, 981–1005. [Google Scholar] [CrossRef]
- Ajzen, I.; Fishbein, M. Understanding Attitudes and Predicting Social Behavior; Prentice-Hall: Englewood Cliffs, NJ, USA, 1980. [Google Scholar]
- Ajzen, I. From intentions to actions: A theory of planned behavior. In Action-Control: From Cognition to Behavior; Kuhl, J., Beckman, J., Eds.; Springer: Heidelberg, Germany, 1985; pp. 11–39. [Google Scholar]
- McEachan, R.; Taylor, N.; Harrison, R.; Lawton, R.; Gardner, P.; Conner, M. Meta-analysis of the Reasoned Action Approach (RAA) to understanding health behaviors. Ann. Behav. Med. 2016, 50, 592–612. [Google Scholar] [CrossRef]
- Hagger, M.S.; Chan, D.K.; Protogerou, C.; Chatzisarantis, N.L. Using meta-analytic path analysis to test theoretical predictions in health behavior: An illustration based on meta-analyses of the theory of planned behavior. Prev. Med. 2016, 89, 154–161. [Google Scholar] [CrossRef]
- Martínez, D.; Parilli, C.; Scartascini, C.; Simpser, A. Let’s (not) get together! The role of social norms on social distancing during COVID-19. PLoS ONE 2021, 16, e0247454. [Google Scholar] [CrossRef]
- Freeman, A.L.J.; Kerr, J.; Recchia, G.; Schneider, C.R.; Lawrence, A.C.E.; Finikarides, L.; Luoni, G.; Dryhurst, S.; Spiegelhalter, D. Communicating personalized risks from COVID-19: Guidelines from an empirical study. R. Soc. Open Sci. 2021, 8, 201721. [Google Scholar] [CrossRef] [PubMed]
- Waters, E.A.; Maki, J.; Liu, Y.; Ackermann, N.; Carter, C.R.; Dart, H.; Bowen, D.J.; Cameron, L.D.; Colditz, G.A. Risk ladder, table, or bulleted list? Identifying formats that effectively communicate personalized risk and risk reduction information for multiple diseases. Med. Decis. Mak. 2021, 41, 74–88. [Google Scholar] [CrossRef] [PubMed]
- Barbazza, E.; Ivanković, D.; Wang, S.; Gilmore, K.J.; Poldrugovac, M.; Willmington, C.; Larrain, N.; Bos, V.; Allin, S.; Klazinga, N.; et al. Exploring changes to the actionability of COVID-19 dashboards over the course of 2020 in the Canadian context: Descriptive assessment and expert appraisal study. J. Med. Internet Res. 2021, 23, e30200. [Google Scholar] [CrossRef] [PubMed]
- Ivanković, D.; Barbazza, E.; Bos, V.; Fernandes, Ó.B.; Gilmore, K.J.; Jansen, T.; Kara, P.; Larrain, N.; Lu, S.; Meza-Torres, B.; et al. Features constituting actionable COVID-19 dashboards: Descriptive assessment and expert appraisal of 158 public Web-based COVID-19 dashboards. J. Med. Internet Res. 2021, 23, e25682. [Google Scholar] [CrossRef]
- Turchioe, M.R.; Myers, A.; Isaac, S.; Baik, D.; Grossman, L.V.; Ancker, J.S.; Creber, R.M. A systematic review of patient-facing visualizations of personal health data. Appl. Clin. Inform. 2019, 10, 751–770. [Google Scholar] [CrossRef]
- Yang, F. Data visualization for health and risk communication. In The Handbook of Applied Communication Research; O’Hair, H., O’Hair, M.J., Eds.; John Wiley & Sons: San Francisco, CA, USA, 2020; pp. 213–232. [Google Scholar]
- Pietz, J.; McCoy, S.; Wilck, J.H. Chasing John Snow: Data analytics in the COVID-19 era. Eur. J. Inf. Syst. 2020, 29, 388–404. [Google Scholar] [CrossRef]
- Dagliati, A.; Sacchi, L.; Tibollo, V.; Cogni, G.; Teliti, M.; Martinez-Millana, A.; Traver, V.; Segagni, D.; Posada, J.; Ottaviano, M.; et al. A dashboard-based system for supporting diabetes care. J. Am. Med. Inform. Assoc. 2018, 25, 538–547. [Google Scholar] [CrossRef]
- Dixon, B.; Alzeer, A.H.; Phillips, E.O.K.; Marrero, D.G. Integration of provider, pharmacy, and patient-reported data to improve medication adherence for type 2 diabetes: A controlled before-after pilot study. JMIR Med. Inform. 2016, 4, e4739. [Google Scholar] [CrossRef]
- Sheeran, P.; Maki, A.; Montanaro, E.; Avishai-Yitshak, A.; Bryan, A.; Klein, W.M.P.; Miles, E.; Rothman, A.J. The impact of changing attitudes, norms, and self-efficacy on health-related intentions and behavior: A meta-analysis. Health Psychol. 2016, 35, 1178. [Google Scholar] [CrossRef]
- Parker, D.; Stradling, S.G.; Manstead, A.S. Modifying beliefs and attitudes to exceeding the speed limit: An intervention study based on the theory of planned behavior. J. Appl. Soc. Psychol. 1996, 26, 1–19. [Google Scholar] [CrossRef]
- Cooke, R.; Dahdah, M.; Norman, P.; French, D.P. How well does the theory of planned behaviour predict alcohol consumption? A systematic review and meta-analysis. Health Psychol. Rev. 2016, 10, 148–167. [Google Scholar] [CrossRef] [PubMed]
- Rawl, S.M.; Skinner, C.S.; Perkins, S.M.; Springston, J.; Wang, H.-L.; Russell, K.M.; Tong, Y.; Gebregziabher, N.; Krier, C.; Smith-Howell, E.; et al. Computer-delivered tailored intervention improves colon cancer screening knowledge and health beliefs of African-Americans. Health Educ. Res. 2012, 27, 868–885. [Google Scholar] [CrossRef] [PubMed]
- Koelle, K.; Martin, M.A.; Antia, R.; Lopman, B.; Dean, N.E. The changing epidemiology of SARS-CoV-2. Science 2022, 375, 1116–1121. [Google Scholar] [CrossRef]
- Harris, J.E. Geospatial Analysis of the September 2020 Coronavirus Outbreak at the University of Wisconsin–Madison: Did a Cluster of Local Bars Play a Critical Role? National Bureau of Economic Research Working Paper Series, No. 28132; National Bureau of Economic Research: Cambridge, CA, USA, 2022. [Google Scholar]
- Harper, C.A.; Satchell, L.P.; Fido, D.; Latzman, R.D. Functional fear predicts public health compliance in the COVID-19 pandemic. Int. J. Ment. Health Addict. 2021, 19, 1875–1888. [Google Scholar] [CrossRef]
- Anaki, D.; Sergay, J. Predicting health behavior in response to the coronavirus disease (COVID-19): Worldwide survey results from early March 2020. PLoS ONE 2021, 16, e0244534. [Google Scholar] [CrossRef]
- Ahorsu, D.K.; Lin, C.-Y.; Imani, V.; Saffari, M.; Griffiths, M.D.; Pakpour, A.H. The Fear of COVID-19 Scale: Development and Initial Validation. Int. J. Ment. Health Addict. 2020, 20, 1537–1545. [Google Scholar] [CrossRef]
- Bitan, D.T.; Grossman-Giron, A.; Bloch, Y.; Mayer, Y.; Shiffman, N.; Mendlovic, S. Fear of COVID-19 scale: Psychometric characteristics, reliability and validity in the Israeli population. Psychiatry Res. 2020, 289, 113100. [Google Scholar] [CrossRef]
- Hayes, A.F. Introduction to Mediation, Moderation, and Conditional Process Analysis: A Regression-Based Approach, 2nd ed.; Guilford Press: New York, NY, USA, 2018. [Google Scholar]
- Witte, K.; Allen, M. A meta-analysis of fear appeals: Implications for effective public health campaigns. Health Educ. Behav. 2000, 27, 591–615. [Google Scholar] [CrossRef]
- Lee, M.; You, M. Psychological and behavioral responses in South Korea during the early stages of Coronavirus disease 2019 (COVID-19). Int. J. Environ. Res. Public Health 2020, 17, 2977. [Google Scholar] [CrossRef]
- Ames, D.L.; Fiske, S.T. Intentional harms are worse, even when they’re not. Psychol. Sci. 2013, 24, 1755–1762. [Google Scholar] [CrossRef]
- Vanhaeverbeke, J.; Deprost, E.; Bonte, P.; Strobbe, M.; Nelis, J.; Volckaert, B.; Ongenae, F.; Verstockt, S.; Van Hoecke, S. Real-time estimation and monitoring of COVID-19 aerosol transmission risk in office buildings. Sensors 2023, 23, 2459. [Google Scholar] [CrossRef] [PubMed]
- Wachter, R.M. Nailing the nuance on COVID-19. Science 2022, 377, 243. [Google Scholar] [CrossRef] [PubMed]
- Goldstein, N.J.; Cialdini, R.B.; Griskevicius, V. A room with a viewpoint: Using social norms to motivate environmental conservation in hotels. J. Consum. Res. 2008, 35, 472–482. [Google Scholar] [CrossRef]
- Förster, J.; Grant, H.; Idson, L.C.; Higgins, E. Success/failure feedback, expectancies, and approach/avoidance motivation: How regulatory focus moderates classic relations. J. Exp. Soc. Psychol. 2001, 37, 253–260. [Google Scholar] [CrossRef]
- Jayanti, R.K. Accentuate the positive: Elderly responses to health communication. J. Mark. Theory Pract. 2010, 18, 263–273. [Google Scholar] [CrossRef]
- Hassan, L.M.; Shiu, E.; Parry, S. Addressing the cross-country applicability of the theory of planned behaviour (TPB): A structured review of multi-country TPB studies. J. Consum. Behav. 2016, 15, 72–86. [Google Scholar] [CrossRef]
- LaBarge, M.C.; Block, K. Fostering marketplace inclusion: Health equity implications. J. Public Policy Mark. 2025, 44, 237–239. [Google Scholar] [CrossRef]
- Craciun, G.; Kane, A.; Pike, J. Framing Data for Behavioral Change: An Experimental Study of COVID-19 Dashboards. In Proceedings of the 2022 AMA Winter Academic Conference, Virtual, 10–11 February 2022. Las Vegas, NA, USA, 18–20 February 2022. [Google Scholar]
- Kane, A.; Pike, J.; Craciun, G. Beyond Fear: Actionable COVID-19 Dashboards Promote Health Behavior though Norms. Presented at the Intervention Science Preconference of the 2022 Annual Convention of Society for Personality and Social Psychology, Virtual, 16 February 2022. [Google Scholar]
- Craciun, G.; Kane, A.; Pike, J. Pandemic and Digital Dashboards: How Behavioral Guidance Influences Intentions to Engage in Preventive Behaviors. Presented at the 2023 AMA Marketing and Public Policy Conference, Arlington, VA, USA, 8–10 June 2023. [Google Scholar]

| Measure | Description | Scale | Cronbach’s α or r |
|---|---|---|---|
| PHB Intentions (DV) | (a) I will make an effort/(b) I will try to avoid indoor gatherings and parties during the next week [15,16,42] | (a) 1 = definitely false to 7 = definitely true, (b) 1 = definitely will not to 7 = definitely will | 0.97 |
| Attitudes | My avoiding indoor gatherings and parties during the next week would be ___ [43] | (a) 1 = harmful, 7 = beneficial, (b) 1 = stressful, 7 = relaxing, (c) 1 = foolish, 7 = wise; and (d) 1 = bad, 7 = good | 0.84 |
| Behavioral Control | (a) For me, to avoid indoor gatherings and parties during the next week will be __ and (b) I am confident that I can avoid indoor gatherings and parties during the next week [43] | (a) 1 = very difficult, 7 = very easy, (b) 1 = strongly disagree, 7 = strongly agree | 0.84 |
| Norms | (a) Most of my friends/(b) Most of my family would avoid indoor gatherings and parties, (c) People who are important to me would _____ of my avoiding indoor gatherings and parties over the next week [43] | (a) and (b) 1 = strongly disagree, 7 = strongly agree, (c) 1 = disapprove, 7 = approve | 0.73 |
| Perceived Risk | (a) The risk of getting COVID-19 at Blue University is __, (b) COVID-19 on Blue’s campus is __ | (a) 1 = low risk, 7 = high risk, (b) 1 = under control, 7 = out of control | 0.83 |
| Fear of COVID-19 (control 1) | (a) I am most afraid of the coronavirus, (b) It makes me uncomfortable to think about coronavirus, (c) I am afraid of losing my life because of the coronavirus, and (d) When watching news and stories about the coronavirus on social media, I become nervous or anxious [44,45] | 1 = strongly disagree, 7 = strongly agree | 0.88 |
| Male gender (control 2) | Asked current gender as male, female, self-defined, or prefer not to answer options | Contrast coded 0.5 = male and −0.5 = non-male | n/a |
| Variable | Model 1 | Model 2 | ||||
|---|---|---|---|---|---|---|
| B | SE | p | B | SE | p | |
| Constant | 5.13 *** | 0.24 | <0.001 | 5.01 *** | 0.23 | <0.001 |
| Male gender | −0.54 * | 0.23 | 0.019 | −0.43 | 0.22 | 0.06 |
| Fear of COVID-19 | 0.24 *** | 0.07 | <0.001 | 0.28 *** | 0.07 | <0.001 |
| H1: Actionable dashboard | 0.84 *** | 0.21 | <0.001 | |||
| R2 | 0.12 | 0.19 | ||||
| △R2 | 0.07 *** | |||||
| B | p | LLCI | ULCI | |
|---|---|---|---|---|
| A. Effects of Dashboard Intervention on Psychosocial Beliefs | ||||
| Attitudes (a1) | 0.304 | 0.081 | −0.037 | 0.645 |
| Behavioral control (a2) | 0.501 * | 0.018 | 0.089 | 0.913 |
| Norms (a3) | 0.399 * | 0.026 | 0.047 | 0.751 |
| Perceived risk (a4) | 2.072 *** | 0.000 | 1.754 | 2.390 |
| B. Effects of Psychosocial Belief on PHB Intentions | ||||
| Attitudes (b1) | 0.257 ** | 0.004 | 0.081 | 0.433 |
| Behavioral control (b2) | 0.196 ** | 0.005 | 0.061 | 0.332 |
| Norms (b3) | 0.444 * | 0.000 | 0.279 | 0.609 |
| Perceived risk (b4) | 0.071 | 0.342 | −0.076 | 0.218 |
| C. Indirect Effects of Dashboard Intervention via the Competing Psychosocial Beliefs | ||||
| Attitudes (c1) | 0.078 | - | −0.010 | 0.244 |
| Behavioral control (c2) | 0.098 | - | −0.008 | 0.260 |
| Norms (c3) | 0.177 | - | 0.017 | 0.364 |
| Perceived risk (c4) | 0.147 | - | −0.174 | 0.493 |
| Variable | Model 1 | Model 2 | ||||
|---|---|---|---|---|---|---|
| B | SE | p | B | SE | p | |
| Constant | 2.88 *** | 0.23 | <0.001 | 2.85 *** | 0.23 | <0.001 |
| Male gender | −0.48 * | 0.23 | 0.04 | −0.43 | 0.22 | 0.06 |
| Fear of COVID | 0.59 *** | 0.07 | <0.001 | 0.60 *** | 0.07 | <0.001 |
| H3: behavioral guidance | 0.61 ** | 0.21 | 0.005 | |||
| Risk level visualization | 0.22 | 0.21 | 0.29 | |||
| Interaction of BG and RLV | −0.31 | 0.42 | 0.47 | |||
| R2 | 0.27 | 0.30 | ||||
| △R2 | 0.03 * | |||||
| B | p | LLCI | ULCI | |
|---|---|---|---|---|
| A. Effects of Dashboard Intervention on Psychosocial Beliefs | ||||
| Attitudes (a1) | 0.264 | 0.149 | −0.095 | 0.623 |
| Behavioral control (a2) | 0.349 | 0.120 | −0.092 | 0.790 |
| Norms (a3) | 0.355 * | 0.040 | 0.016 | 0.694 |
| Perceived risk (a4) | 0.111 | 0.488 | −0.203 | 0.434 |
| B. Effects of Psychosocial Belief on PHB Intentions | ||||
| Attitudes (b1) | 0.030 | 0.666 | −0.105 | 0.164 |
| Behavioral control (b2) | 0.257 *** | 0.000 | 0.147 | 0.368 |
| Norms (b3) | 0.522 *** | 0.000 | 0.380 | 0.664 |
| Perceived risk (b4) | 0.295 *** | 0.000 | 0.161 | 0.428 |
| C. Indirect Effects of Dashboard Intervention via the Competing Psychosocial Beliefs | ||||
| Attitudes (c1) | 0.008 | - | −0.041 | 0.067 |
| Behavioral control (c2) | 0.090 | - | −0.023 | 0.222 |
| Norms (c3) | 0.185 | - | 0.009 | 0.387 |
| Perceived risk (c4) | 0.033 | - | −0.060 | 0.143 |
Disclaimer/Publisher’s Note: The statements, opinions and data contained in all publications are solely those of the individual author(s) and contributor(s) and not of MDPI and/or the editor(s). MDPI and/or the editor(s) disclaim responsibility for any injury to people or property resulting from any ideas, methods, instructions or products referred to in the content. |
© 2025 by the authors. Licensee MDPI, Basel, Switzerland. This article is an open access article distributed under the terms and conditions of the Creative Commons Attribution (CC BY) license (https://creativecommons.org/licenses/by/4.0/).
Share and Cite
Craciun, G.; Kane, A.A.; Pike, J.C. Unpacking Digital Dashboards’ Influence on Preventive Health Behavior Among Young Adults. Healthcare 2025, 13, 1279. https://doi.org/10.3390/healthcare13111279
Craciun G, Kane AA, Pike JC. Unpacking Digital Dashboards’ Influence on Preventive Health Behavior Among Young Adults. Healthcare. 2025; 13(11):1279. https://doi.org/10.3390/healthcare13111279
Chicago/Turabian StyleCraciun, Georgiana, Aimee A. Kane, and Jacqueline C. Pike. 2025. "Unpacking Digital Dashboards’ Influence on Preventive Health Behavior Among Young Adults" Healthcare 13, no. 11: 1279. https://doi.org/10.3390/healthcare13111279
APA StyleCraciun, G., Kane, A. A., & Pike, J. C. (2025). Unpacking Digital Dashboards’ Influence on Preventive Health Behavior Among Young Adults. Healthcare, 13(11), 1279. https://doi.org/10.3390/healthcare13111279