
Quality of Life in European Adults and Older with All-Over Pain: Relationship with Frequency of Moderate and Vigorous Physical Activity and Decision Prediction Models with Cross-Sectional Data
 ,
,  , ,
, ,  and
and
Abstract
1. Introduction
2. Materials and Methods
2.1. Design
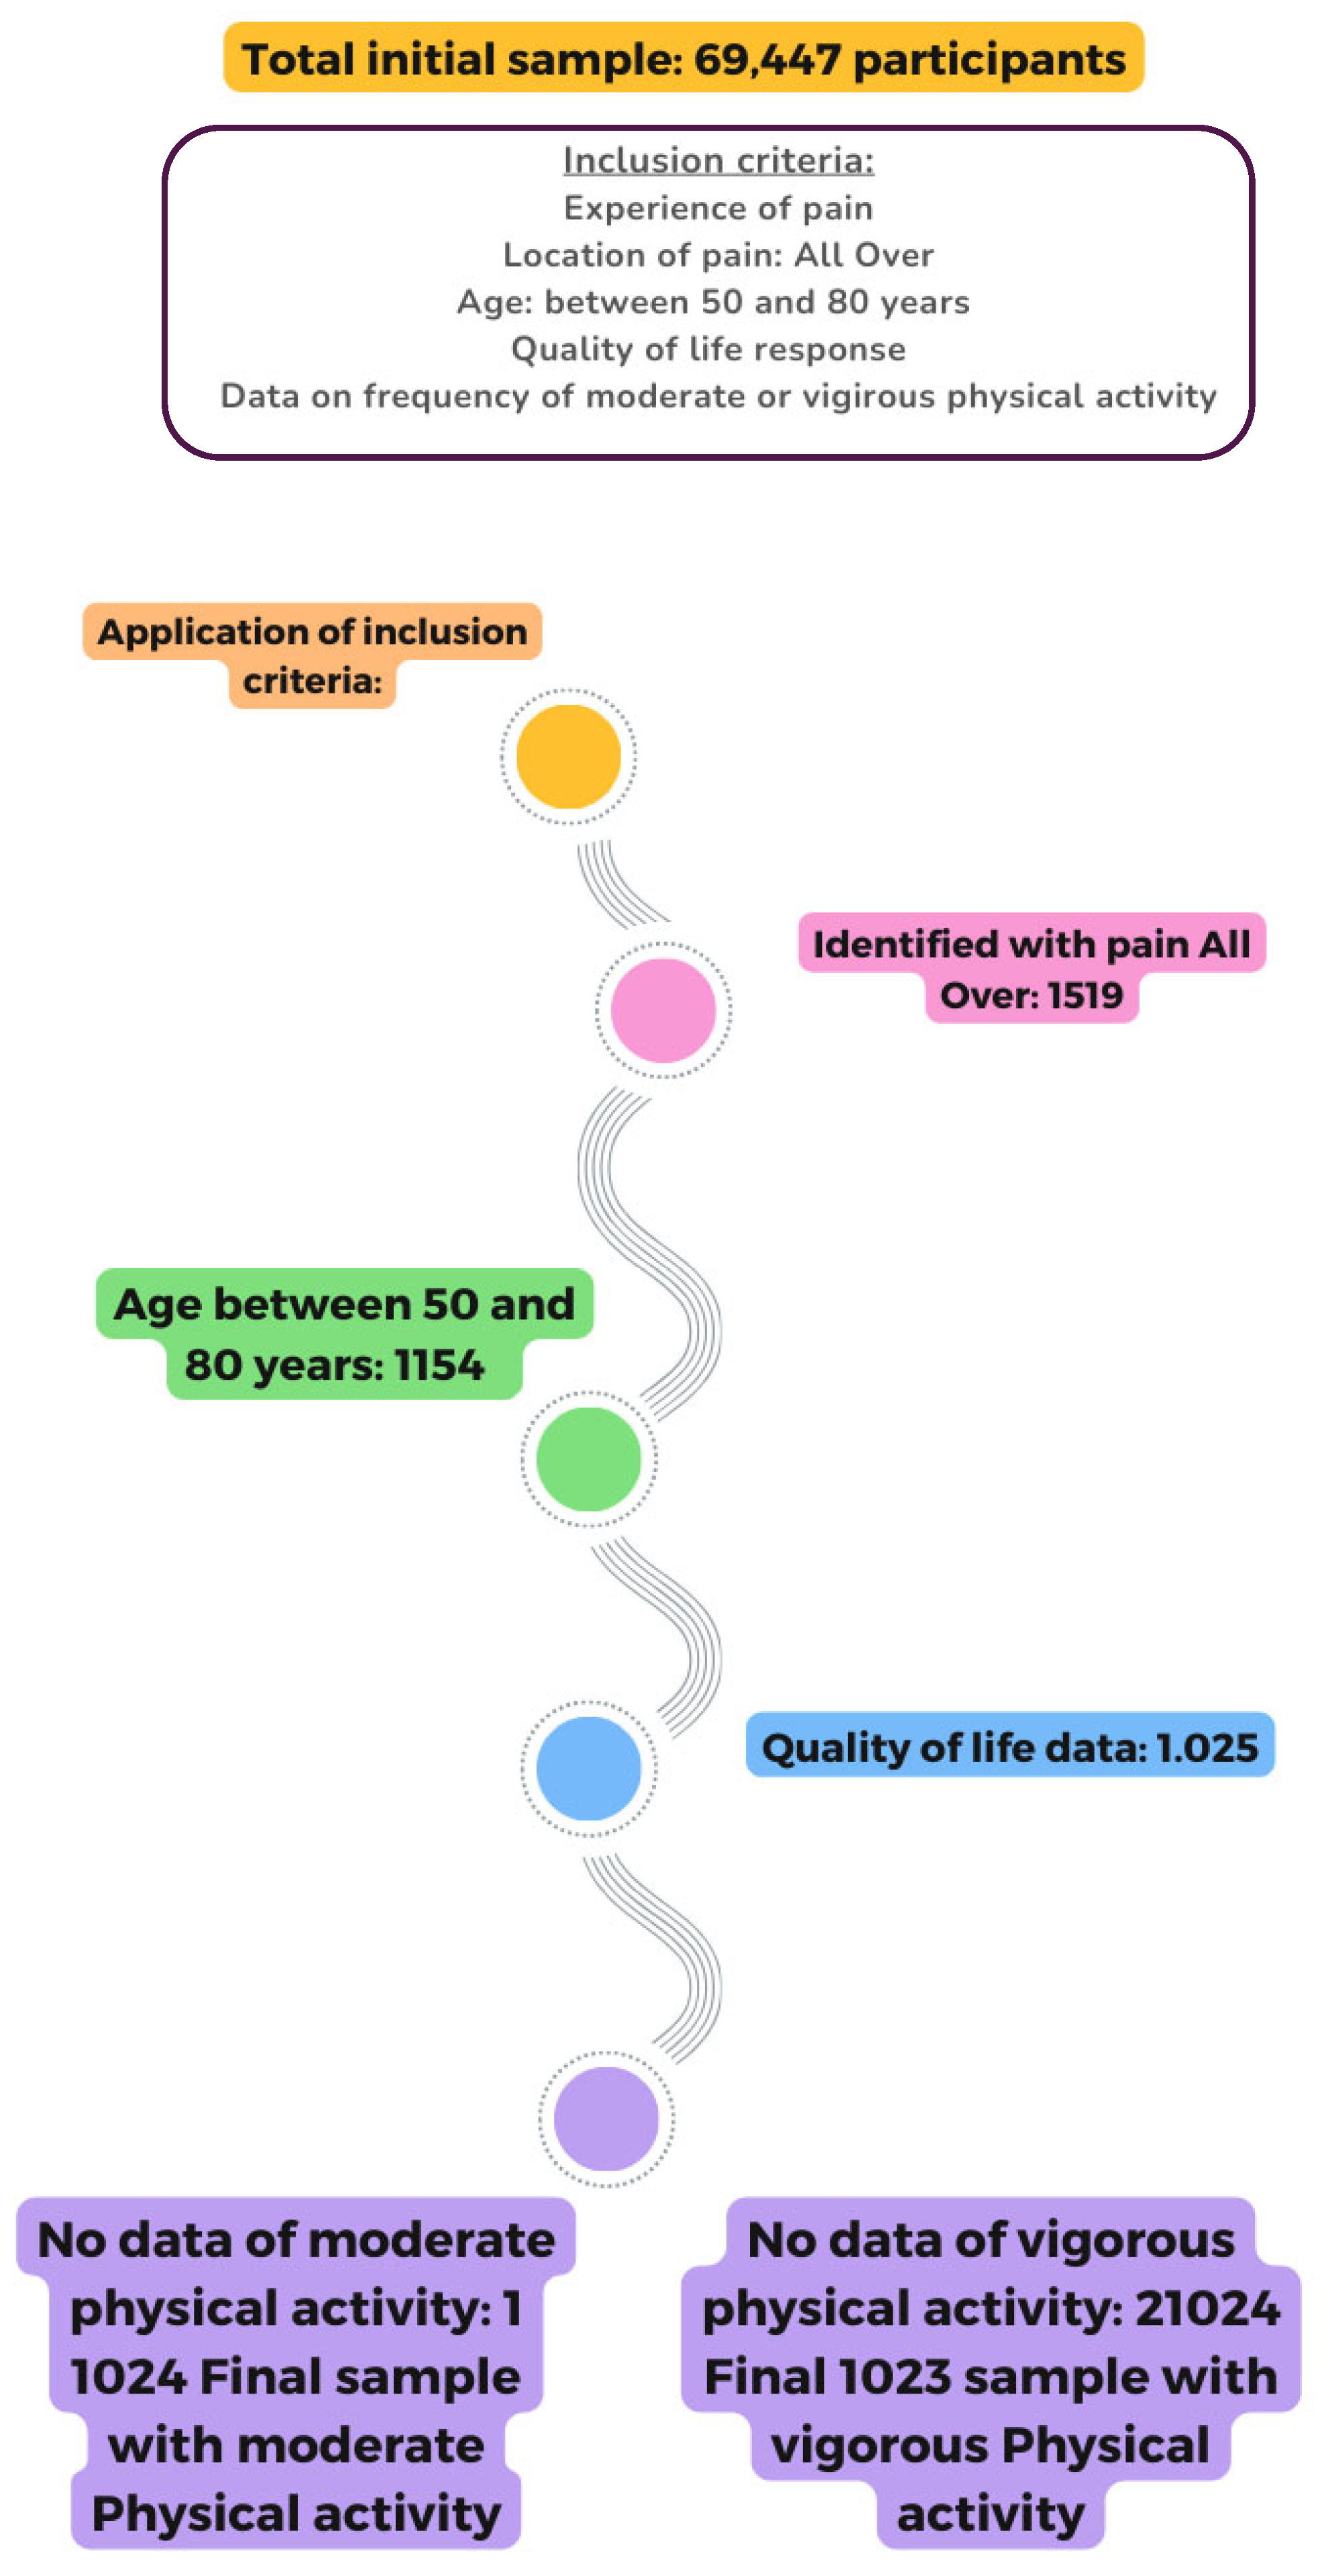
2.2. Sample
2.3. Variables
2.3.1. Demographic and Predictor Variables
2.3.2. Dependent Variables
2.4. Statistical Analysis
- Dependent variable in the model was QoL and well-being (CASP Score).
- Independent variables in the models were SPH, BMI, depression, sex, age, level of pain, education level, smoke at the present time, frequency of sports or activities that are vigorous and frequency of activities requiring a moderate level of energy.
- The significance level was set at 0.05.
- The measure of improvement could not be less than 0.0001, indicating modest differences between nodes (i.e., higher values produce trees with a reduced number of nodes) [66].
- The iteration interval was 50–100 (maximum–minimum) to obtain a balanced tree with a useful number of nodes.
- Missing independent values were excluded from the process. An automatic number of surrogates (one less than the independent variables) was used. This was used for case classification when there are missing data on the independent variable in the tree.
- Furthermore, 10-fold cross-validation was performed to test the stability of the decision tree [67]. The dataset is divided into ten randomly selected and approximately equal parts, each of which maintains a similar distribution of the data. The first nine parts of the data (90%) are used to construct the largest possible tree, and the remaining 10% are used to obtain initial estimates of the error rate of the selected sub-tree. The process is repeated 10 times using different combinations of the remaining 9 subsets of data and a different 1/10 data subset to test the resulting tree. The cross-validation process reveals the risk value for the 10 test samples [68].
- The absolute and normalized significance of each independent variable in the model was requested. A bar chart was constructed to visualize the importance of the variables in the model.
3. Results
3.1. Descriptive
3.2. Quality of Life in People with All-Over Pain According to the Frequency of PA
3.3. Association Between Quality of Life (Low, Moderate, High and Very High) and Physical Activity Frequency
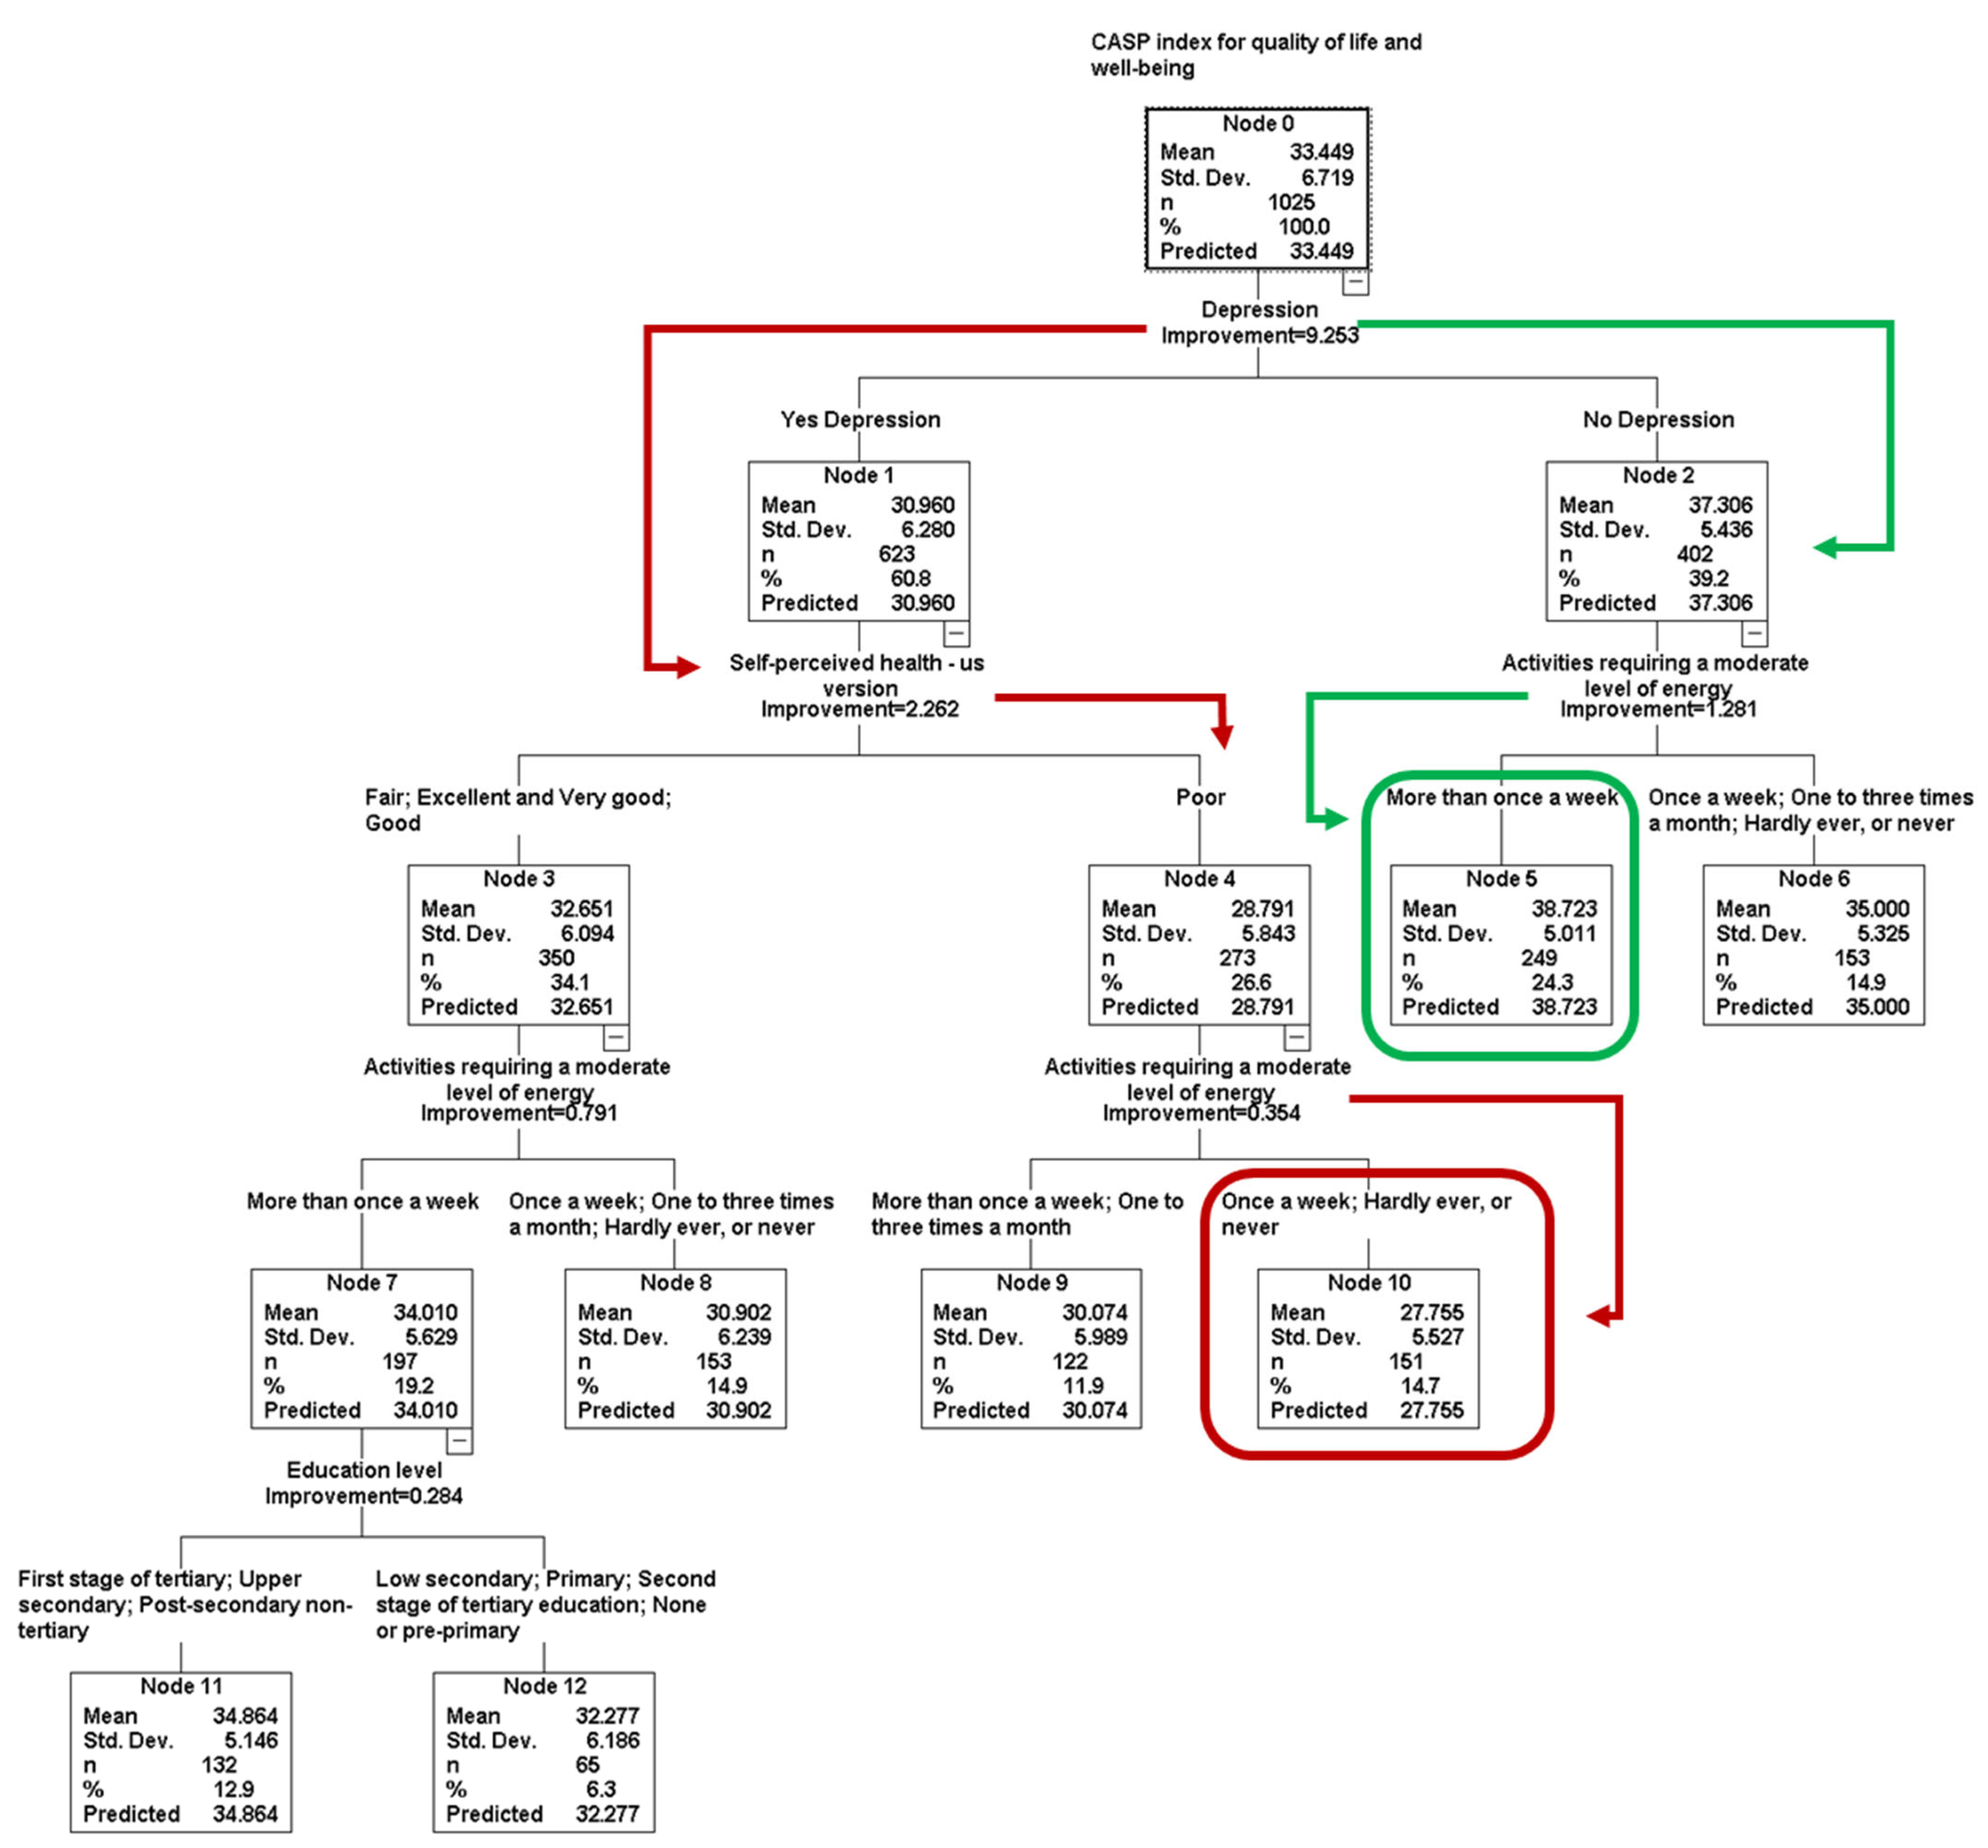
3.4. CASP Index for QoL Prediction Model Using a Classification and Regression Tree
3.5. Linear Regression Model for QoL
3.6. Comparison of Model Performance
4. Discussion
5. Conclusions
Supplementary Materials
Author Contributions
Funding
Institutional Review Board Statement
Informed Consent Statement
Data Availability Statement
Conflicts of Interest
References
- Dizner-Golab, A.; Lisowska, B.; Kosson, D. Fibromyalgia—Etiology, Diagnosis and Treatment Including Perioperative Management in Patients with Fibromyalgia. Reumatologia 2023, 61, 137–148. [Google Scholar] [CrossRef] [PubMed]
- Beasley, M.; Freidin, M.B.; Basu, N.; Williams, F.M.K.; Macfarlane, G.J. What Is the Effect of Alcohol Consumption on the Risk of Chronic Widespread Pain? A Mendelian Randomisation Study Using UK Biobank. Pain 2019, 160, 501. [Google Scholar] [CrossRef] [PubMed]
- Gerdle, B.; Björk, J.; Cöster, L.; Henriksson, K.; Henriksson, C.; Bengtsson, A. Prevalence of Widespread Pain and Associations with Work Status: A Population Study. BMC Musculoskelet. Disord. 2008, 9, 102. [Google Scholar] [CrossRef]
- Mansfield, K.E.; Sim, J.; Jordan, J.L.; Jordan, K.P. A Systematic Review and Meta-Analysis of the Prevalence of Chronic Widespread Pain in the General Population. PAIN 2016, 157, 55. [Google Scholar] [CrossRef]
- Andrews, P.; Steultjens, M.; Riskowski, J. Chronic Widespread Pain Prevalence in the General Population: A Systematic Review. Eur. J. Pain 2018, 22, 5–18. [Google Scholar] [CrossRef]
- Montgomery, L.R.; Kamper, S.J.; Michaleff, Z.A.; Williams, C.M.; Dario, A.; Campbell, P.; Andreucci, A.; Windt, D.A.; Dunn, K.M.; Swain, M.S. Overall Prognosis of Acute and Chronic Musculoskeletal, Widespread, and Neuropathic Pain in Children and Adolescents. Cochrane Database Syst. Rev. 2023, 2023, CD014773. [Google Scholar] [CrossRef]
- Pain in the Whole Body. In Headache and Chronic Pain Syndromes: The Case-Based Guide to Targeted Assessment and Treatment; Marcus, D.A., Ed.; Humana Press: Totowa, NJ, USA, 2007; pp. 165–184. ISBN 978-1-59745-258-8. [Google Scholar]
- Bérubé, M.; Verret, M.; Bourque, L.; Côté, C.; Guénette, L.; Richard-Denis, A.; Ouellet, S.; Singer, L.N.; Gauthier, L.; Gagnon, M.-P.; et al. Educational Needs and Preferences of Adult Patients with Acute Pain: A Mixed-Methods Systematic Review. Pain 2024, 165, e162. [Google Scholar] [CrossRef]
- Castroman, P.; Quiroga, O.; Rojals, V.M.; Gómez, M.; Moka, E.; Jr, J.P.; Varrassi, G.; Castroman, P.; Quiroga, O.; Sr, V.M.R.; et al. Reimagining How We Treat Acute Pain: A Narrative Review. Cureus 2022, 14, e23992. [Google Scholar] [CrossRef]
- Koneti, K.K.; Jones, M. Management of Acute Pain. Surgery (Oxford) 2016, 34, 84–90. [Google Scholar] [CrossRef]
- Amaro-Díaz, L.; Montoro, C.I.; Fischer-Jbali, L.R.; Galvez-Sánchez, C.M. Chronic Pain and Emotional Stroop: A Systematic Review. J. Clin. Med. 2022, 11, 3259. [Google Scholar] [CrossRef]
- Fayaz, A.; Croft, P.; Langford, R.M.; Donaldson, L.J.; Jones, G.T. Prevalence of Chronic Pain in the UK: A Systematic Review and Meta-Analysis of Population Studies. BMJ Open 2016, 6, e010364. [Google Scholar] [CrossRef] [PubMed]
- Dydyk, A.M.; Givler, A. Central Pain Syndrome. In StatPearls; StatPearls Publishing: Treasure Island, FL, USA, 2025. [Google Scholar]
- Tanguay-Sabourin, C.; Fillingim, M.; Guglietti, G.V.; Zare, A.; Parisien, M.; Norman, J.; Sweatman, H.; Da-ano, R.; Heikkala, E.; Perez, J.; et al. A Prognostic Risk Score for Development and Spread of Chronic Pain. Nat. Med. 2023, 29, 1821–1831. [Google Scholar] [CrossRef] [PubMed]
- Kissoon, N.R. Chronic Widespread Pain. Contin. Lifelong Learn. Neurol. 2024, 30, 1427. [Google Scholar] [CrossRef]
- Lee, D.M.; Pendleton, N.; Tajar, A.; O’Neill, T.W.; O’Connor, D.B.; Bartfai, G.; Boonen, S.; Casanueva, F.F.; Finn, J.D.; Forti, G.; et al. Chronic Widespread Pain Is Associated with Slower Cognitive Processing Speed in Middle-Aged and Older European Men. Pain 2010, 151, 30. [Google Scholar] [CrossRef]
- Wang, K.; Liu, H. Association between Widespread Pain and Dementia, Alzheimer’s Disease and Stroke: A Cohort Study from the Framingham Heart Study. Reg. Anesth. Pain Med. 2021, 46, 879–885. [Google Scholar] [CrossRef]
- Maixner, W.; Fillingim, R.B.; Williams, D.A.; Smith, S.B.; Slade, G.D. Overlapping Chronic Pain Conditions: Implications for Diagnosis and Classification. J. Pain 2016, 17, T93–T107. [Google Scholar] [CrossRef]
- Pagé, M.G.; Fortier, M.; Ware, M.A.; Choinière, M. As If One Pain Problem Was Not Enough: Prevalence and Patterns of Coexisting Chronic Pain Conditions and Their Impact on Treatment Outcomes. J. Pain Res. 2018, 11, 237–254. [Google Scholar] [CrossRef]
- Haraldstad, K.; Wahl, A.; Andenæs, R.; Andersen, J.R.; Andersen, M.H.; Beisland, E.; Borge, C.R.; Engebretsen, E.; Eisemann, M.; Halvorsrud, L.; et al. A Systematic Review of Quality of Life Research in Medicine and Health Sciences. Qual. Life Res. 2019, 28, 2641–2650. [Google Scholar] [CrossRef]
- Phyo, A.Z.Z.; Freak-Poli, R.; Craig, H.; Gasevic, D.; Stocks, N.P.; Gonzalez-Chica, D.A.; Ryan, J. Quality of Life and Mortality in the General Population: A Systematic Review and Meta-Analysis. BMC Public Health 2020, 20, 1596. [Google Scholar] [CrossRef]
- Cho, Y.; Lee, J.K.; Kim, D.-H.; Park, J.-H.; Choi, M.; Kim, H.-J.; Nam, M.-J.; Lee, K.-U.; Han, K.; Park, Y.-G. Factors Associated with Quality of Life in Patients with Depression: A Nationwide Population-Based Study. PLoS ONE 2019, 14, e0219455. [Google Scholar] [CrossRef]
- Lee, S.; Kim, J.H.; Chung, J.H. The Association between Sleep Quality and Quality of Life: A Population-Based Study. Sleep Med. 2021, 84, 121–126. [Google Scholar] [CrossRef] [PubMed]
- Badri, M.; Alkhaili, M.; Aldhaheri, H.; Yang, G.; Albahar, M.; Alrashdi, A. From Good Sleep to Health and to Quality of Life—A Path Analysis of Determinants of Sleep Quality of Working Adults in Abu Dhabi. Sleep Sci. Pract. 2023, 7, 1. [Google Scholar] [CrossRef]
- Stites, S.D.; Harkins, K.; Rubright, J.D.; Karlawish, J. Relationships Between Cognitive Complaints and Quality of Life in Older Adults With Mild Cognitive Impairment, Mild Alzheimer Disease Dementia, and Normal Cognition. Alzheimer Dis. Assoc. Disord. 2018, 32, 276. [Google Scholar] [CrossRef] [PubMed]
- Vespa, A.; Spatuzzi, R.; Fabbietti, P.; Di Rosa, M.; Bonfigli, A.R.; Corsonello, A.; Gattafoni, P.; Giulietti, M.V. Association between Sense of Loneliness and Quality of Life in Older Adults with Multimorbidity. Int. J. Environ. Res. Public Health 2023, 20, 2615. [Google Scholar] [CrossRef]
- Schwartz, R.M.; Bevilacqua, K.G.; Alpert, N.; Liu, B.; Dharmarajan, K.V.; Ornstein, K.A.; Taioli, E. Educational Attainment and Quality of Life among Older Adults before a Lung Cancer Diagnosis. J. Palliat. Med. 2020, 23, 498–505. [Google Scholar] [CrossRef]
- Boberska, M.; Szczuka, Z.; Kruk, M.; Knoll, N.; Keller, J.; Hohl, D.H.; Luszczynska, A. Sedentary Behaviours and Health-Related Quality of Life. A Systematic Review and Meta-Analysis. Health Psychol. Rev. 2018, 12, 195–210. [Google Scholar] [CrossRef]
- Alcañiz, M.; Solé-Auró, A. Feeling Good in Old Age: Factors Explaining Health-Related Quality of Life. Health Qual. Life Outcomes 2018, 16, 48. [Google Scholar] [CrossRef]
- Zdun-Ryżewska, A.; Basiński, K.; Majkowicz, M.; Podolska, M.; Landowski, J.; Walden-Gałuszko, K. Association between Social Support and Quality of Life in Patients with Affective Disorders. Eur. J. Psychiat 2018, 32, 132–138. [Google Scholar] [CrossRef]
- Jiang, N.; Ye, H.; Zhao, X.; Zhang, Y. The Association Between Social Support and the Quality of Life of Older Adults in China: The Mediating Effect of Loneliness. Exp. Aging Res. 2025, 51, 232–246. [Google Scholar] [CrossRef]
- López-Ruiz, V.-R.; Huete-Alcocer, N.; Alfaro-Navarro, J.-L.; Nevado-Peña, D. The Relationship between Happiness and Quality of Life: A Model for Spanish Society. PLoS ONE 2021, 16, e0259528. [Google Scholar] [CrossRef]
- Marquez, D.X.; Aguiñaga, S.; Vásquez, P.M.; Conroy, D.E.; Erickson, K.I.; Hillman, C.; Stillman, C.M.; Ballard, R.M.; Sheppard, B.B.; Petruzzello, S.J.; et al. A Systematic Review of Physical Activity and Quality of Life and Well-Being. Transl. Behav. Med. 2020, 10, 1098–1109. [Google Scholar] [CrossRef] [PubMed]
- Park, S.-H.; Han, K.S.; Kang, C.-B. Effects of Exercise Programs on Depressive Symptoms, Quality of Life, and Self-Esteem in Older People: A Systematic Review of Randomized Controlled Trials. Appl. Nurs. Res. 2014, 27, 219–226. [Google Scholar] [CrossRef] [PubMed]
- Bullo, V.; Gobbo, S.; Vendramin, B.; Duregon, F.; Cugusi, L.; Di Blasio, A.; Bocalini, D.S.; Zaccaria, M.; Bergamin, M.; Ermolao, A. Nordic Walking Can Be Incorporated in the Exercise Prescription to Increase Aerobic Capacity, Strength, and Quality of Life for Elderly: A Systematic Review and Meta-Analysis. Rejuvenation Res. 2018, 21, 141–161. [Google Scholar] [CrossRef] [PubMed]
- Denche-Zamorano, Á.; Franco-García, J.M.; Pastor-Cisneros, R.; Salas-Gómez, D.; Collado-Mateo, D.; Olivares, P.R.; Adsuar, J.C. Relationships between Physical Activity Level and Pain in the Spanish Population: A Cross-Sectional Study. J. Pers. Med. 2022, 12, 1591. [Google Scholar] [CrossRef]
- Denche-Zamorano, Á.; Pastor-Cisneros, R.; Castillo-Paredes, A.; Adsuar-Sala, J.C.; Salas-Gómez, D. Frequency of Physical Activity during Leisure Time and Variables Related to Pain and Pain Medication Use in Spanish Adults: A Cross-Sectional Study. PLoS ONE 2024, 19, e0310685. [Google Scholar] [CrossRef]
- Denche-Zamorano, Á.; Barrios-Fernandez, S.; Gómez-Galán, R.; Franco-García, J.M.; Carlos-Vivas, J.; Mendoza-Muñoz, M.; Rojo-Ramos, J.; Vega-Muñoz, A.; Contreras-Barraza, N.; Gianikellis, K.; et al. Associations between Physical Activity Level and Mental Health in the Spanish Population: A Cross-Sectional Study. Healthcare 2022, 10, 1442. [Google Scholar] [CrossRef]
- Mahindru, A.; Patil, P.; Agrawal, V.; Mahindru, A.; Patil, P.; Agrawal, V. Role of Physical Activity on Mental Health and Well-Being: A Review. Cureus 2023, 15, e33475. [Google Scholar] [CrossRef]
- Musich, S.; Wang, S.S.; Schaeffer, J.A.; Kraemer, S.; Wicker, E.; Yeh, C.S. The Association of Physical Activity with Loneliness, Social Isolation, and Selected Psychological Protective Factors among Older Adults. Geriatr. Nurs. 2022, 47, 87–94. [Google Scholar] [CrossRef]
- Alsulami, S.; Baig, M.; Ahmad, T.; Althagafi, N.; Hazzazi, E.; Alsayed, R.; Alghamdi, M.; Almohammadi, T. Obesity Prevalence, Physical Activity, and Dietary Practices among Adults in Saudi Arabia. Front. Public Health 2023, 11, 1124051. [Google Scholar] [CrossRef]
- Franco-García, J.M.; Denche-Zamorano, Á.; Carlos-Vivas, J.; Castillo-Paredes, A.; Mendoza-Holgado, C.; Pérez-Gómez, J. Subjective Cognitive Impairment and Physical Activity: Investigating Risk Factors and Correlations among Older Adults in Spain. J. Funct. Morphol. Kinesiol. 2024, 9, 150. [Google Scholar] [CrossRef]
- Denche-Zamorano, Á.; Salas-Gómez, D.; Franco-García, J.M.; Adsuar, J.C.; Parraca, J.A.; Collado-Mateo, D. Associations between Physical Activity Frequency in Leisure Time and Subjective Cognitive Limitations in Middle-Aged Spanish Adults: A Cross-Sectional Study. Healthcare 2024, 12, 1056. [Google Scholar] [CrossRef] [PubMed]
- Dostálová, R.; Stillman, C.; Erickson, K.I.; Slepička, P.; Mudrák, J. The Relationship between Physical Activity, Self-Perceived Health, and Cognitive Function in Older Adults. Brain Sci. 2021, 11, 492. [Google Scholar] [CrossRef] [PubMed]
- Denche-Zamorano, Á.; Salas-Gómez, D.; Barrios-Fernandez, S.; Tomás-Carus, P.; Adsuar, J.C.; Parraca, J.A. Relationship Between Frequency of Physical Activity, Functional Mobility, and Self-Perceived Health in People with Different Levels of Pain: A Cross-Sectional Study. J. Funct. Morphol. Kinesiol. 2024, 9, 198. [Google Scholar] [CrossRef]
- Denche-Zamorano, Á.; Salas-Gómez, D.; Parraca, J.A.; Tomas-Carus, P.; Adsuar, J.C.; Barrios-Fernandez, S. Relationship between Depression and Physical Activity Frequency in Spanish People with Low, Medium, and High Pain Levels. J. Pers. Med. 2024, 14, 855. [Google Scholar] [CrossRef]
- Barcelos, A.; Lopes, D.G.; Mazeda, C.; Canhão, H.; da Cunha Branco, J.; Rodrigues, A.M. Regular Physical Activity Improves Physical Function and Health-Related Quality of Life among Middle-Aged and Older Women Who Suffered a Fragility Fracture—A Population-Based Cohort. Osteoporos. Int. 2024, 35, 2203–2213. [Google Scholar] [CrossRef]
- Hills, A.P.; Jayasinghe, S.; Arena, R.; Byrne, N.M. Global Status of Cardiorespiratory Fitness and Physical Activity—Are We Improving or Getting Worse? Prog. Cardiovasc. Dis. 2024, 83, 16–22. [Google Scholar] [CrossRef]
- Börsch-Supan, A.; Brandt, M.; Hunkler, C.; Kneip, T.; Korbmacher, J.; Malter, F.; Schaan, B.; Stuck, S.; Zuber, S. Data Resource Profile: The Survey of Health, Ageing and Retirement in Europe (SHARE). Int. J. Epidemiol. 2013, 42, 992–1001. [Google Scholar] [CrossRef]
- HARE-ERIC. Survey of Health, Ageing and Retirement in Europe (SHARE) Wave 9; SHARE-ERIC: Munich, Germany, 2024. [Google Scholar] [CrossRef]
- Börsch-Supan, A.; Czaplicki, C.; Friedel, S.; Herold, I.; Korbmacher, J.; Mika, T. SHARE-RV: Linked Data to Study Aging in Germany. Jahrbücher Für Natl. Und Stat. 2020, 240, 121–132. [Google Scholar] [CrossRef]
- Börsch-Supan, A. SHARE—Survey of Health, Ageing and Retirement in Europe—Wave 6; Munich Center for the Economics of Aging: Munich, Germany, 2017; Available online: https://researchdata.se/en/catalogue/dataset/2020-104-1/1 (accessed on 7 April 2025).
- Bergmann, M.; Börsch-Supan, A. SHARE Wave 8 Methodology: Collecting Cross-National Survey Data in Times of COVID-19; Munich Center for the Economics of Aging: Munich, Germany, 2021. [Google Scholar]
- Opinion of the Ethics Council of the Max Planck Society on the “SHARE” Project; Munich Center for the Economics of Aging: Munich, Germany, 2021; Available online: https://share-eric.eu/fileadmin/user_upload/Ethics_Documentation/SHARE_ethics_approvals.pdf (accessed on 7 April 2025).
- Organisation for Economic Co-operation and Development. Classifying Educational Programmes: Manual for ISCED-97 Implementation in OECD Countries; OECD: Paris, France, 1999. [Google Scholar]
- Maskileyson, D.; Seddig, D.; Davidov, E. The EURO-D Measure of Depressive Symptoms in the Aging Population: Comparability Across European Countries and Israel. Front. Polit. Sci. 2021, 3, 665004. [Google Scholar] [CrossRef]
- Castro-Costa, E.; Dewey, M.; Stewart, R.; Banerjee, S.; Huppert, F.; Mendonca-Lima, C.; Bula, C.; Reisches, F.; Wancata, J.; Ritchie, K.; et al. Prevalence of Depressive Symptoms and Syndromes in Later Life in Ten European Countries: The SHARE Study. Br. J. Psychiatry 2007, 191, 393–401. [Google Scholar] [CrossRef]
- An Evaluation of the CASP-12 Scale Used in the Survey of Health, Ageing and Retirement in Europe (SHARE) to Measure Quality of Life Among People Aged 50+|FORS. Available online: https://forscenter.ch/working-papers/fwp-2015-00004/ (accessed on 7 April 2025).
- Fernández, I.; Sentandreu-Mañó, T.; Tomas, J.M. Impacto del estatus de fragilidad sobre la salud y calidad de vida en personas mayores españolas. Aten. Primaria 2020, 52, 731–737. [Google Scholar] [CrossRef] [PubMed]
- Howel, D. Interpreting and Evaluating the CASP-19 Quality of Life Measure in Older People. Age Ageing 2012, 41, 612–617. [Google Scholar] [CrossRef] [PubMed]
- Hyde, M.; Wiggins, R.D.; Higgs, P.; Blane, D.B. A Measure of Quality of Life in Early Old Age: The Theory, Development and Properties of a Needs Satisfaction Model (CASP-19). Aging Ment. Health 2003, 7, 186–194. [Google Scholar] [CrossRef]
- Wasserman, S. Review of Statistical Methods for Meta-Analysis. J. Educ. Stat. 1988, 13, 75–78. [Google Scholar] [CrossRef]
- Lee, D.K. Alternatives to P Value: Confidence Interval and Effect Size. Korean J. Anesth. 2016, 69, 555–562. [Google Scholar] [CrossRef]
- Lemon, S.C.; Roy, J.; Clark, M.A.; Friedmann, P.D.; Rakowski, W. Classification and Regression Tree Analysis in Public Health: Methodological Review and Comparison with Logistic Regression. Ann. Behav. Med. 2003, 26, 172–181. [Google Scholar] [CrossRef]
- van der Ploeg, T.; Austin, P.C.; Steyerberg, E.W. Modern Modelling Techniques Are Data Hungry: A Simulation Study for Predicting Dichotomous Endpoints. BMC Med. Res. Methodol. 2014, 14, 137. [Google Scholar] [CrossRef]
- IBM SPSS Decision Trees—Visión General. Available online: https://www.ibm.com/es-es/products/spss-statistics/decision-trees (accessed on 7 April 2025).
- Goodman, L.A. Simple Models for the Analysis of Association in Cross-Classifications Having Ordered Categories. J. Am. Stat. Assoc. 1979, 74, 537–552. [Google Scholar] [CrossRef]
- Blockeel, H.; Struyf, J. Efficient Algorithms for Decision Tree Cross-Validation 2001. J. Mach. Learn. Res. 2002, 3, 621–650. [Google Scholar] [CrossRef]
- Mendeş, M.; Akkartal, E. Regression Tree Analysis for Predicting Slaughter Weight in Broilers. Ital. J. Anim. Sci. 2009, 8, 615–624. [Google Scholar] [CrossRef]
- Alzahrani, H. Dose-Response Association between Physical Activity and Health-Related Quality of Life in General Population: A Population-Based Pooled Study. Healthcare (Basel) 2022, 10, 1460. [Google Scholar] [CrossRef]
- Blom, E.E.; Aadland, E.; Skrove, G.K.; Solbraa, A.K.; Oldervoll, L.M. Health-Related Quality of Life and Intensity-Specific Physical Activity in High-Risk Adults Attending a Behavior Change Service within Primary Care. PLoS ONE 2019, 14, e0226613. [Google Scholar] [CrossRef] [PubMed]
- Park, J.-H.; Lee, D.H.; Kim, S.I.; Kim, N.K.; Jeon, J.Y. Moderate to Vigorous Physical Activity Participation Associated with Better Quality of Life among Breast and Colorectal Cancer Survivors in Korea. BMC Cancer 2020, 20, 365. [Google Scholar] [CrossRef] [PubMed]
- Geidl, W.; Schlesinger, S.; Mino, E.; Miranda, L.; Pfeifer, K. Dose-Response Relationship between Physical Activity and Mortality in Adults with Noncommunicable Diseases: A Systematic Review and Meta-Analysis of Prospective Observational Studies. Int. J. Behav. Nutr. Phys. Act. 2020, 17, 109. [Google Scholar] [CrossRef]
- Fjeld, M.K.; Årnes, A.P.; Engdahl, B.; Morseth, B.; Hopstock, L.A.; Horsch, A.; Stubhaug, A.; Strand, B.H.; Nielsen, C.S.; Steingrímsdóttir, Ó.A. Consistent Pattern between Physical Activity Measures and Chronic Pain Levels: The Tromsø Study 2015 to 2016. Pain 2023, 164, 838–847. [Google Scholar] [CrossRef]
- Niederstrasser, N.G.; Attridge, N. Associations between Pain and Physical Activity among Older Adults. PLoS ONE 2022, 17, e0263356. [Google Scholar] [CrossRef]
- Lamé, I.E.; Peters, M.L.; Vlaeyen, J.W.S.; Kleef, M.V.; Patijn, J. Quality of Life in Chronic Pain Is More Associated with Beliefs about Pain, than with Pain Intensity. Eur. J. Pain 2005, 9, 15–24. [Google Scholar] [CrossRef]
- Pascoe, M.C.; Patten, R.K.; Tacey, A.; Woessner, M.N.; Bourke, M.; Bennell, K.; Tran, P.; McKenna, M.J.; Apostolopoulos, V.; Lane, R.; et al. Physical Activity and Depression Symptoms in People with Osteoarthritis-Related Pain: A Cross-Sectional Study. PLOS Glob. Public Health 2024, 4, e0003129. [Google Scholar] [CrossRef]
- Makino, K.; Lee, S.; Bae, S.; Chiba, I.; Harada, K.; Katayama, O.; Tomida, K.; Morikawa, M.; Shimada, H. Simplified Decision-Tree Algorithm to Predict Falls for Community-Dwelling Older Adults. J. Clin. Med. 2021, 10, 5184. [Google Scholar] [CrossRef]
- Witt, E.A.; Kenworthy, J.; Isherwood, G.; Dunlop, W.C.N. Examining the Association between Pain Severity and Quality-of-Life, Work-Productivity Loss, and Healthcare Resource Use among European Adults Diagnosed with Pain. J. Med. Econ. 2016, 19, 858–865. [Google Scholar] [CrossRef]


| CASP Index for QoL | ||||||||
|---|---|---|---|---|---|---|---|---|
| Moderate Physical Activity Frequency | Median | (IQR) | KW | df | p-Value | Post hoc MW | p-Value ^ | g ’Hedges |
| More than once a week (1) | 36 | (9) | 113.0 | 3 | <0.001 | |||
| 1 vs. 2 | <0.001 ** | 0.559 | ||||||
| Once a week (2) | 32 | (8) | 1 vs. 3 | 0.001 ** | 0.386 | |||
| 1 vs. 4 | <0.001 ** | 0.794 | ||||||
| One to three times a month (3) | 33 | (8) | 2 vs. 3 | 0.228 | −0.172 | |||
| 2 vs. 4 | 0.012 * | 0.253 | ||||||
| Hardly ever, or never (4) | 30 | (9) | 3 vs. 4 | 0.002 ** | 0.406 | |||
| Vigorous physical activity frequency | ||||||||
| More than once a week (1) | 37 | (8) | 90.0 | 3 | <0.001 | |||
| 1 vs. 2 | 0.600 | 0.182 | ||||||
| Once a week (2) | 36 | (9) | 1 vs. 3 | 0.002 ** | 0.384 | |||
| 1 vs. 4 | <0.001 ** | 0.581 | ||||||
| One to three times a month (3) | 33 | (9) | 2 vs. 3 | 0.172 | 0.199 | |||
| 2 vs. 4 | <0.001 ** | 0.403 | ||||||
| Hardly ever, or never (4) | 32 | (9) | 3 vs. 4 | 0.095 | 0.214 | |||
| Node | n | Percent | Mean |
|---|---|---|---|
| No Depression; Do More than a Week Moderate Physical Activity | 249 | 24.3% | 38.7 |
| No Depression; Do Once a week, One to three times a month, Hardly ever, or never moderate Physical Activity | 153 | 14.9% | 35.0 |
| Depression; SPH: Excellent or very good or good or fair; Do More than a week moderate Physical Activity; Educational Levell: Upper secondary or Post-secondary non-tertiary or First stage of tertiary | 132 | 12.9% | 34.9 |
| Depression; SPH Excellent or very good or good or fair; Do More than a week moderate Physical Activity; None or pre-primary or Primary or Low secondary or Second stage of tertiary education | 65 | 6.3% | 32.3 |
| Depression; SPH Excellent or very good or good or fair; Do Once a week, One to three times a month, Hardly ever, or never moderate Physical Activity | 153 | 14.9% | 30.9 |
| Depression; SPH: Poor; Do More than a week or One to three times a month moderate Physical Activity | 122 | 11.9% | 30.1 |
| Depression; SPH: Poor; Do Once a week or Hardly ever, or never moderate Physical Activity | 151 | 14.7% | 27.8 |
| Independent Variable | Importance | Normalized Importance | |
|---|---|---|---|
| Depression | 9.253 | 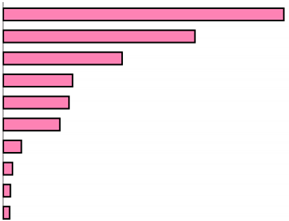 | 100.0% |
| Self-perceived health | 6.286 | 67.9% | |
| Moderate Physical Activity Frequency | 3.945 | 42.6% | |
| Education level | 2.237 | 24.2% | |
| Vigorous Physical Activity Frequency | 2.181 | 23.6% | |
| Level of pain | 1.869 | 20.2% | |
| Age | 0.369 | 4.0% | |
| Sex | 0.223 | 2.4% | |
| BMI | 0.220 | 2.4% | |
| Smoke at the present time | 0.217 | 2.3% | |
| Estimation | (SE) | ||
| Cross-Validation (5 levels; 8 nodes terminals) | 32.8 | (1.4) | |
| Model performance (R2) | 27% | ||
| Cross-Validation (4 levels; 7 nodes terminals) | 31.7 | (1.4) | |
| Model performance (R2) | 30% | ||
| 95% CI for B | |||||||
|---|---|---|---|---|---|---|---|
| B | St. | Beta | t | Sig. | Lower | Upper | |
| (Constante) | 44.376 | 1.301 | 34.110 | <0.001 *** | 41.818 | 46.933 | |
| Depression | −4.543 | 0.589 | −0.333 | −7.719 | <0.001 *** | −5.700 | −3.386 |
| Self-perceived health | −2.493 | 0.362 | −0.312 | −6.886 | <0.001 *** | −3.204 | −1.781 |
| Moderate Physical Activity Frequency | −0.772 | 0.234 | −0.137 | −3.306 | 0.001 ** | −1.231 | −0.313 |
| Education level | 0.601 | 0.209 | 0.117 | 2.883 | 0.004 ** | 0.191 | 1.012 |
| Adjusted R2 (error of estimation) | 38% | 5.298 | |||||
Disclaimer/Publisher’s Note: The statements, opinions and data contained in all publications are solely those of the individual author(s) and contributor(s) and not of MDPI and/or the editor(s). MDPI and/or the editor(s) disclaim responsibility for any injury to people or property resulting from any ideas, methods, instructions or products referred to in the content. |
© 2025 by the authors. Licensee MDPI, Basel, Switzerland. This article is an open access article distributed under the terms and conditions of the Creative Commons Attribution (CC BY) license (https://creativecommons.org/licenses/by/4.0/).
Share and Cite
Denche-Zamorano, A.; Collado-Mateo, D.; Franco-Garcia, J.M.; Adsuar, J.C.; Salas-Gómez, D. Quality of Life in European Adults and Older with All-Over Pain: Relationship with Frequency of Moderate and Vigorous Physical Activity and Decision Prediction Models with Cross-Sectional Data. Healthcare 2025, 13, 1171. https://doi.org/10.3390/healthcare13101171
Denche-Zamorano A, Collado-Mateo D, Franco-Garcia JM, Adsuar JC, Salas-Gómez D. Quality of Life in European Adults and Older with All-Over Pain: Relationship with Frequency of Moderate and Vigorous Physical Activity and Decision Prediction Models with Cross-Sectional Data. Healthcare. 2025; 13(10):1171. https://doi.org/10.3390/healthcare13101171
Chicago/Turabian StyleDenche-Zamorano, Angel, Daniel Collado-Mateo, Juan Manuel Franco-Garcia, José Carmelo Adsuar, and Diana Salas-Gómez. 2025. "Quality of Life in European Adults and Older with All-Over Pain: Relationship with Frequency of Moderate and Vigorous Physical Activity and Decision Prediction Models with Cross-Sectional Data" Healthcare 13, no. 10: 1171. https://doi.org/10.3390/healthcare13101171
APA StyleDenche-Zamorano, A., Collado-Mateo, D., Franco-Garcia, J. M., Adsuar, J. C., & Salas-Gómez, D. (2025). Quality of Life in European Adults and Older with All-Over Pain: Relationship with Frequency of Moderate and Vigorous Physical Activity and Decision Prediction Models with Cross-Sectional Data. Healthcare, 13(10), 1171. https://doi.org/10.3390/healthcare13101171