
The Association Between Sleep Health and a History of Cataract Surgery in the United States Based on the National Health and Nutrition Examination Survey (NHANES) 2005–2008
Abstract
1. Introduction
2. Methods
2.1. Data and Study Sample
2.2. Cataract Surgery Assessment
2.3. Assessment of Sleep-Related Variables
2.4. Assessment of Covariates
2.5. Data Analysis
3. Results
3.1. Characteristics of Participants
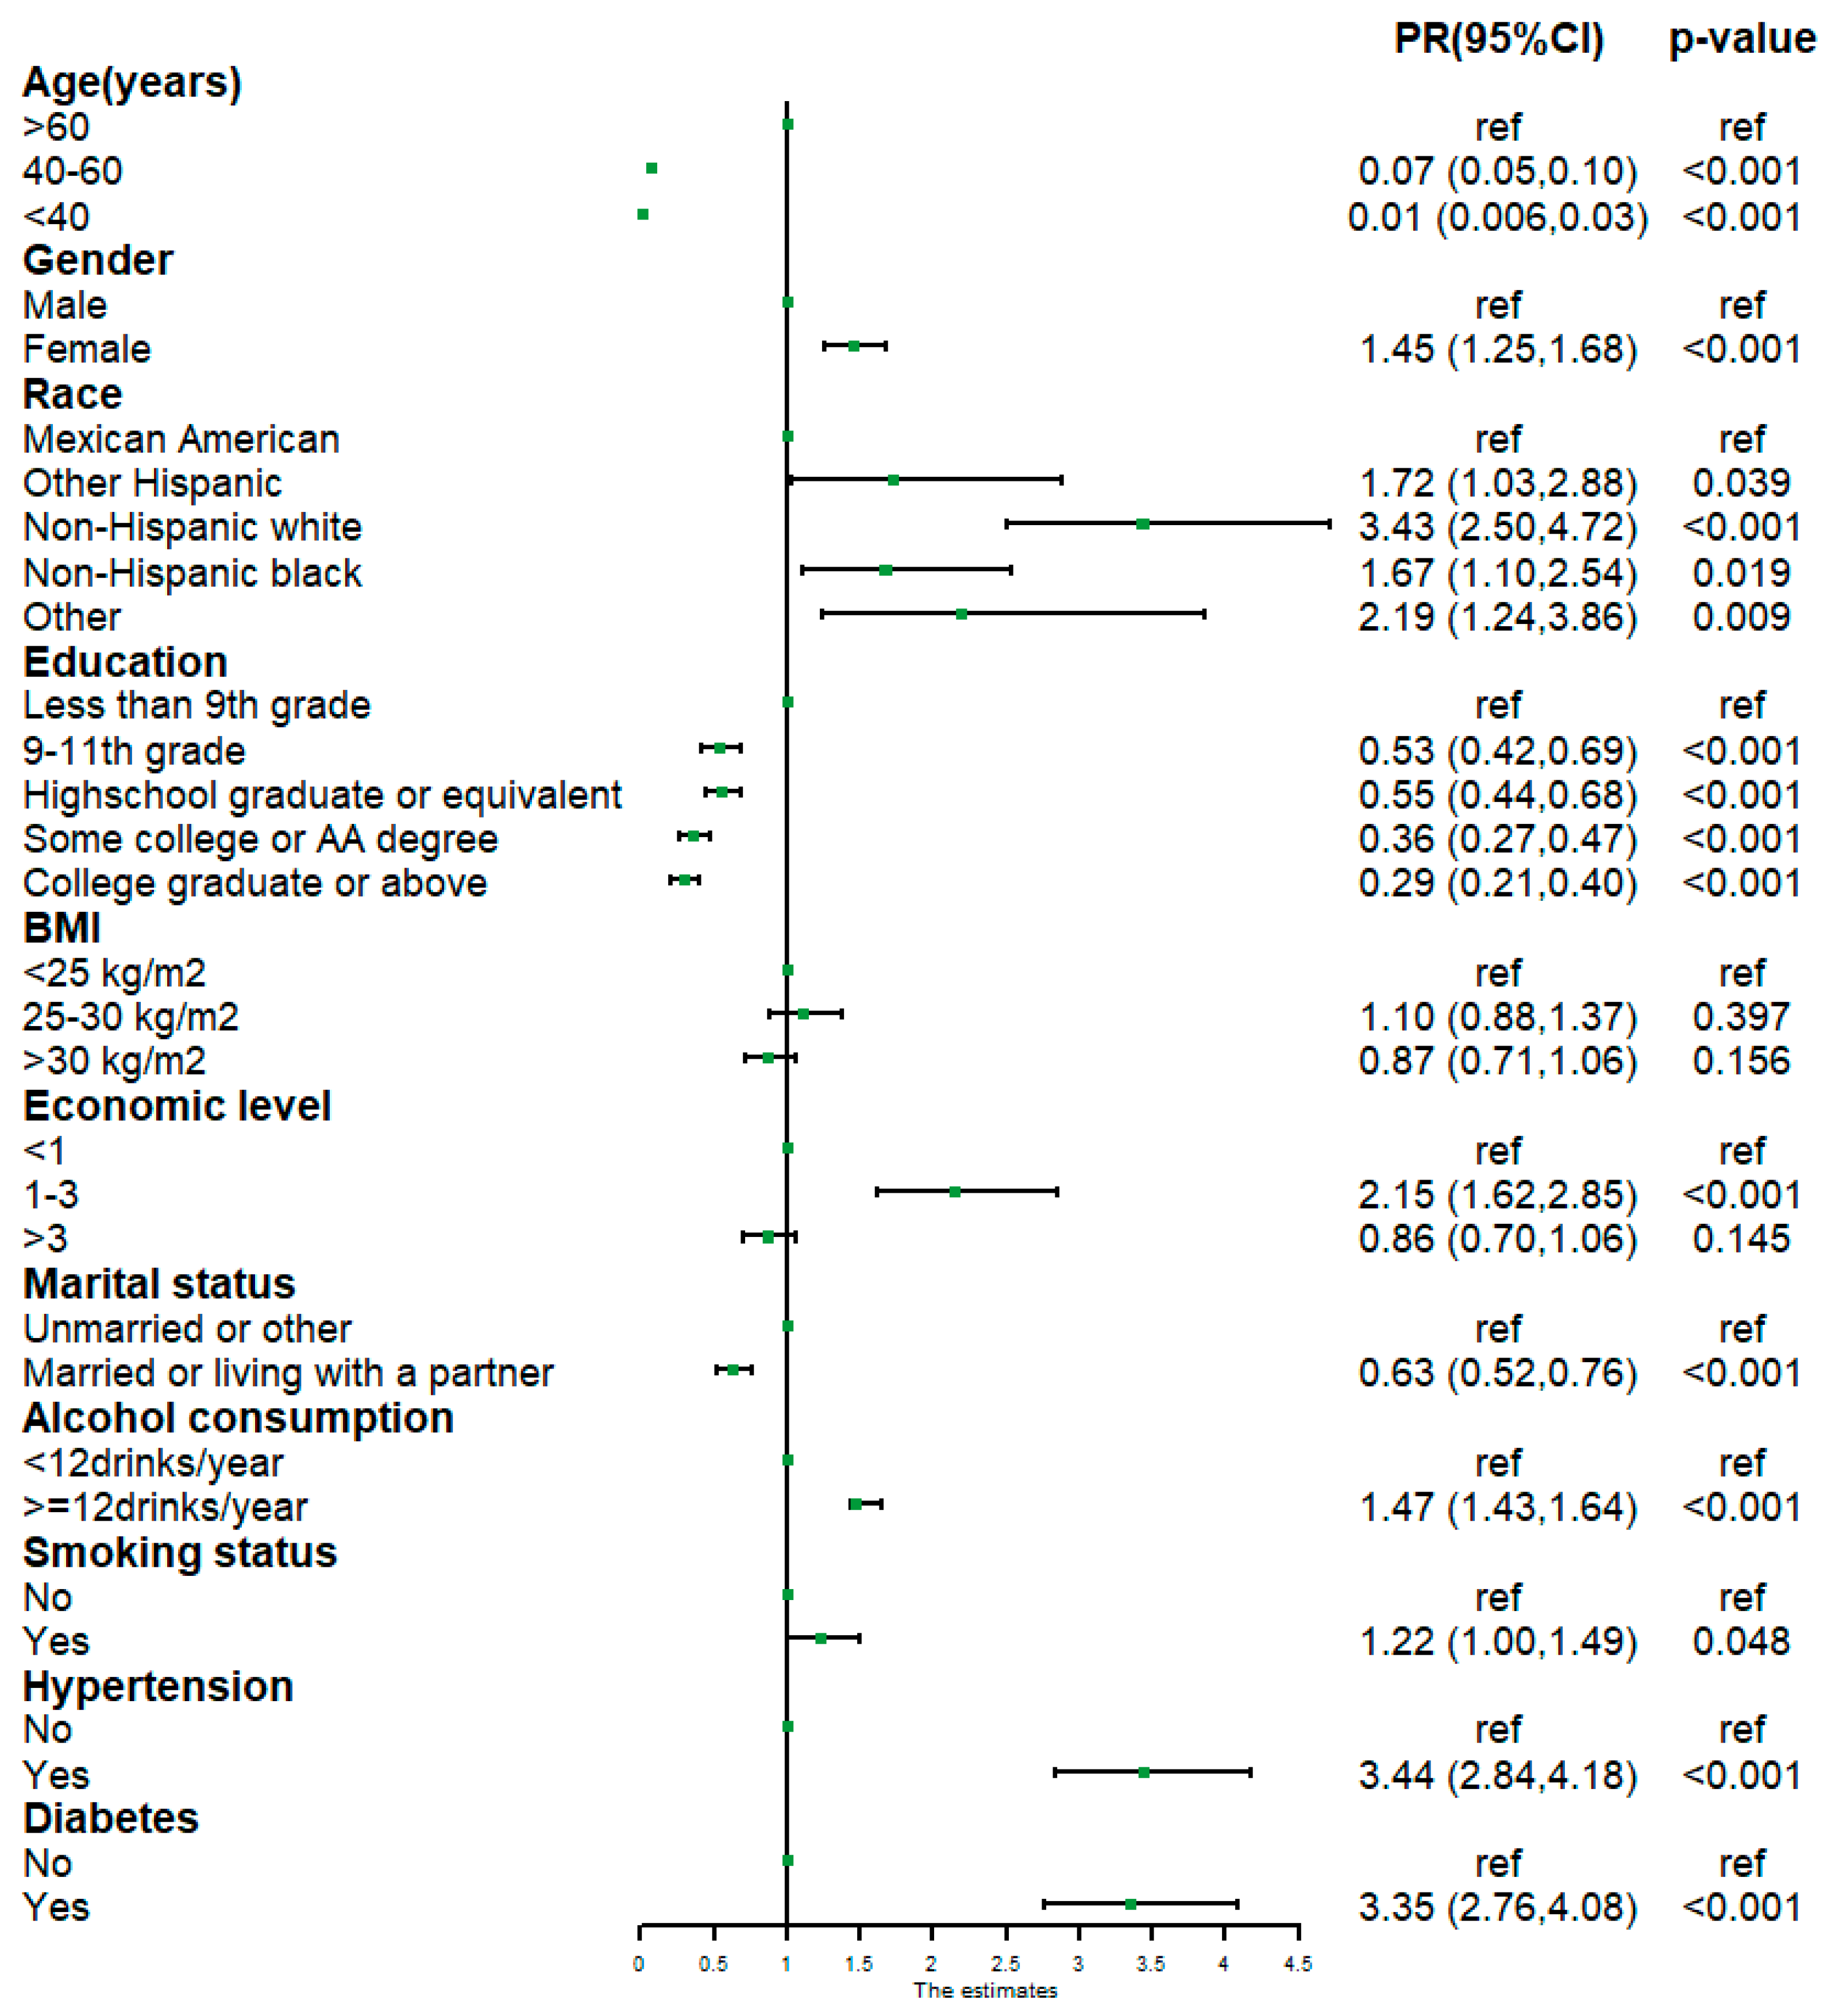
3.2. Univariable Poisson Regression Analysis of Cataract-Related Variables
3.3. Association Between Sleep and History of Cataract Surgery
3.4. Subgroup Analyses
3.5. Sensitivity Analyses
4. Discussion
5. Conclusions
Supplementary Materials
Author Contributions
Funding
Institutional Review Board Statement
Informed Consent Statement
Data Availability Statement
Acknowledgments
Conflicts of Interest
References
- Allen, D. Cataract. BMJ Clin. Evid. 2011, 2011, 0708. [Google Scholar] [PubMed]
- Leske, M.C.; Sperduto, R.D. The epidemiology of senile cataracts: A review. Am. J. Epidemiol. 1983, 118, 152–165. [Google Scholar] [CrossRef] [PubMed]
- Klein, B.E.; Klein, R.; Lee, K.E. Diabetes, cardiovascular disease, selected cardiovascular disease risk factors, and the 5-year incidence of age-related cataract and progression of lens opacities: The Beaver Dam Eye Study. Am. J. Ophthalmol. 1998, 126, 782–790. [Google Scholar] [CrossRef] [PubMed]
- Hodge, W.G.; Whitcher, J.P.; Satariano, W. Risk factors for age-related cataracts. Epidemiol. Rev. 1995, 17, 336–346. [Google Scholar] [CrossRef]
- Wu, T.H.; Jiang, B.; Liu, W.M.; Li, J.Q.; Song, Z.Y.; Lu, P.R. Time trends and gender disparities of Chinese cataract burden and their predictions. Int. J. Ophthalmol. 2023, 16, 1527–1534. [Google Scholar] [CrossRef]
- Fernandes, A.G.; Alves, M.; Nascimento, R.; Valdrighi, N.Y.; de Almeida, R.C.; Nakano, C.T. Visual impairment and blindness in the Xingu Indigenous Park–Brazil. Int. J. Equity Health 2021, 20, 197. [Google Scholar] [CrossRef]
- Shahbazi, S.; Studnicki, J.; Warner-Hillard, C.W. A Cross-Sectional Retrospective Analysis of the Racial and Geographic Variations in Cataract Surgery. PLoS ONE 2015, 10, e142459. [Google Scholar] [CrossRef]
- Foster, A. Vision 2020: The cataract challenge. Community Eye Health 2000, 13, 17–19. [Google Scholar]
- Brodt, S.; Inostroza, M.; Niethard, N.; Born, J. Sleep-A brain-state serving systems memory consolidation. Neuron 2023, 111, 1050–1075. [Google Scholar] [CrossRef]
- Uji, M.; Tamaki, M. Sleep, learning, and memory in human research using noninvasive neuroimaging techniques. Neurosci. Res. 2023, 189, 66–74. [Google Scholar] [CrossRef]
- Watson, N.F.; Badr, M.S.; Belenky, G.; Bliwise, D.L.; Buxton, O.M.; Buysse, D.; Dinges, D.F.; Gangwisch, J.; Grandner, M.A.; Kushida, C.; et al. Recommended Amount of Sleep for a Healthy Adult: A Joint Consensus Statement of the American Academy of Sleep Medicine and Sleep Research Society. Sleep 2015, 38, 843–844. [Google Scholar] [CrossRef] [PubMed]
- Steffey, M.A.; Scharf, V.F.; Risselada, M.; Buote, N.J.; Griffon, D.; Winter, A.L.; Zamprogno, H. A narrative review of the pathophysiology and impacts of insufficient and disrupted sleep. Can. Vet. J. 2023, 64, 579–587. [Google Scholar] [PubMed]
- Liu, P.K.; Chang, Y.C.; Wang, N.K.; Ryu, J.; Tsai, R.K.; Hsu, S.L.; Hung, J.Y.; Hsu, C.Y.; Tai, M.H.; Tsai, M.J. The association between cataract and sleep apnea: A nationwide population-based cohort study. J. Clin. Sleep. Med. 2022, 18, 769–777. [Google Scholar] [CrossRef] [PubMed]
- Jee, D.; Keum, N.; Kang, S.; Arroyo, J.G. Sleep and diabetic retinopathy. Acta Ophthalmol. 2017, 95, 41–47. [Google Scholar] [CrossRef]
- Li, C.; Shang, S. Relationship between Sleep and Hypertension: Findings from the NHANES (2007–2014). Int. J. Environ. Res. Public Health 2021, 18, 7867. [Google Scholar] [CrossRef]
- Chunnan, L.; Shaomei, S.; Wannian, L. The association between sleep and depressive symptoms in US adults: Data from the NHANES (2007–2014). Epidemiol. Psychiatr. Sci. 2022, 31, e63. [Google Scholar] [CrossRef]
- Wei, B.; Hu, X.; Shu, B.L.; Huang, Q.Y.; Chai, H.; Yuan, H.Y.; Zhou, L.; Duan, Y.C.; Yao, L.L.; Dong, Z.E.; et al. Association of triglyceride-glucose index and derived indices with cataract in middle-aged and elderly Americans: NHANES 2005–2008. Lipids Health Dis. 2025, 24, 48. [Google Scholar] [CrossRef]
- Li, X.; Du, G.L.; Wu, S.N.; Sun, Y.Q.; Zhang, S.Q.; Zhang, Z.J.; Tang, J.F. Association between systemic immune inflammation index and cataract incidence from 2005 to 2008. Sci. Rep. 2025, 15, 499. [Google Scholar] [CrossRef]
- Peltzer, K.; Pengpid, S. Self-Reported Sleep Duration and Its Correlates with Sociodemographics, Health Behaviours, Poor Mental Health, and Chronic Conditions in Rural Persons 40 Years and Older in South Africa. Int. J. Environ. Res. Public Health 2018, 15, 1357. [Google Scholar] [CrossRef]
- Zhou, M.; Li, D.L.; Kai, J.Y.; Zhang, X.F.; Pan, C.W. Sleep duration and the risk of major eye disorders: A systematic review and meta-analysis. Eye 2023, 37, 2707–2715. [Google Scholar] [CrossRef]
- Rim, T.H.; Kim, D.W.; Kim, S.E.; Kim, S.S. Factors Associated with Cataract in Korea, A Community Health Survey 2008-2012. Yonsei Med. J. 2015, 56, 1663–1670. [Google Scholar] [CrossRef] [PubMed]
- Knutson, K.L.; Leproult, R. Apples to oranges: Comparing long sleep to short sleep. J. Sleep Res. 2010, 19, 118. [Google Scholar] [CrossRef] [PubMed]
- Grandner, M.A.; Drummond, S.P. Who are the long sleepers? Towards an understanding of the mortality relationship. Sleep Med. Rev. 2007, 11, 341–360. [Google Scholar] [CrossRef] [PubMed]
- Jin, Q.H.; Chen, H.H.; Yu, H.L.; Li, T.L. The relationship between sleep quality and glucose level, diabetic complications in elderly type 2 diabetes mellitus. Chin. J. Intern. Med. 2012, 51, 357–361. [Google Scholar]
- Ip, M.; Mokhlesi, B. Sleep and Glucose Intolerance/Diabetes Mellitus. Sleep Med. Clin. 2007, 2, 19–29. [Google Scholar] [CrossRef]
- Spiegel, K.; Leproult, R.; Van Cauter, E. Impact of sleep debt on metabolic and endocrine function. Lancet 1999, 354, 1435–1439. [Google Scholar] [CrossRef]
- Stamatakis, K.A.; Punjabi, N.M. Effects of sleep fragmentation on glucose metabolism in normal subjects. Chest 2010, 137, 95–101. [Google Scholar] [CrossRef]
- Gottlieb, D.J.; Punjabi, N.M.; Newman, A.B.; Resnick, H.E.; Redline, S.; Baldwin, C.M.; Nieto, F.J. Association of sleep time with diabetes mellitus and impaired glucose tolerance. Arch. Intern. Med. 2005, 165, 863–867. [Google Scholar] [CrossRef]
- Cai, Y.; Chen, M.; Zhai, W.; Wang, C. Interaction between trouble sleeping and depression on hypertension in the NHANES 2005–2018. BMC Public Health 2022, 22, 481. [Google Scholar] [CrossRef]
- Li, C.; Shang, S.; Liang, W. Sleep and risk of hypertension in general American adults: The National Health and Nutrition Examination Surveys (2015–2018). J. Hypertens. 2023, 41, 63–73. [Google Scholar] [CrossRef]
- Pandi-Perumal, S.R.; Monti, J.M.; Burman, D.; Karthikeyan, R.; BaHammam, A.S.; Spence, D.W.; Brown, G.M.; Narashimhan, M. Clarifying the role of sleep in depression: A narrative review. Psychiatry Res. 2020, 291, 113239. [Google Scholar] [CrossRef] [PubMed]
- Wu, Z.; Hu, H.; Wang, C.; Rao, J.; Wu, J.; Shi, Y.; Fu, Y.; Cheng, X.; Li, P. Sleep Patterns Modify the Association between Vitamin D Status and Coronary Heart Disease: Results from NHANES 2005–2008. J. Nutr. 2023, 153, 1398–1406. [Google Scholar] [CrossRef] [PubMed]
- Yin, J.; Gong, R.; Zhang, M.; Ding, L.; Shen, T.; Cai, Y.; He, S.; Peng, D. Associations between sleep disturbance, inflammatory markers and depressive symptoms, Mediation analyses in a large NHANES community sample. Prog. Neuro-Psychopharmacol. Biol. Psychiatry 2023, 126, 110786. [Google Scholar] [CrossRef] [PubMed]
- Waltz, X.; Beaudin, A.E.; Belaidi, E.; Raneri, J.; Pépin, J.-L.; Pialoux, V.; Hanly, P.J.; Verges, S.; Poulin, M.J. Impact of obstructive sleep apnoea and intermittent hypoxia on blood rheology: A translational study. Eur. Respir. J. 2021, 58, 2100352. [Google Scholar] [CrossRef]
- Sutkowy, P.; Lesiewska, H.; Woźniak, A.; Malukiewicz, G. Inflammation-Involved Proteins in Blood Serum of Cataract Patients-A Preliminary Study. Biomedicines 2023, 11, 2607. [Google Scholar] [CrossRef]
- Williams, D.L. Oxidation, antioxidants and cataract formation: A literature review. Vet. Ophthalmol. 2006, 9, 292–298. [Google Scholar] [CrossRef]
- Ruiss, M.; Findl, O.; Kronschlager, M. The human lens: An antioxidant-dependent tissue revealed by the role of caffeine. Ageing Res. Rev. 2022, 79, 101664. [Google Scholar] [CrossRef]
- De Nys, L.; Anderson, K.; Ofosu, E.F.; Ryde, G.C.; Connelly, J.; Whittaker, A.C. The effects of physical activity on cortisol and sleep: A systematic review and meta-analysis. Psychoneuroendocrinology 2022, 143, 105843. [Google Scholar] [CrossRef]
- Zheng, X.Y.; Xu, J.; Chen, X.I.; Li, W.; Wang, T.Y. Attenuation of oxygen fluctuation-induced endoplasmic reticulum stress in human lens epithelial cells. Exp. Ther. Med. 2015, 10, 1883–1887. [Google Scholar] [CrossRef]
- Levy, B.H.; Tasker, J.G. Synaptic regulation of the hypothalamic-pituitary-adrenal axis and its modulation by glucocorticoids and stress. Front. Cell Neurosci. 2012, 6, 24. [Google Scholar] [CrossRef]

| All | Non-Cataract Surgery | Cataract Surgery | p-Value | |
|---|---|---|---|---|
| Number | 8591 | 7817 (93.4) | 774 (6.6) | |
| Gender (N, %) | <0.001 | |||
| Male | 4183 (48.2) | 3819 (48.9) | 364 (39.1) | |
| Female | 4408 (51.8) | 3998 (51.1) | 410 (60.9) | |
| Age [years, mean (SD)] | 46.26 (16.55) | 44.43 (15.28) | 72.22 (11.48) | <0.001 |
| Ethnicity (N, %) | <0.001 | |||
| Mexican American | 1556 (7.9) | 1497(8.2) | 59 (2.7) | |
| Other Hispanic | 602 (3.9) | 562(4.0) | 40 (2.3) | |
| Non-Hispanic white | 4277 (72.1) | 3730(71.2) | 547 (84.8) | |
| Non-Hispanic black | 1830 (10.9) | 1721(11.2) | 109 (6.2) | |
| Other | 326 (5.3) | 307(5.4) | 19 (3.9) | |
| Education (N, %) | <0.001 | |||
| Less than 9th grade | 997 (5.9) | 835 (5.4) | 162 (13.2) | |
| 9th–11th grade | 1417 (12.2) | 1290 (12.1) | 127 (14.6) | |
| High school graduate or equivalent | 2078 (24.8) | 1874 (24.4) | 204 (30.3) | |
| Some college or AA degree | 2366 (30.6) | 2200 (31.0) | 166 (24.4) | |
| College graduate or above | 1733 (26.5) | 1618 (27.2) | 115 (17.4) | |
| BMI (N, %) | 0.085 | |||
| <25 kg/m2 | 2554 (32.5) | 2318 (32.4) | 236 (32.8) | |
| 25–30 kg/m2 | 2981 (33.9) | 2689 (33.6) | 292 (37.6) | |
| >30 kg/m2 | 3056 (33.7) | 2810 (34.0) | 246 (29.6) | |
| Economic level (N, %) | <0.001 | |||
| <1 | 1596 (12.0) | 1481 (12.3) | 115 (9.0) | |
| 1–3 | 3640 (35.8) | 3189 (34.3) | 451 (57.6) | |
| >3 | 3355 (52.1) | 3147 (53.4) | 208 (33.4) | |
| Marital status (N, %) | <0.001 | |||
| Unmarried or other | 5350 (65.6) | 4941 (66.4) | 409 (54.5) | |
| Married or living with a partner | 3241 (34.4) | 2876 (33.6) | 365 (45.5) | |
| Alcohol consumption (N, %) | <0.001 | |||
| ≥12 drinks/year | 6028 (74.8) | 5567 (75.8) | 461 (61.1) | |
| <12 cups/year | 2563 (25.2) | 2250 (24.2) | 313 (38.9) | |
| Smoking status (N, %) | 0.047 | |||
| Yes | 4115 (48.2) | 3700 (47.8) | 415 (53.2) | |
| No | 4476 (51.8) | 4117 (52.2) | 359 (46.8) | |
| Hypertension (N, %) | <0.001 | |||
| Yes | 2876 (29.8) | 2407 (27.7) | 469 (59.4) | |
| No | 5715 (70.2) | 5410 (72.3) | 305 (40.6) | |
| Diabetes (N, %) | <0.001 | |||
| Yes | 963 (8.0) | 767 (6.9) | 196 (22.5) | |
| No | 7628 (92.0) | 7050 (93.1) | 578 (77.5) | |
| Sleep time (N, %) | <0.001 | |||
| <7 | 3330 (36.4) | 3060 (36.6) | 270 (33.4) | |
| 7–9 | 5030 (61.3) | 4570 (61.4) | 460 (61.1) | |
| >9 | 231 (2.2) | 187 (2.0) | 44 (5.4) | |
| Falling asleep time [min, mean (SD)] | 21.36 (19.12) | 21.21 (19.03) | 23.42 (20.21) | 0.050 |
| Sleep trouble (N, %) | <0.001 | |||
| Yes | 1945 (24.3) | 1698 (23.5) | 247 (34.6) | |
| No | 6646 (75.7) | 6119 (76.5) | 527 (65.4) | |
| Sleep disorder (N, %) | 0.515 | |||
| Yes | 619 (7.3) | 550 (7.3) | 69 (7.9) | |
| No | 7972 (92.7) | 7267 (92.7) | 705 (92.1) | |
| Sleep patterns (N, %) | <0.001 | |||
| Healthy sleep | 4121 (48.7) | 3780 (49.0) | 341 (43.9) | |
| Intermediate sleep | 3115 (35.5) | 2846 (35.6) | 269 (34.5) | |
| Poor sleep | 1355 (15.8) | 1191 (15.4) | 164 (21.6) |
| Sleep Pattern (Col%) | ||||
|---|---|---|---|---|
| Healthy | Intermediate | Poor | p-Value | |
| Number | 3791 (48.7) | 3387 (35.5) | 1413 (15.8) | |
| Gender (N, %) | 0.003 | |||
| Male | 1888 (49.6) | 1685 (49.5) | 610 (41.8) | |
| Female | 1903 (50.4) | 1702 (50.5) | 803 (58.2) | |
| Age [years, mean (SD)] | 45.47 (16.70) | 45.66 (16.67) | 49.75 (15.41) | <0.001 |
| Ethnicity (N, %) | <0.001 | |||
| Mexican American | 832 (9.5) | 574 (7.5) | 150 (4.2) | |
| Other Hispanic | 285 (4.3) | 214 (3.7) | 103 (3.4) | |
| Non-Hispanic White | 1917 (72.8) | 1569 (69.2) | 791 (76.7) | |
| Non-Hispanic Black | 614 (8.0) | 898 (14.2) | 318 (11.1) | |
| Other | 143 (5.4) | 132 (5.5) | 51 (4.6) | |
| Education (N, %) | <0.001 | |||
| Less than 9th grade | 482 (6.3) | 356 (5.3) | 159 (6.0) | |
| 9th–11th grade | 614 (11.5) | 588 (13.3) | 215 (11.8) | |
| High school graduate or equivalent | 868 (22.9) | 842 (25.7) | 368 (27.8) | |
| Some college or AA degree | 982 (28.7) | 952 (31.3) | 432 (33.9) | |
| College graduate or above | 845 (30.6) | 649 (24.3) | 239 (20.4) | |
| BMI (N, %) | <0.001 | |||
| <25 kg/m 2 | 1229 (35.9) | 996 (31.3) | 329 (25.7) | |
| 25–30 kg/m 2 | 1392 (34.7) | 1171 (35.1) | 418 (28.6) | |
| >30 kg/m 2 | 1170 (29.4) | 1220 (33.6) | 666 (45.6) | |
| Economic level (N, %) | 0.001 | |||
| <1 | 682 (11.2) | 593 (11.4) | 321 (15.9) | |
| 1–3 | 1556 (33.5) | 1500 (38.9) | 584 (35.1) | |
| >3 | 1553 (55.3) | 1294 (49.7) | 508 (49.0) | |
| Marital status (N, %) | <0.001 | |||
| Unmarried or other | 1278 (31.1) | 1340 (35.8) | 614 (39.9) | |
| Married or living with a partner | 2504 (68.9) | 2047 (64.2) | 799 (60.1) | |
| Alcohol consumption (N, %) | 0.009 | |||
| ≥12 drinks/year | 2684 (75.6) | 2385 (75.5) | 959 (71.3) | |
| <12 cups/year | 1107 (24.4) | 1002 (24.5) | 454 (28.7) | |
| Smoking status (N, %) | <0.001 | |||
| Yes | 1692 (44.7) | 1612 (48.6) | 811 (56.6) | |
| No | 2099 (55.3) | 1775 (51.4) | 602 (43.4) | |
| Hypertension (N, %) | <0.001 | |||
| Yes | 1024 (24.3) | 1119 (29.7) | 732 (44.9) | |
| No | 2767 (75.7) | 2268 (70.3) | 680 (55.1) | |
| Diabetes (N, %) | <0.001 | |||
| Yes | 340 (6.3) | 356 (7.0) | 267 (14.8) | |
| No | 3451 (93.7) | 3031 (93.0) | 1146 (85.1) | |
| Cataract surgery (N, %) | ||||
| Yes | 289 (5.3) | 310 (6.9) | 175 (9.1) | <0.001 |
| No | 3502 (94.7) | 3077 (93.1) | 1238 (90.9) | |
| Variable | Model 1 | Model 2 | Model 3 | |||
|---|---|---|---|---|---|---|
| PR (95%CI) | p-Value | PR (95%CI) | p-Value | PR (95%CI) | p-Value | |
| Sleep duration (continuous) | 1.15 (1.07, 1.24) | <0.001 | 0.99 (0.94, 1.05) | 0.834 | 1.00 (0.94, 1.06) | 0.996 |
| Sleep duration (multi-category) | ||||||
| 7–8 h | ref | ref | ref | ref | ||
| <7 h | 1.00 (0.78, 1.27) | 0.97 | 1.12 (0.91, 1.38) | 0.284 | 1.07 (0.87, 1.32) | 0.463 |
| >8 h | 2.26 (1.77, 2.90) | <0.001 | 1.21 (0.97, 1.51) | 0.083 | 1.17 (0.91, 1.49) | 0.196 |
| Sleep disorder | ||||||
| No | ref | ref | ref | |||
| Yes | 1.10 (0.83, 1.45) | 0.514 | 1.16 (0.88, 1.53) | 0.273 | 1.11 (0.82, 1.50) | 0.455 |
| Sleep trouble | ||||||
| No | ref | ref | ref | |||
| Yes | 1.65 (1.46, 1.86) | <0.001 | 1.46 (1.29, 1.66) | <0.001 | 1.40 (1.22, 1.62) | <0.001 |
| Sleep patterns | ||||||
| Healthy sleep | ref | ref | ref | |||
| Intermediate sleep | 1.29 (1.06, 1.57) | 0.0117 | 1.27 (1.09, 1.49) | 0.004 | 1.24 (1.05, 1.46) | 0.017 |
| Poor sleep | 1.70 (1.38, 2.10) | <0.001 | 1.46 (1.23, 1.74) | <0.001 | 1.36 (1.13, 1.64) | 0.004 |
| Healthy Sleep | Intermediate Sleep | Poor Sleep | p for Interaction | ||||
|---|---|---|---|---|---|---|---|
| Subgroup | PR (95%CI) | p-Value | PR (95%CI) | p-Value | |||
| Age (years) | 0.249 | ||||||
| <60 | 51/5796 | ref | 2.13 (0.91, 4.99) | 0.076 | 2.46 (0.95, 6.35) | 0.061 | |
| ≥60 | 723/2795 | ref | 1.18 (0.95, 1.47) | 0.116 | 1.29 (1.04, 1.61) | 0.025 | |
| Gender | 0.867 | ||||||
| Male | 364/4183 | ref | 1.19 (0.85, 1.66) | 0.291 | 1.39 (0.93, 2.08) | 0.102 | |
| Female | 410/4408 | ref | 1.27 (1.06, 1.53) | 0.015 | 1.37 (1.12, 1.69) | 0.006 | |
| Ethnicity | 0.832 | ||||||
| Mexican American | 59/1556 | ref | 0.90 (0.53, 1.52) | 0.660 | 1.55 (1.02, 2.34) | 0.040 | |
| Other Hispanic | 40/602 | ref | 1.60 (0.60, 4.27) | 0.270 | 1.57 (0.25, 9.95) | 0.561 | |
| Non-Hispanic white | 547/4277 | ref | 1.26 (1.06, 1.49) | 0.011 | 1.39 (1.14, 1.70) | 0.003 | |
| Non-Hispanic black | 109/1830 | ref | 1.15 (0.82, 1.62) | 0.389 | 1.28 (0.88, 1.87) | 0.185 | |
| Other | 19/326 | ref | 0.92 (0.23, 3.73) | 0.896 | 1.21 (0.25, 5.72) | 0.798 | |
| Education | 0.939 | ||||||
| Less than 9th grade | 162/997 | ref | 1.16 (0.74, 1.82) | 0.486 | 1.05 (0.75, 1.47) | 0.761 | |
| 9th–11th grade | 127/1417 | ref | 1.41 (0.92, 2.17) | 0.109 | 1.71 (1.03, 2.84) | 0.040 | |
| High school graduate or equivalent | 204/2078 | ref | 1.29 (0.99, 1.68) | 0.062 | 1.55 (1.04, 2.31) | 0.033 | |
| Some college or AA degree | 166/2366 | ref | 1.15 (0.83, 1.60) | 0.379 | 1.31 (0.79, 2.18) | 0.275 | |
| College graduate or above | 155/1773 | ref | 1.30 (0.79, 2.15) | 0.281 | 1.37 (0.69, 2.71) | 0.338 | |
| BMI | 0.062 | ||||||
| <25 kg/m2 | 236/2554 | ref | 1.36 (1.05, 1.75) | 0.023 | 1.32 (0.91, 1.93) | 0.133 | |
| 25–30 kg/m2 | 292/2981 | ref | 1.37 (0.99, 1.89) | 0.058 | 1.13 (0.82, 1.55) | 0.432 | |
| >30 kg/m2 | 246/3056 | ref | 0.79 (0.54, 1.16) | 0.208 | 1.48 (1.02, 2.41) | 0.040 | |
| Economic level | 0.465 | ||||||
| <1 | 115/1596 | ref | 0.86 (0.48, 1.53) | 0.576 | 1.33 (0.68, 2.64) | 0.374 | |
| 1–3 | 451/3640 | ref | 1.21 (1.00, 1.47) | 0.052 | 1.32 (1.02, 1.71) | 0.040 | |
| >3 | 208/3355 | ref | 1.45 (1.03, 2.04) | 0.034 | 1.41 (0.90, 2.21) | 0.119 | |
| Marital status | 0.562 | ||||||
| Unmarried or other | 365/3241 | ref | 1.10 (0.88, 1.39) | 0.361 | 1.21 (0.89, 1.66) | 0.198 | |
| Married or living with a partner | 409/5350 | ref | 1.33 (1.08, 1.64) | 0.011 | 1.44 (1.02, 2.04) | 0.040 | |
| Alcohol consumption | 0.751 | ||||||
| ≥12 drinks/year | 461/6028 | ref | 1.17 (0.94, 1.44) | 0.142 | 1.31 (1.02, 1.69) | 0.034 | |
| <12 cups/year | 313/2563 | ref | 1.33 (1.00, 1.76) | 0.047 | 1.43 (1.04, 1.97) | 0.032 | |
| Smoking status | 0.551 | ||||||
| Yes | 415/4115 | ref | 1.20 (0.91, 1.56) | 0.173 | 1.45 (1.13, 1.87) | 0.007 | |
| No | 359/4476 | ref | 1.26 (1.04, 1.54) | 0.024 | 1.28 (0.93, 1.72) | 0.127 | |
| Hypertension | 0.785 | ||||||
| Yes | 469/2876 | ref | 1.24 (1.01, 1.52) | 0.044 | 1.29 (0.97, 1.70) | 0.072 | |
| No | 305/5715 | ref | 1.20 (0.90, 1.60) | 0.188 | 1.46 (0.96, 2.22) | 0.075 | |
| Diabetes | 0.965 | ||||||
| Yes | 196/963 | ref | 1.18 (0.86, 1.60) | 0.271 | 1.32 (0.91, 1.91) | 0.123 | |
| No | 578/7628 | ref | 1.24 (1.01, 1.52) | 0.043 | 1.36 (1.06, 1.73) | 0.020 | |
| Subgroup | PR (95%CI) | p-Value | p for Interaction | |
|---|---|---|---|---|
| Age (years) | 0.338 | |||
| <60 | 51/5796 | 1.84 (1.00, 3.41) | 0.049 | |
| ≥60 | 723/2795 | 1.30 (1.12, 1.51) | 0.002 | |
| Gender | 0.448 | |||
| Male | 364/4183 | 1.29 (0.98, 1.70) | 0.070 | |
| Female | 410/4408 | 1.50 (1.29, 1.74) | <0.001 | |
| Ethnicity | 0.617 | |||
| Mexican American | 59/1556 | 2.37 (1.39, 4.03) | 0.004 | |
| Other Hispanic | 40/602 | 1.41 (0.36, 5.54) | 0.564 | |
| Non-Hispanic white | 547/4277 | 1.43 (1.23, 1.66) | <0.001 | |
| Non-Hispanic black | 109/1830 | 1.02 (0.67, 1.47) | 0.969 | |
| Other | 19/326 | 2.63 (0.52, 13.19) | 0.218 | |
| Education | 0.611 | |||
| Less than 9th grade | 162/997 | 1.16 (0.86, 1.56) | 0.321 | |
| 9th–11th grade | 127/1417 | 1.63 (1.14, 2.33) | 0.010 | |
| High school graduate or equivalent | 204/2078 | 1.59 (1.16, 2.18) | 0.006 | |
| Some college or AA degree | 166/2366 | 1.55 (1.06, 2.27) | 0.027 | |
| College graduate or above | 155/1773 | 1.22 (0.79, 1.88) | 0.350 | |
| BMI | 0.495 | |||
| <25 kg/m 2 | 236/2554 | 1.26 (0.97, 1.63) | 0.075 | |
| 25–30 kg/m 2 | 292/2981 | 1.36 (1.02, 1.81) | 0.040 | |
| >30 kg/m 2 | 246/3056 | 1.63 (1.19, 2.24) | 0.005 | |
| Economic level | 0.948 | |||
| <1 | 115/1596 | 1.32 (0.81, 2.14) | 0.238 | |
| 1–3 | 451/3640 | 1.38 (1.13, 1.68) | 0.004 | |
| >3 | 208/3355 | 1.44 (1.10, 1.89) | 0.012 | |
| Marital status | 0.901 | |||
| Unmarried or other | 409/5350 | 1.43 (1.08, 1.87) | 0.015 | |
| Married or living with a partner | 365/3241 | 1.33 (1.05, 1.67) | 0.020 | |
| Alcohol consumption | 0.319 | |||
| ≥12 drinks/year | 461/6028 | 1.34 (1.11, 1.61) | 0.005 | |
| <12 cups/year | 313/2563 | 1.53 (1.20, 1.96) | 0.002 | |
| Smoking status | 0.443 | |||
| Yes | 415/4115 | 1.35 (1.10, 1.66) | 0.008 | |
| No | 359/4476 | 1.49 (1.18, 1.89) | 0.003 | |
| Hypertension | 0.599 | |||
| Yes | 469/2876 | 1.34 (1.13, 1.58) | 0.002 | |
| No | 305/5715 | 1.50 (1.11, 2.03) | 0.013 | |
| Diabetes | 0.433 | |||
| Yes | 196/963 | 1.54 (1.14, 2.07) | 0.008 | |
| No | 578/7628 | 1.36 (1.15, 1.60) | 0.002 |
Disclaimer/Publisher’s Note: The statements, opinions and data contained in all publications are solely those of the individual author(s) and contributor(s) and not of MDPI and/or the editor(s). MDPI and/or the editor(s) disclaim responsibility for any injury to people or property resulting from any ideas, methods, instructions or products referred to in the content. |
© 2025 by the authors. Licensee MDPI, Basel, Switzerland. This article is an open access article distributed under the terms and conditions of the Creative Commons Attribution (CC BY) license (https://creativecommons.org/licenses/by/4.0/).
Share and Cite
Wang, C.; Bao, N.; Jiang, Z. The Association Between Sleep Health and a History of Cataract Surgery in the United States Based on the National Health and Nutrition Examination Survey (NHANES) 2005–2008. Healthcare 2025, 13, 1136. https://doi.org/10.3390/healthcare13101136
Wang C, Bao N, Jiang Z. The Association Between Sleep Health and a History of Cataract Surgery in the United States Based on the National Health and Nutrition Examination Survey (NHANES) 2005–2008. Healthcare. 2025; 13(10):1136. https://doi.org/10.3390/healthcare13101136
Chicago/Turabian StyleWang, Chuanxi, Ning Bao, and Zhengxuan Jiang. 2025. "The Association Between Sleep Health and a History of Cataract Surgery in the United States Based on the National Health and Nutrition Examination Survey (NHANES) 2005–2008" Healthcare 13, no. 10: 1136. https://doi.org/10.3390/healthcare13101136
APA StyleWang, C., Bao, N., & Jiang, Z. (2025). The Association Between Sleep Health and a History of Cataract Surgery in the United States Based on the National Health and Nutrition Examination Survey (NHANES) 2005–2008. Healthcare, 13(10), 1136. https://doi.org/10.3390/healthcare13101136