
Institutional Surgical Setting and Volume Effects of Certified Arthroplasty Centers in Germany: Evaluation of the Quality of Care in a 5-Year Comparison

 , ,
, , 
Abstract
1. Introduction
Background
- Proof of case volume: 200 (sECrs) or 100 (ECrs) of TJA with main responsibility (as primary surgeon, mandatory assistance by s/ECrs) performed over a minimum of 12 and a maximum of 24 months at the registered AC/ACmax;
- Specialist in orthopedics and trauma surgery;
- sECrs can only operate in an ACmax. Even if an ECrs in an AC meets the requirements, as mentioned above, for a sECrs, an upgrade to sECrs is not possible.
- Evidence of at least 50 (ECrs) or 100 (sECrs) arthroplasty procedures from TKA and THA (including revision surgery) per year at the center. The minimum volume refers to all performed or assisted surgeries;
- In addition, s/ECrs (senior EndoCert-registered surgeons and EndoCert-registered surgeons) must perform the majority (>50%) of their arthroplasty surgeries at the certified center. Depending on the type of center (AC vs. ACmax), one of the s/ECrs must have the additional qualification “Special Orthopedic Surgery”. Since 2021, it has been possible for s/ECrs to work at two ACs/ACmaxes and for the procedures to be allocated to the respective centers [18]. Klicken oder tippen Sie hier, um Text einzugeben.
2. Materials and Methods
- Reasons for s/ECrs having zero cases per year:
- -
- s/ECrs left the AC/ACmax at the beginning of the year;
- -
- s/ECrs was subsequently registered at the AC/ACmax at the end of the year.
- Reasons for s/ECrs having fewer than the total number of 50 cases per year:
- -
- s/ECrs left the AC/ACmax during the year;
- -
- s/ECrs was subsequently registered during the year;
- -
- s/ECrs fell ill/maternity leave/parental leave;
- -
- s/ECrs did not meet requirements;
- -
- Pandemic-related reduction in the number of cases in 2020 and 2021.
Statistical Analysis
3. Results
3.1. Center-Related Results
3.1.1. Number of EndoCert-Registered Surgeons and Senior EndoCert-Registered Surgeons Working in the Participating Centers in the Years 2017–2021
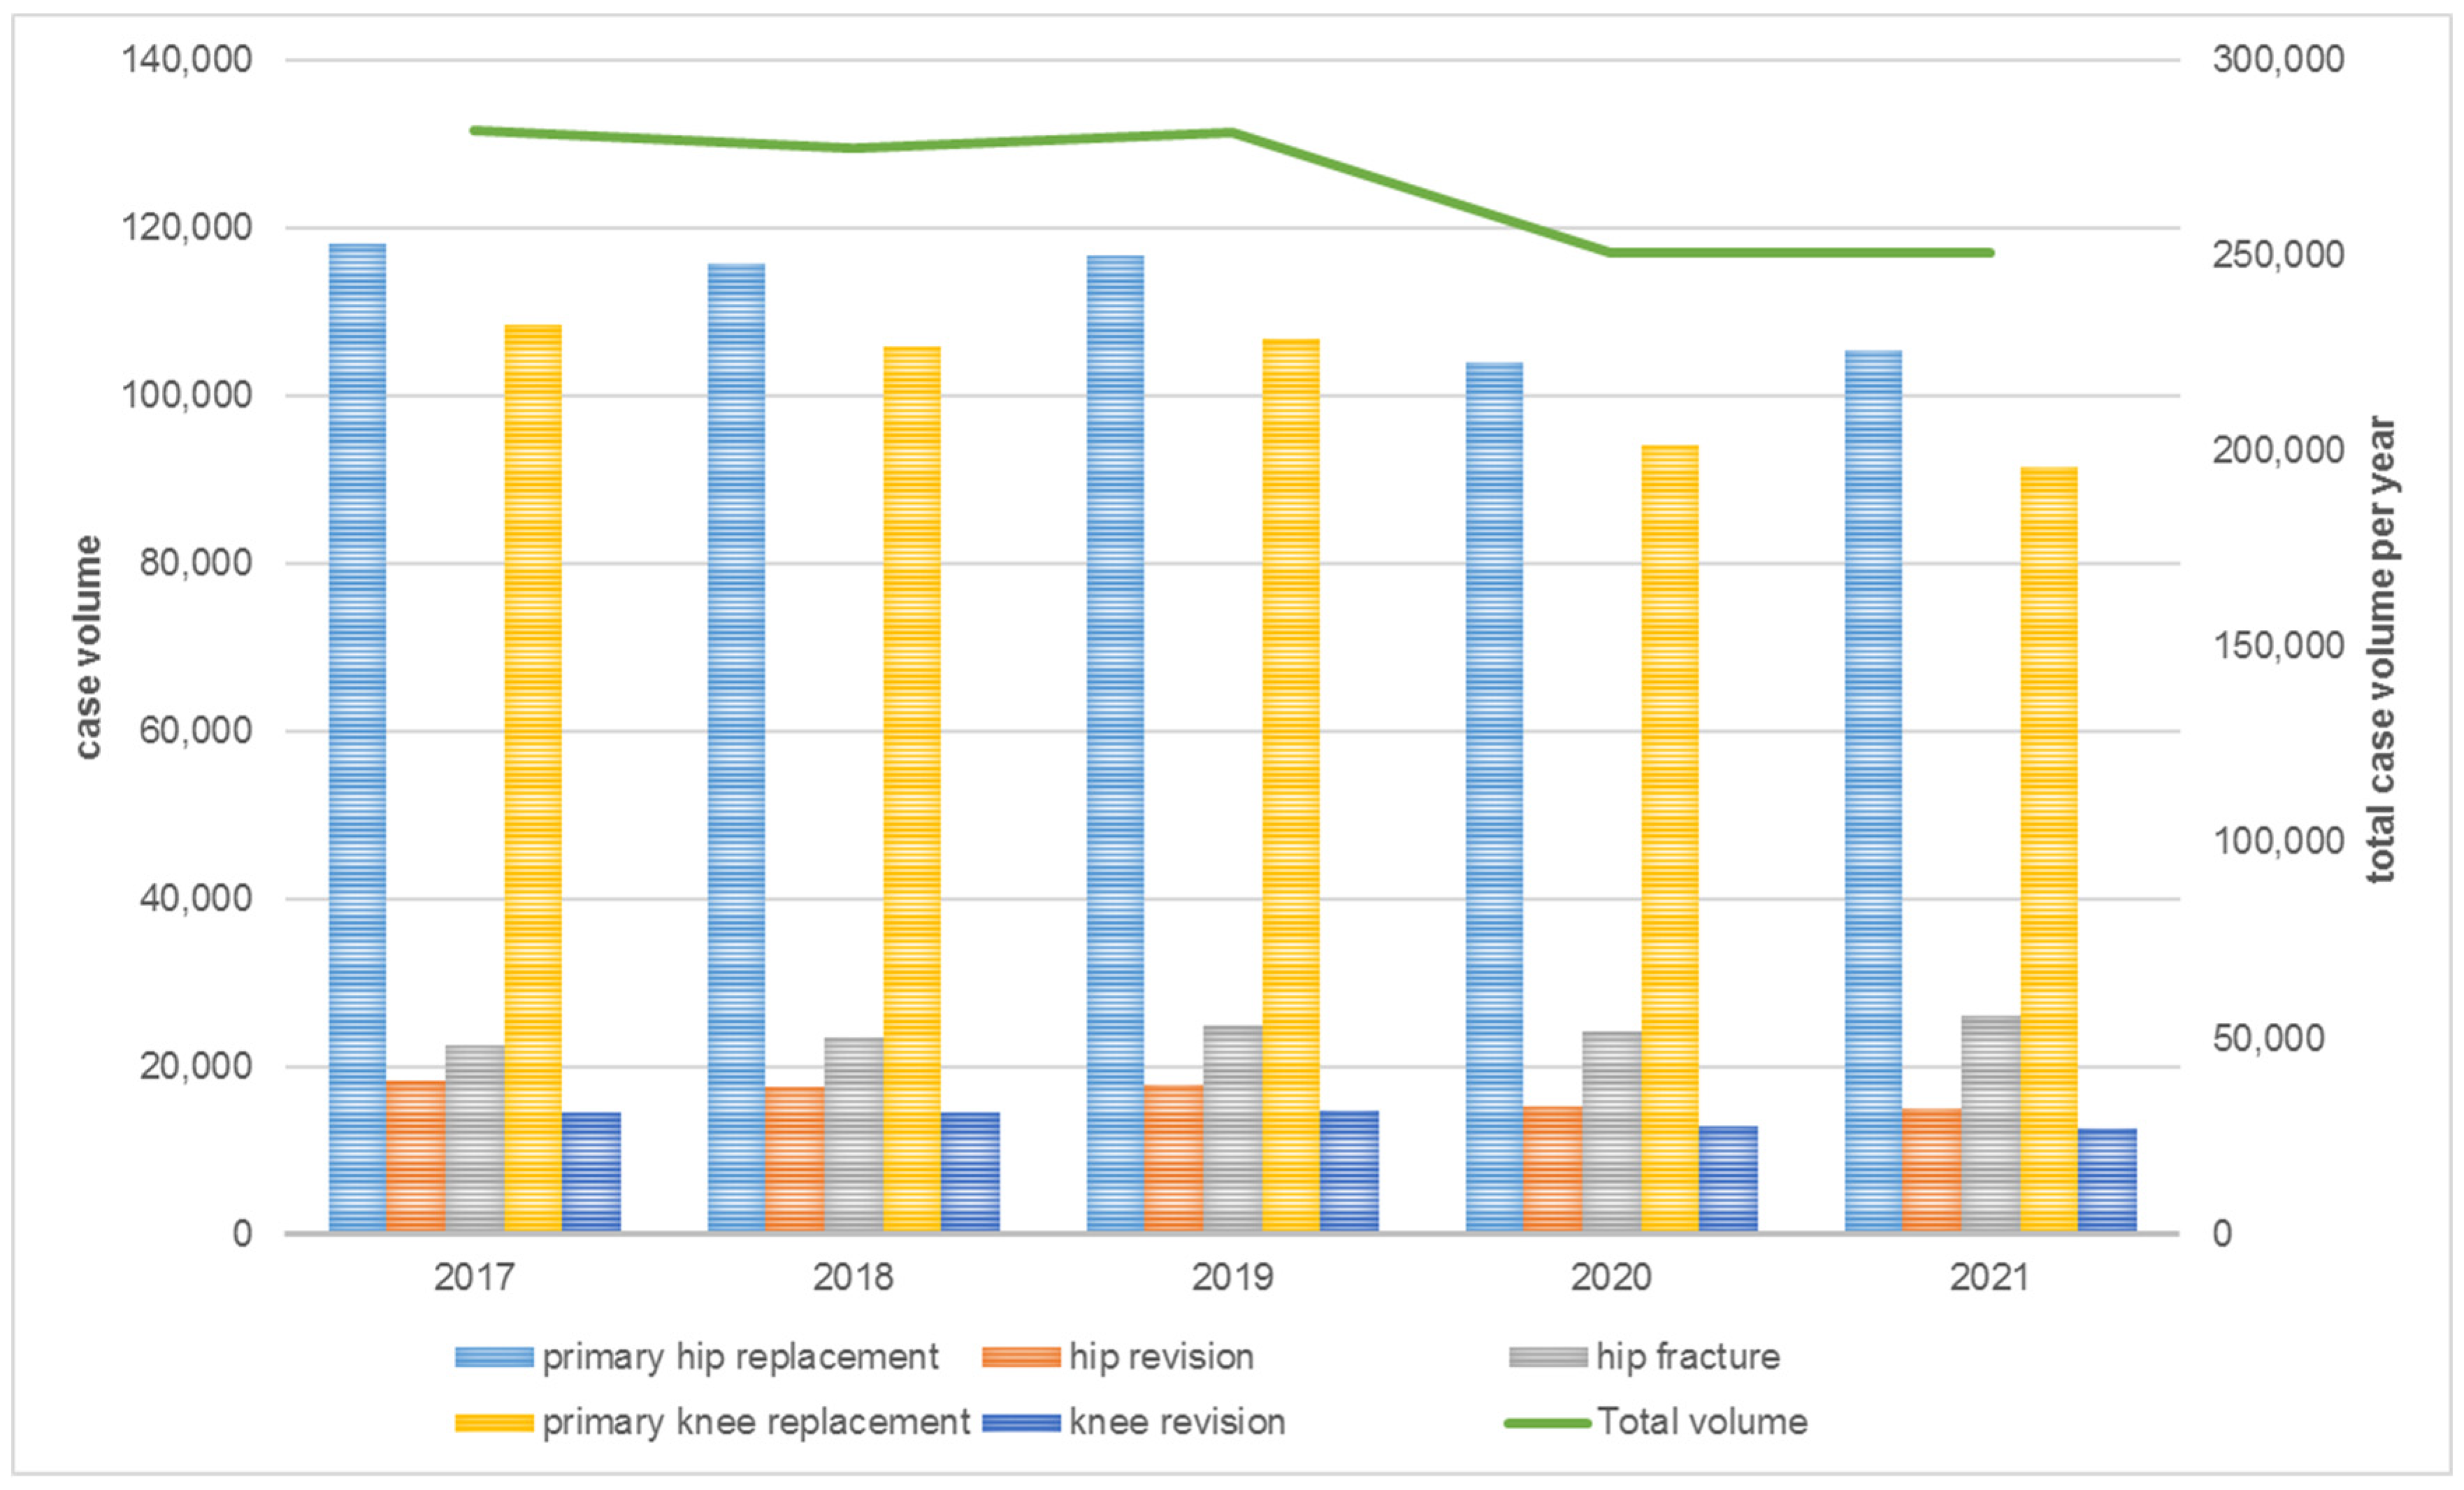
3.1.2. Total Volume of Cases Treated in Certified Centers per Year
3.2. Surgeon-Related Results
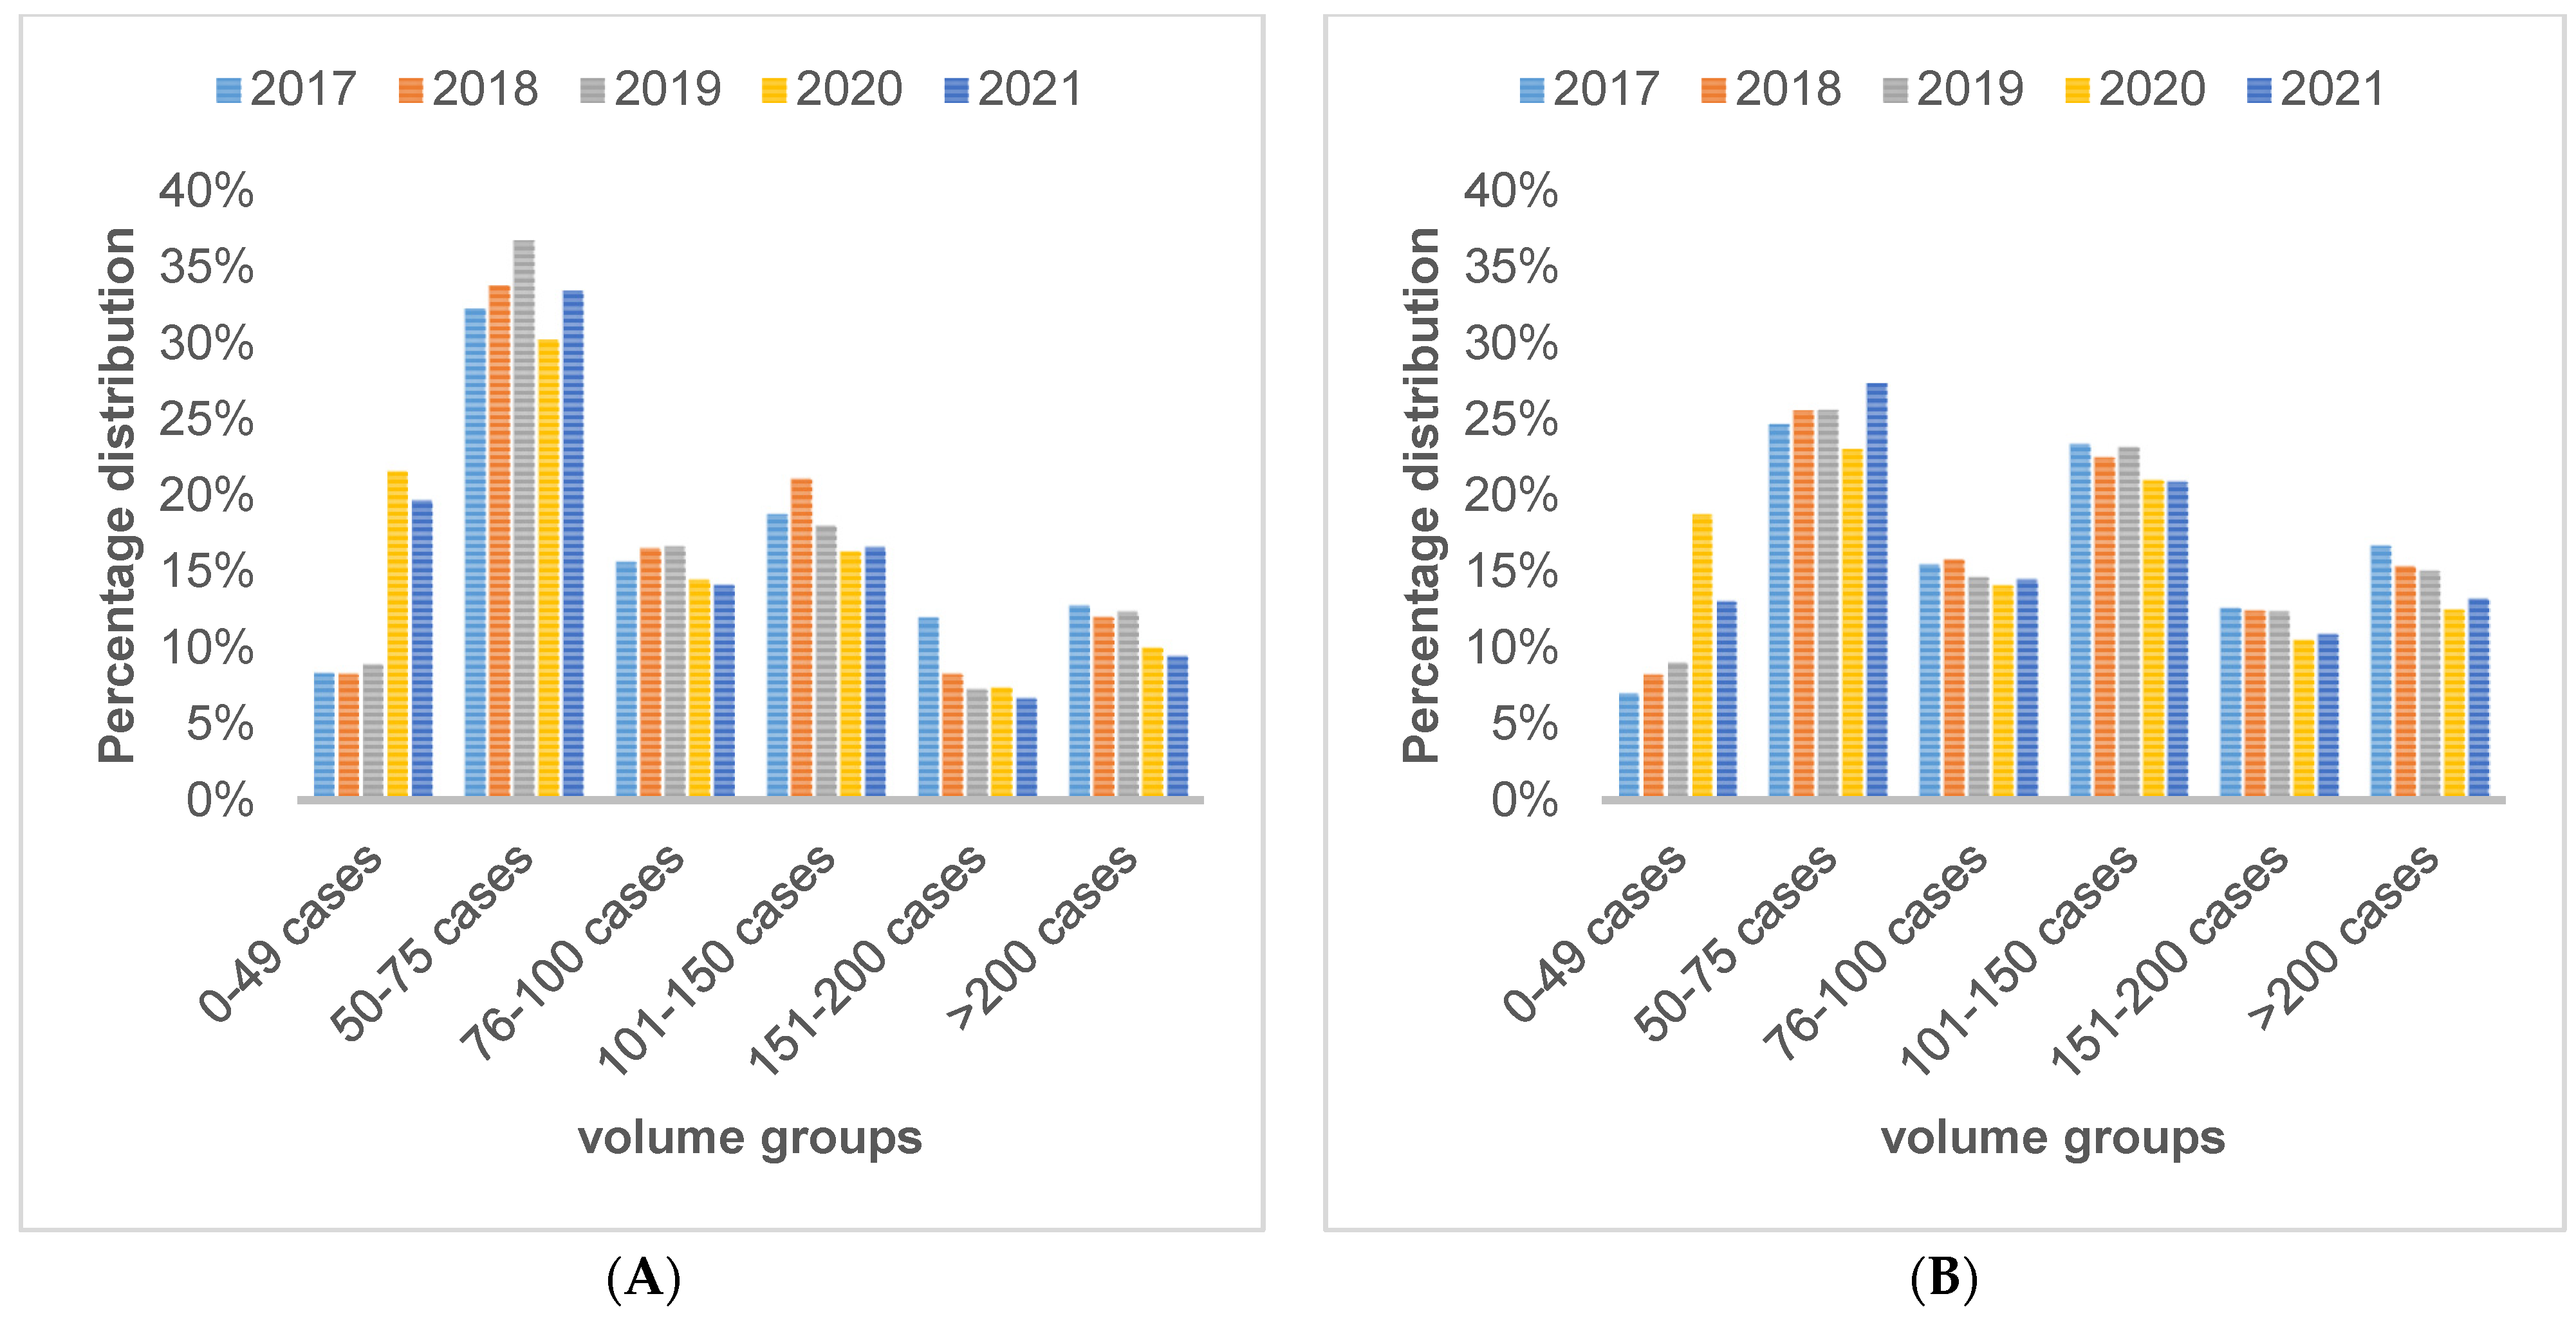
3.2.1. Volume Groups of Surgeons Differentiated by Registered Level of Experience (ECrs vs. sECrs) per Year
3.2.2. Volume Groups of Surgeons Differentiated by Affiliated Surgeons per Year
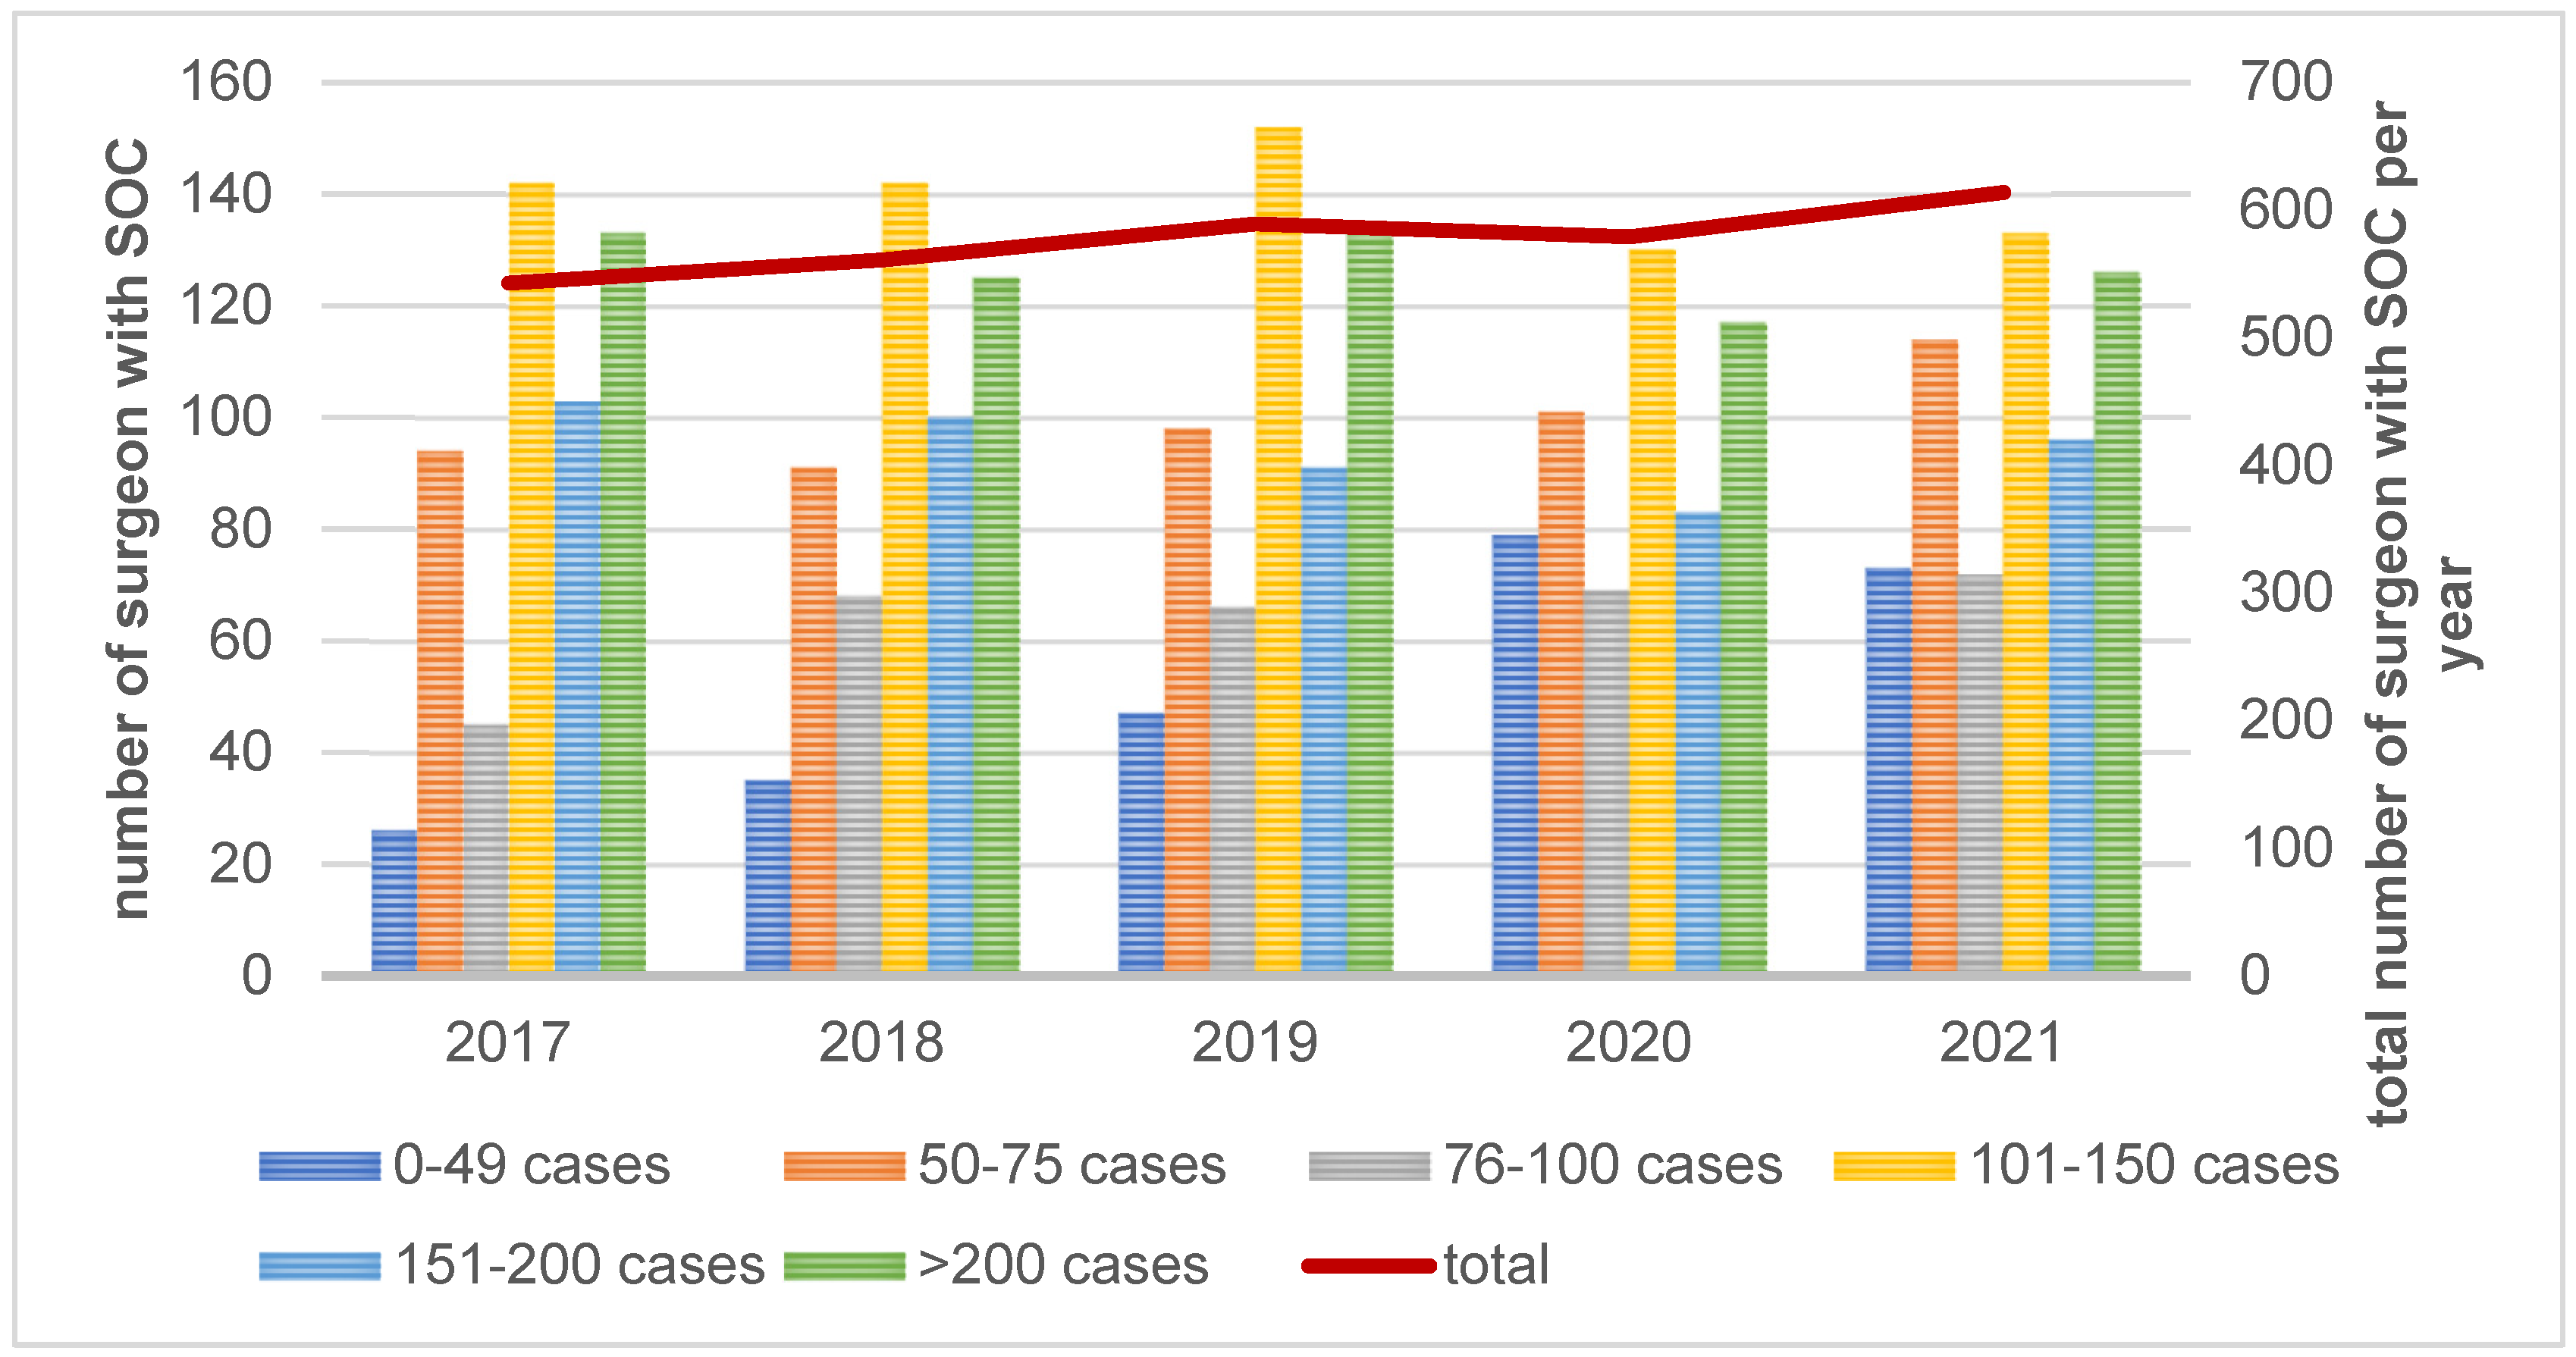
3.2.3. Volume Groups of Surgeons Differentiated by Additional Qualification “Special Orthopedic Surgery” (SOC) per Year
3.2.4. Effects of the Surgeon Ratio on Frequency of the Quality Indicators
3.2.5. Effects of the Affiliated Surgeon Rate on Frequency of the Quality Indicators
4. Discussion
- An increase in center-related minimum requirements;
- Joint-specific minimum requirements per surgeon;
- The acquisition of quality indicators at the surgeon level, which should also be taken into account for new approvals of surgeons.
5. Strengths and Weaknesses of the Study
6. Conclusions
Author Contributions
Funding
Institutional Review Board Statement
Informed Consent Statement
Data Availability Statement
Conflicts of Interest
References
- Haas, H.; Grifka, J.; Günther, K.P.; Heller, K.D.; Niethard, F.U.; Windhagen, H.; Ebner, M.; Mittelmeier, W. EndoCert. Zertifizierung von Endoprothetischen Versorgezentren in Deutschland; eine Initiative der Deutschen Gesellschaft für Orthopädie und Orthopädische Chirurgie (DGOOC) mit Unterstützung der Arbeitsgemeinschaft Endoprothetik (AE); Thieme: Stuttgart, Germany; New York, NY, USA, 2013. [Google Scholar]
- Haas, H.; Bail, H.J.; Günther, K.P.; Heller, K.D.; Pingsmann, A.; Kladny, B.; Lewinski, G.; Lohmann, C.-H.; Wirtz, D.C.; Mittelmeier, W. Anforderungskatalog für EndoProthetikZentren zur Zertifizierung von EndoProthetikZentren als Qualitätssichernde Maßnahme in der Behandlung von Gelenkerkrankungen. EndoProthetikZentrum (EndoCert) (EPZ). 2023. Available online: https://clarcert.com/_Resources/Persistent/7/4/6/9/74694ca9adba9d1716c1f18c1ff9651cab2a8c11/anforderungskatalog%20epz-O1%20%28230119%29.pdf (accessed on 5 January 2024).
- Holger, H.; Bail, H.J.; Günther, K.P.; Heller, K.D.; Pingsmann, A.; Kladny, B.; Lewinski, G.; Lohmann, C.-H.; Wirtz, D.C.; Mittelmeier, W. Anforderungskatalog für EndoProthetikZentren zur Zertifizierung von EndoProthetikZentren als qualitätssichernde Maßnahme in der Behandlung von Gelenkerkrankungen. EndoProthetikZentrum der Maximalversorgung (EndoCert) (EPZmax). 2023. Available online: https://clarcert.com/_Resources/Persistent/b/7/f/d/b7fd64939e4234f0998ea83f929f842372f3ccda/anforderungskatalog%20epzmax-O2%20%28230215%29.pdf (accessed on 5 January 2024).
- Günther, K.-P.; Haase, E.; Lange, T.; Kopkow, C.; Schmitt, J.; Jeszenszky, C.; Balck, F.; Lützner, J.; Hartmann, A.; Lippmann, M. Persönlichkeitsprofil und Komorbidität: Gibt es den “schwierigen Patienten” in der primären Hüftendoprothetik? Orthopade 2015, 44, 555–565. [Google Scholar] [CrossRef] [PubMed]
- Prokopetz, J.J.; Losina, E.; Bliss, R.L.; Wright, J.; A Baron, J.; Katz, J.N. Risk factors for revision of primary total hip arthroplasty: A systematic review. BMC Musculoskelet. Disord. 2012, 13, 251. [Google Scholar] [CrossRef]
- Bleß, H.-H.; Kip, M. Weißbuch Gelenkersatz; Springer: Berlin/Heidelberg, Germany, 2017. [Google Scholar]
- Losina, E.; Barrett, J.; Mahomed, N.N.; Baron, J.A.; Katz, J.N. Early failures of total hip replacement: Effect of surgeon volume. Arthritis Rheum. 2004, 50, 1338–1343. [Google Scholar] [CrossRef] [PubMed]
- Manley, M.; Ong, K.; Lau, E.; Kurtz, S.M. Effect of volume on total hip arthroplasty revision rates in the United States Medicare population. J. Bone Jt. Surgery. Am. Vol. 2008, 90, 2446–2451. [Google Scholar] [CrossRef]
- Zenk, K.; Finze, S.; Kluess, D.; Bader, R.; Malzahn, J.; Mittelmeier, W. Einfluss der Erfahrung des Operateurs in der Hüftendoprothetik. Abhängigkeit von Operationsdauer und Komplikationsrisiko. Orthopade 2014, 43, 522–528. [Google Scholar] [CrossRef] [PubMed]
- Paterson, J.M.; Williams, J.I.; Kreder, H.J.; Mahomed, N.N.; Gunraj, N.; Wang, X.; Laupacis, A. Provider volumes and early outcomes of primary total joint replacement in Ontario. Can. J. Surg. J. Can. Chir. 2010, 53, 175–183. [Google Scholar]
- Mufarrih, S.H.; Ghani, M.O.A.; Martins, R.S.; Qureshi, N.Q.; Mufarrih, S.A.; Malik, A.T.; Noordin, S. Effect of hospital volume on outcomes of total hip arthroplasty: A systematic review and meta-analysis. J. Orthop. Surg. Res. 2019, 14, 468. [Google Scholar] [CrossRef] [PubMed]
- Kugler, C.M.; Goossen, K.; Rombey, T.; De Santis, K.K.; Mathes, T.; Breuing, J.; Hess, S.; Burchard, R.; Pieper, D. Hospital volume-outcome relationship in total knee arthroplasty: A systematic review and dose-response meta-analysis. Knee Surg. Sports Traumatol. Arthrosc. Off. J. ESSKA 2022, 30, 2862–2877. [Google Scholar] [CrossRef]
- Lau, R.L.; Perruccio, A.V.; Gandhi, R.; Mahomed, N.N. The role of surgeon volume on patient outcome in total knee arthroplasty: A systematic review of the literature. BMC Musculoskelet. Disord. 2012, 13, 250. [Google Scholar] [CrossRef]
- Haas, H.; Mittelmeier, W. Die Einführung des EndoCert-Systems zur Zertifizierung von Endoprothesenzentren. Erfahrungen aus der Pilotphase. Orthopade 2014, 43, 534–540. [Google Scholar] [CrossRef] [PubMed]
- Deutsches Krankenhausverzeichnis: Suchbegriff: Endoprothetik ab 1 Fall pro Jahr. Available online: https://www.deutsches-krankenhaus-verzeichnis.de (accessed on 18 January 2024).
- Statistisches Bundesamt (Destatis) (2022) Gesundheit Fallpauschalenbezogene Krankenhausstatistik (DRG-Statistik) Operationen und Prozeduren der vollstationären Patientinnen und Patienten in Krankenhäusern (4-Steller). 2021. Available online: https://www.destatis.de/DE/Themen/Gesellschaft-Umwelt/Gesundheit/Krankenhaeuser/Publikationen/Downloads-Krankenhaeuser/operationen-prozeduren-5231401217014.pdf?__blob=publicationFile (accessed on 26 May 2023).
- Bundesärztekammer: Ärztestatistik zum 31. Dezember 2021. Available online: https://www.bundesaerztekammer.de/baek/ueber-uns/aerztestatistik/aerztestatistik-2021 (accessed on 26 May 2023).
- EndoCert GmbH (22.03.2021): Tätigkeit Als S/HO an Einem Weiteren EPZ/EPZmax. Available online: https://endocert.de/news/taetigkeit-als-s-ho-an-einem-weiteren-epz-epzmax, (accessed on 14 September 2022).
- Cohen, J. A power primer. Psychol. Bull. 1992, 112, 155–159. [Google Scholar] [CrossRef] [PubMed]
- Cohen, J. Statistical Power Analysis for the Behavioral Sciences; Routledge: New York, NY, USA, 2013. [Google Scholar]
- gGmbH EPRD; Grimberg, A.; Lützner, J.; Melsheimer, O.; Morlock, M.; Steinbrück, A. EPRD-Jahresbericht 2023. Mit Sicherheit mehr Qualität; EPRD Deutsche Endoprothesenregister: Berlin, Germany, 2023. [Google Scholar]
- Osmanski-Zenk, K.; Klinder, A.; Malzahn, J.; Haas, H.; von Lewinski, G.; Kladny, B.; Mittelmeier, W. 3-Jahres-Revisionsrate von zertifizierten EndoProthetikZentren nach EndoCert: Risikoadjustierte Analyse der Ergebnisqualität und Vergleich mit anderen Qualitätssicherungssystemen. Orthopadie 2023, 52, 320–331. [Google Scholar] [CrossRef] [PubMed]
- Pappas, M.A.; Spindler, K.P.; Hu, B.; Higuera-Rueda, C.A.; Rothberg, M.B. Volume and Outcomes of Joint Arthroplasty. J. Arthroplast. 2022, 37, 2128–2133. [Google Scholar] [CrossRef]
- Gemeinsamer Bundesausschuss. Regelungen des Gemeinsamen Bundesausschussesgemäß § 136b Absatz 1 Satz 1 Nummer 2 SGB V für Nach § 108 SGB V zugelassene Krankenhäuser. 2023. Available online: https://www.g-ba.de/downloads/62-492-3099/Mm-R_2023-02-16_iK-2023-01-01.pdf (accessed on 19 January 2024).
- Malik, A.T.; Jain, N.; Scharschmidt, T.J.; Li, M.; Glassman, A.H.; Khan, S.N. Does Surgeon Volume Affect Outcomes Following Primary Total Hip Arthroplasty? A Systematic Review. J. Arthroplast. 2018, 33, 3329–3342. [Google Scholar] [CrossRef]
- Walendzik, A.; Noweski, M.; Pomorin, N.; Wasem, J. Belegärztliche Versorgung: Historie, Entwicklungsdeterminanten und Weiterentwicklungsoptionen. Abschlussbericht. Available online: https://www.kbv.de/media/sp/Gutachten_Belegaerztliche_Versorgung.pdf (accessed on 17 January 2024).
- Gries, A.; Schrimpf, A.M.; Dercks, N.V. Hospital Emergency Departments—Utilization and Resource Deployment in the Hospital as a Function of the Type of Referral. Dtsch. Arztebl. Int. 2022, 119, 640–646. [Google Scholar] [CrossRef] [PubMed]


| Data Year | 2017 | 2018 | 2019 | 2020 | 2021 | ||||||||||||||||||||
|---|---|---|---|---|---|---|---|---|---|---|---|---|---|---|---|---|---|---|---|---|---|---|---|---|---|
| N | Σ | Mean | Min | Max | N | Σ | Mean | Min | Max | N | Σ | Mean | Min | Max | N | Σ | Mean | Min | Max | N | Σ | Mean | Min | Max | |
| sECrs | 539 | 488 | 0.91 | 0 | 9 | 526 | 488 | 0.93 | 0 | 11 | 515 | 505 | 0.98 | 0 | 10 | 495 | 527 | 1.06 | 0 | 11 | 480 | 529 | 1.10 | 0 | 10 |
| ECrs | 1689 | 3.13 | 0 * | 17 | 1725 | 3.28 | 0 * | 17 | 1757 | 3.41 | 0 * | 17 | 1694 | 3.42 | 0 * | 17 | 1647 | 3.43 | 0 * | 15 | |||||
| s/ECrs with SOC | 546 | 1.01 | 0 | 8 | 563 | 1.07 | 0 | 7 | 591 | 1.15 | 0 | 8 | 580 | 1.17 | 0 | 10 | 619 | 1.29 | 0 | 10 | |||||
| affiliated surgeons | 385 | 0.71 | 0 | 15 | 375 | 0.71 | 0 | 8 | 372 | 0.72 | 0 | 10 | 380 | 0.77 | 0 | 10 | 362 | 0.75 | 0 | 9 | |||||
| AC: sECrs | 380 | 7 | 0.02 | 0 | 3 | 372 | 2 | 0.01 | 0 | 1 | 355 | 3 | 0.01 | 0 | 3 | 337 | 11 | 0.03 | 0 | 5 | 319 | 1 | 0.00 | 0 | 1 |
| AC: ECrs | 1270 | 3.34 | 0 * | 15 | 1306 | 3.51 | 1 | 9 | 1310 | 3.69 | 2 | 10 | 1255 | 3.72 | 1 | 9 | 1209 | 3.79 | 2 | 9 | |||||
| AC: s/ECrs with SOC | 210 | 0.55 | 0 | 5 | 228 | 0.61 | 0 | 5 | 244 | 0.69 | 0 | 7 | 228 | 0.68 | 0 | 5 | 235 | 0.74 | 0 | 5 | |||||
| AC: affiliated surgeons | 296 | 0.78 | 0 | 15 | 279 | 0.75 | 0 | 7 | 267 | 0.75 | 0 | 7 | 275 | 0.82 | 0 | 7 | 258 | 0.81 | 0 | 7 | |||||
| ACmax: sECrs | 159 | 481 | 3.03 | 0 ** | 9 | 154 | 486 | 3.16 | 1 *** | 11 | 160 | 502 | 3.14 | 0 ** | 10 | 158 | 516 | 3.27 | 1 *** | 11 | 161 | 528 | 3.28 | 0 ** | 10 |
| ACmax: ECrs | 419 | 2.64 | 0 | 17 | 419 | 2.72 | 0 | 17 | 447 | 2.79 | 0 | 17 | 439 | 2.78 | 0 | 17 | 438 | 2.72 | 0 | 15 | |||||
| ACmax: sECrs with SOC | 336 | 2.11 | 0 | 8 | 335 | 2.18 | 0 | 7 | 347 | 2.17 | 1 | 8 | 352 | 2.23 | 0 | 10 | 384 | 2.39 | 0 | 10 | |||||
| ACmax: affiliated surgeons | 89 | 0.56 | 0 | 8 | 96 | 0.62 | 0 | 8 | 105 | 0.66 | 0 | 10 | 105 | 0.66 | 0 | 10 | 104 | 0.65 | 0 | 9 | |||||
| Year | Volume Groups of Surgeons | Total | ||||||
|---|---|---|---|---|---|---|---|---|
| 0–49 Cases | 50–75 Cases | 76–100 Cases | 101–150 Cases | 151–200 Cases | >200 Cases | |||
| 2017 | n ECrs | 141a | 550a | 326a | 361b | 148c | 149c | 1675 |
| % | 8.4% | 32.8% | 19.5% | 21.6% | 8.8% | 8.9% | 100.0% | |
| n sECrs | 9a | 16a | 11a | 129b | 123c | 198c | 486 | |
| % | 1.9% | 3.3% | 2.3% | 26.5% | 25.3% | 40.7% | 100.0% | |
| n total | 150 | 566 | 337 | 490 | 271 | 347 | 2161 | |
| % | 6.9% | 26.2% | 15.6% | 22.7% | 12.5% | 16.1% | 100.0% | |
| 2018 | n ECrs | 172a | 583a | 336a | 346b | 150c | 131d | 1718 |
| % | 10.0% | 33.9% | 19.6% | 20.1% | 8.7% | 7.6% | 100.0% | |
| n sECrs | 10a | 13a | 15a | 145b | 109c | 195d | 487 | |
| % | 2.1% | 2.7% | 3.1% | 29.8% | 22.4% | 40.0% | 100.0% | |
| n total | 182 | 596 | 351 | 491 | 259 | 326 | 2205 | |
| % | 8.3% | 27.0% | 15.9% | 22.3% | 11.7% | 14.8% | 100.0% | |
| 2019 | n ECrs | 190a | 611b | 323ab | 349c | 149d | 130e | 1752 |
| % | 10.8% | 34.9% | 18.4% | 19.9% | 8.5% | 7.4% | 100.0% | |
| n sECrs | 13a | 10b | 15ab | 155c | 112d | 200e | 505 | |
| % | 2.6% | 2.0% | 3.0% | 30.7% | 22.2% | 39.6% | 100.0% | |
| n total | 203 | 621 | 338 | 504 | 261 | 330 | 2257 | |
| % | 9.0% | 27.5% | 15.0% | 22.3% | 11.6% | 14.6% | 100.0% | |
| 2020 | n ECrs | 405a | 522a | 272b | 276c | 126c | 89d | 1690 |
| % | 24.0% | 30.9% | 16.1% | 16.3% | 7.5% | 5.3% | 100.0% | |
| n sECrs | 22a | 17a | 42b | 172c | 95c | 179d | 527 | |
| % | 4.2% | 3.2% | 8.0% | 32.6% | 18.0% | 34.0% | 100.0% | |
| n total | 427 | 539 | 314 | 448 | 221 | 268 | 2217 | |
| % | 19.3% | 24.3% | 14.2% | 20.2% | 10.0% | 12.1% | 100.0% | |
| 2021 | n ECrs | 286a | 603b | 283a | 280c | 106d | 84e | 1642 |
| % | 17.4% | 36.7% | 17.2% | 17.1% | 6.5% | 5.1% | 100.0% | |
| n sECrs | 21a | 14b | 30a | 158c | 115d | 189e | 527 | |
| % | 4.0% | 2.7% | 5.7% | 30.0% | 21.8% | 35.9% | 100.0% | |
| n total | 307 | 617 | 313 | 438 | 221 | 273 | 2169 | |
| % | 14.2% | 28.4% | 14.4% | 20.2% | 10.2% | 12.6% | 100.0% | |
| Quality Indicator | 2017 | 2018 | 2019 | 2020 | 2021 | |
|---|---|---|---|---|---|---|
| Operating time (THA) | r-value | −0.099 * | −0.090 * | −0.094 * | −0.097 * | −0.050 |
| p-value | 0.022 | 0.040 | 0.033 | 0.031 | 0.271 | |
| N | 538 | 526 | 515 | 495 | 480 | |
| Trochanter avulsion (THA) | r-value | −0.129 ** | −0.068 | −0.117 ** | −0.116 ** | −0.161 ** |
| p-value | 0.003 | 0.118 | 0.008 | 0.010 | 0.000 | |
| N | 538 | 526 | 515 | 495 | 480 | |
| Fractures and fissures (THA) | r-value | −0.095 * | −0.103 * | −0.166 ** | −0.066 | 0.016 |
| p-value | 0.028 | 0.018 | 0.000 | 0.141 | 0.727 | |
| N | 538 | 526 | 515 | 495 | 480 | |
| Neurological complications (THA) | r-value | 0.088 * | 0.099 * | 0.015 | −0.002 | 0.018 |
| p-value | 0.041 | 0.023 | 0.738 | 0.962 | 0.701 | |
| N | 538 | 526 | 515 | 495 | 480 | |
| Trochanter avulsion (HR) | r-value | 0.127 ** | 0.115 ** | 0.111 * | 0.050 | 0.076 |
| p-value | 0.003 | 0.008 | 0.012 | 0.267 | 0.099 | |
| N | 534 | 524 | 514 | 495 | 478 | |
| Fractures and fissures (HR) | r-value | 0.072 | 0.137 ** | 0.170 ** | 0.128 ** | 0.211 ** |
| p-value | 0.098 | 0.002 | 0.000 | 0.004 | 0.000 | |
| N | 534 | 524 | 514 | 495 | 478 | |
| Mortality (HR) | r-value | −0.005 | −0.054 | −0.113 * | −0.069 | −0.024 |
| p-value | 0.917 | 0.213 | 0.010 | 0.125 | 0.605 | |
| N | 534 | 524 | 514 | 495 | 478 | |
| Neurological complications (HR) | r-value | 0.160 ** | 0.151 ** | 0.138 ** | 0.092 * | 0.176 ** |
| p-value | 0.000 | 0.001 | 0.002 | 0.042 | 0.000 | |
| N | 534 | 524 | 514 | 495 | 478 | |
| Operating time (HF) | r-value | −0.011 | −0.013 | −0.094 * | −0.014 | 0.021 |
| p-value | 0.807 | 0.775 | 0.045 | 0.765 | 0.669 | |
| N | 458 | 455 | 452 | 431 | 410 | |
| Fractures and fissures (HF) | r-value | −0.132 ** | −0.064 | −0.157 ** | −0.119 * | −0.166 ** |
| p-value | 0.005 | 0.174 | 0.001 | 0.014 | 0.001 | |
| N | 458 | 455 | 452 | 431 | 410 | |
| Mortality (HF) | r-value | −0.268 ** | −0.254 ** | −0.139 ** | −0.232 ** | −0.212 ** |
| p-value | 0.000 | 0.000 | 0.003 | 0.000 | 0.000 | |
| N | 458 | 455 | 452 | 431 | 410 | |
| Neurological complications (HF) | r-value | −0.022 | −0.013 | −0.084 | −0.096 * | −0.105 * |
| p-value | 0.634 | 0.774 | 0.074 | 0.045 | 0.033 | |
| N | 458 | 455 | 452 | 431 | 410 | |
| Rate of re-interventions due to problems requiring surgical treatment (hip) | r-value | −0.172 ** | −0.227 ** | −0.165 ** | −0.180 ** | −0.188 ** |
| p-value | 0.000 | 0.000 | 0.000 | 0.000 | 0.000 | |
| N | 538 | 526 | 515 | 495 | 480 | |
| Operating time (TKA) | r-value | −0.143 ** | −0.136 ** | −0.123 ** | −0.087 | −0.068 |
| p-value | 0.001 | 0.002 | 0.005 | 0.053 | 0.134 | |
| N | 534 | 524 | 513 | 495 | 480 | |
| Fractures and fissures (TKA) | r-value | 0.064 | 0.096 * | 0.120 ** | 0.018 | 0.128 ** |
| p-value | 0.137 | 0.028 | 0.006 | 0.693 | 0.005 | |
| N | 534 | 524 | 513 | 495 | 480 | |
| Neurological complications (TKA) | r-value | 0.171 ** | 0.176 ** | 0.076 | 0.084 | 0.052 |
| p-value | 0.000 | 0.000 | 0.087 | 0.062 | 0.257 | |
| N | 534 | 524 | 513 | 495 | 480 | |
| Mechanical axis (KR) | r-value | −0.011 | 0.152 ** | 0.066 | 0.112 * | 0.173 ** |
| p-value | 0.816 | 0.001 | 0.133 | 0.013 | 0.000 | |
| N | 494 | 516 | 512 | 491 | 477 | |
| Fractures and fissures (KR) | r-value | 0.155 ** | 0.099 * | 0.111 * | 0.133 ** | 0.090 * |
| p-value | 0.000 | 0.025 | 0.012 | 0.003 | 0.050 | |
| N | 531 | 519 | 512 | 491 | 477 | |
| Mortality (KR) | r-value | −0.028 | 0.128 ** | 0.015 | 0.083 | 0.037 |
| p-value | 0.522 | 0.003 | 0.740 | 0.067 | 0.414 | |
| N | 531 | 519 | 512 | 491 | 477 | |
| Neurological complications (KR) | r-value | 0.128 ** | 0.152 ** | 0.084 | 0.048 | 0.121 ** |
| p-value | 0.003 | 0.001 | 0.057 | 0.284 | 0.008 | |
| N | 530 | 519 | 512 | 491 | 477 | |
| Thrombosis/embolism (knee) | r-value | 0.084 | 0.106 * | 0.039 | 0.114 * | 0.085 |
| p-value | 0.052 | 0.015 | 0.382 | 0.011 | 0.064 | |
| N | 536 | 524 | 514 | 495 | 480 | |
| 2017 | 2018 | 2019 | 2020 | 2021 | ||
|---|---|---|---|---|---|---|
| Operating time (THA) | r-value | −0.143 ** | −0.164 ** | −0.131 ** | −0.128 ** | −0.117 * |
| p-value | 0.001 | 0 | 0.003 | 0.004 | 0.011 | |
| N | 538 | 526 | 515 | 495 | 480 | |
| Trochanter avulsion (THA) | r-value | −0.102 * | 0 | 0.04 | −0.061 | −0.03 |
| p-value | 0.018 | 0.995 | 0.362 | 0.174 | 0.517 | |
| N | 538 | 526 | 515 | 495 | 480 | |
| Mortality (THA) | r-value | −0.132 ** | −0.089 * | −0.07 | −0.067 | −0.090 * |
| p-value | 0.002 | 0.041 | 0.114 | 0.136 | 0.05 | |
| N | 538 | 526 | 515 | 495 | 480 | |
| Hip dislocation (HR) | r-value | −0.056 | −0.1520 ** | −0.084 | −0.08 | −0.026 |
| p-value | 0.196 | 0 | 0.057 | 0.075 | 0.573 | |
| N | 534 | 524 | 514 | 495 | 478 | |
| Mortality (HR) | r-value | −0.168 ** | −0.122 ** | −0.086 | −0.065 | −0.129 ** |
| p-value | 0 | 0.005 | 0.052 | 0.15 | 0.005 | |
| N | 534 | 524 | 514 | 495 | 478 | |
| Operating time (HF) | r-value | −0.119 * | −0.086 | −0.052 | −0.011 | 0.019 |
| p-value | 0.011 | 0.068 | 0.27 | 0.825 | 0.703 | |
| N | 458 | 455 | 452 | 431 | 410 | |
| Hip dislocation (HF) | r-value | −0.013 | 0.039 | −0.018 | −0.09 | 0.101 * |
| p-value | 0.779 | 0.412 | 0.696 | 0.061 | 0.042 | |
| N | 458 | 455 | 452 | 431 | 410 | |
| Rate of re-interventions due to problems requiring surgical treatment (hip) | r-value | −0.04 | −0.031 | −0.091 * | −0.122 ** | −0.07 |
| p-value | 0.356 | 0.471 | 0.038 | 0.007 | 0.124 | |
| N | 538 | 526 | 515 | 495 | 480 | |
| Thrombosis/embolism (hip) | r-value | −0.144 ** | −0.067 | −0.078 | −0.134 ** | −0.125 ** |
| p-value | 0.001 | 0.127 | 0.077 | 0.003 | 0.006 | |
| N | 538 | 526 | 515 | 495 | 480 | |
| Operating time (TKA) | r-value | −0.160 ** | −0.197 ** | −0.164 ** | −0.208 ** | −0.144 ** |
| p-value | 0 | 0 | 0 | 0 | 0.002 | |
| N | 534 | 524 | 513 | 495 | 480 | |
| Mechanical axis (KR) | r-value | 0.004 | −0.052 | −0.004 | 0.115 * | −0.018 |
| p-value | 0.935 | 0.24 | 0.933 | 0.011 | 0.699 | |
| N | 494 | 516 | 512 | 491 | 477 | |
| Fractures and fissures (KR) | r-value | −0.065 | 0.009 | −0.005 | −0.093 * | −0.045 |
| p-value | 0.136 | 0.846 | 0.913 | 0.039 | 0.332 | |
| N | 531 | 519 | 512 | 491 | 477 | |
| Mortality (KR) | r-value | −0.120 ** | −0.168 ** | −0.08 | −0.046 | −0.090 * |
| p-value | 0.006 | 0 | 0.069 | 0.305 | 0.048 | |
| N | 531 | 519 | 512 | 491 | 477 | |
| Rate of re-interventions due to problems requiring surgical treatment (knee) | r-value | −0.058 | 0 | −0.051 | −0.132 ** | −0.103 * |
| p-value | 0.177 | 0.995 | 0.246 | 0.003 | 0.024 | |
| N | 536 | 524 | 514 | 495 | 480 |
Disclaimer/Publisher’s Note: The statements, opinions and data contained in all publications are solely those of the individual author(s) and contributor(s) and not of MDPI and/or the editor(s). MDPI and/or the editor(s) disclaim responsibility for any injury to people or property resulting from any ideas, methods, instructions or products referred to in the content. |
© 2024 by the authors. Licensee MDPI, Basel, Switzerland. This article is an open access article distributed under the terms and conditions of the Creative Commons Attribution (CC BY) license (https://creativecommons.org/licenses/by/4.0/).
Share and Cite
Osmanski-Zenk, K.; Klinder, A.; Pingsmann, A.; Lohmann, C.H.; Bail, H.J.; Kladny, B.; Mittelmeier, W. Institutional Surgical Setting and Volume Effects of Certified Arthroplasty Centers in Germany: Evaluation of the Quality of Care in a 5-Year Comparison. Healthcare 2024, 12, 904. https://doi.org/10.3390/healthcare12090904
Osmanski-Zenk K, Klinder A, Pingsmann A, Lohmann CH, Bail HJ, Kladny B, Mittelmeier W. Institutional Surgical Setting and Volume Effects of Certified Arthroplasty Centers in Germany: Evaluation of the Quality of Care in a 5-Year Comparison. Healthcare. 2024; 12(9):904. https://doi.org/10.3390/healthcare12090904
Chicago/Turabian StyleOsmanski-Zenk, Katrin, Annett Klinder, Andreas Pingsmann, Christoph H. Lohmann, Hermann Josef Bail, Bernd Kladny, and Wolfram Mittelmeier. 2024. "Institutional Surgical Setting and Volume Effects of Certified Arthroplasty Centers in Germany: Evaluation of the Quality of Care in a 5-Year Comparison" Healthcare 12, no. 9: 904. https://doi.org/10.3390/healthcare12090904
APA StyleOsmanski-Zenk, K., Klinder, A., Pingsmann, A., Lohmann, C. H., Bail, H. J., Kladny, B., & Mittelmeier, W. (2024). Institutional Surgical Setting and Volume Effects of Certified Arthroplasty Centers in Germany: Evaluation of the Quality of Care in a 5-Year Comparison. Healthcare, 12(9), 904. https://doi.org/10.3390/healthcare12090904