Assessment of Intuitive Eating and Mindful Eating among Higher Education Students: A Systematic Review


Abstract
1. Introduction
2. Materials and Methods
2.1. Search Strategy
2.2. Inclusion and Exclusion Criteria
2.3. Study Selection
2.4. Data Extraction
2.5. Quality Assessment
2.6. Data Synthesis
3. Results
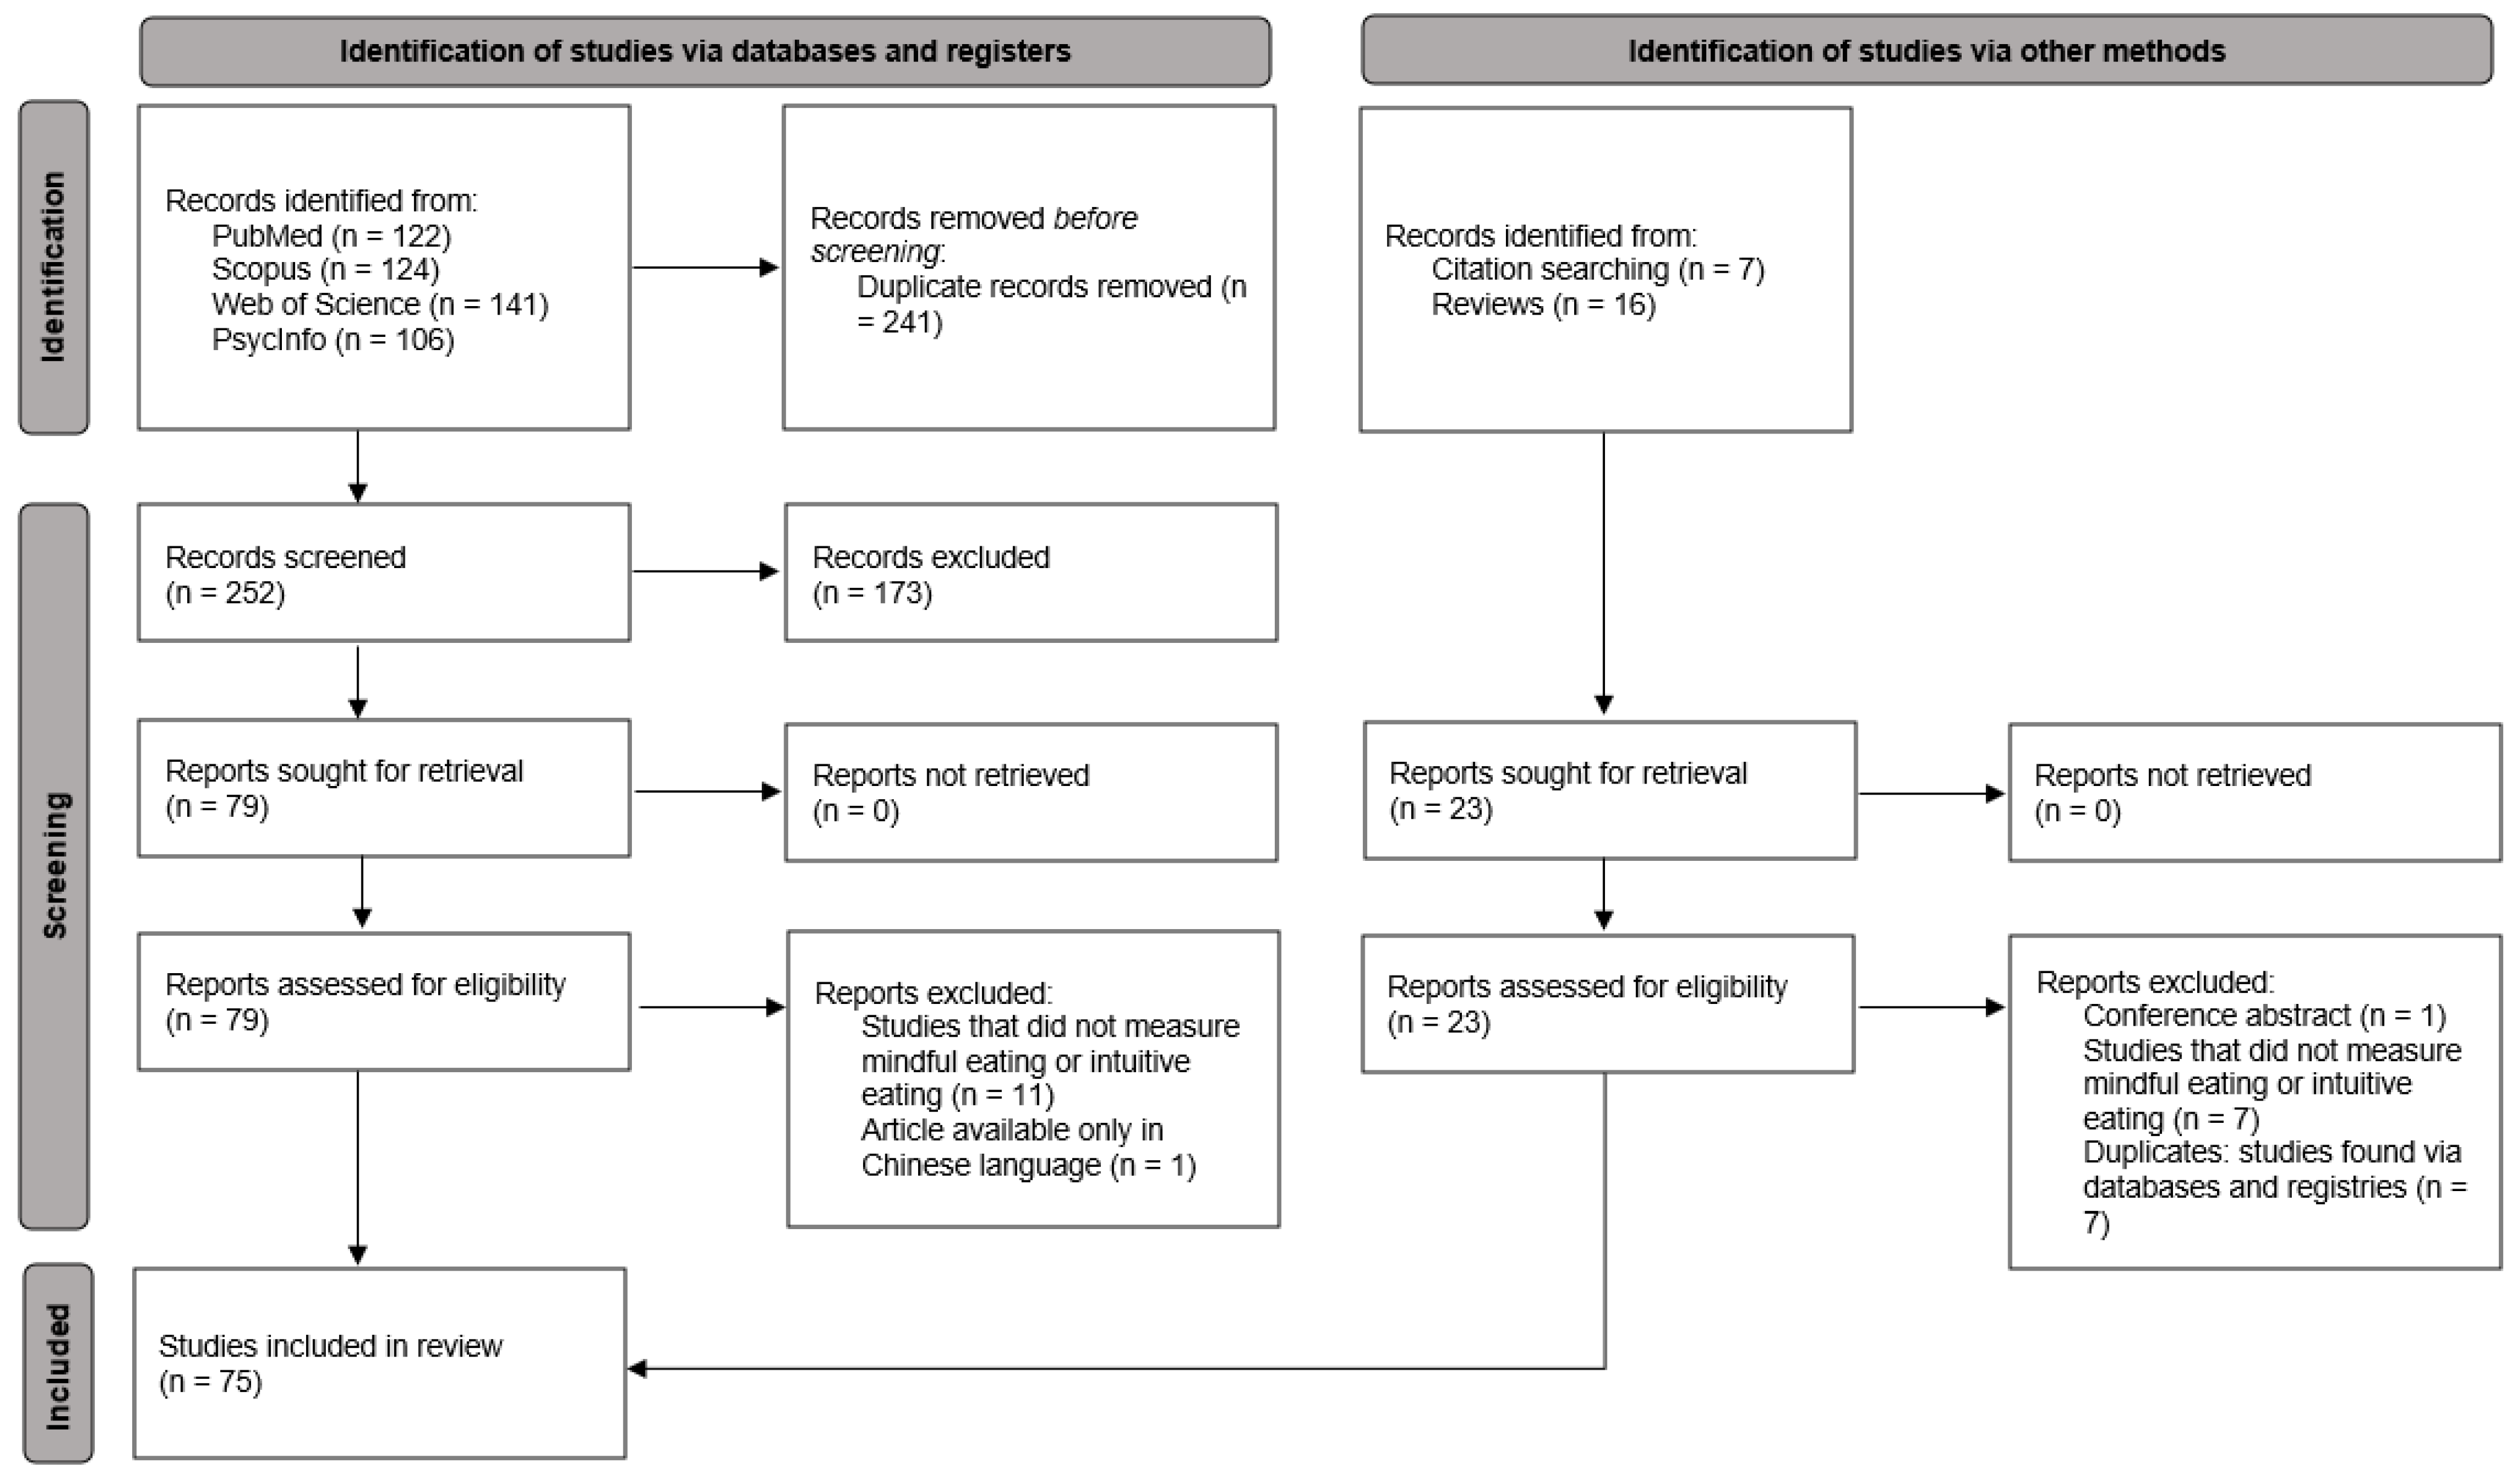
3.1. Study Selection
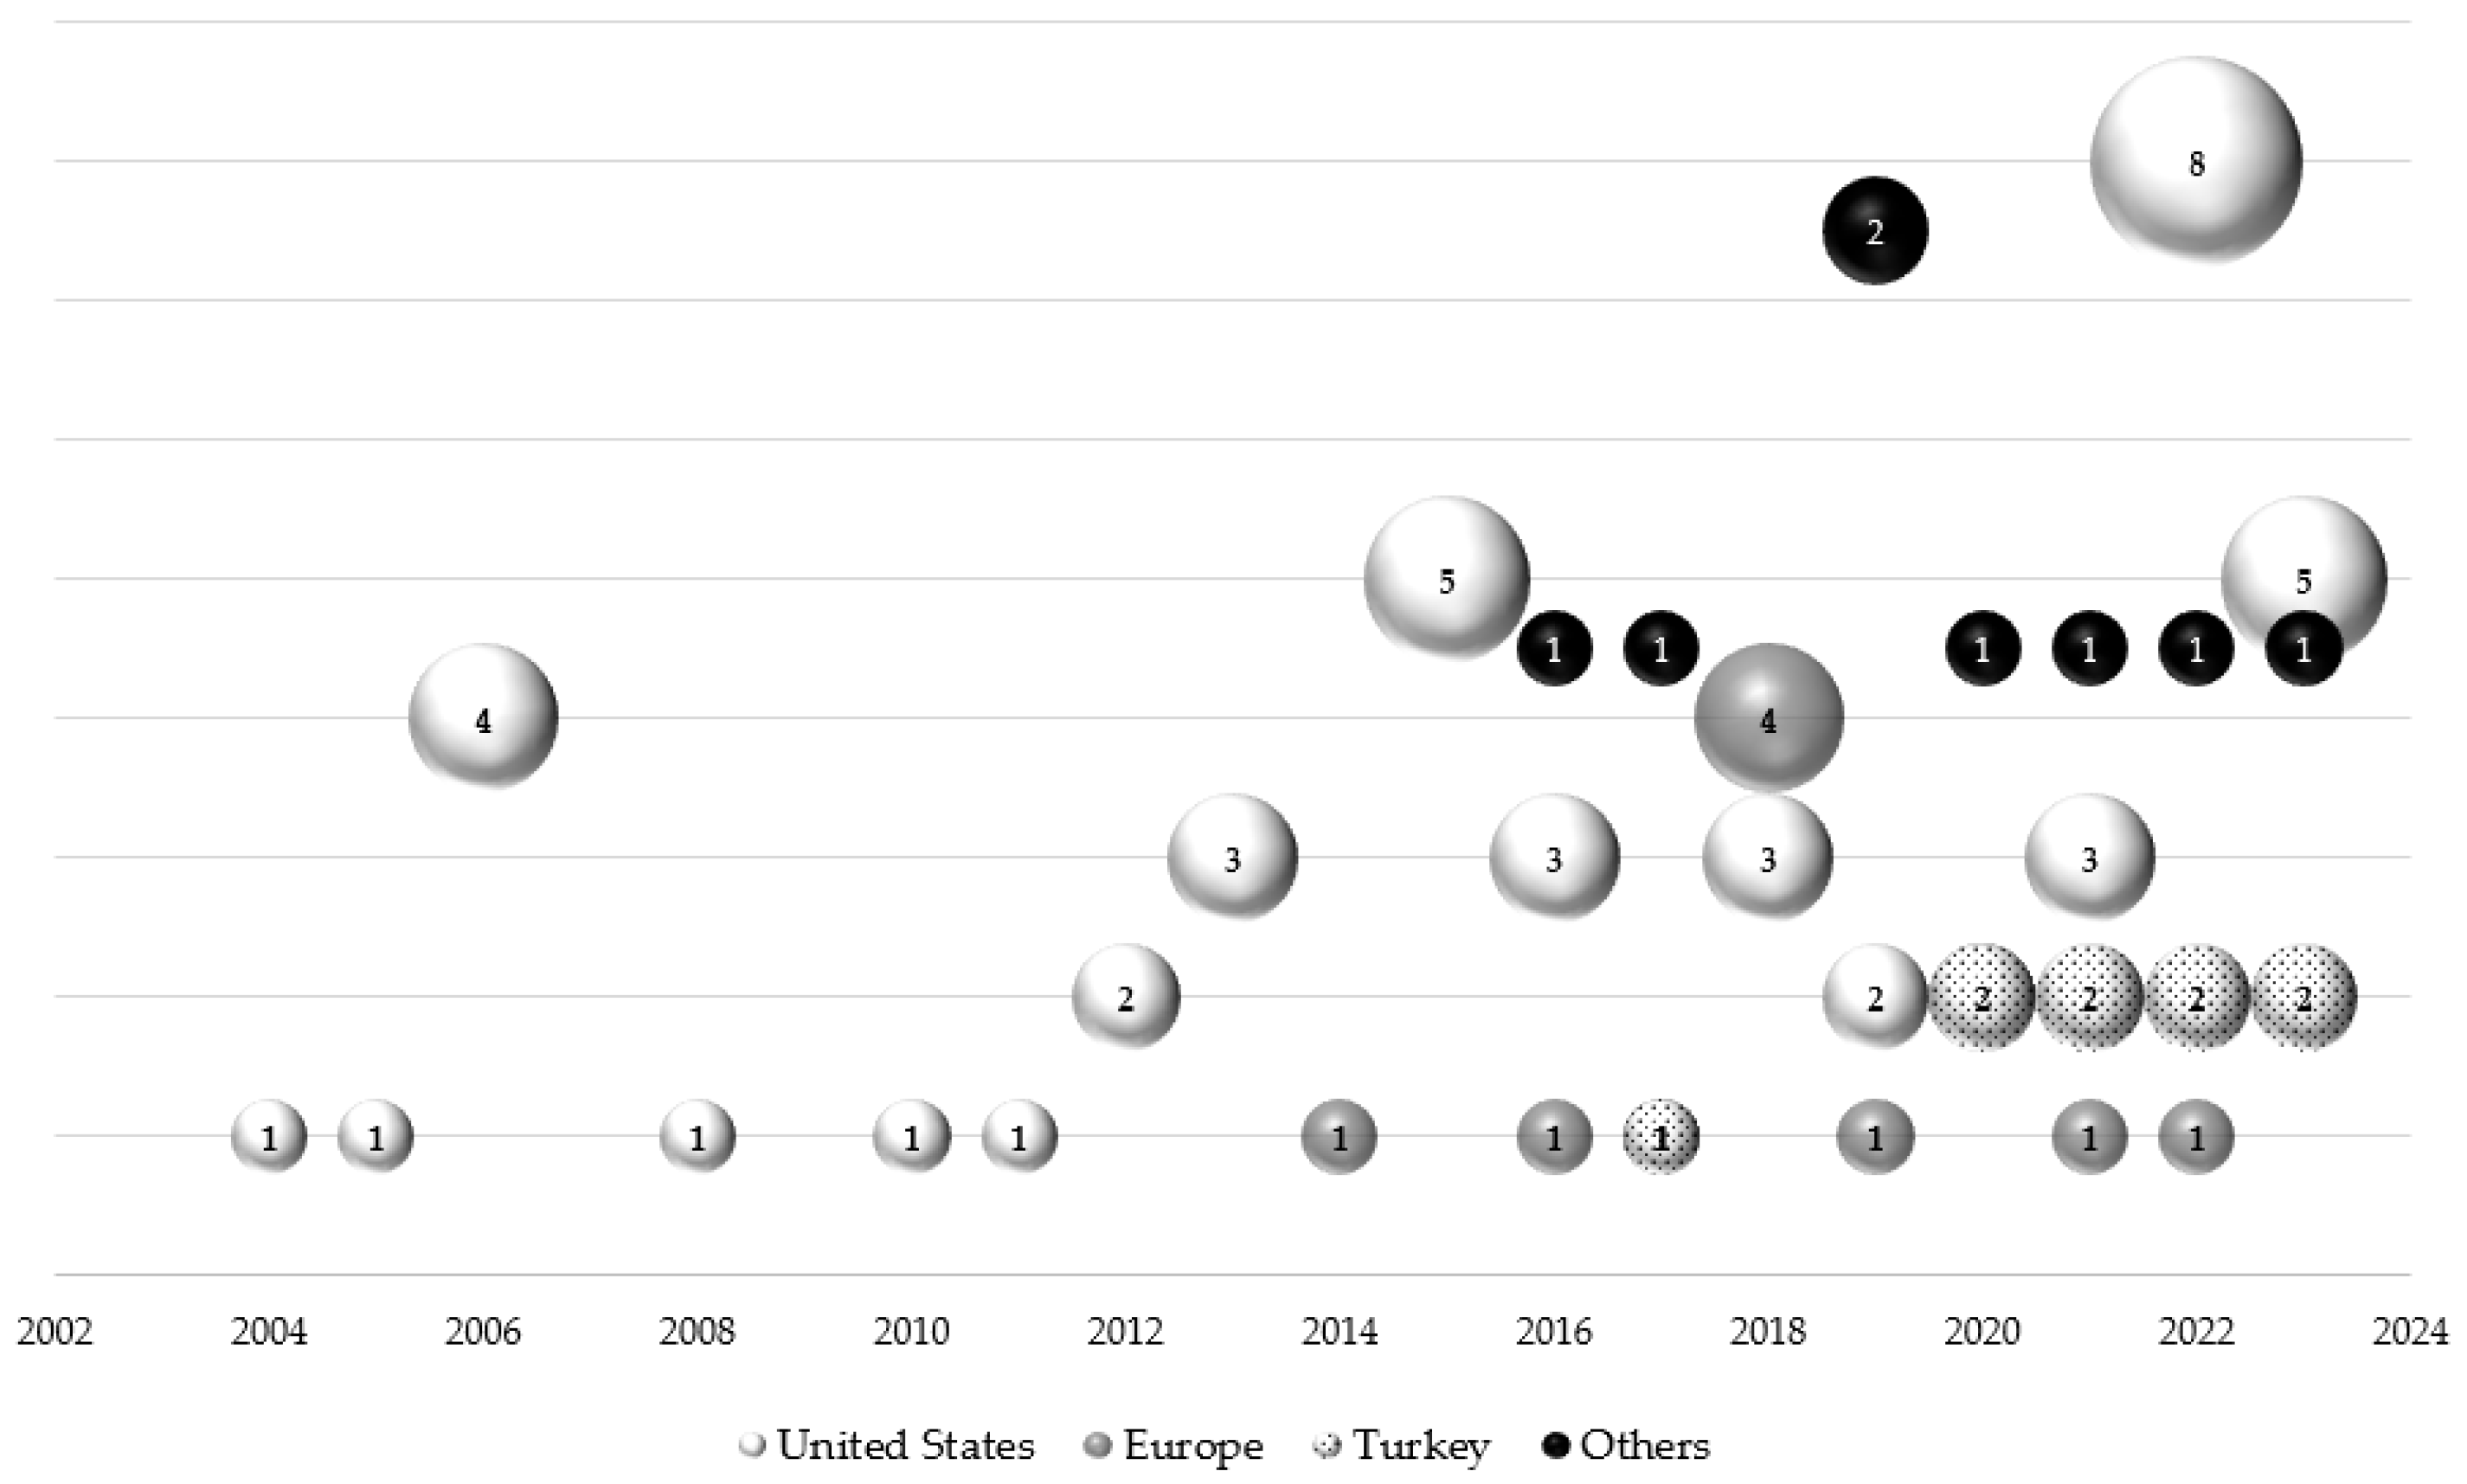
3.2. Study Design and Quality
3.3. Participant Characteristics
3.4. ME and IE Measurement
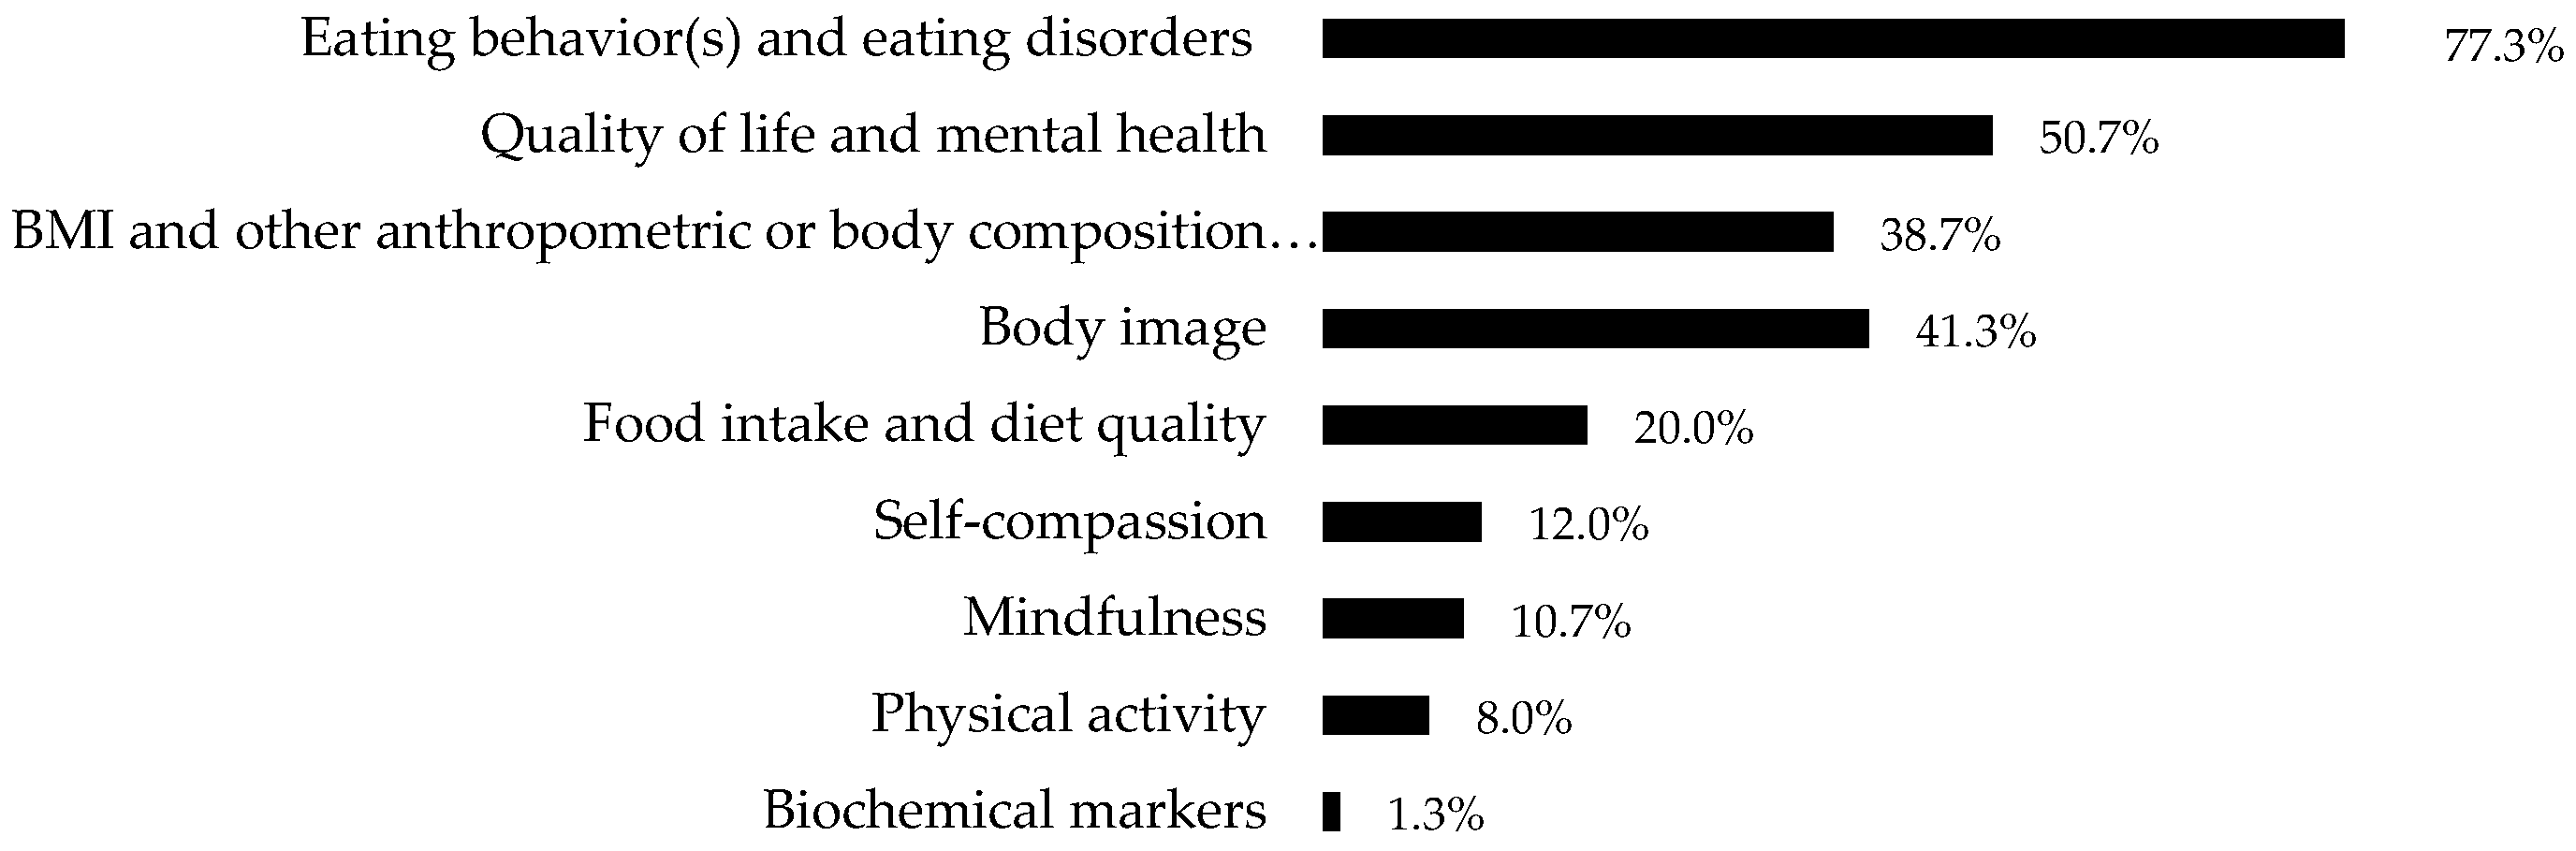
3.5. Outcomes
4. Discussion
5. Conclusions
Author Contributions
Funding
Institutional Review Board Statement
Informed Consent Statement
Data Availability Statement
Conflicts of Interest
References
- Tribole, E.; Resch, E. Intuitive Eating: A Revolutionary Program That Works; St. Martin’s Griffin: New York, NY, USA, 1995. [Google Scholar]
- Kristeller, J.L.; Hallett, C.B. An Exploratory Study of a Meditation-based Intervention for Binge Eating Disorder. J. Health Psychol. 1999, 4, 357–363. [Google Scholar] [CrossRef]
- Kristeller, J.L.; Wolever, R.Q. Mindfulness-Based Eating Awareness Training for Treating Binge Eating Disorder: The Conceptual Foundation. Eat. Disord. 2010, 19, 49–61. [Google Scholar] [CrossRef]
- Grider, H.S.; Douglas, S.M.; Raynor, H.A. The Influence of Mindful Eating and/or Intuitive Eating Approaches on Dietary Intake: A Systematic Review. J. Acad. Nutr. Diet. 2020, 121, 709–727.e1. [Google Scholar] [CrossRef]
- O’Reilly, G.A.; Cook, L.; Spruijt-Metz, D.; Black, D.S. Mindfulness-based interventions for obesity-related eating behaviours: A literature review. Obes. Rev. 2014, 15, 453–461. [Google Scholar] [CrossRef] [PubMed]
- Artiles, R.F.; Staub, K.; Aldakak, L.; Eppenberger, P.; Rühli, F.; Bender, N. Mindful eating and common diet programs lower body weight similarly: Systematic review and meta-analysis. Obes. Rev. 2019, 20, 1619–1627. [Google Scholar] [CrossRef] [PubMed]
- Kabat-Zinn, J. An outpatient program in behavioral medicine for chronic pain patients based on the practice of mindfulness meditation: Theoretical considerations and preliminary results. Gen. Hosp. Psychiatry 1982, 4, 33–47. [Google Scholar] [CrossRef] [PubMed]
- Monroe, J.T. Mindful Eating. Am. J. Lifestyle Med. 2015, 9, 217–220. [Google Scholar] [CrossRef]
- Mantzios, M. (Re)defining mindful eating into mindful eating behaviour to advance scientific enquiry. Nutr. Health 2020, 27, 367–371. [Google Scholar] [CrossRef]
- Tylka, T.L. Development and psychometric evaluation of a measure of intuitive eating. J. Couns. Psychol. 2006, 53, 226–240. [Google Scholar] [CrossRef]
- Tylka, T.L.; Van Diest, A.M.K. The Intuitive Eating Scale–2: Item refinement and psychometric evaluation with college women and men. J. Couns. Psychol. 2013, 60, 137–153. [Google Scholar] [CrossRef]
- Karyotaki, E.; Cuijpers, P.; Albor, Y.; Alonso, J.; Auerbach, R.P.; Bantjes, J.; Bruffaerts, R.; Ebert, D.D.; Hasking, P.; Kiekens, G.; et al. Sources of Stress and Their Associations with Mental Disorders Among College Students: Results of the World Health Organization World Mental Health Surveys International College Student Initiative. Front. Psychol. 2020, 11, 1759. [Google Scholar] [CrossRef] [PubMed]
- Miyake, Y.; Okamoto, Y.; Takagaki, K.; Yoshihara, M. Changes in Eating Attitudes and Risk for Developing Disordered Eating Behaviors in College Students with Subthreshold Eating Disorders: A Cohort Study. Psychopathology 2022, 56, 276–284. [Google Scholar] [CrossRef]
- Harrer, M.; Adam, S.H.; Mag, E.M.; Baumeister, H.; Cuijpers, P.; Bruffaerts, R.; Auerbach, R.P.; Kessler, R.C.; Jacobi, C.; Taylor, C.B.; et al. Prevention of eating disorders at universities: A systematic review and meta-analysis. Int. J. Eat. Disord. 2020, 53, 813–833. [Google Scholar] [CrossRef]
- Babbott, K.M.; Cavadino, A.; Brenton-Peters, J.; Consedine, N.S.; Roberts, M. Outcomes of intuitive eating interventions: A systematic review and meta-analysis. Eat. Disord. 2022, 31, 33–63. [Google Scholar] [CrossRef]
- Chiodo, C.; Goto, K.; Horst, K.; Giampaoli, J.; Giromini, L. Food Attitudes, Mindful Eating, and Satisfaction with Food-Related Life among Italian and American University Students. J. Hunger Environ. Nutr. 2022, 18, 798–811. [Google Scholar] [CrossRef]
- Galmiche, M.; Déchelotte, P.; Lambert, G.; Tavolacci, M.P. Prevalence of eating disorders over the 2000–2018 period: A systematic literature review. Am. J. Clin. Nutr. 2019, 109, 1402–1413. [Google Scholar] [CrossRef]
- Santomauro, D.F.; Melen, S.; Mitchison, D.; Vos, T.; Whiteford, H.; Ferrari, A.J. The hidden burden of eating disorders: An extension of estimates from the Global Burden of Disease Study 2019. Lancet Psychiatry 2021, 8, 320–328. [Google Scholar] [CrossRef]
- Termorshuizen, J.D.; Watson, H.J.; Thornton, L.M.; Borg, S.; Flatt, R.E.; MacDermod, C.M.; Harper, L.E.; van Furth, E.F.; Peat, C.M.; Bulik, C.M. Early impact of COVID-19 on individuals with self-reported eating disorders: A survey of ~1000 individuals in the United States and the Netherlands. Int. J. Eat. Disord. 2020, 53, 1780–1790. [Google Scholar] [CrossRef]
- Taquet, M.; Geddes, J.R.; Luciano, S.; Harrison, P.J. Incidence and outcomes of eating disorders during the COVID-19 pandemic. Br. J. Psychiatry 2021, 220, 262–264. [Google Scholar] [CrossRef]
- Page, M.J.; McKenzie, J.E.; Bossuyt, P.M.; Boutron, I.; Hoffmann, T.C.; Mulrow, C.D.; Shamseer, L.; Tetzlaff, J.M.; Akl, E.A.; Brennan, S.E.; et al. The PRISMA 2020 statement: An updated guideline for reporting systematic reviews. BMJ 2021, 372, 71. [Google Scholar] [CrossRef] [PubMed]
- Academy of Nutrition and Dietetics. Evidence Analysis Manual: Steps in the Academy Evidence Analysis Process; Academy of Nutrition and Dietetics: Chicago, IL, USA, 2016. [Google Scholar]
- Hawks, S.; Merrill, R.M.; Madanat, H.N. The Intuitive Eating Scale: Development and Preliminary Validation. Am. J. Health Educ. 2004, 35, 90–99. [Google Scholar] [CrossRef]
- Hawks, S.; Madanat, H.; Hawks, J.; Harris, A. The Relationship between Intuitive Eating and Health Indicators among College Women. Am. J. Health Educ. 2005, 36, 331–336. [Google Scholar] [CrossRef]
- Avalos, L.C.; Tylka, T.L. Exploring a model of intuitive eating with college women. J. Couns. Psychol. 2006, 53, 486–497. [Google Scholar] [CrossRef]
- Smith, T.S.; Hawks, S.R. Intuitive Eating, Diet Composition, and The Meaning of Food in Healthy Weight Promotion. Am. J. Health Educ. 2006, 37, 130–136. [Google Scholar] [CrossRef]
- Tylka, T.L.; Wilcox, J.A. Are intuitive eating and eating disorder symptomatology opposite poles of the same construct? J. Couns. Psychol. 2006, 53, 474–485. [Google Scholar] [CrossRef]
- Hawks, S.R.; Madanat, H.; Smith, T.; De La Cruz, N. Classroom Approach for Managing Dietary Restraint, Negative Eating Styles, and Body Image Concerns Among College Women. J. Am. Coll. Health 2008, 56, 359–366. [Google Scholar] [CrossRef]
- Galloway, A.T.; Farrow, C.V.; Martz, D.M. Retrospective Reports of Child Feeding Practices, Current Eating Behaviors, and BMI in College Students. Obesity 2010, 18, 1330–1335. [Google Scholar] [CrossRef]
- Shouse, S.H.; Nilsson, J. Self-Silencing, Emotional Awareness, and Eating Behaviors in College Women. Psychol. Women Q. 2011, 35, 451–457. [Google Scholar] [CrossRef]
- Brown, A.J.; Parman, K.M.; Rudat, D.A.; Craighead, L.W. Disordered eating, perfectionism, and food rules. Eat. Behav. 2012, 13, 347–353. [Google Scholar] [CrossRef]
- Webb, J.B.; Hardin, A.S. A preliminary evaluation of BMI status in moderating changes in body composition and eating behavior in ethnically-diverse first-year college women. Eat. Behav. 2012, 13, 402–405. [Google Scholar] [CrossRef]
- Moor, K.R.; Scott, A.J.; McIntosh, W.D. Mindful Eating and Its Relationship to Body Mass Index and Physical Activity Among University Students. Mindfulness 2012, 4, 269–274. [Google Scholar] [CrossRef]
- Framson, C.; Kristal, A.R.; Schenk, J.M.; Littman, A.J.; Zeliadt, S.; Benitez, D. Development and Validation of the Mindful Eating Questionnaire. J. Am. Diet. Assoc. 2009, 109, 1439–1444. [Google Scholar] [CrossRef]
- Schoenefeld, S.J.; Webb, J.B. Self-compassion and intuitive eating in college women: Examining the contributions of distress tolerance and body image acceptance and action. Eat. Behav. 2013, 14, 493–496. [Google Scholar] [CrossRef] [PubMed]
- Hulbert-Williams, L.; Nicholls, W.; Joy, J.; Hulbert-Williams, N. Initial Validation of the Mindful Eating Scale. Mindfulness 2013, 5, 719–729. [Google Scholar] [CrossRef]
- Anderson, D.A.; Schaumberg, K.; Anderson, L.M.; Reilly, E.E. Is level of intuitive eating associated with plate size effects? Eat. Behav. 2015, 18, 125–130. [Google Scholar] [CrossRef] [PubMed]
- Gast, J.; Nielson, A.C.; Hunt, A.; Leiker, J.J. Intuitive Eating: Associations with Physical Activity Motivation and BMI. Am. J. Health Promot. 2015, 29, e91–e99. [Google Scholar] [CrossRef] [PubMed]
- Humphrey, L.; Clifford, D.; Morris, M.N. Health at Every Size College Course Reduces Dieting Behaviors and Improves Intuitive Eating, Body Esteem, and Anti-Fat Attitudes. J. Nutr. Educ. Behav. 2015, 47, 354–360.e1. [Google Scholar] [CrossRef] [PubMed]
- Taylor, M.B.; Daiss, S.; Krietsch, K. Associations among self-compassion, mindful eating, eating disorder symptomatology, and body mass index in college students. Transl. Issues Psychol. Sci. 2015, 1, 229–238. [Google Scholar] [CrossRef]
- Tylka, T.L.; Homan, K.J. Exercise motives and positive body image in physically active college women and men: Exploring an expanded acceptance model of intuitive eating. Body Image 2015, 15, 90–97. [Google Scholar] [CrossRef] [PubMed]
- Anderson, L.M.; Reilly, E.E.; Schaumberg, K.; Dmochowski, S.; Anderson, D.A. Contributions of mindful eating, intuitive eating, and restraint to BMI, disordered eating, and meal consumption in college students. Eat. Weight Disord. Stud. Anorex. Bulim. Obes. 2015, 21, 83–90. [Google Scholar] [CrossRef]
- Bryan, S. Mindfulness and Nutrition in College Age Students. J. Basic Appl. Sci. 2016, 12, 68–74. [Google Scholar] [CrossRef]
- Ellis, J.M.; Galloway, A.T.; Webb, R.M.; Martz, D.M.; Farrow, C.V. Recollections of pressure to eat during childhood, but not picky eating, predict young adult eating behavior. Appetite 2016, 97, 58–63. [Google Scholar] [CrossRef] [PubMed]
- Kelly, A.C.; Stephen, E. A daily diary study of self-compassion, body image, and eating behavior in female college students. Body Image 2016, 17, 152–160. [Google Scholar] [CrossRef] [PubMed]
- Webb, J.B.; Hardin, A.S. An integrative affect regulation process model of internalized weight bias and intuitive eating in college women. Appetite 2016, 102, 60–69. [Google Scholar] [CrossRef]
- Bas, M.; Karaca, K.E.; Saglam, D.; Arıtıcı, G.; Cengiz, E.; Köksal, S.; Buyukkaragoz, A.H. Turkish version of the Intuitive Eating Scale-2: Validity and reliability among university students. Appetite 2017, 114, 391–397. [Google Scholar] [CrossRef]
- Meadows, A.; Nolan, L.J.; Higgs, S. Self-perceived food addiction: Prevalence, predictors, and prognosis. Appetite 2017, 114, 282–298. [Google Scholar] [CrossRef]
- Bourdier, L.; Orri, M.; Carre, A.; Gearhardt, A.N.; Romo, L.; Dantzer, C.; Berthoz, S. Are emotionally driven and addictive-like eating behaviors the missing links between psychological distress and greater body weight? Appetite 2018, 120, 536–546. [Google Scholar] [CrossRef]
- Loughran, T.; Schumacher, J.; Harpel, T.; Vollmer, R. Effectiveness of Intuitive Eating Intervention through a Text Messaging Program among College Students. J. Acad. Nutr. Diet. 2017, 117, A137. [Google Scholar] [CrossRef]
- Mantzios, M.; Egan, H. An exploratory examination of mindfulness, self-compassion, and mindful eating in relation to motivations to eat palatable foods and BMI. Health Psychol. Rep. 2018, 6, 207–215. [Google Scholar] [CrossRef]
- Mantzios, M.; Egan, H.; Bahia, H.; Hussain, M.; Keyte, R. How does grazing relate to body mass index, self-compassion, mindfulness and mindful eating in a student population? Health Psychol. Open 2018, 5, 2055102918762701. [Google Scholar] [CrossRef]
- Mantzios, M.; Egan, H.; Hussain, M.; Keyte, R.; Bahia, H. Mindfulness, self-compassion, and mindful eating in relation to fat and sugar consumption: An exploratory investigation. Eat. Weight Disord. Stud. Anorex. Bulim. Obes. 2018, 23, 833–840. [Google Scholar] [CrossRef]
- Romano, K.A.; Becker, M.A.S.; Colgary, C.D.; Magnuson, A. Helpful or harmful? The comparative value of self-weighing and calorie counting versus intuitive eating on the eating disorder symptomology of college students. Eat. Weight Disord. Stud. Anorex. Bulim. Obes. 2018, 23, 841–848. [Google Scholar] [CrossRef] [PubMed]
- Saunders, J.F.; Nichols-Lopez, K.A.; Frazier, L.D. Psychometric properties of the intuitive eating scale-2 (IES-2) in a culturally diverse Hispanic American sample. Eat. Behav. 2018, 28, 1–7. [Google Scholar] [CrossRef] [PubMed]
- Webb, J.B.; Rogers, C.B.; Etzel, L.; Padro, M.P. “Mom, quit fat talking—I’m trying to eat (mindfully) here!”: Evaluating a sociocultural model of family fat talk, positive body image, and mindful eating in college women. Appetite 2018, 126, 169–175. [Google Scholar] [CrossRef] [PubMed]
- Barad, A.; Cartledge, A.; Gemmill, K.; Misner, N.M.; Santiago, C.E.; Yavelow, M.; Langkamp-Henken, B. Associations Between Intuitive Eating Behaviors and Fruit and Vegetable Intake Among College Students. J. Nutr. Educ. Behav. 2019, 51, 758–762. [Google Scholar] [CrossRef] [PubMed]
- Craven, M.P.; Fekete, E.M. Weight-related shame and guilt, intuitive eating, and binge eating in female college students. Eat. Behav. 2019, 33, 44–48. [Google Scholar] [CrossRef] [PubMed]
- Lyzwinski, L.N.; Caffery, L.; Bambling, M.; Edirippulige, S. The Mindfulness App Trial for Weight, Weight-Related Behaviors, and Stress in University Students: Randomized Controlled Trial. JMIR mHealth uHealth 2019, 7, e12210. [Google Scholar] [CrossRef] [PubMed]
- Miller, K.; Kelly, A.; Stephen, E. Exposure to body focused and non-body focused others over a week: A preliminary investigation of their unique contributions to college women’s eating and body image. Body Image 2018, 28, 44–52. [Google Scholar] [CrossRef]
- Román, N.; Urbán, R. Mindful Awareness or Self-Regulation in Eating: An Investigation into the Underlying Dimensions of Mindful Eating. Mindfulness 2019, 10, 2110–2120. [Google Scholar] [CrossRef]
- Burnette, C.B.; Mazzeo, S.E. An uncontrolled pilot feasibility trial of an intuitive eating intervention for college women with disordered eating delivered through group and guided self-help modalities. Int. J. Eat. Disord. 2020, 53, 1405–1417. [Google Scholar] [CrossRef]
- Gan, W.Y.; Yeoh, W.C. Associations between body weight status, psychological well-being and disordered eating with intuitive eating among Malaysian undergraduate university students. Int. J. Adolesc. Med. Health 2017, 32, 20170095. [Google Scholar] [CrossRef]
- Giannopoulou, I.; Kotopoulea-Nikolaidi, M.; Daskou, S.; Martyn, K.; Patel, A. Mindfulness in Eating Is Inversely Related to Binge Eating and Mood Disturbances in University Students in Health-Related Disciplines. Nutrients 2020, 12, 396. [Google Scholar] [CrossRef]
- Kawasaki, Y.; Akamatsu, R.; Omori, M.; Sugawara, M.; Yamazaki, Y.; Matsumoto, S.; Fujiwara, Y.; Iwakabe, S.; Kobayashi, T. Development and validation of the Expanded Mindful Eating Scale. Int. J. Health Care Qual. Assur. 2020, 33, 309–321. [Google Scholar] [CrossRef]
- Keyte, R.; Egan, H.; Mantzios, M. How does mindful eating without non-judgement, mindfulness and self-compassion relate to motivations to eat palatable foods in a student population? Nutr. Health 2019, 26, 27–34. [Google Scholar] [CrossRef] [PubMed]
- Winkens, L.H.; van Strien, T.; Barrada, J.R.; Brouwer, I.A.; Penninx, B.W.; Visser, M. The Mindful Eating Behavior Scale: Development and Psychometric Properties in a Sample of Dutch Adults Aged 55 Years and Older. J. Acad. Nutr. Diet. 2018, 118, 1277–1290.e4. [Google Scholar] [CrossRef] [PubMed]
- Köse, G.; Ciplak, M.E. Mindful eating questionnaired: Eating control, emotional eating and conscious nutrition trio. Prog. Nutr. 2020, 22, 555–561. [Google Scholar] [CrossRef]
- Kose, G.; Tayfur, M.; Birincioglu, I.; Donmez, A. Adaptation Study of the Mindful Eating Questiionnare (MEQ) into Turkish. J. Cogn. Psychother. Res. 2017, 5, 125. [Google Scholar] [CrossRef]
- Köse, G.; Çıplak, M.E. Does mindful eating have a relationship with gender, body mass index and health promoting lifestyle? Prog. Nutr. 2020, 22, 528–535. [Google Scholar] [CrossRef]
- Wilson, R.E.; Marshall, R.D.; Murakami, J.M.; Latner, J.D. Brief non-dieting intervention increases intuitive eating and reduces dieting intention, body image dissatisfaction, and anti-fat attitudes: A randomized controlled trial. Appetite 2020, 148, 104556. [Google Scholar] [CrossRef]
- Kawasaki, Y.; Akamatsu, R.; Fujiwara, Y.; Omori, M.; Sugawara, M.; Yamazaki, Y.; Matsumoto, S.; Iwakabe, S.; Kobayashi, T. Is mindful eating sustainable and healthy? A focus on nutritional intake, food consumption, and plant-based dietary patterns among lean and normal-weight female university students in Japan. Eat. Weight Disord. Stud. Anorex. Bulim. Obes. 2021, 26, 2183–2199. [Google Scholar] [CrossRef]
- Kes, D.; Cicek, S.C. Mindful eating, obesity, and risk of type 2 diabetes in university students: A cross-sectional study. Nurs. Forum 2021, 56, 483–489. [Google Scholar] [CrossRef]
- Layman, B.H.M.; Keirns, N.G.; Hawkins, M.A.W. Internalization of body image as a potential mediator of the relationship between body acceptance by others and intuitive eating. J. Am. Coll. Health 2021, 71, 1797–1803. [Google Scholar] [CrossRef] [PubMed]
- Lopez, T.D.; Hernandez, D.; Bode, S.; Ledoux, T. A complex relationship between intuitive eating and diet quality among university students. J. Am. Coll. Health 2021, 71, 2751–2757. [Google Scholar] [CrossRef]
- Nen, C.; Sandikçi, M.B. Reflection of eating awareness and life engagement of university students on the coronavirus (COVID-19) pandemic. Prog. Nutr. 2021, 23, e2021265. [Google Scholar] [CrossRef]
- Rodgers, R.F.; White, M.; Berry, R. Orthorexia nervosa, intuitive eating, and eating competence in female and male college students. Eat. Weight Disord. Stud. Anorex. Bulim. Obes. 2021, 26, 2625–2632. [Google Scholar] [CrossRef]
- Román, N.; Rigó, A.; Gajdos, P.; Tóth-Király, I.; Urbán, R. Intuitive eating in light of other eating styles and motives: Experiences with construct validity and the Hungarian adaptation of the Intuitive Eating Scale-2. Body Image 2021, 39, 30–39. [Google Scholar] [CrossRef]
- Ahlich, E.; Rancourt, D. Boredom proneness, interoception, and emotional eating. Appetite 2022, 178, 106167. [Google Scholar] [CrossRef] [PubMed]
- Belon, K.E.; Serier, K.N.; VanderJagt, H.; Smith, J.E. What Is Healthy Eating? Exploring Profiles of Intuitive Eating and Nutritionally Healthy Eating in College Women. Am. J. Health Promot. 2022, 36, 823–833. [Google Scholar] [CrossRef] [PubMed]
- Cebioğlu, İ.K.; Bilgin, G.D.; Kavsara, H.K.; Koyuncu, A.G.; Sarioğlu, A.; Aydin, S.; Keküllüoğlu, M. Food addiction among university students: The effect of mindful eating. Appetite 2022, 177, 106133. [Google Scholar] [CrossRef]
- Clementi, C.; Casu, G.; Gremigni, P. An Abbreviated Version of the Mindful Eating Questionnaire. J. Nutr. Educ. Behav. 2017, 49, 352–356.e1. [Google Scholar] [CrossRef]
- Katcher, J.A.; Suminski, R.R.; Pacanowski, C.R. Impact of an Intuitive Eating Intervention on Disordered Eating Risk Factors in Female-Identifying Undergraduates: A Randomized Waitlist-Controlled Trial. Int. J. Environ. Res. Public Health 2022, 19, 12049. [Google Scholar] [CrossRef]
- Lovan, P.; George, F.; Campa, A.; Huffman, F.; Coccia, C. The Effect of Mood Change and Intuitive Eating Skills on Self-Regulation of Food Intake among Undergraduate College Students. Am. J. Health Educ. 2022, 53, 149–160. [Google Scholar] [CrossRef]
- Lovan, P.; Prado, G.; Lee, T.; Coccia, C. A snapshot of eating behaviors in undergraduate college students living in South Florida. J. Am. Coll. Health 2022, 9, 1–10. [Google Scholar] [CrossRef]
- Mackenzie, K.M.; Kerr, D.A.; Whitton, C.; Talati, Z.; McCaffrey, T.A.; Mullan, B.A. Predicting Perceived Problems in Self-Administered 24-Hour Dietary Recalls: A Quantitative Think-Aloud Study Comparing Automated Self-Assisted 24-Hour Dietary Assessment Tool (ASA24®) and INTAKE24© in University Students. Nutrients 2022, 14, 4281. [Google Scholar] [CrossRef]
- Romano, K.A.; Heron, K.E. Examining Race and Gender Differences in Associations Among Body Appreciation, Eudaimonic Psychological Well-Being, and Intuitive Eating and Exercising. Am. J. Health Promot. 2021, 36, 117–128. [Google Scholar] [CrossRef]
- Shaw, R.; Cassidy, T. Self-Compassion, Mindful Eating, Eating Attitudes and Wellbeing Among Emerging Adults. J. Psychol. 2021, 156, 33–47. [Google Scholar] [CrossRef]
- Vrabec, A.; Yuhas, M.; Deyo, A.; Kidwell, K. Social jet lag and eating styles in young adults. Chronobiol. Int. 2022, 39, 1277–1284. [Google Scholar] [CrossRef]
- Akik, B.K.; Yiğit, İ. Evaluating the psychometric properties of the mindful eating questionnaire: Turkish validity and reliability study. Curr. Psychol. 2022, 42, 12661–12670. [Google Scholar] [CrossRef]
- Cetin, A.K. Chronotype is associated with addiction-like eating behavior, mindful eating and ultra-processed food intake among undergraduate students. Chronobiol. Int. 2023, 40, 1435–1443. [Google Scholar] [CrossRef] [PubMed]
- Fırat, Y.; Cicek, B. Is intuitive eating linked to waist circumference and the waist-to-height ratio, both of which are risk factors for cardiometabolic disease? Prog. Nutr. 2023, 25, e2023015. [Google Scholar]
- Loor, J.M.; Mullins, C.R.; Smith, J.E. Examination of ecological validity of intuitive eating. Appetite 2023, 188, 106761. [Google Scholar] [CrossRef]
- Loor, J.M.; Mullins, C.R.; Pacheco, C.; VanderJagt, H.; Smith, J.E. A qualitative exploration of perceived barriers and facilitators to following an intuitive eating style. Eat. Behav. 2023, 49, 101744. [Google Scholar] [CrossRef]
- Schueler, J.; Philip, S.R.; Vitus, D.; Engler, S.; Fields, S.A. Group differences in binge eating, impulsivity, and intuitive and mindful eating among intermittent fasters and non-fasters. Appetite 2023, 182, 106416. [Google Scholar] [CrossRef] [PubMed]
- Yang, C.; Wen, H.; Zhou, Y.; Wang, Y.; Sun, Y.; Yuan, F. Family cohesion and intuitive eating in Chinese college students: A serial mediation model. Appetite 2023, 190, 107021. [Google Scholar] [CrossRef] [PubMed]
- Yoon, C.; Mai, D.; Kinariwala, K.; Ledoux, T.; Betts, R.; Johnston, C. Sex and ethnic/racial differences in disordered eating behaviors and intuitive eating among college student. Front. Psychol. 2023, 14, 1221816. [Google Scholar] [CrossRef] [PubMed]
- Yoon, C.; Joseph, T.; Moussa, G.; Voss, T.; Ledoux, T.; Johnston, C. Associations of positive childhood experiences with binge-eating disorder characteristics and intuitive eating among college students. Appetite 2023, 191, 107073. [Google Scholar] [CrossRef]
- Dekker, I.; De Jong, E.M.; Schippers, M.C.; De Bruijn-Smolders, M.; Alexiou, A.; Giesbers, B. Optimizing Students’ Mental Health and Academic Performance: AI-Enhanced Life Crafting. Front. Psychol. 2020, 11, 1063. [Google Scholar] [CrossRef]
- Sheldon, E.; Simmonds-Buckley, M.; Bone, C.; Mascarenhas, T.; Chan, N.; Wincott, M.; Gleeson, H.; Sow, K.; Hind, D.; Barkham, M. Prevalence and risk factors for mental health problems in university undergraduate students: A systematic review with meta-analysis. J. Affect. Disord. 2021, 287, 282–292. [Google Scholar] [CrossRef]
- Deliens, T.; Clarys, P.; De Bourdeaudhuij, I.; Deforche, B. Determinants of eating behaviour in university students: A qualitative study using focus group discussions. BMC Public Health 2014, 14, 53. [Google Scholar] [CrossRef]
- Maillet, M.A.; Grouzet, F.M.E. Understanding changes in eating behavior during the transition to university from a self-determination theory perspective: A systematic review. J. Am. Coll. Health 2021, 71, 422–439. [Google Scholar] [CrossRef]
- Hanel, P.H.P.; Vione, K.C. Do Student Samples Provide an Accurate Estimate of the General Public? PLoS ONE 2016, 11, e0168354. [Google Scholar] [CrossRef]
- Linardon, J.; Tylka, T.L.; Fuller-Tyszkiewicz, M. Intuitive eating and its psychological correlates: A meta-analysis. Int. J. Eat. Disord. 2021, 54, 1073–1098. [Google Scholar] [CrossRef] [PubMed]
- Mercado, D.; Robinson, L.; Gordon, G.; Werthmann, J.; Campbell, I.C.; Schmidt, U. The outcomes of mindfulness-based interventions for Obesity and Binge Eating Disorder: A meta-analysis of randomised controlled trials. Appetite 2021, 166, 105464. [Google Scholar] [CrossRef] [PubMed]
- Grohmann, D.; Laws, K.R. Two decades of mindfulness-based interventions for binge eating: A systematic review and meta-analysis. J. Psychosom. Res. 2021, 149, 110592. [Google Scholar] [CrossRef]
- Giacone, L.; Sob, C.; Siegrist, M.; Hartmann, C. Intuitive eating and its influence on self-reported weight and eating behaviors. Eat. Behav. 2024, 52, 101844. [Google Scholar] [CrossRef]
- Kerin, J.L.; Webb, H.J.; Zimmer-Gembeck, M.J. Intuitive, mindful, emotional, external and regulatory eating behaviours and beliefs: An investigation of the core components. Appetite 2018, 132, 139–146. [Google Scholar] [CrossRef] [PubMed]
- Mak, C.; Whittingham, K.; Cunnington, R.; Boyd, R.N. Efficacy of Mindfulness-Based Interventions for Attention and Exec-utive Function in Children and Adolescents—A Systematic Review. Mindfulness 2018, 9, 59–78. [Google Scholar] [CrossRef]
- Bruce, L.J.; Ricciardelli, L.A. A systematic review of the psychosocial correlates of intuitive eating among adult women. Appetite 2016, 96, 454–472. [Google Scholar] [CrossRef]


| Parameter | Inclusion Criteria |
|---|---|
| Population | Higher education students of both sexes |
| Intervention (or Exposition) | Assessment of mindful eating and/or intuitive eating |
| Comparison | Not applicable |
| Outcome | Scales used to measure ME and IE and associated outcomes. |
| Reference | Country | Design | Participant Characteristics | Sample Size and Groups | Intervention | ME or IE Measurement | Outcome Categories * |
|---|---|---|---|---|---|---|---|
| Hawks et al. (2004) [23] | U.S.A. | CS | Age: 20.6 (3.4); 87.7% White, 6.9% Hispanic, 5.4% others | Total: n = 391 females F: n = 163 (41.6%) M: n = 228 (58.4%) | NA | 30-item IES [23] | 1 |
| Hawks et al. (2005) [24] | U.S.A. | CS | Age: 18 to 22 | Total: n = 32 - High IES Scorers: n = 15 (46.9%) - Low IES Scorers: n = 17 (53.1%) | NA | 21-item IES [10] | 3, 7, 9 |
| Avalos and Tylka (2006) [25] | U.S.A. | CS study 1 | Age: 20.24 (5.17) [17 to 55]; 82.2% European American, 5.0% African American, 3.9% Asian American, 0.6% Native American, 8.3% others | Total: n = 181 females | NA | 21-item IES [10] | 4, 8 |
| U.S.A. | CS study 2 | Age: 19.92 (4.60) [17 to 50], 77.6% European American, 9.1% African American, 5.0% Asian American, 2.4% Latina, 5.7% others | Total: n = 417 females | NA | 21-item IES [10] | 4, 8 | |
| Smith and Hawks (2006) [26] | U.S.A. | CS | Age: almost half were 18 to 20 y, ~98% were 18 to 26 y; nearly 90% White, 4.1% Hispanic, 2.4% Asian, 1.8% American Indian, <1% African Americans and Native Hawaiians | Total: n = 343 F: n = 136 (39.7%) M: n = 207 (59.8%) | NA | 27-item IES [23] | 1, 2 |
| Tylka (2006) [10] | U.S.A. | CS study 1 | Age: 20.85 (6.21) [17 to 61]; 87.7% White American, 3.8% Asian American, 3.1% African American, 2.8% Native American, 0.5% Latina, 3.4% others | Total: n = 391 females | NA | 21-item IES [10] | 1, 4, 8 |
| U.S.A. | CS study 2 | Age: 19.70 (4.50) [17 to 50]: 86.2% White American, 5.3% Asian American, 3.9% African American, 2.1% Latina, 2.4% others | Total: n = 476 females | NA | 21-item IES [10] | 8 | |
| U.S.A. | CS study 3 | Age: 18.92 (3.25) [17 to 55]; 75.4% White American, 13.1% African American, 4.0% Asian American, 2.0% Latina, 3.5% International, 0.5% Native American, 1.5% others | Total: n = 199 females | NA | 21-item IES [10] | 3 | |
| U.S.A. | CS study 4 | Age: 22.07 (7.38) [17 to 55]; 94.3% White American, 2.1% African American, 0.5% Latina, 0.5% Native American, 2.6% others | Total: n = 194 females | NA | 21-item IES [10] | 1 | |
| Tylka and Wilcox (2006) [27] | U.S.A. | CS study 1 | Age: 18.44 (1.02) [17 to 30]; 85.9% White American, 5.3% African American, 5.0% Asian American, 2.1% Latina, 1.8% others | Total: n = 338 females | NA | 21-item IES [10] | 3, 8 |
| U.S.A. | CS study 2 | Age: 18.72 (2.44) [17 to 55]; 81.6% White American, 8.3% African American, 4.3% Asian American, 1.8% Latina, 3.6% others | Total: n = 396 females | NA | 21-item IES [10] | 8 | |
| Hawks et al. (2008) [28] | U.S.A. | QE | Age: 22.8 (7.6) [18 to 51]; BMI: 23.4 [19.3 to 38.2]; BMI categories: 77.8% NW, 18.5% OW, 3.7% OB; 89.7% White, 10.3% others | Total: n = 29 females Low-dieting: n = 15 High-dieting: n = 14 | Class met twice a week for 1.5 h during a 15-week semester | 30-item IES [23] | 1, 8 |
| Galloway et al. (2010) [29] | U.S.A. | CS | Age: F: 18.5 (0.95), M: 18.6 (0.95); BMI: F: 24.2 (5.3), M: 25.1 (5.6); BMI categories by sex: M: 30% OW, 11% OB, F: 17% OW, 11% OB; 96% non-Hispanic White, 3% African American, 1% Asian American | Total: n = 98 F: n = 71 (72.5%) M: n = 27 (27.5%) | NA | 21-item IES [10] | 1, 3 |
| Shouse and Nilsson (2011) [30] | U.S.A. | CS | Age: 20.8 (1.9) [18 to 24]; 52% White American, 36% African American, 4% Asian American, 4% Hispanic, 4% others | Total: n = 140 females | NA | 21-item IES [10] | 1, 8 |
| Brown et al. (2012) [31] | U.S.A. | CS | Age: 19.2 (2.5) [18 to 35]; 66.7% White, 18.8% Asian, 10.4% Hispanic or Latina, 8.3% Black or African American, 4.2% others | Total: n = 48 females | NA | 21-item IES [10] | 1, 4 |
| Webb and Hardin (2012) [32] | U.S.A. | CS | Age: 18.1 (0.29); BMI: 24.2 (5.37); BMI categories: 22% OW, 11.4% OB; 40.3% Black/African American; 59.7% White/European American | Time 1: n = 134 females Time 2: n = 83 females | NA | 21-item IES [10] | 1, 3 |
| Moor et al. (2013) [33] | U.S.A. | CS | Age: 25.86 (9.67) [18 to 58]; BMI: 25.2 (4.3) [16.7 to 39.4]; 84.5% White, 10.7% African American, 3.6% Asian, 1.1% American Indian | Total: n = 90 F: n = 47 (56.6%) M: n = 36 (43.4%) | NA | 28-item MEQ [34] | 3, 7 |
| Schoenefeld and Webb (2013) [35] | U.S.A. | CS | Age: 19.48 (1.46) [18 to 24]; BMI: 23.55 (5.11); 67.4% European American, 21.1% African American, 5.8% Latina, 3.2% Asian, 1.6% American Indian, 1.0% Hawaiian or other Pacific Island | Total: n = 322 females | NA | 21-item IES [10] | 4, 6, 8 |
| Tylka and Kroon Van Diest (2013) [11] | U.S.A. | CS study 1 | Age: 20.4 (5.19) [18 to 56]; 77.3% White, 13.1% African American, 4.0% Asian American, 1.3% Latina, 0.7% Native American, 2.7% others | Total: n = 878 F: n = 487 (55.5%) M: n = 391 (44.5%) | NA | 23-item IES-2 [11] | 1 |
| U.S.A. | CS study 2 | Age: 20.45 (5.06) [18 to 53]; BMI: F: 24.02 (5.68) [15.98 to 56.25], M: 25.38 (5.48) [16.50 to 59.06]; 81.7% White, 5.5% African American, 3.5% Asian American, 1.8% Latina, 0.1% Native American, 7.3% others | Total: n = 1200 F: n = 680 (56.6%) M: n = 520 (43.3%) | NA | 23-item IES-2 [11] | 1, 4, 8 | |
| U.S.A. | CS study 3 | Age: 20.29 (4.82) [18 to 56]; 78.4% White, 5.4% African American, 4.8% Asian American, 1.0% Latina, 0.4% Native American, 6.3% others | Total: n = 522 F: n = 238 (45.6%) M: n = 284 (54.4%) | NA | 23-item IES-2 [11] | 8 | |
| Hulbert-Williams et al. (2014) [36] | U.K. | CS | Age: 25.65 (8.89); BMI: 23.59 (3.54); 85% White, 25% others | Total: n = 127 F: n = 98 (77.2%) M: n = 29 (22.8%) | NA | MES [36] | 1, 4, 5, 8 |
| Anderson et al. (2015) [37] | U.S.A. | CS | Age: 19.3 (1.3); BMI: 23.0 (3.8); 65.7% White, 12.4% Black, 12.4% Asian, 9.0% others | Total: n = 137 F: n = 87 (63.5%) M: n = 50 (36.5%) | NA | 21-item IES [10] | 1, 2, 3 |
| Gast et al. (2015) [38] | U.S.A. | CS | Age: 19.58 (2.42); BMI categories: 6.5% UW, 69.0% NW, 17.5% OW, 7.0% OB; 90% White, 4% Hispanic, 3% Asian, 1.5% Native, 1% Black, 0.5% Pacific Islander | Total: n = 200 females | NA | 27-item IES [23] | 3, 4 |
| Humphrey et al. (2015) [39] | U.S.A. | QE | Baseline characteristics by groups: - Intervention, HAES class: Age: 19 (2.0); BMI: 23 (3); 71% White - Comparison, basic nutrition class with some HAES content: Age: 19 (1.0); BMI: 24 (6); 60.6% White - Control, traditionally taught basic nutrition class: Age: 23 (6.0); BMI: 25 (6.0); 66% White | Total: n = 149 - Intervention: n = 45, F: n = 34 (76%) - Comparison: n = 66, F: n = 49 (74%) - Control: n = 46, F: n = 32 (68%) | Fall (2012) to spring (2013) semesters | 23-item IES-2 [11] | 1, 4, 8 |
| Taylor et al. (2015) [40] | U.S.A. | CS | Age: 19.23 (1.5) [18 to 25]; BMI: 23.02 (3.69) [17.1 to 48.7]; BMI categories: 26% OW or OB; 74% non-Hispanic White, 12% Hispanic American, 14% others | Total: n = 150 F: n = 127 (85%) M: n = 23 (15%) | NA | 28-item MEQ [34] | 1, 3, 6 |
| Tylka and Homan (2015) [41] | U.S.A. | CS | Age: 19.62 (2.87) [18 to 47]; BMI: F: 22.59 (3.36), M: 23.79 (3.40); 88.5% White American, 5.2% African American, 2.0% Asian American, 1.6% Native American, 1.2% Latina, 1.4% others | Total: n = 406 F: n = 258 (63.5%) M: n = 148 (36.5%) | NA | 21-item IES [10] | 4, 7 |
| Anderson et al. (2015) [42] | U.S.A. | CS | Age: 19.3 (1.3) [18 to 24]; BMI: 23 (4) [13.3 to 36.0]; 65.4% White, 13.7% African American, 12.4% Asian, 8.5% others | Total: n = 125 F: n = 94 (64.4%) M: n = 31 (35.6%) | NA | 21-item IES [10] and 28-item MEQ [34] | 1, 2 |
| Bryan (2016) [43] | U.S.A. | QE | Age: [18 to 24]; 35% African American, 29% White, 22% Latino/Hispanic, 2% Native Hawaiian or Pacific Islander, 10% others | Total: n = 37 F: n = 22 (59.5%) M: n = 16 (40.5%) | Nutrition course: 50 min meetings, 3 times/week for 3 months and 20 days | 28-item MEQ [34] | 1 |
| Ellis et al. (2016) [44] | U.S.A. and U.K. | CS | Age: 19.75 (1.99) [16 to 25]; BMI: 23.95 (4.66); BMI categories: 1.2% UW, 68.6% NW, 21.9% OW, 8.3% OB; 96.6% White, 2.3% Black, 1.1% Asian | Total: n = 170 F: n = 121 (71.2%) M: n = 49 (28.8%) | NA | 21-item IES [10] | 1, 3 |
| Kelly and Stephen (2016) [45] | Canada | CS | Age: 19.7 (1.93); BMI: 22.62 (3.41); 50% White, 21% East Asian, 1.6% Southeast Asian, 4.8% Black/African, 9.7% South Asian, 1.6% Middle Eastern, 1.6% West Indian/Caribbean, 1.6% Aboriginal, 8.1% unknown | Total: n = 92 females | NA | 23-item IES-2 [11] | 1, 4, 6, 8 |
| Webb and Hardin (2016) [46] | U.S.A. | CS | Age: 19.4 (1.5) [18 to 27]; BMI: 23.5 (4.9); BMI categories: 17.9% OW and 8.8% OB; 62% White/European American, 21% Black/African American, 4% Asian or Asian American, 6% Hispanic/Latina, <1% American Indian/Alaska Native, 7% others | Total: n = 333 females | NA | 23-item IES-2 [11] | 3, 4, 6 |
| Bas et al. (2017) [47] | Turkey | CS | Age: 21.1 (3.2) [19 to 31]; BMI: F: 22.5 (3.6) [17.1 to 29.4], M: 23.9 (3.5) [17.2 to 31.5]; BMI categories: 8.2% UW, 69% NW, 18.6% OW, 4.2% OB | Total: n = 377 F: n = 215 (57%) M: n = 162 (43%) | NA | 23-item IES-2 [11] | 1, 3, 4 |
| Meadwos et al. (2017) [48] | U.K. | CS | Age: 18.7 (1.3) [17 to 36]; BMI: 22.0 (3.9) [14.0 to 44.5]; BMI categories: 10.2% UW, 55.6% NW, 9.9% OW, 2.7% OB, 21.6% not available; 76% White; 3% Asian—Chinese, 6% Asian—Indian, 3% Asian—Pakistani, 2% Asian—Other, 2% Black—African, 1% Black—Caribbean, 1% White/Black Caribbean, 2% White/Asian, 1% Other—Mixed, 1% Other, and 2% declined to answer. | Total: n = 658 F: n = 592 (90%) M: n = 59 (9%) Not answered: n = 7 (1%) | NA | 21-item IES [10] | 1, 4, 8 |
| Bourdier et al. (2018) [49] | France | CS | Age: 21.08 (2.77) [15 to 30], BMI: 21.84 (3.56) [13.79; 43.29] | Total: n = 1051 F: n = 802 (76.3%) M: n = 249 (23.7%) | NA | Emotional Eating subscale of the 23-item IES-2 [11] | 1, 3, 8 |
| Loughran et al. (2018) [50] | U.S.A. | RCT | Age: 18 (70%); 90% White | Total: n = 146 F: n = 124 (85%) M: n = 22 (15%) Intervention: n = 99 Control: n = 47 | Five weeks long, at a rate of two per week | 23-item IES-2 [11] | 1, 8 |
| Mantzios and Egan (2018) [51] | U.K. | CS | Age: 24.4 (9.7), BMI: 24.7 (5.4) | Total: n = 152 F: n = 134 (88.2%) M: n = 18 (11.8%) | NA | MES [36] | 1, 5, 6 |
| Mantzios et al. (2018) [52] | U.K. | CS | Age: 21 (5.1); BMI: 24.8 (5.5); 72% White, 7.7% Pakistani, 6.1% Black, 6.1% mixed, 3.4% Indian, 1.5% Bangladeshi, 1.5% Chinese, 0.8% Arab | Total: n = 257 F: n = 241 (94.5%) M: n = 16 (5.5%) | NA | MES [36] | 1, 5, 6 |
| Mantzios et al. (2018) [53] | U.K. | CS | Age: 21.2 (5.6); BMI: 24.7 (5.5); 66.9% White European, 2.2% South Asian, 7.0% Black, 6.9% Chinese, 4.6% others, 12.4% not disclosed | Total: n = 546 F: n = 263 (48.2%) M: n = 283 (51.8%) | NA | MES [36] | 1, 2, 5, 6 |
| Romano et al. (2018) [54] | U.S.A. | CS | Age: 24.4 (6.1); BMI: 24.3 (5.0); 77.3% White | Total: n = 902 F: n = 613 (68%) M: n = 289 (32%) | NA | 23-item IES-2 [11] | 1 |
| Saunders et al. (2018) [55] | U.S.A. | CS | Age: 21.35 (3.83) [18 to 53]; BMI: 24.66 (4.93); BMI categories: 2.3% UW; 60.4% NW, 25.5% OW, 11.8% OB; 37.6% Cuban, 20.7% South American, 8.2% Central American, 4.0% Dominican, 3.6% Puerto Rican, 1.8% Mexican | Total: n = 482 F: n = 371 (77%) M: n = 11 (23%) | NA | 23-item IES-2 [11] | 1, 2, 3, 4 |
| Webb et al. (2018) [56] | U.S.A. | CS | Age: 19.4 (1.5); BMI: 23.5 (4.9); BMI categories: 26.8% OW or OB; 62% White/European American, 21% Black/African American, 4% Asian or Asian American, 6% Hispanic or Latina, <1% American Indian/Alaska Native, 7% others | Total: n = 333 females | NA | 28-item MEQ [35] | 4, 8 |
| Barad et al. (2019) [57] | U.S.A. | CS | Age, median (P25; P75): 20 (19; 21) [18; 29]; BMI, median (P25; P75): 22.7 (20.5; 25.1) | Total: n = 293 F: n = 221 (75.4%) M: n = 72 (24.6%) | NA | 23-item IES-2 [11] | 2, 3 |
| Craven and Fekete (2019) [58] | U.S.A. | CS | Age: 20.10 (3.10), BMI: 27.63 (6.83); 83.7% White, 7.7% Black, 4.1% Asian, 6.1% others | Total: n = 196 | NA | 23-item IES-2 [11] | 1, 4 |
| Lyzwinski et al. (2019) [59] | Australia | RCT | Total sample: Age: 20.19 [18 to 24]; BMI: 25.91 (4.74) [21 to 43] - Intervention Group (Mindfulness App): Age: 20.16; BMI: 26.09 (4.8); 77% White - Control Group (E-Behavioral Self-Monitoring Diary): Age: 20.22; BMI: 25.73 (4.75); 71% White | Total: n = 90 F: n = 60 (67%) M: n = 30 (23%) - Intervention Group (Mindfulness App): n = 45 - Control Group (E-Behavioral Self-Monitoring Diary): n = 45 | 11 weeks | 28-item MEQ [34] | 1, 3, 5, 7, 8 |
| Miller et al. (2019) [60] | Canada | CS | Age: 19.7 (1.93) [17 to 25]; 50% White, 21% East Asian, 1.6% Southeast Asian, 4% Black/African, 9.7% South Asian, 1.6% Middle Eastern, 1.6% West Indian/Caribbean, 1.6% Aboriginal, 8.1% unknown | Total: n = 92 females | NA | 23-item IES-2 [11] | 1, 3, 4 |
| Román and Urbán (2019) [61] | Hungary | CS | Age: 21.2 (2.58) [18 to 40]; BMI: 21.9 (3.2); BMI categories: 9.3% UW, 72.8% NW, 17.9% OW, 17.9% OB | Total: n = 323 F: n = 260 (80.5%) M: n = 54 (16.7%) Missing: n = 9 (2.8%) | NA | 28-item MEQ [34] | 1, 3, 5, 8 |
| Burnette and Mazzeo (2020) [62] | U.S.A. | Randomized uncontrolled pilot trial | Total: Age: 20.11 (1.99); 45.1% White - Group (eight weekly 1.5 h sessions): Age: 20.20 (1.83); 45.0% White - GSH (guided self-help for IE + eight weekly 20 min phone calls with coach): Age: 20.00 (2.21); 45.2% White | Total: n = 71 females - Group (eight weekly 1.5 h sessions): n = 40 - GSH (guided self-help for IE + eight weekly 20 min phone calls with coach): n = 31 | 16 weeks: 0 (pre-test), 8 (post-test), and 16 weeks (follow-up) | 23-item IES-2 [11] | 1, 4, 8 |
| Gan and Yeoh (2020) [63] | Malasya | CS | Age: 20.9 (1.4) [18 to 25]; BMI: 21.5 (3.22); 35.4% Malay, 61.9% Chinese, 2.7% Indian | Total: n = 333 F: n = 262 (78.7%) M: n = 71 (21.3%) | NA | 23-item IES-2 [11] | 1, 3, 4, 8 |
| Giannopoulou et al. (2020) [64] | U.K. | CS | Age: 22.48 (0.34); 46.1% studied sport and exercise sciences, 24.4% pharmacy sciences, 29.4% health sciences | Total: n = 221 F: n = 186 (84.2%) M: n = 35 (15.8%) | NA | 28-item MEQ [34] | 1, 8 |
| Kawasaki et al. (2020) [65] | Japan | CS | Age: 20.58 (1.76); BMI: 20.21 (2.124), BMI < 18.5: 18.8% | Total: n = 521 females | NA | 20-item EMES [65] | 1, 4, 5, 8 |
| Keyte et al. (2020) [66] | U.K. | CS | Age: 20.46 (3.25), BMI: 25.00 (7.74); 59.0% White, 24.2% Asian, 16.8% others | Total: n = 211 F: n = 188 (89.1%) M: n = 15 (7.1%) Missing: n = 8 (3.8%) | NA | MEBS [67] | 1, 5, 6 |
| Köse and Çıplak (2020) [68] | Turkey | CS | Age: 21.36 (1.88) [18 to 26], F: 21.01 (1.86), M: 21.55 (1.87); BMI: F: 21.30 (2.69), M: 23.81 (2.67) | Total: n = 400 F: n = 140 (35%) M: n = 260 (65%) | NA | Turkish version of the MEQ [69] | 3 |
| Köse and Çıplak (2020) [70] | Turkey | CS | Age: 21.2 (1.77); BMI: 21.92 (2.99), F: 23.38 (2.64), M: 21.03 (1.62) | Total: n = 368 F: n = 116 (31.5%) M: n = 252 (68.5%) | NA | Turkish version of the MEQ [69] | 3, 8 |
| Wilson et al. (2020) [71] | U.S.A. | RCT | Age: 20.6 (2.9) [18 to 30]; BMI: 23.8 (3.9) [18.34; 41.74]; 23% White, 26% Asian American, 1% Hawaiian/Pacific Islander, 2% African American, 5% Hispanic, 44% others | Total: n = 94 females - Intervention group: n = 41 - Brochure control: n = 53 | Three time points: baseline, post-treatment, and 1-month follow-up | 27-item IES [23] | 1, 2, 4, 8 |
| Kawasaki et al. (2021) [72] | Japan | CS | Age, median (P25; P75): 20 (19; 21); BMI, median (P25; P75): 20.1 (18.9 to 21.2); BMI categories: lean: 19.1%; normal: 80.9% | Total: n = 215 females | NA | EMES [65] | 1, 2, 3 |
| Kes and Can Cicek (2021) [73] | Turkey | CS | Age: 24.6% 18 to 20 y, 75.4% 21 to 25 y; BMI categories: 80.4% UW or NW, 18% OW, 1.6% OB. | Total: n = 800 F: n = 434 (54.25%) M: n = 366 (45.75%) | NA | Turkish version of the MEQ [69] | 2, 3, 7 |
| Layman et al. (2021) [74] | U.S.A. | CS | Age: 19.93 (1.45); 79.2% White/European American, 20.8% others | Total: n = 168 F: n = 119 (70.8%) M: n = 49 (29.2%) | NA | 21-item IES [10] | 4 |
| Lopez et al. (2021) [75] | U.S.A. | CS | Age: 92% 18 to 24 y, 8% 25 y or more; 35% Asian, 24% White, 23% Hispanic, 11% Black, 6% others | Total: n = 758 F: n = 335 (44%) M: n = 423 (55%) | NA | 23-item IES-2 [11] | 1, 2 |
| Önen and Sandikçi (2021) [76] | Turkey | CS | Age: 59.4% 18 to 21 y, 31.3% 22 to 25 y, 9.3% 26 y or above; BMI categories: 14.7% UW, 70.2% NW, 15.1% OW/OB | Total: n = 463 F: n = 295 (63.7%) M: n = 168 (36.3%) | NA | Turkish version of the MEQ [69] | 8 |
| Rodgers et al. (2021) [77] | U.S.A. | CS | Age: 19.84 (1.93) [18 to 25]; BMI: 22.74 (3.39); 30% health-related major; 20% natural sciences; 23% business or political science; 17% engineering, computing, or data sciences; 7% humanities; remainder: undeclared | Total: n = 605 F: n = 490 (81%) M: n = 115 (19%) | NA | 23-item IES-2 [11] | 1 |
| Román et al. (2021) [78] | Hungary | CS | Age: 22.7 (4.81) | Total: n = 732 F: n = 587 (80.2%) M: n = 145 (19.8%) | NA | 23-item IES-2 [11] and MES [34] | 1, 3, 4 |
| Ahlich and Rancourt (2022) [79] | U.S.A. | CS | Age: 21.12 (4.88); BMI: 24.51 (5.64); 62.8% White, 13.2% Asian, 9.8% Black or African American, 1.7% Arab or Middle Eastern, 0.4% American Indian/Alaskan Native, 11.3% others | Total: n = 461 Cisgender females: n = 244 (52.9%) Cisgender males: n = 209 (45.3%) Non-binary or transgender: n = 8 (1.7%) | NA | Reliance on Hunger and Satiety Cues subscale of the 23-item IES-2 [11] | 1, 8 |
| Belon et al. (2022) [80] | U.S.A. | CS | Age: 20 (3.2) [18 to 38]; BMI: 23.8 (4.9) [16.1 to 47.2]; BMI categories: 6% UW, 67% NW, 16% OW, 11% OB; 64% White; 44% Not Hispanic, Latina, or Spanish origin; 36% Other Hispanic, Latina, or Spanish origin; 23% Other; 20% Mexican, Mexican American, or Chicana; 8% American Indian/Alaskan Native; 4% Black/African American; 4% Unavailable/Unknown; 3% Asian | Total: n = 352 females | NA | 23-item IES-2 [11] | 1, 2, 4, 8 |
| Cebioğlu et al. (2022) [81] | Turkey | CS | Age: 21.5 (2.2) [18 to 50]; BMI: 22.5 (3.8) [15.2 to 45.7], 20.2% BMI ≥ 25 | Total: n = 2133 F: n = 1214 (56.9%) M: n = 919 (43.1%) | NA | Turkish version of the MEQ [69] | 1, 3 |
| Chiodo et al. (2022) [16] | U.S.A. and Italy | CS | Age: 21.79 (4.75); 29.5% non-Hispanic White American, 17.1% Hispanic American, 11.1% other Americans, 30.6% Italian, 11.7% others in Italy + missing | Total: n = 677 F: n = 466 (68.8%) M: n = 145 (21.4%) Missing: n = 66 (9.8%) Italian: n = 244 (36%) American: n = 433 (64%) | NA | 20-item MEQ [82] | 1, 4 |
| Katcher et al. (2022) [83] | U.S.A. | RCT | Age: 20.9 (1.9) [18 to 26]; BMI: 26.4 (6.0) [19.9 to 41.6] | Total = 14 females Treatment group: n = 7 Waitlist control group: n = 7 | Intervention period: five weeks Maintenance period: five weeks | 23-item IES-2 [11] | 1, 4 |
| Lovan et al. (2022) [84] | U.S.A. | RCT | Age: 19.8 (1.43) [18 to 24]; BMI categories: 3% UW, 63.6% NW, 24.2% OW, 9.1% OB; 75.8% White, 18.2% African American, 4.5% Asian, 1.5% Native American | Total: n = 60 F: n = 36 (62.1%) M: n = 24 (37.9%) | Two visits, one week apart | 23-item IES-2 [11] | 1, 2, 3, 8 |
| Lovan et al. (2022) [85] | U.S.A. | CS | Age: 19.8 (1.4); BMI: 24.4 (4.6), BMI categories: 3.0% UW, 63.6% NW, 24.2% OW, 9.1% OB; 5.8% White, 18.2% Black or African American, 4.5% Asian, 1.5% American Indian, 74.2% Hispanic | Total: n = 66 F: n = 41 (62.1%) M: n = 25 (37.8%) | NA | 23-item IES-2 [11] | 1, 3, 4 |
| Mackenzie et al. (2022) [86] | Australia | Randomized quantitative crossover | Age, mean (SD): 25.25 (8.2), range: 18 to 49 y; BMI, mean (SD): 24.7 (4.9) | Total: n = 55 F: n = 41 (75%) M: n = 14 (25%) | One week | 20-item MEQ [82] | 2 |
| Romano and Heron (2022) [87] | U.S.A. | CS | Age: 22.27 (5.83); BMI: 25.83 (6.15); 37.79% African American or Black; 0.57% American Indian and Alaska Native; 5.05% Asian, Asian American, Native Hawaiian, or Pacific Islander; 41.21% European American/White; 15.40% other | Total: n = 1.228 F: n = 931 (75.81%) M: n = 292 (23.78%) | NA | 23-item IES-2 [11] | 4, 7, 8 |
| Shaw and Cassidy (2022) [88] | North Ireland | CS | Age: 22.04 (2.72) [18 to 30]; BMI: 25.5 (4.69); BMI categories: 11.4% UW, 41.3% NW, 35.0% OW, 2.3% OB | Total: n = 349 F: n = 244 (70%) M: n = 105 (30%) | NA | MEBS [67] | 1, 3, 6, 8 |
| Vrabec et al. (2022) [89] | U.S.A. | CS | Age: 19.47 (1.75) [18 to 25]; 60.2% White, 21.8% Asian or Asian American, 10.5% Black or African American, 9.4% Hispanic, 1.6% American Indian or Alaskan, 6.2% others | Total: n = 372 F: n = 238 (64%) M: n = 134 (36%) | NA | 21-item IES [10] | 1, 8 |
| Akik and Yiğit (2022) [90] | Turkey | CS | Age: 20.82 (3.83) [18 to 27]; BMI: 22.49 (3.89) | Total: n = 362 F: n = 249 (68.8%) M: n = 110 (30.4%) Sex as “other”: n = 3 (0.8%) | NA | 20-item MEQ [82] | 1, 8 |
| Cetin (2023) [91] | Turkey | CS | Age by Chronotype groups: Morning: 21.34 (2.12), Intermediate: 21.01 (1.83), Evening: 21.20 (1.70); Obesity by Chronotype groups: Morning: n = 2 (2.3%), Intermediate: n = 16 (4.0%), Evening: n = 6 (5.3%) | Total: n = 507 F: n = 370 (61.2%) M: n = 235 (38.8%) | NA | Awareness and Recognition sub-scales of the Turkish version of the 15-item MEQ [84] | 1, 2, 8 |
| Fırat and Cicek (2023) [92] | Turkey | CS | Age: 20.81 (1.85) [18 to 38] | Total: n = 1708 F: n = 899 (52.6%) M: n = 809 (47.4%) | NA | Turkish version of the IES-2 [47] | 3 |
| Loor et al. (2023) [93] | U.S.A. | CS | Age: 24.32 (8.41) [18 to 57]; BMI: 26.28 (6.98); BMI categories: 4.9% UW, 45.1% NW, 30.4% OW, 19.6% OB; 46.2% Hispanic, 42.3% non-Hispanic White, 5.8% Asian, 2.9% Black/African American, 1.9% American Indian/Alaska Native, and 1.0% other | Total: n = 104 F: n = 91 (87.5%) M: n = 13 (22.5%) | NA | 23-item IES-2 [11] | 1, 8 |
| Loor et al. (2023) [94] | U.S.A. | CS | Age: 24.25 (8.38); BMI: 26.20 (6.94); 46.0% Hispanic, 41.0% non-Hispanic White, 9% Asian, 4% Black/African American, 3.0% American Indian/Alaska Native, and 2.0% other | Total: n = 100 F: n = 86 (86%) M: n = 11 (11%) Gender variant/non-conforming: n = 2 (2%) | NA | 23-item IES-2 [11] | 1, 8 |
| Schueler et al. (2023) [95] | U.S.A. | CS | Age: 70.9% 18 to 19 y; BMI: 24.4 (4.6); 27.8% Hispanic or Latino, 70.9% not Hispanic or Latino, 1.3% did not say | Total: n = 298 F: n = 173 (58%) M: n = 125 (42%) | NA | 23-item IES-2 [11] and MEBS [67] | 1, 2 |
| Yang et al. (2023) [96] | China | CS | Age: 21.12 (1.48); BMI: 20.49 (2.69); 97.3% Han, 2.7% other | Total: n = 702 F: n = 319 (45.44%) M: n = 383 (54.56%) | NA | 23-item IES-2 [11] | 1, 8 |
| Yoon et al. (2023) [97] | U.S.A. | CS | Age: 20.9 (2.6); 15.1% non-Hispanic White, 14.1% non-Hispanic Black or African American, 33.2% Hispanic, 35.0% non-Hispanic Asian, and 2.7% others | Total: n = 887 F: n = 481 (54.2%) M: n = 406 (45.8%) | NA | Reliance on Hunger and Satiety Cues subscale (version adapted) of the 23-item IES-2 [11] | 1, 4 |
| Yoon et al. (2023) [98] | U.S.A. | CS | Age: 20.9 (2.7); 15.7% non-Hispanic White, 13.3% non-Hispanic Black or African American, 32.7% Hispanic, 35.6% non-Hispanic Asian, and 2.7% others | Total: n = 828 F: n = 451 (54.5%) M: n = 377 (45.5%) | NA | Reliance on Hunger and Satiety Cues subscale (version adapted) of the 23-item IES-2 [11] | 1, 4 |
| Instruments | n (%) of Studies * |
|---|---|
| Intuitive Eating | 51 (100%) |
| 30-item Intuitive Eating Scale [23] | 2 (3.9%) |
| 27-item Intuitive Eating Scale [23] | 3 (5.9%) |
| 21-item Intuitive Eating Scale [10] | 16 (31.4%) |
| Intuitive Eating Scale 2 [11] | 29 (56.9%) |
| Turkish version of the IES-2 [47] | 1 (1.9%) |
| Mindful Eating | 27 (100%) |
| 28-item Mindful Eating Questionnaire [34] | 8 (29.7%) |
| Mindful Eating Scale [36] | 5 (18.5%) |
| Turkish version of the 30-item Mindful Eating Questionnaire [69] | 5 (18.5%) |
| 20-item Mindful Eating Questionnaire [82] | 3 (11.1%) |
| Mindful Eating Behavior Scale [67] | 3 (11.1%) |
| Expanded Mindful Eating Scale [65] | 2 (7.4%) |
| Turkish version of the 15-item Mindful Eating Questionnaire [84] | 1 (3.7%) |
Disclaimer/Publisher’s Note: The statements, opinions and data contained in all publications are solely those of the individual author(s) and contributor(s) and not of MDPI and/or the editor(s). MDPI and/or the editor(s) disclaim responsibility for any injury to people or property resulting from any ideas, methods, instructions or products referred to in the content. |
© 2024 by the authors. Licensee MDPI, Basel, Switzerland. This article is an open access article distributed under the terms and conditions of the Creative Commons Attribution (CC BY) license (https://creativecommons.org/licenses/by/4.0/).
Share and Cite
Rezende, F.; Oliveira, B.M.P.M.; Poínhos, R. Assessment of Intuitive Eating and Mindful Eating among Higher Education Students: A Systematic Review. Healthcare 2024, 12, 572. https://doi.org/10.3390/healthcare12050572
Rezende F, Oliveira BMPM, Poínhos R. Assessment of Intuitive Eating and Mindful Eating among Higher Education Students: A Systematic Review. Healthcare. 2024; 12(5):572. https://doi.org/10.3390/healthcare12050572
Chicago/Turabian StyleRezende, Fabiane, Bruno M. P. M. Oliveira, and Rui Poínhos. 2024. "Assessment of Intuitive Eating and Mindful Eating among Higher Education Students: A Systematic Review" Healthcare 12, no. 5: 572. https://doi.org/10.3390/healthcare12050572
APA StyleRezende, F., Oliveira, B. M. P. M., & Poínhos, R. (2024). Assessment of Intuitive Eating and Mindful Eating among Higher Education Students: A Systematic Review. Healthcare, 12(5), 572. https://doi.org/10.3390/healthcare12050572