_MD__MPH_PhD.png)
Prospective Teachers’ Knowledge of Physical Activity in Children and Adolescents


 , , and
Abstract
1. Introduction
2. Materials and Methods
2.1. Participants
2.2. Instruments
2.3. Procedure
2.4. Statistical Analysis
3. Results
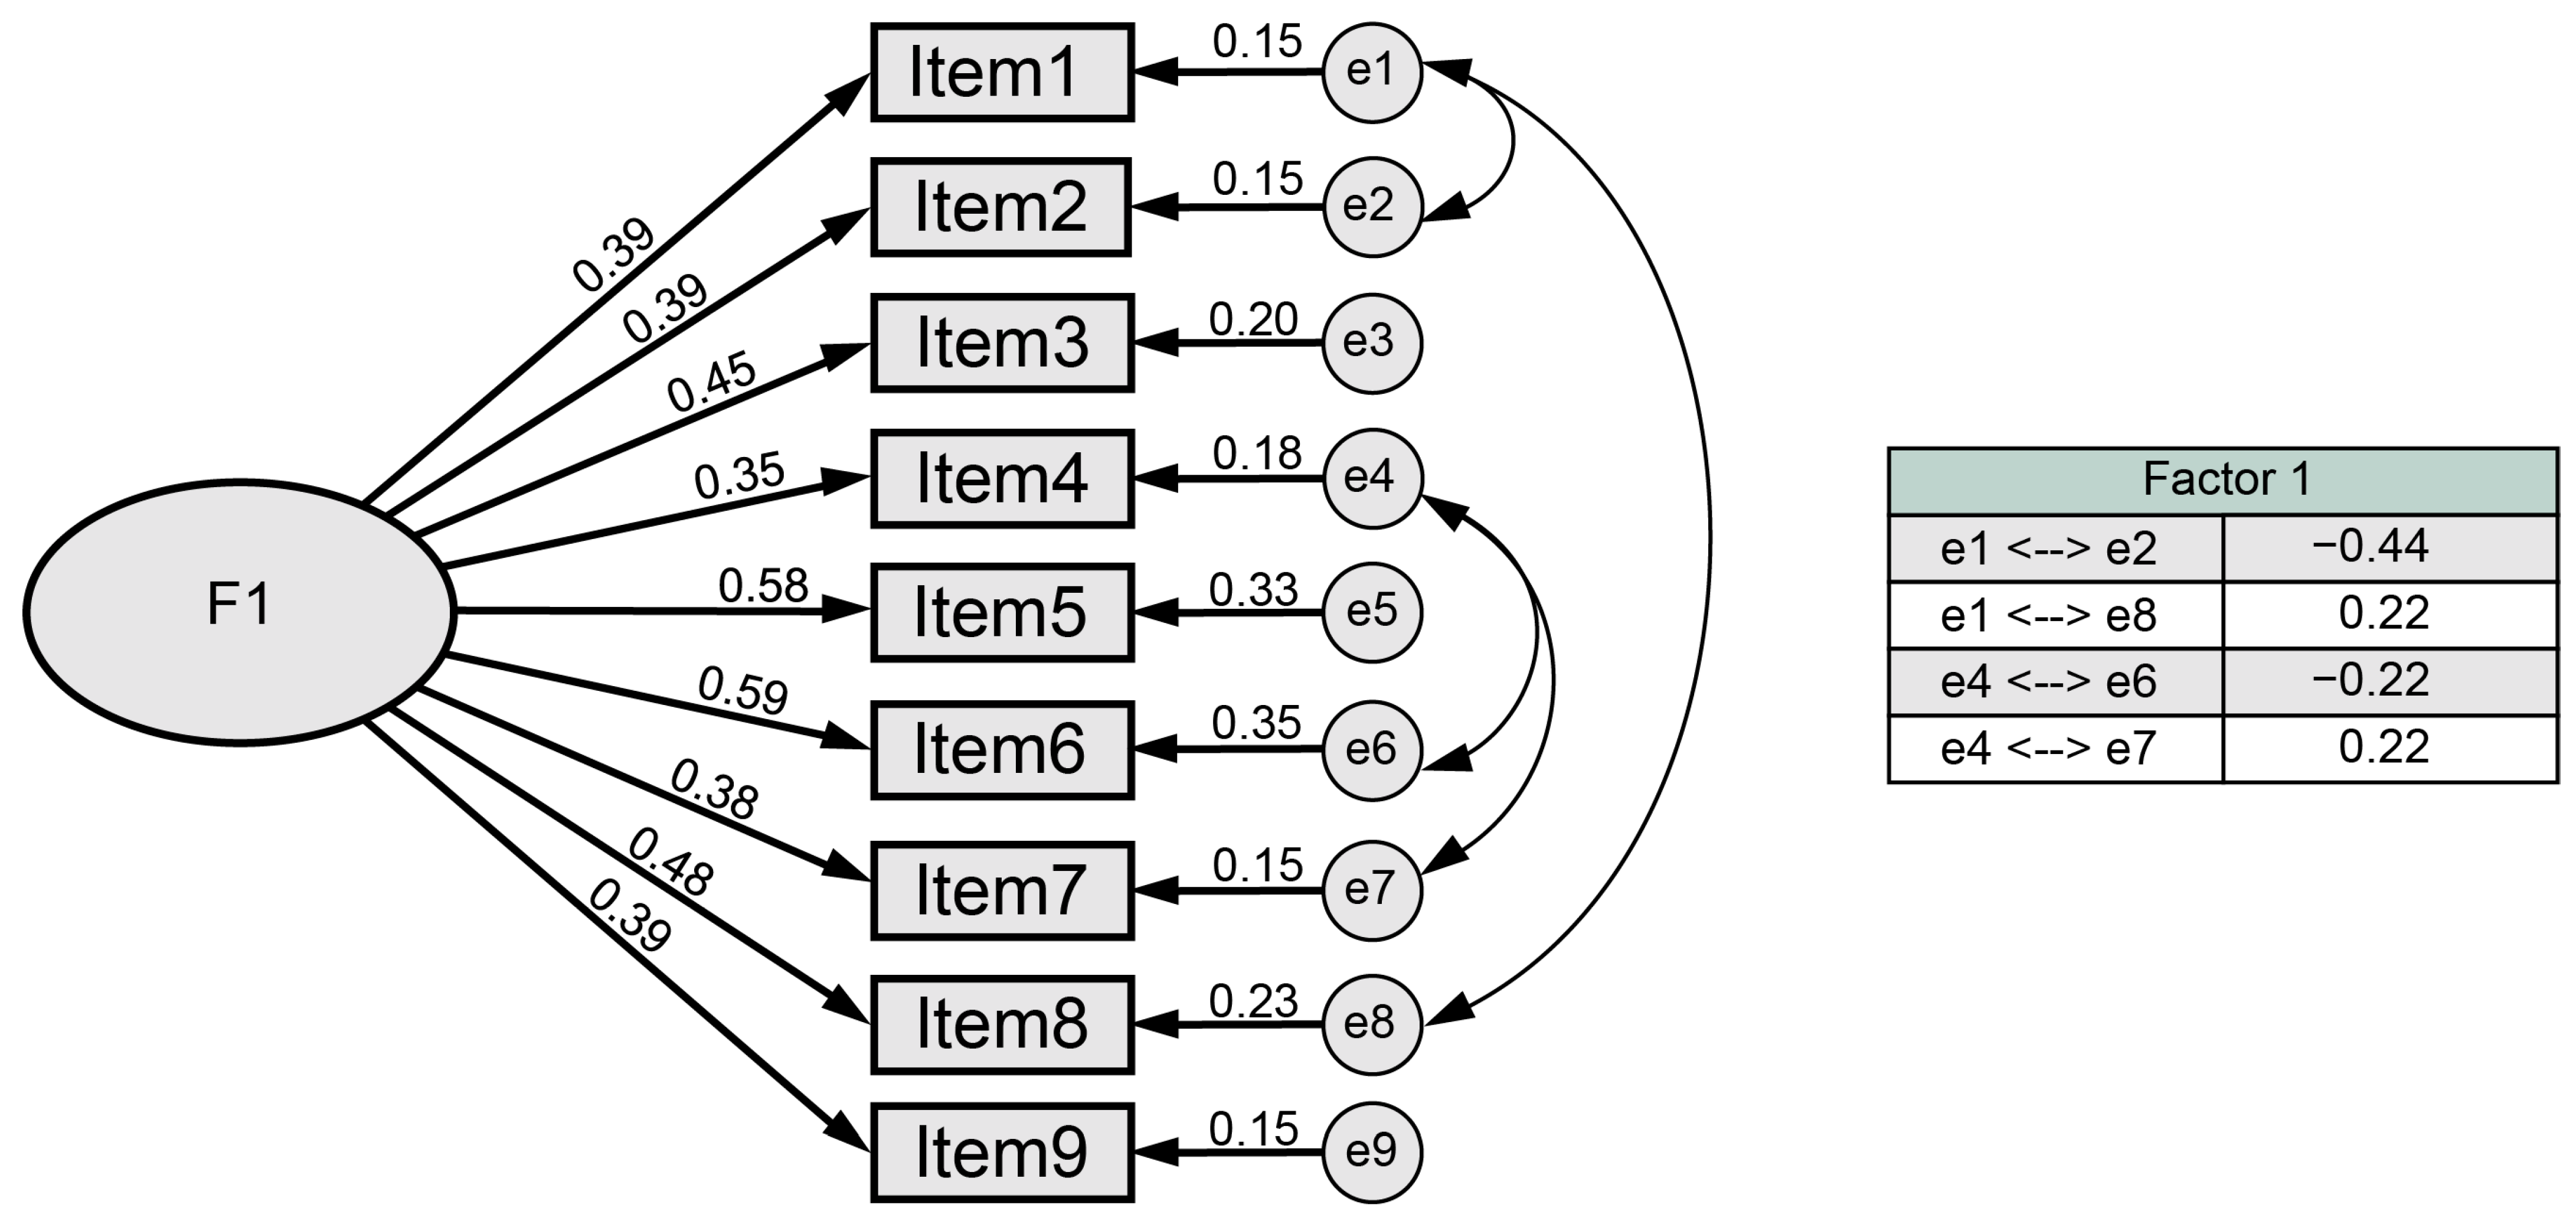
3.1. Exploratory Factor Analysis
3.2. Confirmatory Factor Analysis
3.3. Descriptive Results
4. Discussion
Limitations and Future Lines of Research
5. Conclusions
Author Contributions
Funding
Institutional Review Board Statement
Informed Consent Statement
Data Availability Statement
Acknowledgments
Conflicts of Interest
Appendix A

| Items | Strongly Agree | Disagree | Don’t Know | |
|---|---|---|---|---|
| 1 | “Children from 5 to 17 years old should do vigorous activities (those that involve effort) at most 3 times a week (playing soccer, basketball, swimming...)” | |||
| 2 | “Children from 5 to 17 years of age should do activities that involve bone strain (PA being understood as that which aims to increase strength at certain points of the bones of the locomotor apparatus), for example, running, jumping, swimming or lifting weights.” | |||
| 3 | “In children aged 5 to 17 years, doing more than 1 h of PA every day (such as brisk walking, cycling, swimming...) can be detrimental to their health.” | |||
| 4 | “According to WHO in children and young people, PA is considered to be: playing, sports, travel, recreational activities, PA or scheduled exercises (with family, at school or in their daily life).” | |||
| 5 | “In children aged 5 to 17 years, doing more than one hour a day of PA (such as brisk walking, cycling, swimming) can be beneficial to their health.” | |||
| 6 | “Children aged 5 to 17 years should do at least 1 h a day of PA (such as brisk walking, cycling, swimming...) every day.” | |||
| 7 | “According to WHO, PA in children and young people is considered to be only: sports, physical education (PE) or scheduled exercise (with family, at school or in their daily life).” | |||
| 8 | “Children aged 5 to 17 years should do no more than 1 h a day of PA (brisk walking, cycling, swimming...).” | |||
| 9 | “Children aged 5 to 17 years should do vigorous activities (those involving an effort of 7–8 out of 10 on a scale of 0 to 10) at least 3 times a week (playing soccer, basketball, swimming).” |
| Items | 1 | 2 | 3 | 4 | 5 | 6 | 7 | 8 | 9 |
|---|---|---|---|---|---|---|---|---|---|
| 1 | 1.00 | ||||||||
| 2 | −0.04 | 1.00 | |||||||
| 3 | 0.28 | 0.05 | 1.00 | ||||||
| 4 | 0.22 | 0.41 | 0.26 | 1.00 | |||||
| 5 | 0.25 | 0.43 | 0.44 | 0.29 | 1.00 | ||||
| 6 | 0.24 | 0.33 | 0.36 | 0.06 | 0.59 | 1.00 | |||
| 7 | 0.40 | 0.10 | 0.28 | 0.47 | 0.22 | 0.26 | 1.00 | ||
| 8 | 0.48 | 0.14 | 0.39 | 0.14 | 0.43 | 0.35 | 0.30 | 1.00 | |
| 9 | 0.17 | 0.38 | 0.13 | 0.21 | 0.36 | 0.30 | 0.10 | 0.19 | 1.00 |
References
- World Health Organization. Physical Activity. Available online: https://www.who.int/news-room/fact-sheets/detail/physical-activity (accessed on 19 June 2023).
- Vidarte Claros, J.A.; Vélez Álvarez, C.; Sandoval Cuellar, C.; Alfonso Mora, M.L. Actividad Física: Estrategia de Promoción de La Salud. Hacia Promoción Salud 2011, 16, 202–218. [Google Scholar]
- Devís, J.; Peiró, C. Actividad Física, Deporte y Salud; Inde: Barcelona, Spain, 2000; ISBN 84-95114-09-7. [Google Scholar]
- World Health Organization. Constitution of the World Health Organization. Am. J. Public Health 1946, 36, 1315–1323. [Google Scholar] [CrossRef] [PubMed]
- Organización Mundial de la Salud. Informe Mundial Sobre el Envejecimiento y la Salud; Organización Mundial de la Salud: Ginebra, Colombia, 2015; ISBN 978-92-4-356504-0. [Google Scholar]
- Caspersen, C.J.; Powell, K.E.; Christenson, G.M. Physical Activity, Exercise, and Physical Fitness: Definitions and Distinctions for Health-Related Research. Public Health Rep. 1985, 100, 126–131. [Google Scholar] [PubMed]
- Pérez, B.M. Salud: Entre la actividad física y el sedentarismo. An. Venez. Nutr. 2014, 27, 119–128. [Google Scholar]
- Hallal, P.C.; Andersen, L.B.; Bull, F.C.; Guthold, R.; Haskell, W.; Ekelund, U. Global Physical Activity Levels: Surveillance Progress, Pitfalls, and Prospects. Lancet 2012, 380, 247–257. [Google Scholar] [PubMed]
- World Health Organization. WHO Guidelines on Physical Activity and Sedentary Behaviour; World Health Organization: Geneva, Switzerland, 2020; ISBN 978-92-4-001512-8. [Google Scholar]
- Nelson, M.C.; Story, M.; Larson, N.I.; Neumark-Sztainer, D.; Lytle, L.A. Emerging Adulthood and College-Aged Youth: An Overlooked Age for Weight-Related Behavior Change. Obesity 2008, 16, 2205–2211. [Google Scholar] [CrossRef]
- Guthold, R.; Stevens, G.A.; Riley, L.M.; Bull, F.C. Worldwide Trends in Insufficient Physical Activity from 2001 to 2016: A Pooled Analysis of 358 Population-Based Surveys with 1·9 Million Participants. Lancet Glob. Health 2018, 6, e1077–e1086. [Google Scholar] [CrossRef]
- Arias-Palencia, N.M.; Solera-Martínez, M.; Gracia-Marco, L.; Silva, P.; Martínez-Vizcaíno, V.; Cañete-García-Prieto, J.; Sánchez-López, M. Levels and Patterns of Objectively Assessed Physical Activity and Compliance with Different Public Health Guidelines in University Students. PLoS ONE 2015, 10, e0141977. [Google Scholar] [CrossRef]
- Keating, X.D.; Guan, J.; Piñero, J.C.; Bridges, D.M. A Meta-Analysis of College Students’ Physical Activity Behaviors. J. Am. Coll. Health 2005, 54, 116–126. [Google Scholar] [CrossRef]
- López-Valenciano, A.; Suárez-Iglesias, D.; Sanchez-Lastra, M.A.; Ayán, C. Impact of COVID-19 Pandemic on University Students’ Physical Activity Levels: An Early Systematic Review. Front. Psychol. 2021, 11, 3787. [Google Scholar] [CrossRef]
- Ingram, J.; Maciejewski, G.; Hand, C.J. Changes in Diet, Sleep, and Physical Activity are Associated with Differences in Negative Mood during COVID-19 Lockdown. Front. Psychol. 2020, 11, 588604. [Google Scholar] [CrossRef] [PubMed]
- He, L.; Yang, N.; Xu, L.; Ping, F.; Li, W.; Sun, Q.; Li, Y.; Zhu, H.; Zhang, H. Synchronous Distance Education vs Traditional Education for Health Science Students: A Systematic Review and Meta-Analysis. Med. Educ. 2021, 55, 293–308. [Google Scholar] [CrossRef] [PubMed]
- Pengpid, S.; Peltzer, K.; Kassean, H.K.; Tsala Tsala, J.P.; Sychareun, V.; Müller-Riemenschneider, F. Physical Inactivity and Associated Factors among University Students in 23 Low-, Middle- and High-Income Countries. Int. J. Public Health 2015, 60, 539–549. [Google Scholar] [CrossRef]
- Castro, O.; Bennie, J.; Vergeer, I.; Bosselut, G.; Biddle, S.J.H. How Sedentary Are University Students? A Systematic Review and Meta-Analysis. Prev. Sci. 2020, 21, 332–343. [Google Scholar] [CrossRef]
- Morrow, J.R.; Krzewinski-Malone, J.A.; Jackson, A.W.; Bungum, T.J.; Fitzgerald, S.J. American Adults’ Knowledge of Exercise Recommendations. Res. Q. Exerc. Sport 2004, 75, 231–237. [Google Scholar] [CrossRef] [PubMed]
- World Health Organization. Regional Office for the Eastern Mediterranean Health Education: Theoretical Concepts, Effective Strategies and Core Competencies: A Foundation Document to Guide Capacity Development of Health Educators; World Health Organization: Geneva, Switzerland, 2012. [Google Scholar]
- Ying, C.; Kuay, L.K.; Huey, T.C.; Hock, L.K.; Hamid, H.A.A.; Omar, M.A.; Ahmad, N.A.; Cheong, K.C. Prevalence and Factors Associated with Physical Inactivity among Malaysian Adults. Southeast Asian J. Trop. Med. Public Health 2014, 45, 467–480. [Google Scholar] [PubMed]
- Florindo, A.A.; Guimarães, V.V.; Cesar, C.L.G.; de Azevedo Barros, M.B.; Alves, M.C.G.P.; Goldbaum, M. Epidemiology of Leisure, Transportation, Occupational, and Household Physical Activity: Prevalence and Associated Factors. J. Phys. Act. Health 2009, 6, 625–632. [Google Scholar] [CrossRef]
- Cameron, C.; Craig, C.L.; Bull, F.C.; Bauman, A. Les guides d’activité physique du Canada: Leur publication a t-elle eu un effet? Appl. Physiol. Nutr. Metab. 2007, 32 (Suppl. S2F), S179–S188. [Google Scholar] [CrossRef]
- Plotnikoff, R.C.; Brunet, S.; Courneya, K.S.; Spence, J.C.; Birkett, N.J.; Marcus, B.; Whiteley, J. The Efficacy of Stage-Matched and Standard Public Health Materials for Promoting Physical Activity in the Workplace: The Physical Activity Workplace Study (PAWS). Am. J. Health Promot. 2007, 21, 501–509. [Google Scholar] [CrossRef]
- Loughlan, C.; Mutrie, N. An Evaluation of the Effectiveness of Three Interventions in Promoting Physical Activity in a Sedentary Population. Health Educ. J. 1997, 56, 154–165. [Google Scholar] [CrossRef]
- Vella, S.A.; Cliff, D.P.; Okely, A.D. Socio-Ecological Predictors of Participation and Dropout in Organised Sports during Childhood. Int. J. Behav. Nutr. Phys. Act. 2014, 11, 62. [Google Scholar] [CrossRef]
- Pawlowski, C.S.; Tjørnhøj-Thomsen, T.; Schipperijn, J.; Troelsen, J. Barriers for Recess Physical Activity: A Gender Specific Qualitative Focus Group Exploration. BMC Public Health 2014, 14, 639. [Google Scholar] [CrossRef] [PubMed]
- Pham, V.H.; Wawrzyniak, S.; Cichy, I.; Bronikowski, M.; Rokita, A. BRAINballs Program Improves the Gross Motor Skills of Primary School Pupils in Vietnam. Int. J. Environ. Res. Public Health 2021, 18, 1290. [Google Scholar] [CrossRef] [PubMed]
- Rosenkranz, R.R.; Lubans, D.R.; Peralta, L.R.; Bennie, A.; Sanders, T.; Lonsdale, C. A Cluster-Randomized Controlled Trial of Strategies to Increase Adolescents’ Physical Activity and Motivation during Physical Education Lessons: The Motivating Active Learning in Physical Education (MALP) Trial. BMC Public Health 2012, 12, 834. [Google Scholar] [CrossRef] [PubMed]
- Cheon, S.H.; Reeve, J.; Moon, I.S. Experimentally Based, Longitudinally Designed, Teacher-Focused Intervention to Help Physical Education Teachers Be More Autonomy Supportive toward Their Students. J. Sport Exerc. Psychol. 2012, 34, 365–396. [Google Scholar] [CrossRef] [PubMed]
- Zanchetta, L.M.; Barros, M.B.D.A.; César, C.L.G.; Carandina, L.; Goldbaum, M.; Alves, M.C.G.P. Inatividade Física e Fatores Associados em Adultos, São Paulo, Brasil. Rev. Bras. Epidemiol. 2010, 13, 387–399. [Google Scholar] [CrossRef] [PubMed]
- Treuth, M.S.; Sherwood, N.E.; Baranowski, T.; Butte, N.F.; Jacobs, D.R.; McClanahan, B.; Gao, S.; Rochon, J.; Zhou, A.; Robinson, T.N.; et al. Physical Activity Self-Report and Accelerometry Measures from the Girls Health Enrichment Multi-Site Studies. Prev. Med. 2004, 38, 43–49. [Google Scholar] [CrossRef]
- Bielemann, R.M.; Reichert, F.F.; Paniz, V.M.; Gigante, D.P. Validation of the Netherlands Physical Activity Questionnaire in Brazilian Children. Int. J. Behav. Nutr. Phys. Act. 2011, 8, 45. [Google Scholar] [CrossRef]
- Concha-Cisternas, Y.; Petermann Rocha, F.; Garrido-Méndez, A.; Díaz-Martínez, X.; Leiva, A.M.; Salas-Bravo, C.; Martínez-Sanguinetti, M.A.; Iturra-González, J.A.; Matus, C.; Vásquez Gómez, J.A.; et al. Caracterización de Los Patrones de Actividad Física En Distintos Grupos Etarios Chilenos. Nutr. Hosp. 2018, 36, 149–158. [Google Scholar] [CrossRef]
- Fredriksson, S.V.; Alley, S.J.; Rebar, A.L.; Hayman, M.; Vandelanotte, C.; Schoeppe, S. How are Different Levels of Knowledge about Physical Activity Associated with Physical Activity Behaviour in Australian Adults? PLoS ONE 2018, 13, e0207003. [Google Scholar] [CrossRef]
- World Health Organization. A Guide for Population-Based Approaches to Increasing Levels of Physical Activity: Implementation of the WHO Global Strategy on Diet, Physical Activity and Health; World Health Organization: Geneva, Switzerland, 2007; p. 20. [Google Scholar]
- Moreno-Lavaho, S.M.; Mendoza-Muñoz, M.; Adsuar, J.C.; Carlos-Vivas, J.; Rojo-Ramos, J.; Manzano-Redondo, F.; Pérez-Gómez, J. Validation of a Physical Activity and Health Questionnaire Evaluating Knowledge of WHO Recommendations among Colombians. Int. J. Environ. Res. Public Health 2021, 18, 3526. [Google Scholar] [CrossRef] [PubMed]
- Singh, R.; Mangat, N.S. Simple Random Sampling. In Elements of Survey Sampling; Singh, R., Mangat, N.S., Eds.; Kluwer Texts in the Mathematical Sciences; Springer: Dordrecht, The Netherlands, 1996; pp. 30–66. ISBN 978-94-017-1404-4. [Google Scholar]
- Barnett, T.A.; Gauvin, L.; Craig, C.L.; Katzmarzyk, P.T. Distinct Trajectories of Leisure Time Physical Activity and Predictors of Trajectory Class Membership: A 22 Year Cohort Study. Int. J. Behav. Nutr. Phys. Act. 2008, 5, 57. [Google Scholar] [CrossRef] [PubMed]
- Maldonado Pinto, J.E. Metodología de la Investigación Social: Paradigmas: Cuantitativo, Sociocrítico, Cualitativo, Complementario; Ediciones de la U: Bogotá, Colombia, 2018; ISBN 978-958-762-861-6. [Google Scholar]
- Asociación Médica Mundial Helsinki. Declaration of the World Medical Association: Ethical Principles for Medical Research Involving Human Subjects. Ann. Sist. Sanit. Navar. 2009, 24, 209–212. [Google Scholar] [CrossRef]
- Ferrando, P.J.; Lorenzo-Seva, U. Program FACTOR at 10: Origins, Development and Future Directions. Psicothema 2017, 29, 236–240. [Google Scholar] [CrossRef] [PubMed]
- Lorenzo-Seva, U.; Ferrando, P.J. Robust Promin: A Method for Diagonally Weighted Factor Rotation. Liberabit 2019, 25, 99–106. [Google Scholar] [CrossRef]
- Holgado-Tello, F.P.; Chacón-Moscoso, S.; Barbero-García, I.; Vila-Abad, E. Polychoric versus Pearson Correlations in Exploratory and Confirmatory Factor Analysis of Ordinal Variables. Qual. Quant. 2010, 44, 153–166. [Google Scholar]
- Hayton, J.C.; Allen, D.G.; Scarpello, V. Factor Retention Decisions in Exploratory Factor Analysis: A Tutorial on Parallel Analysis. Organ. Res. Methods 2004, 7, 191–205. [Google Scholar]
- Beavers, A.S.; Lounsbury, J.W.; Richards, J.K.; Huck, S.W.; Skolits, G.J.; Esquivel, S.L. Practical Considerations for Using Exploratory Factor Analysis in Educational Research. Pract. Assess. Res. Eval. 2013, 18, 6. [Google Scholar] [CrossRef]
- Hair, J.F., Jr.; Black, W.C.; Babin, B.J.; Anderson, R.E. Multivariate Data Analysis, 7th ed.; Hair, J.F., Ed.; Prentice Hall: Upper Saddle River, NJ, USA, 2010; ISBN 978-0-13-813263-7. [Google Scholar]
- Tabachnick, B.G.; Fidell, L.S.; Ullman, J.B. Using Multivariate Statistics, 7th ed.; Pearson: New York, NY, USA, 2019; ISBN 978-0-13-479054-1. [Google Scholar]
- Kenny, D.A.; Kaniskan, B.; McCoach, D.B. The Performance of RMSEA in Models with Small Degrees of Freedom. Sociol. Methods Res. 2015, 44, 486–507. [Google Scholar]
- Shi, D.; Maydeu-Olivares, A.; Rosseel, Y. Assessing Fit in Ordinal Factor Analysis Models: SRMR vs. RMSEA. Struct. Equ. Model. Multidiscip. J. 2020, 27, 1–15. [Google Scholar] [CrossRef]
- Xia, Y.; Yang, Y. RMSEA, CFI, and TLI in Structural Equation Modeling with Ordered Categorical Data: The Story They Tell Depends on the Estimation Methods. Behav. Res. 2019, 51, 409–428. [Google Scholar] [CrossRef] [PubMed]
- Bentler, P.M. Comparative Fit Indexes in Structural Models. Psychol. Bull. 1990, 107, 238–246. [Google Scholar] [CrossRef] [PubMed]
- Witkov, C.; Zengel, K. Chi-Squared Data Analysis and Model Testing for Beginners, 1st ed.; Oxford University Press: Oxford, UK; New York, NY, USA, 2019; ISBN 978-0-19-884714-4. [Google Scholar]
- Schumacker, R.E.; Lomax, R.G. A Beginner’s Guide to Structural Equation Modeling, 4th ed.; Routledge: New York, NY, USA, 2016; ISBN 978-1-138-81190-4. [Google Scholar]
- Nunnally, J.C.; Bernstein, I.H. Psychometric Theory; McGraw-Hill: New York, NY, USA, 1994. [Google Scholar]
- Briggs, S.R.; Cheek, J.M. The Role of Factor Analysis in the Development and Evaluation of Personality Scales. J. Personal. 1986, 54, 106–148. [Google Scholar] [CrossRef]
- Cliff, N.; Caruso, J.C. Reliable Component Analysis through Maximizing Composite Reliability. Psychol. Methods 1998, 3, 291–308. [Google Scholar] [CrossRef]
- Larsen, R.; Warne, R.T. Estimating Confidence Intervals for Eigenvalues in Exploratory Factor Analysis. Behav. Res. Methods 2010, 42, 871–876. [Google Scholar] [CrossRef] [PubMed]
- Ferrando, P.J.; Lorenzo-Seva, U. A Note on Improving EAP Trait Estimation in Oblique Factor-Analytic and Item Response Theory Models. Psicológica 2016, 37, 235–247. [Google Scholar]
- Gómez Mazorra, M.; Sánchez Oliva, D.; Labisa Palmeira, A. Actividad física en tiempo libre en estudiantes universitarios colombianos. Retos Nuevas Tend. Educ. Física Deporte Recreación 2020, 37, 181–189. [Google Scholar]
- Cuervo, C.; Cachón, J.; González, C.; Zagalaz Sánchez, M.L. Hábitos alimentarios y práctica de actividad física en una muestra de adolescentes de una ciudad del norte de España. J. Sport Health Res. 2017, 9, 75–84. [Google Scholar]
- Villaquiran, A.-F.; Cuero, P.; Ceron, G.-M.; Ordoñez, A.; Jácome, S. Características antropométricas, hábitos nutricionales, actividad física y consumo de alcohol en estudiantes universitarios. Revsal 2020, 52, 109–118. [Google Scholar] [CrossRef]
- Rico-Díaz, J.; Arce-Fernández, C.; Padrón-Cabo, A.; Peixoto-Pino, L.; Abelairas-Gómez, C. Motivaciones y Hábitos de Actividad Física En Alumnos Universitarios (Motivations and Physical Activity Habits in University Students). Retos 2019, 36, 446–453. [Google Scholar] [CrossRef]
- Han, J.L.; Dinger, M.K.; Hull, H.R.; Randall, N.B.; Heesch, K.C.; Fields, D.A. Changes in Women’s Physical Activity during the Transition to College. Am. J. Health Educ. 2008, 39, 194–199. [Google Scholar] [CrossRef]
- González-Mesa, C.G. Motivos por los que los estudiantes universitarios no practican deporte. Rev. Fuentes 2008, 8, 199–208. [Google Scholar]
- Jáuregui-Lobera, I.; Oliveras López, M.J. Información no es conocimiento: A propósito de los alimentos funcionales. J. Negat. No Posit. Results 2018, 3, 593–613. [Google Scholar] [CrossRef]
- Keating, X.D.; Castro-Pinero, J.; Centeio, E.; Harrison, L.; Ramirez, T.; Chen, L. Health-Related Fitness Knowledge and Its Relation to Student Physical Activity Patterns at a Large U.S. Southern State University. ICHPER-SD J. Res. 2010, 5, 3–9. [Google Scholar]
- Abula, K.; Gröpel, P.; Chen, K.; Beckmann, J. Does Knowledge of Physical Activity Recommendations Increase Physical Activity among Chinese College Students? Empirical Investigations Based on the Transtheoretical Model. J. Sport Health Sci. 2018, 7, 77–82. [Google Scholar] [CrossRef]
- Plotnikoff, R.C.; Lippke, S.; Johnson, S.T.; Hugo, K.; Rodgers, W.; Spence, J.C. Awareness of Canada’s Physical Activity Guide to Healthy Active Living in a Large Community Sample. Am. J. Health Promot. 2011, 25, 294–297. [Google Scholar] [CrossRef] [PubMed]
- Práxedes, A.; Sevil, J.; Moreno, A.; Del Villar, F.; García-González, L. Niveles de actividad física en estudiantes universitarios: Diferencias en función del género, la edad y los estados de cambio. Rev. Iberoam. Psicol. Ejerc. Deporte 2016, 11, 123–132. [Google Scholar]
- Dumith, S.C.; Gigante, D.P.; Domingues, M.R.; Kohl, H.W. Physical Activity Change during Adolescence: A Systematic Review and a Pooled Analysis. Int. J. Epidemiol. 2011, 40, 685–698. [Google Scholar] [CrossRef]
- Murillo Pardo, B.; García Bengoechea, E.; Aibar Solana, A.; Julián Clemente, J.A.; García González, L.; Martín-Albo Lucas, J.; Estrada Tenorio, S. Factors Associated with Compliance with Physical Activity Recommendations among Adolescents in Huesca. Rev. Psicol. Deporte 2015, 24, 147–154. [Google Scholar]
- OMS. Salud del Adolescente y el Joven Adulto. Available online: https://www.who.int/es/news-room/fact-sheets/detail/adolescents-health-risks-and-solutions (accessed on 18 March 2023).
- Serrano-Sanchez, J.A.; Lera-Navarro, A.; Dorado-García, C.; González-Henriquez, J.J.; Sanchis-Moysi, J. Contribution of Individual and Environmental Factors to Physical Activity Level among Spanish Adults. PLoS ONE 2012, 7, e38693. [Google Scholar] [CrossRef]
- Raustorp, A.; Ekroth, Y. Tracking of Pedometer-Determined Physical Activity: A 10-Year Follow-Up Study from Adolescence to Adulthood in Sweden. J. Phys. Act. Health 2013, 10, 1186–1192. [Google Scholar] [CrossRef] [PubMed]
- Bray, S.R.; Born, H.A. Transition to University and Vigorous Physical Activity: Implications for Health and Psychological Well-Being. J. Am. Coll. Health 2004, 52, 181–188. [Google Scholar] [CrossRef] [PubMed]
- Cocca, A.; Liukkonen, J.; Mayorga-Vega, D.; Viciana-Ramírez, J. Health-Related Physical Activity Levels in Spanish Youth and Young Adults. Percept. Mot. Skills 2014, 118, 247–260. [Google Scholar] [CrossRef]
- Pedisic, Z.; Rakovac, M.; Bennie, J.; Jurakic, D.; Bauman, A. Levels and Correlates of Domain-Specific Physical Activity in University Students: Cross-Sectional Findings from Croatia. Kinesiology 2014, 46, 12–22. [Google Scholar]
- Ferreira de Sousa, T.; Aparecido Fonseca, S.; Rodrigues Barbosa, A. Perceived Barriers by University Students in Relation the Leisure-Time Physical Activity. Rev. Bras. Cineantropom. Desempenho Hum. 2013, 15, 164–173. [Google Scholar] [CrossRef]
- Knox, E.C.L.; Musson, H.; Adams, E.J. Knowledge of Physical Activity Recommendations in Adults Employed in England: Associations with Individual and Workplace-Related Predictors. Int. J. Behav. Nutr. Phys. Act. 2015, 12, 69. [Google Scholar] [CrossRef]
- Abdeta, C.; Seyoum, B.; Teklemariam, Z. Knowledge of the Physical Activity Guidelines and Factors Associated with Physical Activity Participation among Adults in Harar Town, Eastern Ethiopia. BMJ Open Sport Exerc. Med. 2019, 5, e000463. [Google Scholar] [CrossRef]
- Prochaska, J.O.; Diclemente, C.C. Toward a Comprehensive Model of Change. In Treating Addictive Behaviors; Miller, W.R., Heather, N., Eds.; Springer: Boston, MA, USA, 1986; pp. 3–27. ISBN 978-1-4612-9289-0. [Google Scholar]
- Marcus, B.H.; Rossi, J.S.; Selby, V.C.; Niaura, R.S.; Abrams, D.B. The Stages and Processes of Exercise Adoption and Maintenance in a Worksite Sample. Health Psychol. 1992, 11, 386–395. [Google Scholar] [CrossRef]
- Piercy, K.L.; Bevington, F.; Vaux-Bjerke, A.; Hilfiker, S.W.; Arayasirikul, S.; Barnett, E.Y. Understanding Contemplators’ Knowledge and Awareness of the Physical Activity Guidelines. J. Phys. Act. Health 2020, 17, 404–411. [Google Scholar] [CrossRef]

| Variables | Categories | N | % |
|---|---|---|---|
| Gender | Male | 166 | 51.7 |
| Female | 155 | 48.3 | |
| Age | 16–19 years | 108 | 33.6 |
| 20–29 years | 202 | 63.0 | |
| 30–35 years | 11 | 3.4 | |
| Do you consider yourself physically active? | Yes | 199 | 62.0 |
| No | 122 | 38.0 |
| Items | Load | Communality |
|---|---|---|
| 1 | 0.469 | 0.32 |
| 2 | 0.417 | 0.374 |
| 3 | 0.539 | 0.39 |
| 4 | 0.446 | 0.399 |
| 5 | 0.76 | 0.577 |
| 6 | 0.62 | 0.385 |
| 7 | 0.481 | 0.421 |
| 8 | 0.591 | 0.449 |
| 9 | 0.422 | 0.387 |
| Items | 1 | 2 | 3 | 4 | 5 | 6 | 7 | 8 | 9 | Cronbach’s Alpha If Deleted |
|---|---|---|---|---|---|---|---|---|---|---|
| 1 | 0.33 | 0.68 | ||||||||
| 2 | 0.05 | 0.36 | 0.69 | |||||||
| 3 | 0.22 | 0.08 | 0.45 | 0.68 | ||||||
| 4 | 0.16 | 0.25 | 0.17 | 0.34 | 0.69 | |||||
| 5 | 0.18 | 0.25 | 0.28 | 0.18 | 0.29 | 0.67 | ||||
| 6 | 0.19 | 0.22 | 0.27 | 0.16 | 0.37 | 0.44 | 0.67 | |||
| 7 | 0.30 | 0.09 | 0.21 | 0.33 | 0.16 | 0.21 | 0.57 | 0.68 | ||
| 8 | 0.37 | 0.13 | 0.29 | 0.15 | 0.29 | 0.29 | 0.23 | 0.39 | 0.67 | |
| 9 | 0.17 | 0.26 | 0.16 | 0.16 | 0.22 | 0.23 | 0.15 | 0.16 | 0.59 | 0.69 |
| Variables | ||||||||||
|---|---|---|---|---|---|---|---|---|---|---|
| Total Score Me (IQR) | Gender Me (IQR) | Age Me (IQR) | Physically Active Me (IQR) | |||||||
| Male | Female | p | 16–19 | 20–29 | 30–35 | p | Yes | No | p | |
| 2 (2) | 2 (2) | 2 (2) | 0.16 | 2 (2) | 2 (2) | 3 (2) | 0.15 | 2 (2) | 2 (1) | <0.01 ** |
| Items | Answers | ||
|---|---|---|---|
| Strongly Agree | Disagree | Don’t Know | |
| N (%) | N (%) | N (%) | |
| 1 | 34 (10.6) | 208 (64.8) | 79 (24.6) |
| 2 | 24 (7.5) | 49 (15.3) | 248 (77.3) |
| 3 | 33 (10.3) | 75 (23.4) | 213 (66.4) |
| 4 | 27 (8.4) | 17 (5.3) | 277 (86.3) |
| 5 | 21 (6.5) | 19 (5.9) | 281 (87.5) |
| 6 | 33 (10.3) | 50 (15.6) | 238 (74.1) |
| 7 | 56 (17.4) | 106 (32.9) | 159 (49.4) |
| 8 | 35 (10.9) | 180 (55.9) | 106 (32.9) |
| 9 | 54 (16.8) | 71 (22.0) | 196 (60.9) |
| Items | Answers | Gender | |||
|---|---|---|---|---|---|
| Total | Male | Female | |||
| N | N | N | p | ||
| 1 | Strongly agree | 34 | 23 | 11 | 0.11 |
| Disagree | 208 | 101 | 107 | ||
| Don’t know | 79 | 42 | 37 | ||
| 2 | Strongly agree | 24 | 10 | 14 | 0.24 |
| Disagree | 49 | 30 | 19 | ||
| Don’t know | 248 | 126 | 122 | ||
| 3 | Strongly agree | 33 | 17 | 16 | 0.84 |
| Disagree | 75 | 41 | 34 | ||
| Don’t know | 213 | 108 | 105 | ||
| 4 | Strongly agree | 27 | 15 | 12 | 0.03 * |
| Disagree | 17 | 14 | 3 | ||
| Don’t know | 277 | 137 | 140 | ||
| 5 | Strongly agree | 21 | 10 | 11 | 0.37 |
| Disagree | 19 | 7 | 12 | ||
| Don’t know | 281 | 149 | 132 | ||
| 6 | Strongly agree | 33 | 16 | 17 | 0.59 |
| Disagree | 50 | 23 | 27 | ||
| Don’t know | 238 | 127 | 111 | ||
| 7 | Strongly agree | 56 | 26 | 30 | 0.68 |
| Disagree | 106 | 56 | 50 | ||
| Don’t know | 159 | 84 | 75 | ||
| 8 | Strongly agree | 35 | 19 | 16 | 0.51 |
| Disagree | 180 | 88 | 92 | ||
| Don’t know | 106 | 59 | 47 | ||
| 9 | Strongly agree | 54 | 24 | 30 | 0.42 |
| Disagree | 71 | 40 | 31 | ||
| Don’t know | 196 | 102 | 94 | ||
| Items | Answers | Age | ||||
|---|---|---|---|---|---|---|
| Total | 16–19 | 20–29 | 30–35 | |||
| N | N | N | N | p | ||
| 1 | Strongly agree | 34 | 11 | 21 | 2 | 0.83 |
| Disagree | 208 | 73 | 128 | 7 | ||
| Don’t know | 79 | 24 | 53 | 2 | ||
| 2 | Strongly agree | 24 | 8 | 15 | 1 | 0.71 |
| Disagree | 49 | 18 | 31 | 0 | ||
| Don’t know | 248 | 82 | 156 | 10 | ||
| 3 | Strongly agree | 33 | 10 | 22 | 1 | 0.74 |
| Disagree | 75 | 28 | 43 | 4 | ||
| Don’t know | 213 | 70 | 137 | 6 | ||
| 4 | Strongly agree | 27 | 8 | 18 | 1 | 0.13 |
| Disagree | 17 | 2 | 13 | 2 | ||
| Don’t know | 277 | 98 | 171 | 8 | ||
| 5 | Strongly agree | 21 | 6 | 15 | 0 | 0.60 |
| Disagree | 19 | 5 | 14 | 0 | ||
| Don’t know | 281 | 97 | 173 | 11 | ||
| 6 | Strongly agree | 33 | 13 | 19 | 1 | 0.78 |
| Disagree | 50 | 14 | 35 | 1 | ||
| Don’t know | 238 | 81 | 148 | 9 | ||
| 7 | Strongly agree | 56 | 20 | 34 | 2 | 0.98 |
| Disagree | 106 | 37 | 65 | 4 | ||
| Don’t know | 159 | 51 | 103 | 5 | ||
| 8 | Strongly agree | 35 | 11 | 23 | 1 | 0.45 |
| Disagree | 180 | 62 | 109 | 9 | ||
| Don’t know | 106 | 35 | 70 | 1 | ||
| 9 | Strongly agree | 54 | 18 | 32 | 4 | 0.43 |
| Disagree | 71 | 26 | 44 | 1 | ||
| Don’t know | 196 | 64 | 126 | 6 | ||
| Items | Answers | Do You Consider Yourself Physically Active? | |||
|---|---|---|---|---|---|
| Total | Yes | No | |||
| N | N | N | p | ||
| 1 | Strongly agree | 34 | 14 | 20 | 0.01 * |
| Disagree | 208 | 129 | 79 | ||
| Don’t know | 79 | 56 | 23 | ||
| 2 | Strongly agree | 24 | 12 | 12 | 0.12 |
| Disagree | 49 | 36 | 13 | ||
| Don’t know | 248 | 151 | 97 | ||
| 3 | Strongly agree | 33 | 14 | 19 | 0.03 * |
| Disagree | 75 | 45 | 30 | ||
| Don’t know | 213 | 140 | 73 | ||
| 4 | Strongly agree | 27 | 15 | 12 | 0.06 |
| Disagree | 17 | 15 | 2 | ||
| Don’t know | 277 | 169 | 108 | ||
| 5 | Strongly agree | 21 | 12 | 9 | 0.15 |
| Disagree | 19 | 8 | 11 | ||
| Don’t know | 281 | 179 | 102 | ||
| 6 | Strongly agree | 33 | 12 | 21 | <0.01 ** |
| Disagree | 50 | 28 | 22 | ||
| Don’t know | 238 | 159 | 79 | ||
| 7 | Strongly agree | 56 | 30 | 26 | 0.03 * |
| Disagree | 106 | 59 | 47 | ||
| Don’t know | 159 | 110 | 49 | ||
| 8 | Strongly agree | 35 | 17 | 18 | 0.02 * |
| Disagree | 180 | 106 | 74 | ||
| Don’t know | 106 | 76 | 30 | ||
| 9 | Strongly agree | 54 | 24 | 30 | <0.01 ** |
| Disagree | 71 | 51 | 20 | ||
| Don’t know | 196 | 124 | 72 | ||
Disclaimer/Publisher’s Note: The statements, opinions and data contained in all publications are solely those of the individual author(s) and contributor(s) and not of MDPI and/or the editor(s). MDPI and/or the editor(s) disclaim responsibility for any injury to people or property resulting from any ideas, methods, instructions or products referred to in the content. |
© 2024 by the authors. Licensee MDPI, Basel, Switzerland. This article is an open access article distributed under the terms and conditions of the Creative Commons Attribution (CC BY) license (https://creativecommons.org/licenses/by/4.0/).
Share and Cite
Moreno-Lavaho, S.M.; Pérez-Gómez, J.; Polo-Campos, I.; Gómez-Paniagua, S.; Rojo-Ramos, J. Prospective Teachers’ Knowledge of Physical Activity in Children and Adolescents. Healthcare 2024, 12, 236. https://doi.org/10.3390/healthcare12020236
Moreno-Lavaho SM, Pérez-Gómez J, Polo-Campos I, Gómez-Paniagua S, Rojo-Ramos J. Prospective Teachers’ Knowledge of Physical Activity in Children and Adolescents. Healthcare. 2024; 12(2):236. https://doi.org/10.3390/healthcare12020236
Chicago/Turabian StyleMoreno-Lavaho, Sandra Milena, Jorge Pérez-Gómez, Irene Polo-Campos, Santiago Gómez-Paniagua, and Jorge Rojo-Ramos. 2024. "Prospective Teachers’ Knowledge of Physical Activity in Children and Adolescents" Healthcare 12, no. 2: 236. https://doi.org/10.3390/healthcare12020236
APA StyleMoreno-Lavaho, S. M., Pérez-Gómez, J., Polo-Campos, I., Gómez-Paniagua, S., & Rojo-Ramos, J. (2024). Prospective Teachers’ Knowledge of Physical Activity in Children and Adolescents. Healthcare, 12(2), 236. https://doi.org/10.3390/healthcare12020236