_MD__MPH_PhD.png)
Assessment of Social Connection among Autistic and Non-Autistic Adults: A Proof of Concept Study for the Connections with Others Scales


Abstract
1. Introduction
1.1. Social Motivation Theory of Autism
1.2. Measurement of Social Connection
2. Materials and Methods
2.1. Participants
2.2. Procedures
2.3. Measures
2.3.1. Social Interaction Items
2.3.2. Feedback Measures
2.3.3. Additional Social Connection Measures
2.4. Data Analysis
2.4.1. Qualitative Feedback Data
2.4.2. Factor Analysis
2.4.3. CWOS Outcomes
2.4.4. Validity Assessment
3. Results
3.1. Qualitative Feedback
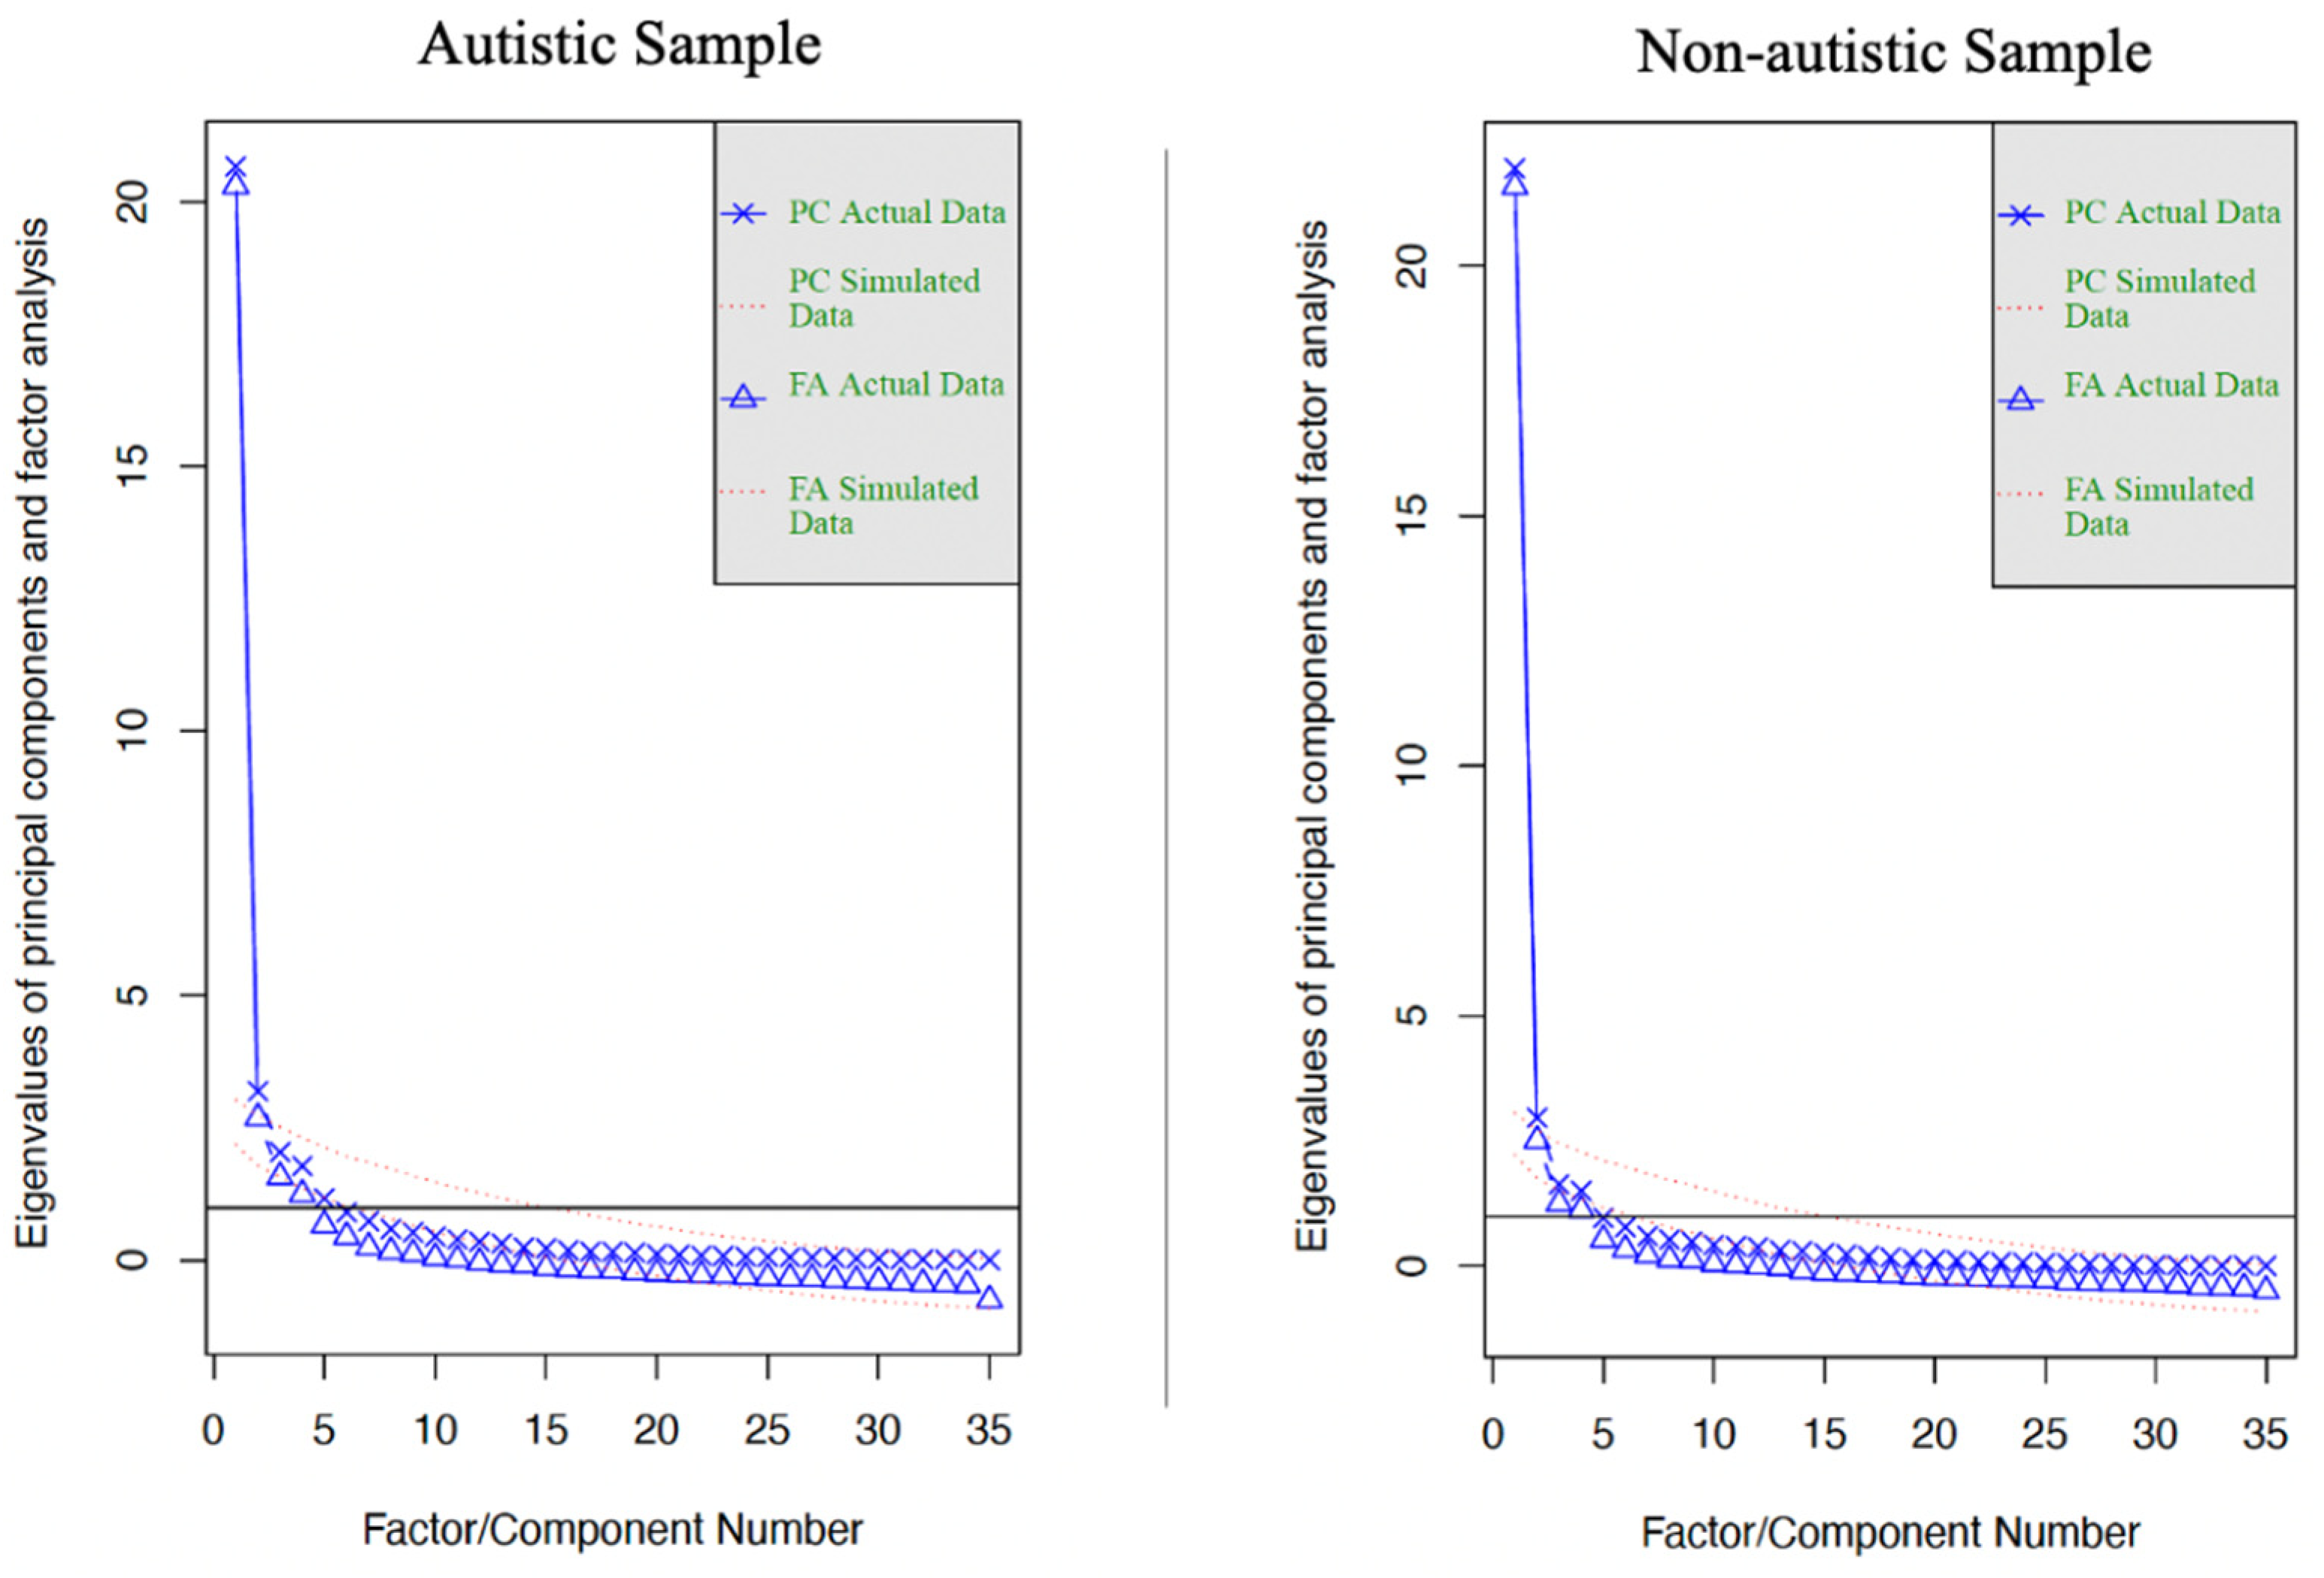
3.2. EFAs
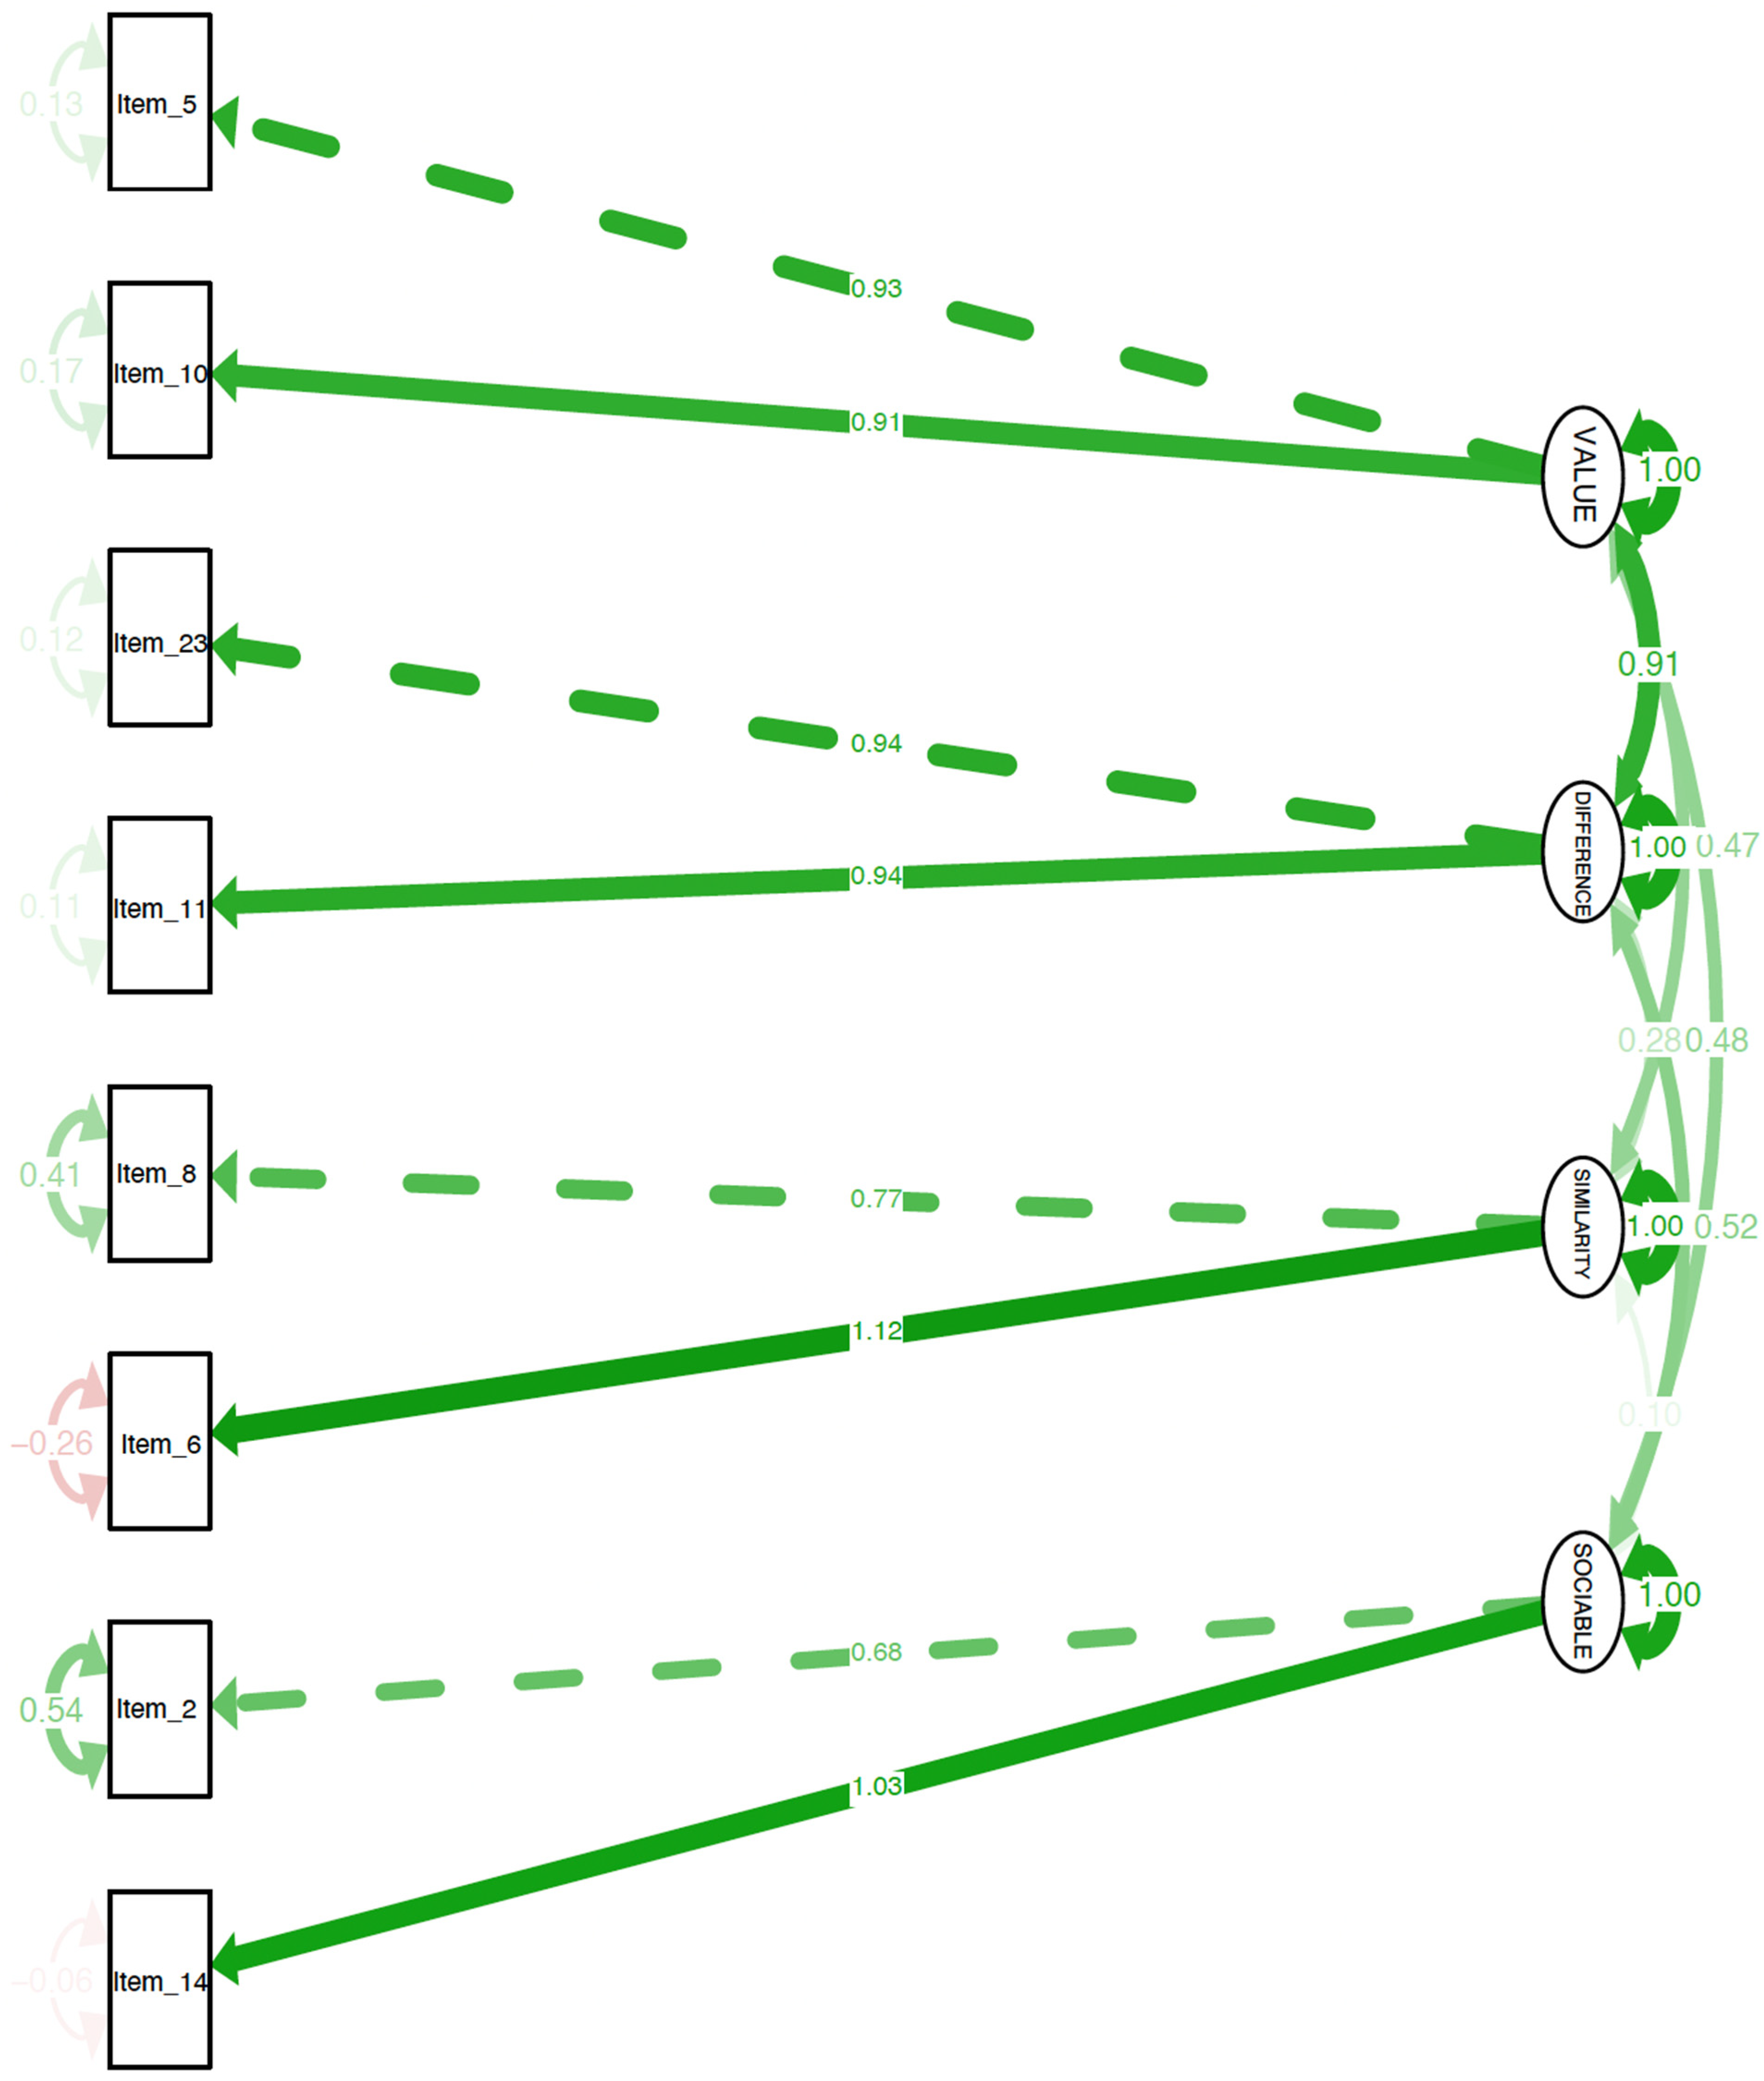
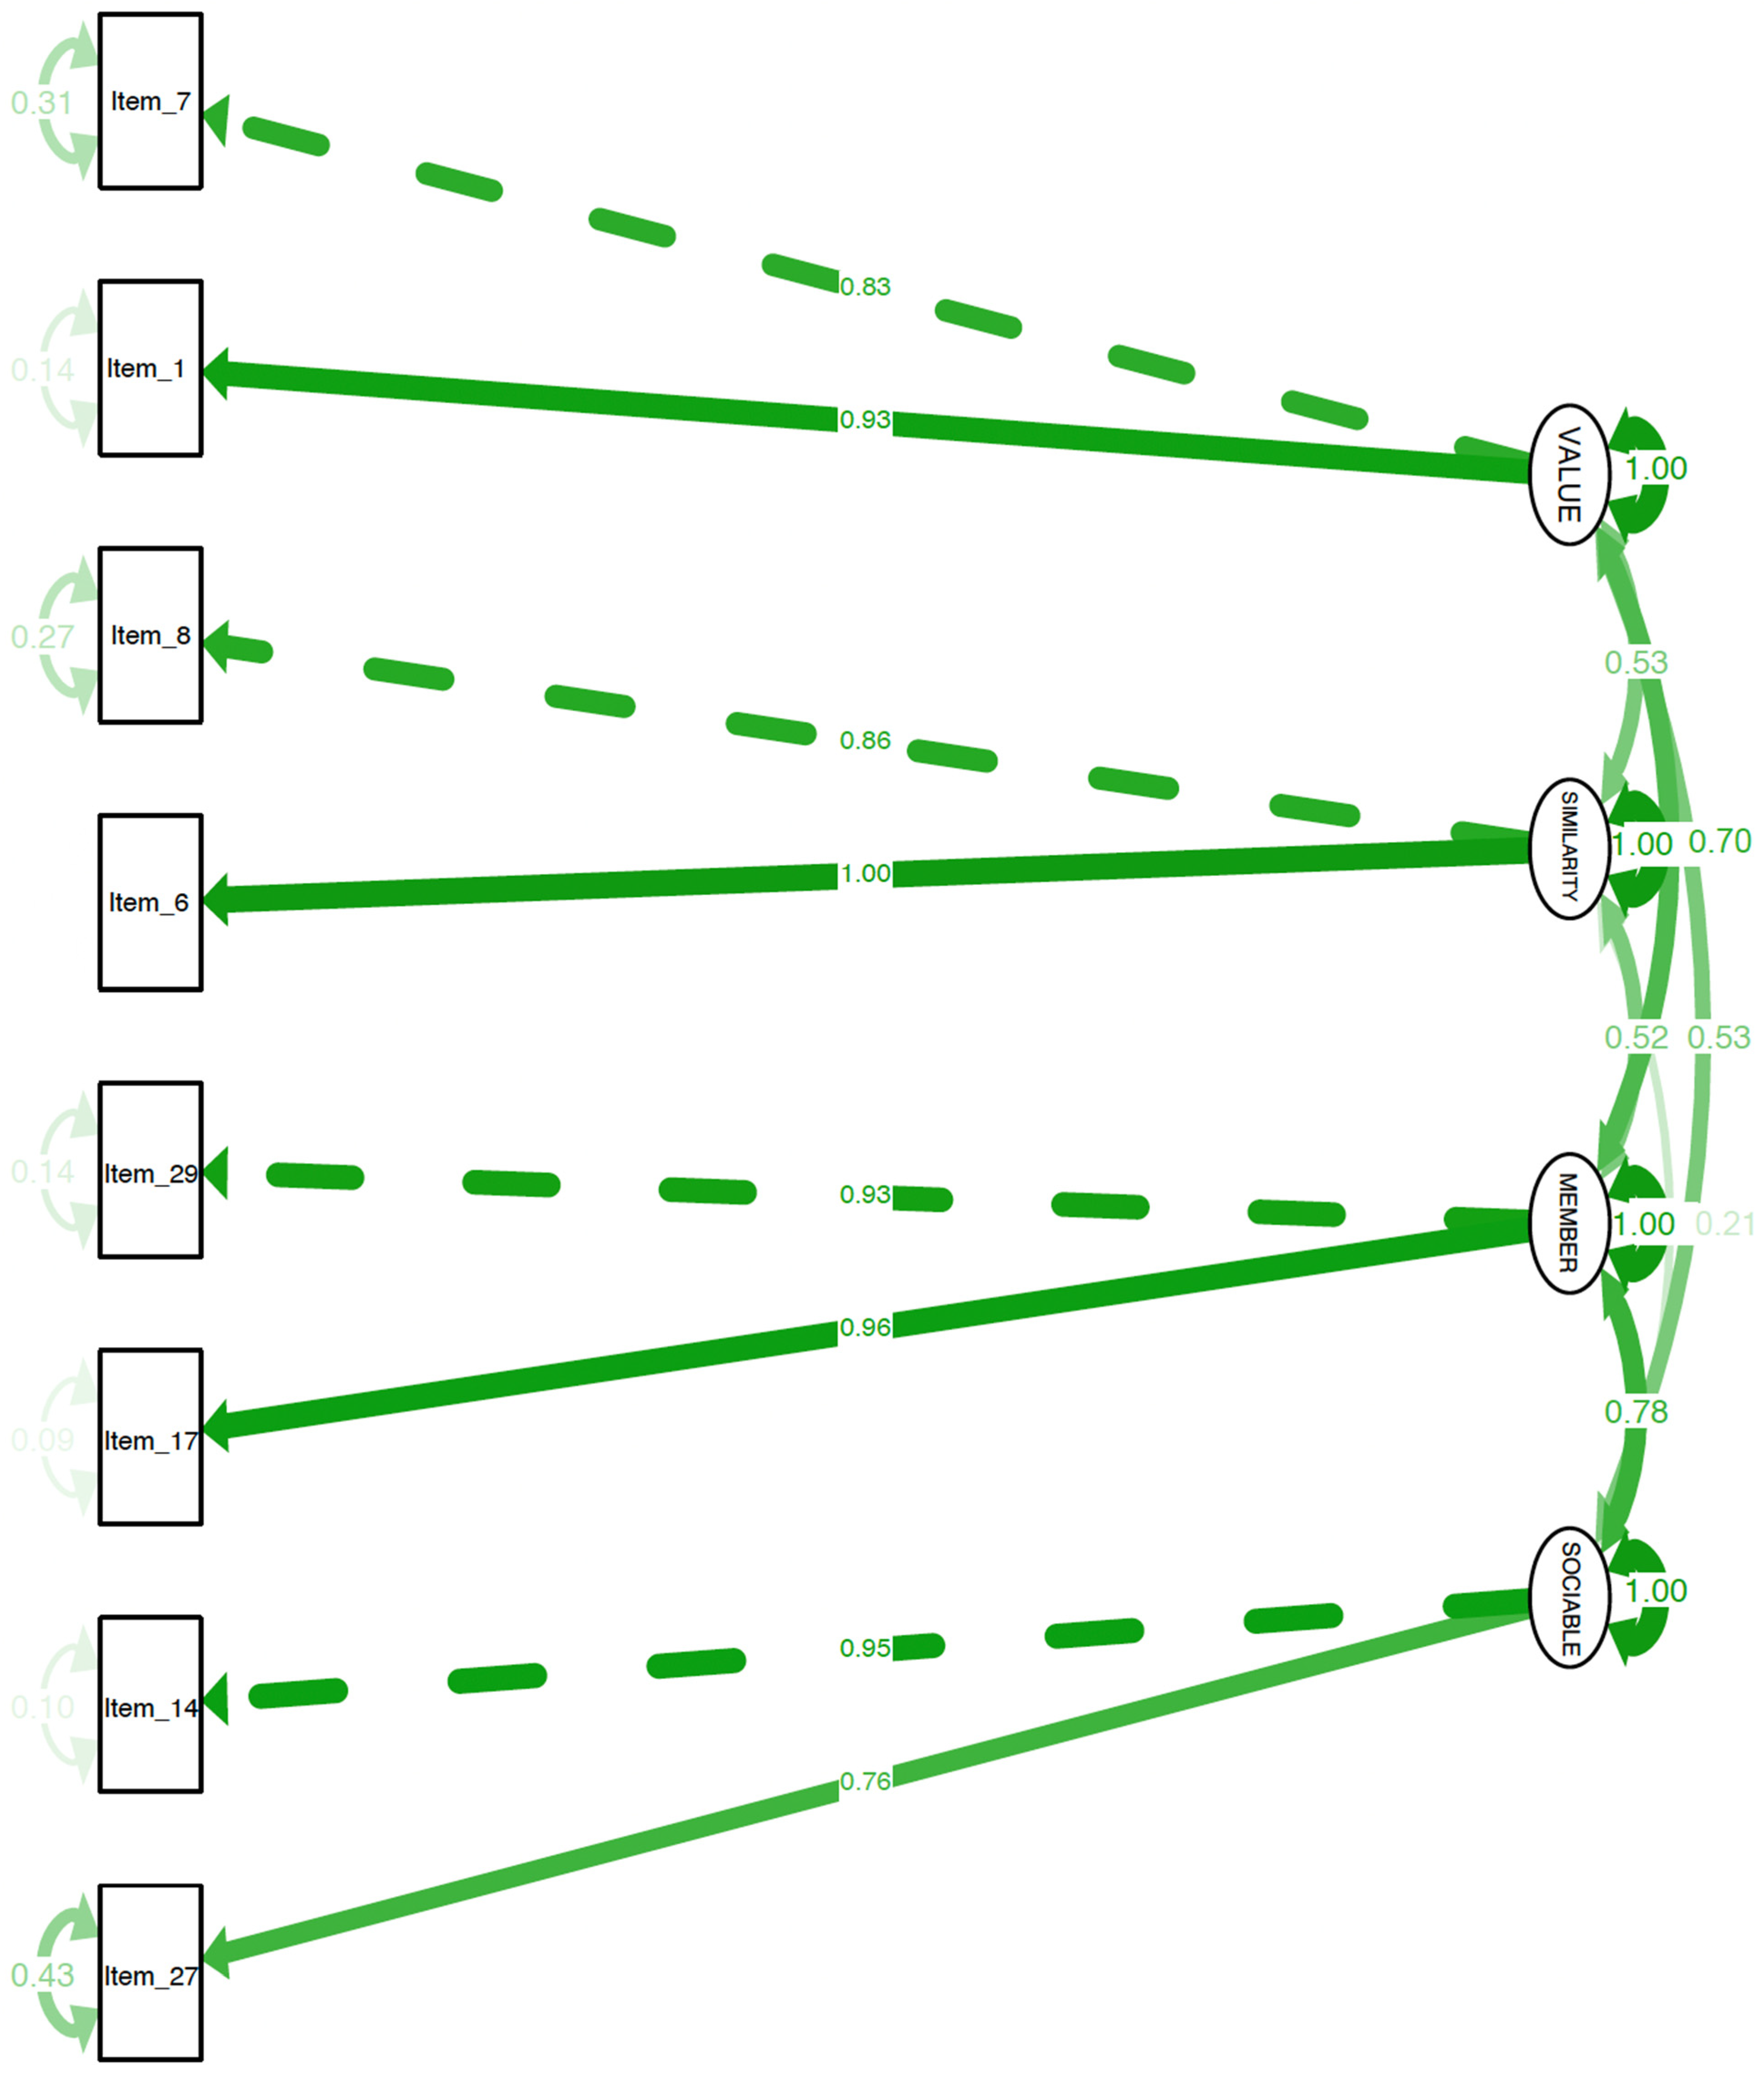
3.3. CFAs
3.4. CWOS Outcomes
3.5. Validity Assessment
4. Discussion
4.1. Psychometric Properties
4.2. Participatory Research Directions
4.3. Research and Clinical Implications
4.4. Limitations
4.5. Conclusions
Author Contributions
Funding
Institutional Review Board Statement
Informed Consent Statement
Data Availability Statement
Acknowledgments
Conflicts of Interest
Appendix A. CFA for Non-Autistic Sample
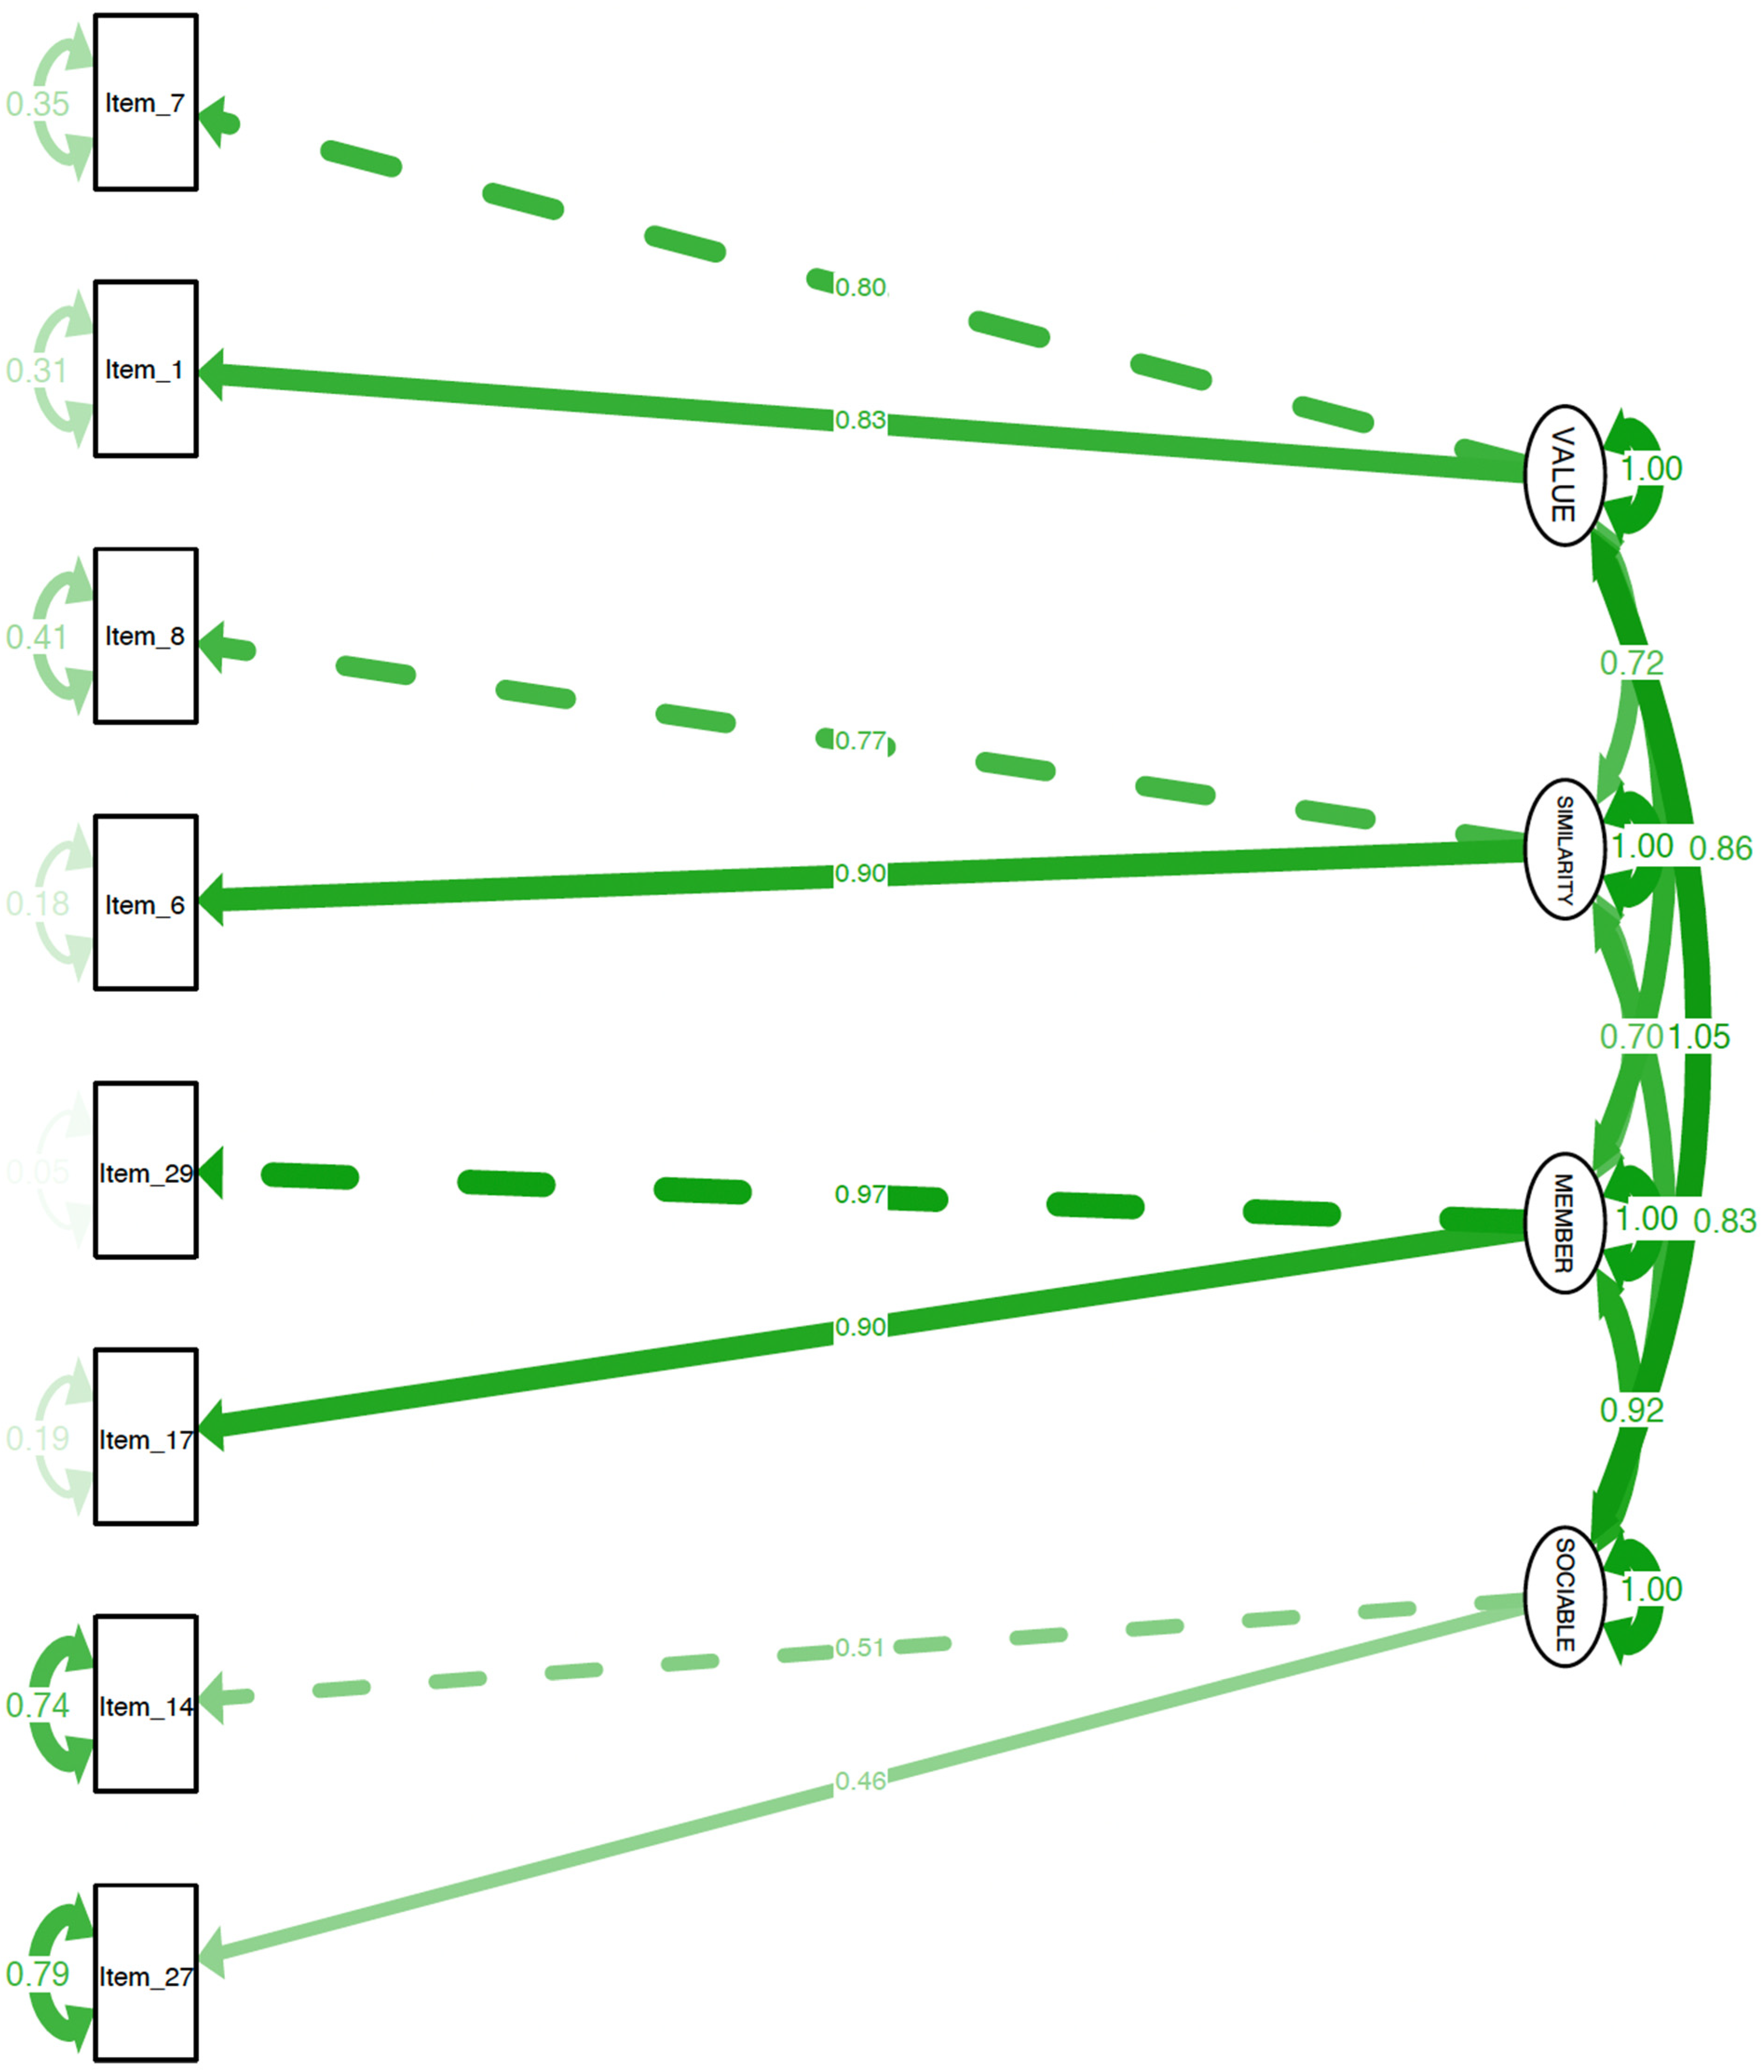
Appendix B. CFA for Autistic Sample
Appendix C. CFA for Autistic Sample Using the Non-Autistic Sample Model
Appendix D. Connections with Others Scale (CWOS)
| 7 (Strongly Agree) | 6 (Mostly Agree) | 5 (Slightly Agree) | 4 (Neither Agree nor Disagree) | 3 (Slightly Disagree) | 2 (Mostly Disagree) | 1 (Strongly Disagree) | |
| 1. I value talking with other people | |||||||
| 2. I want to interact with people who are similar to me | |||||||
| 3. I enjoy getting to know other people | |||||||
| 4. I want to interact with people who have similar interests as me | |||||||
| 5. I spend time with other people | |||||||
| 6. I enjoy being part of a group of friends | |||||||
| 7. I interact with people who are different than me | |||||||
| 8. I value being part of a group of friends |

Appendix E. Connections with Others Scale–Autistic Version (CWOS-AV)
| 7 (Strongly Agree) | 6 (Mostly Agree) | 5 (Slightly Agree) | 4 (Neither Agree nor Disagree) | 3 (Slightly Disagree) | 2 (Mostly Disagree) | 1 (Strongly Disagree) | |
| 1. I am part of a group of friends | |||||||
| 2. I enjoy talking with other people | |||||||
| 3. I want to interact with people who are similar to me | |||||||
| 4. I want to interact with people who have similar interests as me | |||||||
| 5. I want to get to know other people | |||||||
| 6. I enjoy interacting with people who are different than me | |||||||
| 7. I spend time with other people | |||||||
| 8. I value interacting with people who are different than me |
References
- Maslow, A.H. Motivation and Personality; Harper & Brothers: New York, NY, USA, 1954. [Google Scholar]
- Deci, E.L.; Ryan, R.M. Intrinsic Motivation and Self-Determination in Human Behavior; Plenum: New York, NY, USA, 1985. [Google Scholar]
- Baumeister, R.F.; Leary, M.R. The need to belong: Desire for interpersonal attachments as a fundamental human motivation. Psychol. Bull. 1995, 117, 497–529. [Google Scholar] [CrossRef] [PubMed]
- Haslam, C.; Cruwys, T.; Haslam, S.A.; Jetten, J. Social connectedness and health. Encycl. Geropsychology 2015, 46, 1–10. [Google Scholar] [CrossRef]
- Martino, J.; Pegg, J.; Frates, E.P. The connection prescription: Using the power of social interactions and the deep desire for connectedness to empower health and wellness. Am. J. Lifestyle Med. 2015, 11, 466–475. [Google Scholar] [CrossRef] [PubMed]
- Saeri, A.K.; Cruwys, T.; Barlow, F.K.; Stronge, S.; Sibley, C.G. Social connectedness improves public mental health: Investigating bidirectional relationships in the New Zealand attitudes and values survey. Aust. N. Z. J. Psychiatry 2018, 52, 365–374. [Google Scholar] [CrossRef] [PubMed]
- Liu, J.; Guo, M.; Xu, L.; Mao, W.; Chi, I. Family relationships, social connections, and depressive symptoms among Chinese older adults in international migrant families. J. Ethn. Cult. Divers. Soc. Work 2017, 26, 167–184. [Google Scholar] [CrossRef]
- Santini, Z.I.; Jose, P.E.; York Cornwell, E.; Koyanagi, A.; Nielsen, L.; Hinrichsen, C.; Meilstrup, C.; Madsen, K.R.; Koushede, V. Social disconnectedness, perceived isolation, and symptoms of depression and anxiety among older Americans (NSHAP): A longitudinal mediation analysis. Lancet 2020, 5, e62–e70. [Google Scholar] [CrossRef]
- Charuvastra, A.; Cloitre, M. Social bonds and posttraumatic stress disorder. Annu. Rev. Psychol. 2008, 59, 301–328. [Google Scholar] [CrossRef] [PubMed]
- Spears, B.A.; Taddeo, C.M.; Daly, A.L.; Stretton, A.; Karklins, L.T. Cyberbullying, help-seeking and mental health in young Australians: Implications for public health. Int. J. Public Health 2015, 60, 219–226. [Google Scholar] [CrossRef] [PubMed]
- Chang, Q.; Chan, C.H.; Yip, P.S.F. A meta-analytic review on social relationships and suicidal ideation among older adults. Soc. Sci. Med. 2017, 191, 65–76. [Google Scholar] [CrossRef] [PubMed]
- Marraccini, M.E.; Brier, Z.M.F. School connectedness and suicidal thoughts and behaviors: A systematic meta-analysis. Sch. Psychol. Q. 2017, 32, 5–21. [Google Scholar] [CrossRef] [PubMed]
- Joiner, T.E. Why People Die by Suicide; Harvard University Press: Cambridge, MA, USA, 2005. [Google Scholar]
- Van Orden, K.A.; Witte, T.K.; Cukrowicz, K.C.; Braithwaite, S.; Selby, E.A.; Joiner, T.E. The Interpersonal Theory of Suicide. Psychol. Rev. 2010, 117, 575–600. [Google Scholar] [CrossRef] [PubMed]
- Wang, J.; Mann, F.; Lloyd-Evans, B.; Ma, R.; Johnson, S. Associations between loneliness and perceived social support and outcomes of mental health problems: A systematic review. BMC Psychiatry 2018, 18, 156. [Google Scholar] [CrossRef] [PubMed]
- Cruwys, T.; Dingle, G.A.; Haslam, C.; Haslam, S.A.; Jetten, J.; Morton, T.A. Social group memberships protect against future depression, alleviate depression symptoms and prevent depression relapse. Soc. Sci. Med. 2013, 98, 179–186. [Google Scholar] [CrossRef] [PubMed]
- Czyz, E.K.; Liu, Z.; King, C.A. Social connectedness and one-year trajectories among suicidal adolescents following psychiatric hospitalization. J. Clin. Child Adolesc. Psychol. 2012, 41, 214–226. [Google Scholar] [CrossRef]
- Rutter, M. Resilience in the face of adversity. Protective factors and resistance to psychiatric disorder. Br. J. Psychiatry 1985, 147, 598–611. [Google Scholar] [CrossRef]
- Rutter, M. Resilience as a dynamic concept. Dev. Psychopathol. 2012, 24, 335–344. [Google Scholar] [CrossRef] [PubMed]
- Zolkoski, S.M.; Bullock, L.M. Resilience in children and youth: A review. Child. Youth Serv. Rev. 2012, 34, 2295–2303. [Google Scholar] [CrossRef]
- Chevallier, C.; Kohls, G.; Troiani, V.; Brodkin, E.S.; Schultz, R.T. The social motivation theory of autism. Trends Cogn. Sci. 2012, 16, 231–239. [Google Scholar] [CrossRef] [PubMed]
- Sasson, N.J.; Faso, D.J.; Nugent, J.; Lovell, S.; Kennedy, D.P.; Grossman, R.B. Neurotypical peers are less willing to interact with those with autism based on thin slice judgments. Sci. Rep. 2017, 7, 40700. [Google Scholar] [CrossRef] [PubMed]
- den Houting, J. Stepping out of isolation: Autistic people and COVID-19. Autism Adulthood 2020, 2, 103–105. [Google Scholar] [CrossRef] [PubMed]
- Maitland, C.A.; Rhodes, S.; O’Hare, A.; Stewart, M.E. Social identities and mental well-being in autistic adults. Autism Int. J. Res. Pract. 2021, 25, 1771–1783. [Google Scholar] [CrossRef] [PubMed]
- Chevallier, C.; Grèzes, J.; Molesworth, C.; Berthoz, S.; Happé, F. Brief report: Selective social anhedonia in high functioning autism. J. Autism Dev. Disord. 2012, 42, 1504–1509. [Google Scholar] [CrossRef] [PubMed]
- Lubben, J.; Blozik, E.; Gillmann, G.; IIiffe, S.; von Renteln Kruse, W.; Beck, J.C.; Stuck, A.E. Performance of an abbreviated version of the Lubben Social Network Scale among three European Community–dwelling older adult populations. Gerontologist 2006, 46, 503–513. [Google Scholar] [CrossRef] [PubMed]
- Russell, D.; Peplau, L.A.; Ferguson, M.L. Developing a measure of loneliness. J. Personal. Assess. 1978, 42, 290–294. [Google Scholar] [CrossRef]
- Van Orden, K.A.; Cukrowicz, K.C.; Witte, T.K.; Joiner, T.E. Thwarted belongingness and perceived burdensomeness: Construct validity and psychometric properties of the Interpersonal Needs Questionnaire. Psychol. Assess. 2012, 24, 197–215. [Google Scholar] [CrossRef] [PubMed]
- Fombonne, E.; Coppola, L.; Mastel, S.; O’Roak, B.J. Validation of Autism Diagnosis and Clinical Data in the SPARK Cohort. J. Autism Dev. Disord. 2022, 52, 3383–3398. [Google Scholar] [CrossRef] [PubMed]
- Kyngäs, H.; Kaakinen, P. Deductive content analysis. In The Application of Content Analysis in Nursing Science Research; Kyngäs, H., Mikkonen, K., Kääriäinen, M., Eds.; Springer: Cham, Switzerland, 2020. [Google Scholar] [CrossRef]
- Lorenzo-Seva, U. SOLOMON: A method for splitting a sample into equivalent subsamples in factor analysis. Behav. Res. Methods 2022, 54, 2665–2677. [Google Scholar] [CrossRef] [PubMed]
- Rosseel, Y. lavaan: An R Package for Structural Equation Modeling. J. Stat. Softw. 2012, 48, 1–36. [Google Scholar] [CrossRef]
- Hu, L.; Bentler, P.M. Cutoff criteria for fit indexes in covariance structure analysis: Conventional criteria versus new alternatives. Struct. Equ. Model. 1999, 6, 1–55. [Google Scholar] [CrossRef]
- Boateng, G.O.; Neilands, T.B.; Frongillo, E.A.; Melgar-Quiñonez, H.R.; Young, S.L. Best Practices for Developing and Validating Scales for Health, Social, and Behavioral Research: A Primer. Front. Public Health 2018, 6, 149. [Google Scholar] [CrossRef] [PubMed]
- Kenny, D.A.; Kaniskan, B.; McCoach, D.B. The performance of RMSEA in models with small degrees of freedom. Sociol. Methods Res. 2015, 44, 486–507. [Google Scholar] [CrossRef]
- Jaswal, V.K.; Akhtar, N. Being versus appearing socially uninterested: Challenging assumptions about social motivation in autism. Behav. Brain Sci. 2018, 42, e82. [Google Scholar] [CrossRef] [PubMed]
- Kapp, S.K.; Goldknopf, E.; Brooks, P.J.; Kofner, B.; Hossain, M. Expanding the critique of the social motivation theory of autism with participatory and developmental research. Behav. Brain Sci. 2019, 42, e94. [Google Scholar] [CrossRef]
- Tuovinen, S.; Tang, X.; Salmela-Aro, K. Introversion and social engagement: Scale validation, their interaction, and positive association with self-esteem. Front. Psychol. 2020, 11, 590748. [Google Scholar] [CrossRef] [PubMed]
- Milton, D.E.M. On the ontological status of autism: The ‘double empathy problem’. Disabil. Soc. 2012, 27, 883–887. [Google Scholar] [CrossRef]

| Demographic Variable | Autistic Sample (N = 100) M (SD)/N (%) | Non-Autistic Sample (N = 100) M (SD)/N (%) | Significant Differences t or χ2 |
|---|---|---|---|
| Age | 35.9 (12.6); range = 18–68 | 41.7 (18.8); range = 18–91 | t = −2.68, p-value = 0.008 * |
| Gender | χ2 = 6.88 p-value = 0.032 * | ||
| Cisgender woman | 51 (51%) | 70 (70%) | |
| Cisgender man | 31 (31%) | 24 (24%) | |
| Non-binary | 15 (15%) | 6 (6%) | |
| Transgender man | 2 (2%) | 0 (0%) | |
| Race | χ2 = 3.91 p-value = 0.141 | ||
| White | 88 (88%) | 76 (76%) | |
| Black | 6 (6%) | 16 (16%) | |
| Asian | 4 (4%) | 4 (4%) | |
| American Indian/ | 1 (1%) | 1 (1%) | |
| Alaskan Native | |||
| Ashkenazi | 1 (1%) | 0 (0%) | |
| Native Hawaiian/ | 0 (0%) | 1 (1%) | |
| Pacific Islander | |||
| Prefer not to disclose | 0 (0%) | 2 (2%) | |
| Ethnicity | χ2 = 0.35 p-value = 0.551 | ||
| Non-Hispanic/Latinx | 93 (93%) | 95 (95%) | |
| Hispanic/Latinx | 7 (7%) | 5 (5%) | |
| Age of autism diagnosis | 25.46 (16.4) range = 3–63 | N/A | N/A |
| Item # | Item | Autistic Sample Factor | Autistic Sample Factor Loading | Non-Autistic Sample Factor | Non-Autistic Sample Factor Loading | Included in Scale? |
|---|---|---|---|---|---|---|
| 1 | I value talking with other people | Value | 0.75 | Value | 0.82 | CWOS |
| 2 | I am part of a group of friends | Time spent | 0.73 | Time spent | 0.48 | CWOS-AV |
| 3 | I want to talk with other people | Value | 0.82 | Value | 0.73 | No |
| 4 | I interact with people who are similar to me | Value | 0.40 | Similarity | 0.58 | No |
| 5 | I enjoy talking with other people | Value | 0.89 | Value | 0.75 | CWOS-AV |
| 6 | I want to interact with people who are similar to me | Similarity | 0.77 | Similarity | 0.85 | CWOS and CWOS-AV |
| 7 | I enjoy getting to know other people | Value | 0.74 | Value | 0.85 | CWOS |
| 8 | I want to interact with people who have similar interests as me | Similarity | 0.93 | Similarity | 0.87 | CWOS and CWOS-AV |
| 9 | I want to interact with people who are different than me | Difference | 0.82 | Value | 0.53 | No |
| 10 | I want to get to know other people | Value | 0.87 | Value | 0.60 | CWOS-AV |
| 11 | I enjoy interacting with people who are different than me | Difference | 0.84 | Value | 0.65 | CWOS-AV |
| 12 | I am motivated to talk with other people | Value | 0.77 | Value | 0.70 | No |
| 13 | I value interacting with people who are similar to me | Similarity | 0.62 | Similarity | 0.71 | No |
| 14 | I spend time with other people | Time spent | 0.62 | Time spent | 0.69 | CWOS and CWOS-AV |
| 15 | I talk with other people | Time spent | 0.54 | Time spent | 0.61 | No |
| 16 | I am motivated to interact with people who are different than me | Difference | 0.63 | Time spent | 0.59 | No |
| 17 | I enjoy being part of a group of friends | Value | 0.50 | Member | 0.82 | CWOS |
| 18 | I value spending time with other people | Value | 0.44 | Member | 0.48 | No |
| 19 | I value interacting with people who have similar interests as me | Similarity | 0.70 | Similarity | 0.74 | No |
| 20 | I am motivated to interact with people who have similar interests as me | Similarity | 0.52 | Similarity | 0.72 | No |
| 21 | I get to know other people | Difference | 0.46 | Time spent | 0.50 | No |
| 22 | I want to spend time with other people | Value | 0.82 | Value | 0.76 | No |
| 23 | I value interacting with people who are different than me | Difference | 0.85 | Value | 0.75 | CWOS-AV |
| 24 | I interact with people who have similar interests as me | Difference | 0.36 | Similarity | 0.64 | No |
| 25 | I am motivated to interact with people who are similar to me | Similarity | 0.54 | Similarity | 0.79 | No |
| 26 | I am motivated to spend time with other people | Value | 0.65 | Value | 0.53 | No |
| 27 | I interact with people who are different than me | Difference | 0.76 | Time spent | 0.64 | CWOS |
| 28 | I enjoy spending time with other people | Difference | 0.47 | Value | 0.53 | No |
| 29 | I value being part of a group of friends | Similarity | 0.53 | Member | 0.87 | CWOS |
| 30 | I am motivated to get to know other people | Value | 0.52 | Time spent | 0.55 | No |
| 31 | I enjoy interacting with people who have similar interests as me | Difference | 0.56 | Similarity | 0.68 | No |
| 32 | I am motivated to be part of a group of friends | Time spent | 0.61 | Member | 0.57 | No |
| 33 | I enjoy interacting with people who are similar to me | Similarity | 0.54 | Similarity | 0.69 | No |
| 34 | I want to be part of a group of friends | Similarity | 0.35 | Member | 0.76 | No |
| 35 | I value getting to know other people | Value | 0.62 | Similarity | 0.54 | No |
| CWOS | CWOS-AV | |||
|---|---|---|---|---|
| Factor | Item | Factor Loading | Item | Factor Loading |
| Value | I value talking with other people | 0.82 | I enjoy talking with other people | 0.89 |
| I enjoy getting to know other people | 0.85 | I want to get to know other people | 0.87 | |
| Similarity | I want to interact with people who are similar to me | 0.85 | I want to interact with people who are similar to me | 0.77 |
| I want to interact with people who have similar interests as me | 0.87 | I want to interact with people who have similar interests as me | 0.93 | |
| Time spent | I spend time with other people | 0.69 | I am part of a group of friends | 0.73 |
| I interact with people who are different than me | 0.64 | I spend time with other people | 0.62 | |
| Member/Difference | I enjoy being part of a group of friends | 0.82 | I enjoy interacting with people who are different than me | 0.84 |
| I value being part of a group of friends | 0.87 | I value interacting with people who are different than me | 0.85 | |
| Non-Autistic Sample | CWOS r (95% CI) | INQ-R r (95% CI) | UCLA Loneliness Scale r (95% CI) |
|---|---|---|---|
| CWOS | -- | 0.45 (0.27, 0.59) * | 0.04 (−0.16, 0.23) |
| INQ-R | 0.45 (0.27, 0.59) * | -- | 0.29 (0.10, 0.46) * |
| UCLA Loneliness Scale | 0.04 (−0.16, 0.23) | 0.29 (0.10, 0.46) * | -- |
| Autistic Sample | CWOS-AV | INQ-R | UCLA Loneliness Scale |
| CWOS-AV | -- | 0.41 (0.23, 0.56) * | −0.28 (−0.46, −0.28) * |
| INQ-R | 0.41 (0.23, 0.56) * | -- | 0.02 (−0.18, 0.21) |
| UCLA Loneliness Scale | −0.28 (−0.46, −0.28) * | 0.02 (−0.18, 0.21) | -- |
Disclaimer/Publisher’s Note: The statements, opinions and data contained in all publications are solely those of the individual author(s) and contributor(s) and not of MDPI and/or the editor(s). MDPI and/or the editor(s) disclaim responsibility for any injury to people or property resulting from any ideas, methods, instructions or products referred to in the content. |
© 2024 by the authors. Licensee MDPI, Basel, Switzerland. This article is an open access article distributed under the terms and conditions of the Creative Commons Attribution (CC BY) license (https://creativecommons.org/licenses/by/4.0/).
Share and Cite
Mournet, A.M.; Bal, V.H.; Selby, E.A.; Kleiman, E.M. Assessment of Social Connection among Autistic and Non-Autistic Adults: A Proof of Concept Study for the Connections with Others Scales. Healthcare 2024, 12, 1077. https://doi.org/10.3390/healthcare12111077
Mournet AM, Bal VH, Selby EA, Kleiman EM. Assessment of Social Connection among Autistic and Non-Autistic Adults: A Proof of Concept Study for the Connections with Others Scales. Healthcare. 2024; 12(11):1077. https://doi.org/10.3390/healthcare12111077
Chicago/Turabian StyleMournet, Annabelle M., Vanessa H. Bal, Edward A. Selby, and Evan M. Kleiman. 2024. "Assessment of Social Connection among Autistic and Non-Autistic Adults: A Proof of Concept Study for the Connections with Others Scales" Healthcare 12, no. 11: 1077. https://doi.org/10.3390/healthcare12111077
APA StyleMournet, A. M., Bal, V. H., Selby, E. A., & Kleiman, E. M. (2024). Assessment of Social Connection among Autistic and Non-Autistic Adults: A Proof of Concept Study for the Connections with Others Scales. Healthcare, 12(11), 1077. https://doi.org/10.3390/healthcare12111077