

The Relationship between Physical Activity and Health-Related Quality of Life in Korean Adults: The Eighth Korea National Health and Nutrition Examination Survey


Abstract
1. Introduction
2. Materials and Methods
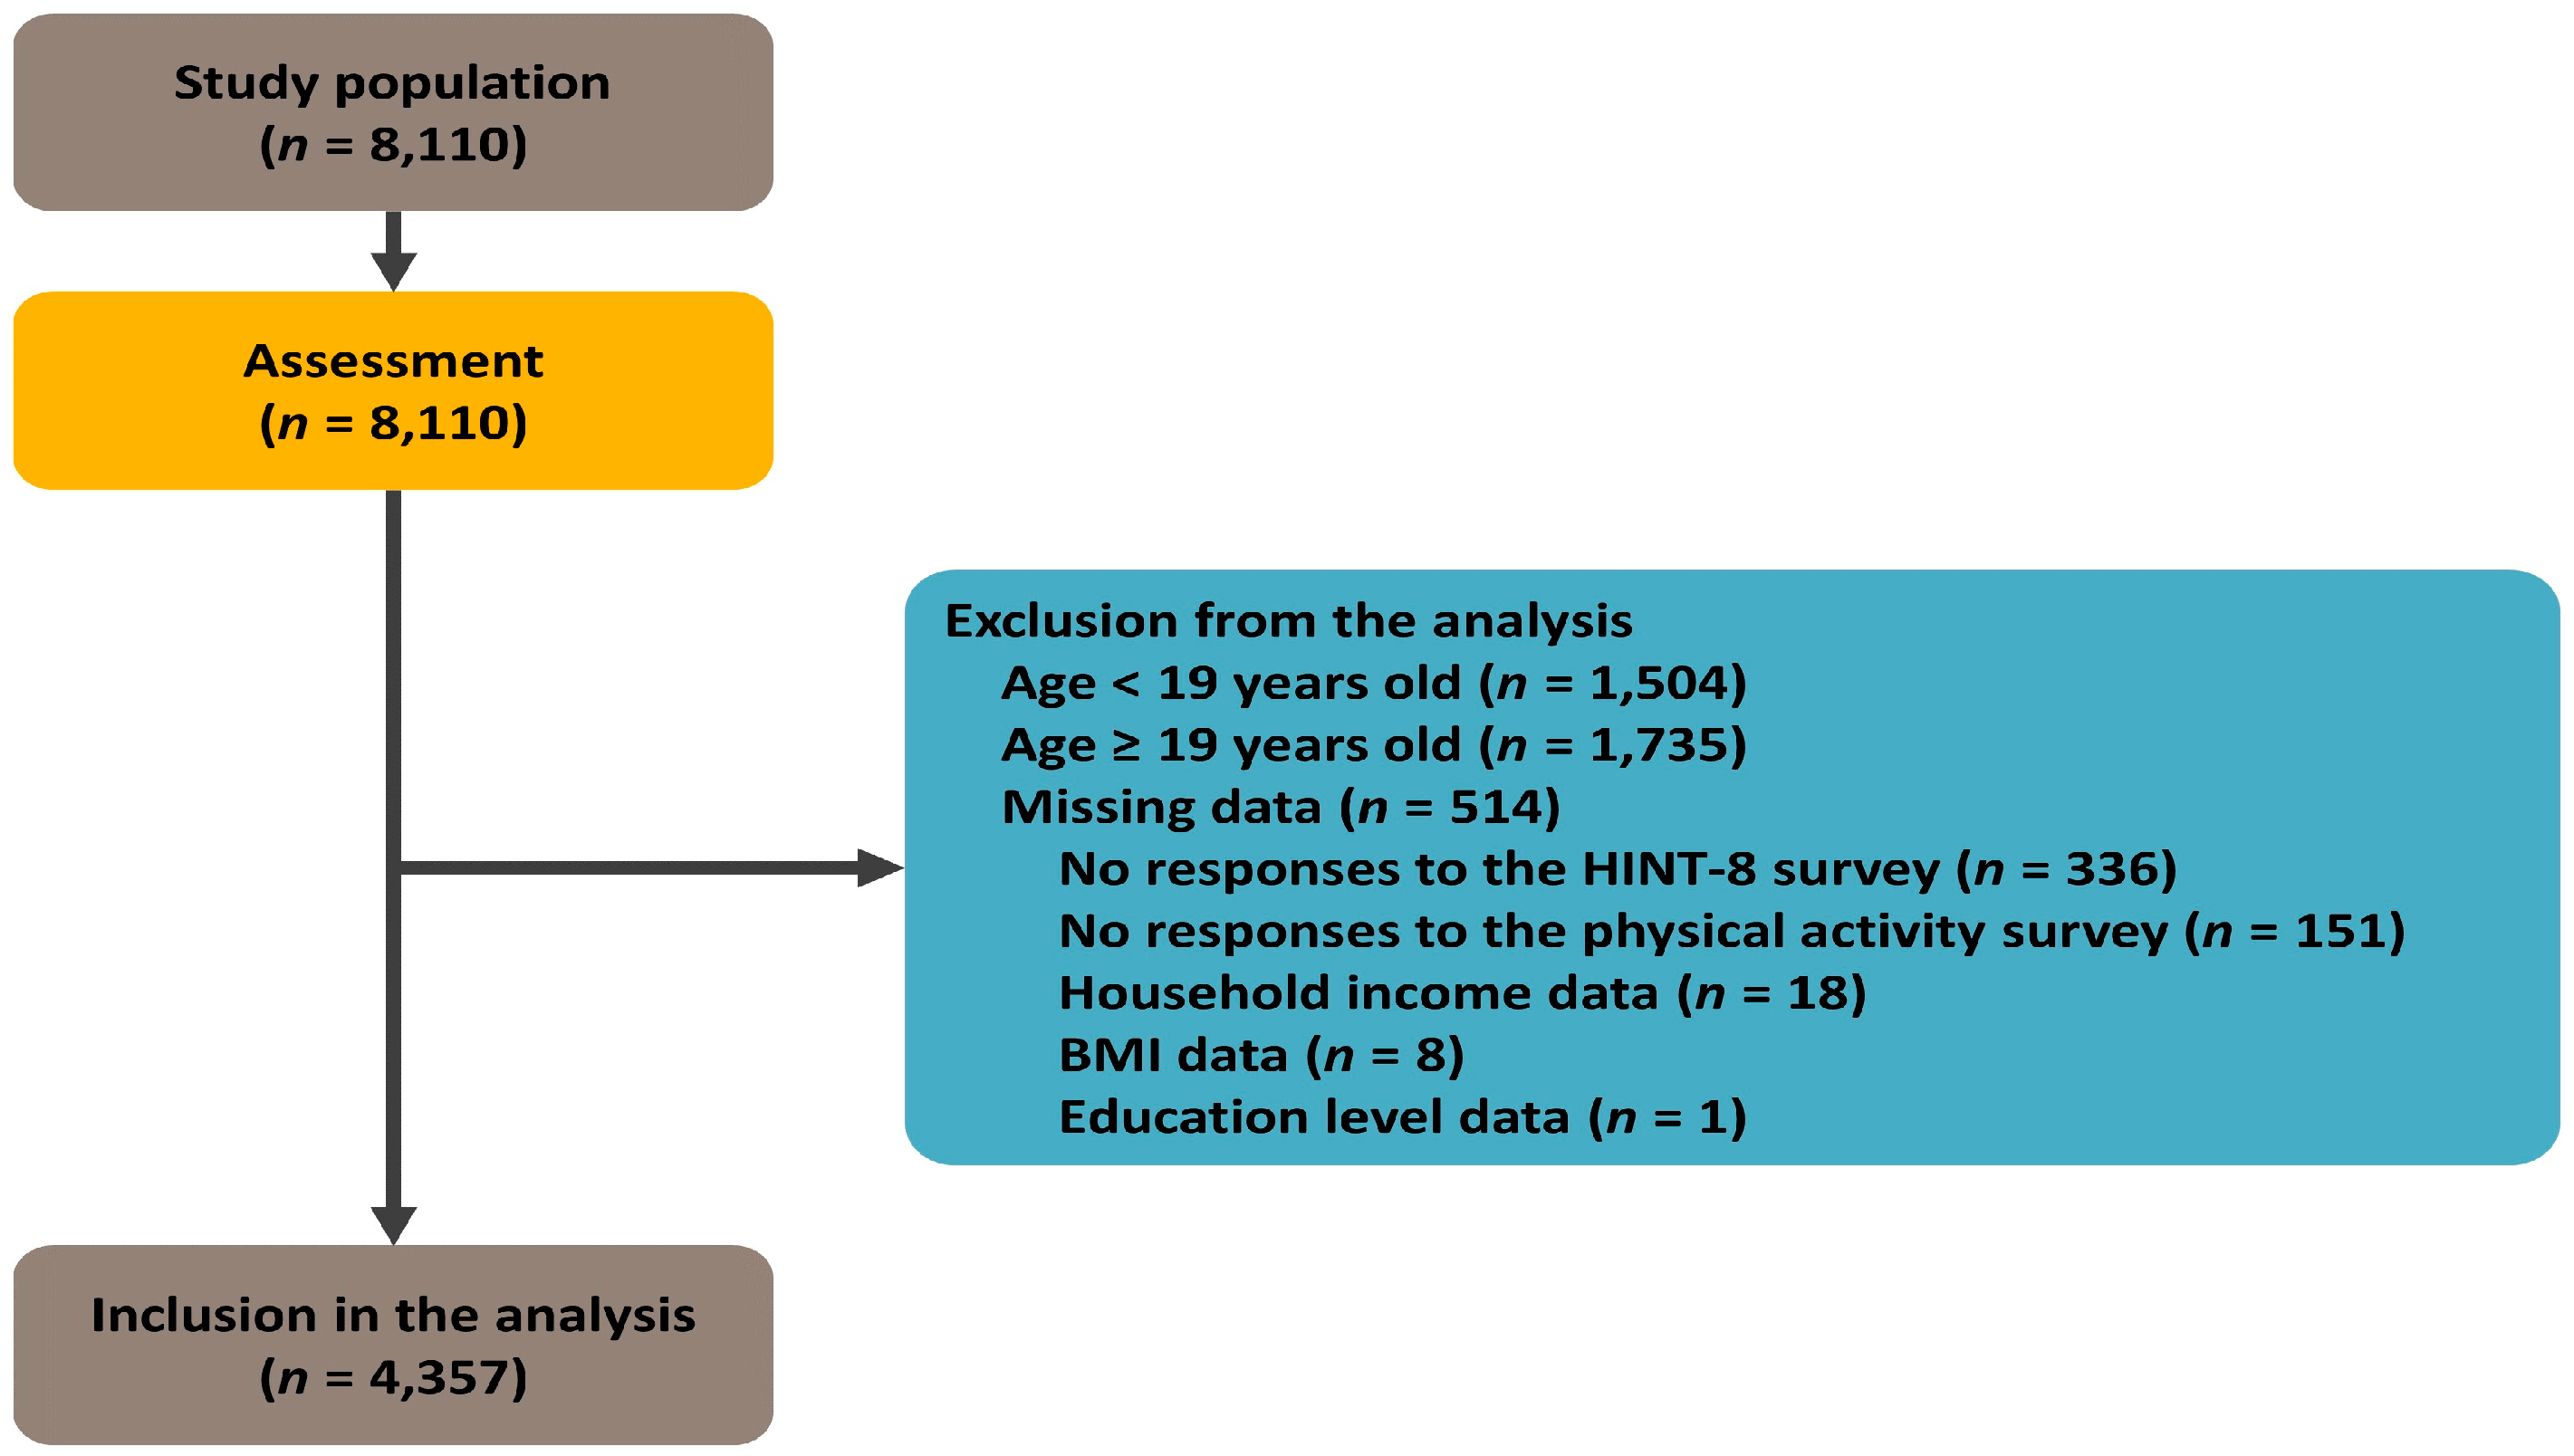
2.1. Study Setting and Participants
2.2. Study Design
2.3. Measurement of Variables
2.4. Characteristics of PA
2.5. Measurement of HR QOL
2.6. Assessment of Demographic Characteristics and Health Behavior of the Participants
2.7. Data Analysis
3. Results
3.1. Demographic Characteristics of the Participants
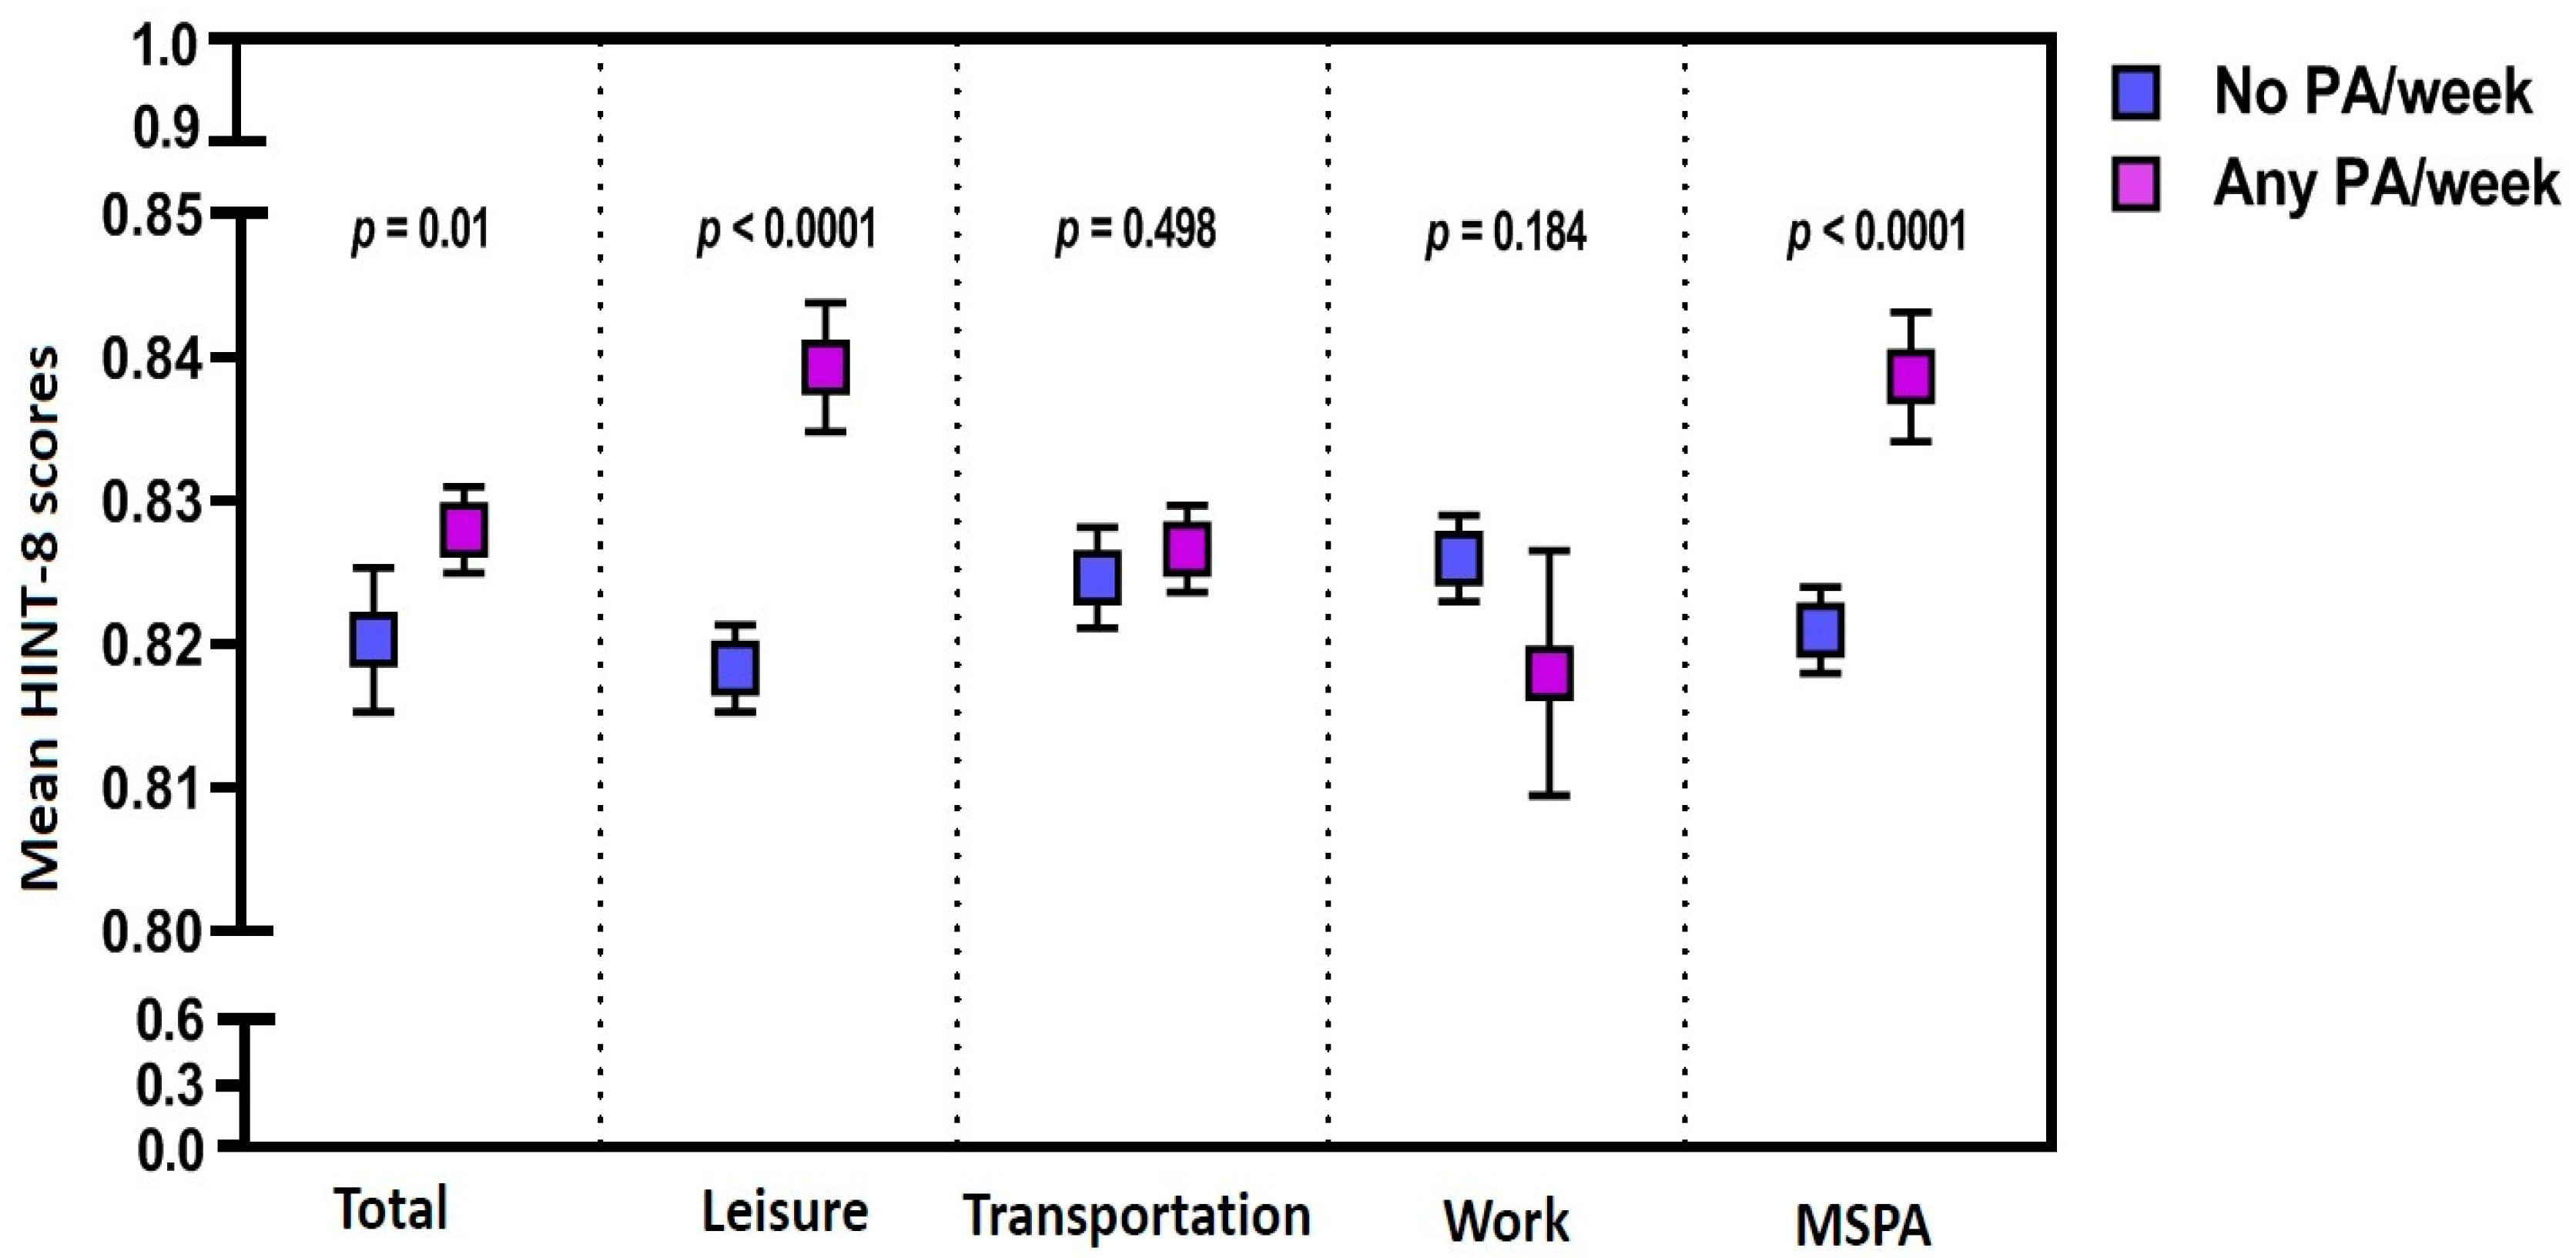
3.2. Differences in the HINT-8 Scores Depending on the Pattern of PA
3.3. Relationship between Leisure-Time PA and the HINT-8 Scores
3.4. Relationship between MSPA and the HINT-8 Scores
4. Discussion
- (1)
- The mean HINT-8 scores were significantly higher in the participants who performed PA on a weekly basis, leisure-related PA, or MSPA as compared with those who did not (p = 0.01 and <0.0001, respectively).
- (2)
- In both the unadjusted and adjusted models, the mean HINT-8 scores were significantly higher in the participants who performed ≥500 MET-min/week of leisure-related PA as compared with those who did not (95% CI: 1.017–1.033; p < 0.001 and 95% CI: 1.005–1.02; p = 0.001, respectively).
- (3)
- In both the unadjusted and adjusted models, the mean HINT-8 scores were significantly higher (95% CI: 1.015–1.03; p < 0.001 and 95% CI: 1.004–1.018; p = 0.003, respectively) in the participants who performed MSPA for ≥2 days/week as compared with those who did not.
5. Strengths and Limitations
6. Conclusions
Author Contributions
Funding
Institutional Review Board Statement
Informed Consent Statement
Data Availability Statement
Conflicts of Interest
References
- Marquez, D.X.; Aguiñaga, S.; Vásquez, P.M.; Conroy, D.E.; Erickson, K.I.; Hillman, C.; Stillman, C.M.; Ballard, R.M.; Sheppard, B.B.; Petruzzello, S.J.; et al. A systematic review of physical activity and quality of life and well-being. Transl. Behav. Med. 2020, 10, 1098–1109. [Google Scholar] [CrossRef] [PubMed]
- Park, B.Y.; Ko, D.S.; Park, H.S. Relationship between job characteristic and quality of life among some elderly. J. Korean Inst. Electronic. Commun. Sci. 2013, 8, 941–947. [Google Scholar] [CrossRef]
- Kim, D.J. The Effects of Restricted Physical Activity on Health-Related Quality of Life in Adult Patients with Depression. Osong Public Health Res. Perspect. 2019, 10, 85–92. [Google Scholar] [CrossRef]
- Antunes, H.K.; Stella, S.G.; Santos, R.F.; Bueno, O.F.; de Mello, M.T. Depression, anxiety and quality of life scores in seniors after an endurance exercise program. Braz. J. Psychiatry 2005, 27, 266–271. [Google Scholar] [CrossRef] [PubMed]
- Morgan, W.P.; O’Connor, P.J.; Ellickson, K.A.; Bradley, P.W. Personality structure, mood states, and performance in elite male distance runners. Int. J. Sport Psychol. 1988, 19, 247–263. [Google Scholar]
- Awick, E.A.; Ehlers, D.K.; Aguiñaga, S.; Daugherty, A.M.; Kramer, A.F.; McAuley, E. Effects of a randomized exercise trial on physical activity, psychological distress and quality of life in older adults. Gen. Hosp. Psychiatry 2017, 49, 44–50. [Google Scholar] [CrossRef]
- Fabre, C.; Massé-Biron, J.; Chamari, K.; Varray, A.; Mucci, P.; Préfaut, C. Evaluation of quality of life in elderly healthy subjects after aerobic and/or mental training. Arch. Gerontol. Geriatr. 1999, 28, 9–22. [Google Scholar] [CrossRef]
- Joos, B.; Uebelhart, D.; Michel, B.A.; Sprott, H. Influence of an outpatient multidisciplinary pain management program on the health-related quality of life and the physical fitness of chronic pain patients. J. Negat. Results Biomed. 2004, 3, 1. [Google Scholar] [CrossRef]
- Oldervoll, L.M.; Kaasa, S.; Hjermstad, M.J.; Lund, J.A.; Loge, J.H. Physical exercise results in the improved subjective well-being of a few or is effective rehabilitation for all cancer patients? Eur. J. Cancer 2004, 40, 951–962. [Google Scholar] [CrossRef]
- Bize, R.; Johnson, J.A.; Plotnikoff, R.C. Physical activity level and health-related quality of life in the general adult population: A systematic review. Prev. Med. 2007, 45, 401–415. [Google Scholar] [CrossRef]
- Anokye, N.K.; Trueman, P.; Green, C.; Pavey, T.G.; Taylor, R.S. Physical activity and health related quality of life. BMC Public Health 2012, 12, 624. [Google Scholar] [CrossRef] [PubMed]
- Blom, E.E.; Aadland, E.; Skrove, G.K.; Solbraa, A.K.; Oldervoll, L.M. Health-related quality of life and intensity-specific physical activity in high-risk adults attending a behavior change service within primary care. PLoS ONE 2019, 14, e0226613. [Google Scholar] [CrossRef] [PubMed]
- Kokic, I.S.; Znika, M.; Brumnic, V. Physical activity, health-related quality of life and musculoskeletal pain among students of physiotherapy and social sciences in Eastern Croatia—Cross-sectional survey. Ann. Agric. Environ. Med. 2019, 26, 182–190. [Google Scholar] [CrossRef] [PubMed]
- Wafa, S.W.; Shahril, M.R.; Ahmad, A.B.; Zainuddin, L.R.; Ismail, K.F.; Aung, M.M.; Mohd Yusoff, N.A. Association between physical activity and health-related quality of life in children: A cross-sectional study. Health Qual. Life Outcomes 2016, 14, 71. [Google Scholar] [CrossRef]
- Psarrou, A.; Adamakidou, T.; Apostolara, P.; Koreli, A.; Drakopoulou, M.; Plakas, S.; Mastrogiannis, D.; Mantoudi, A.; Parissopoulos, S.; Zartaloudi, A.; et al. Associations between Physical Activity and Health-Related Quality of Life among Community-Dwelling Older Adults: A Cross-Sectional Study in Urban Greece. Geriatrics 2023, 8, 61. [Google Scholar] [CrossRef]
- Mendes, M.A.; da Silva, I.; Ramires, V.; Reichert, F.; Martins, R.; Ferreira, R.; Tomasi, E. Metabolic equivalent of task (METs) thresholds as an indicator of physical activity intensity. PLoS ONE 2018, 13, e0200701. [Google Scholar] [CrossRef]
- Nikitas, C.; Kikidis, D.; Bibas, A.; Pavlou, M.; Zachou, Z.; Bamiou, D.E. Recommendations for physical activity in the elderly population: A scoping review of guidelines. J. Frailty Sarcopenia Falls 2022, 7, 18–28. [Google Scholar] [CrossRef]
- Lee, M.N.; Kim, S.D.; Choi, Y.S. The Relationship between Physical Activity and Health-Related Quality of Life (HINT-Eight) in Middle-Aged Korean Women. J. Environ. Public Health 2022, 2022, 4555547. [Google Scholar] [CrossRef]
- Kim, W.; Han, K.T.; Kim, S. Health-related quality of life among cancer patients and survivors and its relationship with current employment status. Support. Care Cancer 2022, 30, 4547–4555. [Google Scholar] [CrossRef]
- Seo, M.H.; Lee, W.Y.; Kim, S.S.; Kang, J.H.; Kang, J.H.; Kim, K.K.; Kim, B.Y.; Kim, Y.H.; Kim, W.J.; Kim, E.M.; et al. 2018 Korean Society for the Study of Obesity guideline for the management of obesity in Korea. J. Obes. Metab. Syndr. 2019, 28, 40–45. [Google Scholar] [CrossRef]
- Kim, N.; Kim, G.-U.; Kim, H. Comparative Study of Dietary Patterns by Living Arrangements: The Korea National Health and Nutrition Examination Survey (KNHANES) 2013–2015. Int. J. Environ. Res. Public Health 2020, 17, 2371. [Google Scholar] [CrossRef] [PubMed]
- GBD 2017 Mortality Collaborators. Global, regional, and national age-sex-specific mortality and life expectancy, 1950–2017: A systematic analysis for the Global Burden of Disease Study 2017. Lancet 2018, 392, 1684–1735. [Google Scholar] [CrossRef] [PubMed]
- GBD 2017 Disease and Injury Incidence and Prevalence Collaborators. Global, regional, and national incidence, prevalence, and years lived with disability for 354 diseases and injuries for 195 countries and territories, 1990–2017: A systematic analysis for the Global Burden of Disease Study 2017. Lancet 2018, 392, 1789–1858. [Google Scholar] [CrossRef] [PubMed]
- GBD 2017 Risk Factor Collaborators. Global, regional, and national comparative risk assessment of 84 behavioural, environmental and occupational, and metabolic risks or clusters of risks for 195 countries and territories, 1990–2017: A systematic analysis for the Global Burden of Disease Study 2017. Lancet 2018, 392, 1923–1994. [Google Scholar]
- Pedersen, B.K.; Saltin, B. Exercise as medicine—Evidence for prescribing exercise as therapy in 26 different chronic diseases. Scand. J. Med. Sci. Sports 2015, 25 (Suppl. S3), 1–72. [Google Scholar]
- DiPietro, L.; Buchner, D.M.; Marquez, D.X.; Pate, R.R.; Pescatello, L.S.; Whitt-Glover, M.C. New scientific basis for the 2018 U.S. Physical Activity Guidelines. J. Sport Health Sci. 2019, 8, 197–200. [Google Scholar] [CrossRef]
- Rejeski, W.J.; Mihalko, S.L. Physical activity and quality of life in older adults. J. Gerontol. A Biol. Sci. Med. Sci. 2001, 56, 23–35. [Google Scholar] [CrossRef]
- Halaweh, H.; Willen, C.; Grimby-Ekman, A.; Svantesson, U. Physical Activity and Health-Related Quality of Life Among Community Dwelling Elderly. J. Clin. Med. Res. 2015, 7, 845–852. [Google Scholar] [CrossRef]
- Cho, K.O. The Positive Effect of Physical Activity on Health and Health-related Quality of Life in Elderly Korean People-Evidence from the Fifth Korea National Health and Nutrition Examination Survey. J. Lifestyle Med. 2014, 4, 86–94. [Google Scholar] [CrossRef][Green Version]
- Eckert, K. Impact of physical activity and bodyweight on health-related quality of life in people with type 2 diabetes. Diabetes Metab. Syndr. Obes. 2012, 5, 303–311. [Google Scholar] [CrossRef]
- Gillison, F.B.; Skevington, S.M.; Sato, A.; Standage, M.; Evangelidou, S. The effects of exercise interventions on quality of life in clinical and healthy populations; a meta-analysis. Soc. Sci. Med. 2009, 68, 1700–1710. [Google Scholar] [CrossRef] [PubMed]
- Floegel, T.A.; Perez, G.A. An integrative review of physical activity/exercise intervention effects on function and health-related quality of life in older adults with heart failure. Geriatr. Nurs. 2016, 37, 340–347. [Google Scholar] [CrossRef] [PubMed]
- Eaglehouse, Y.L.; Schafer, G.L.; Arena, V.C.; Kramer, M.K.; Miller, R.G.; Kriska, A.M. Impact of a community-based lifestyle intervention program on health-related quality of life. Qual. Life. Res. 2016, 25, 1903–1912. [Google Scholar] [CrossRef] [PubMed]
- Scarabottolo, C.C.; Cyrino, E.S.; Nakamura, P.M.; Tebar, W.R.; da Canhin, D.S.; Gobbo, L.A.; Christofaro, D.G.D. Relationship of Different Domains of Physical Activity Practice with Health-Related Quality of Life among Community-Dwelling Older People: A Cross-Sectional Study. BMJ Open 2019, 9, e027751. [Google Scholar] [CrossRef]
- Bădicu, G. Physical Activity and Health-Related Quality of Life in Adults from Braşov, Romania. Educ. Sci. 2018, 8, 52. [Google Scholar] [CrossRef]
- Subramaniam, M.; Zhang, Y.; Lau, J.H.; Vaingankar, J.A.; Abdin, E.; Chong, S.A.; Lee, E.S. Patterns of Physical Activity and Health-Related Quality of Life amongst Patients with Multimorbidity in a Multi-Ethnic Asian Population. BMC Public Health 2019, 19, 1612. [Google Scholar] [CrossRef]
- The World Health Organization Quality of Life assessment (WHOQOL): Position paper from the World Health Organization. Soc. Sci. Med. 1995, 41, 1403–1409. [CrossRef]
- Schwimmer, J.B.; Burwinkle, T.M.; Varni, J.W. Health-related quality of life of severely obese children and adolescents. JAMA 2003, 289, 1813–1819. [Google Scholar] [CrossRef]
- Jayasinghe, U.W.; Harris, M.F.; Parker, S.M.; Litt, J.; van Driel, M.; Mazza, D.; Del Mar, C.; Lloyd, J.; Smith, J.; Zwar, N.; et al. Preventive Evidence into Practice (PEP) Partnership Group. The impact of health literacy and life style risk factors on health-related quality of life of Australian patients. Health Qual. Life Outcomes 2016, 14, 68. [Google Scholar] [CrossRef]
- Fone, D.; Dunstan, F.; Lloyd, K.; Williams, G.; Watkins, J.; Palmer, S. Does social cohesion modify the association between area income deprivation and mental health? A multilevel analysis. Int. J. Epidemiol. 2007, 36, 338–345. [Google Scholar] [CrossRef]
- Keles, H.; Ekici, A.; Ekici, M.; Bulcun, E.; Altinkaya, V. Effect of chronic diseases and associated psychological distress on health-related quality of life. Intern. Med. J. 2007, 37, 6–11. [Google Scholar] [CrossRef] [PubMed]
- Ruiz-Comellas, A.; Valmaña, G.S.; Catalina, Q.M.; Baena, I.G.; Peña, J.M.; Poch, P.R.; Carrera, A.S.; Pujol, I.C.; Solà, C.; Gamisans, M.F.; et al. Effects of Physical Activity Interventions in the Elderly with Anxiety, Depression, and Low Social Support: A Clinical Multicentre Randomised Trial. Healthcare 2022, 10, 2203. [Google Scholar] [CrossRef] [PubMed]
- Fishwick, D.; Lewis, L.; Darby, A.; Young, C.; Wiggans, R.; Waterhouse, J.; Wight, J.; Blanc, P.D. Determinants of health-related quality of life among residents with and without COPD in a historically industrialised area. Int. Arch. Occup. Environ. Health 2015, 88, 799–805. [Google Scholar] [CrossRef] [PubMed][Green Version]
- Tan, Z.; Liang, Y.; Liu, S.; Cao, W.; Tu, H.; Guo, L.; Xu, Y. Health-related quality of life as measured with EQ-5D among populations with and without specific chronic conditions: A population-based survey in Shaanxi Province, China. PLoS ONE 2013, 8, e65958. [Google Scholar] [CrossRef]
- Jang, E.S.; Kim, Y.S.; Kim, K.A.; Lee, Y.J.; Chung, W.J.; Kim, I.H.; Lee, B.S.; Jeong, S.H. Factors Associated with Health-Related Quality of Life in Korean Patients with Chronic Hepatitis C Infection Using the SF-36 and EQ-5D. Gut Liver 2018, 12, 440–448. [Google Scholar] [CrossRef]
- Liu, L.; Li, S.; Wang, M.; Chen, G. Comparison of EQ-5D-5L health state utilities using four country-specific tariffs on a breast cancer patient sample in mainland China. Patient Prefer. Adherence 2017, 23, 1049–1056. [Google Scholar] [CrossRef]
- Kim, S.; Kwon, Y.M.; Park, Y.I. Association between Physical Activity and Health-Related Quality of Life in Korean: The Korea National Health and Nutrition Examination Survey IV. Korean J. Fam. Med. 2014, 35, 152–159. [Google Scholar] [CrossRef]
- Son, M.; Sung, H.; Kim, Y. The Association between Resistance Exercise Frequency, Aerobic Physical Activity Level, and Health-Related Quality of Life in Korean Older Adults: Findings from the Seventh Korea National Health and Nutrition Examination Survey, 2018. Korean J. Sports Med. 2021, 39, 19–26. [Google Scholar] [CrossRef]
- Lee, S.N.; Lee, H.S.; Lee, S.W.; Shim, K.W.; Song, G.Y.; Byun, A.R. Association between Physical Activity and Health-Related Quality of Life in Korean Patients with Diabetes Mellitus. Korean J. Fam. Pract. 2020, 10, 60–67. [Google Scholar] [CrossRef]
- Ryu, M.; Lee, S.; Kim, H.; Baek, W.-C.; Kimm, H. Effect of Aerobic Physical Activity on Health-Related Quality of Life in Middle Aged Women with Osteoarthritis: Korea National Health and Nutrition Examination Survey (2016–2017). Int. J. Environ. Res. Public Health 2020, 17, 527. [Google Scholar] [CrossRef]
- Kong, K.A.; Kim, Y.E.; Lim, S.; Kim, B.Y.; Kim, G.E.; Kim, S.I. Depressive Symptoms and Suicidal Ideation in Individuals Living Alone in South Korea. Diagnostics 2022, 12, 603. [Google Scholar] [CrossRef] [PubMed]
- Kim, Y.-R. Mediating Effect of Self-Cognitive Oral Health Status on the Effect of Obstructive Sleep Apnea Risk Factors on Quality of Life (HINT-8) in Middle-Aged Korean Women: The Korea National Health and Nutrition Examination Survey. Life 2022, 12, 1569. [Google Scholar] [CrossRef]
- Lee, J.E.; Ahn, J.H. A study on deriving a conversion formulae using mapping between HINT-8 and EQ-5D instruments. Korean J. Health Econ. Policy 2019, 25, 77–103. [Google Scholar]
- Seo, J.; An, S.; Kim, D. Effect of Physical Activity on Health-Related Quality of Life of Older Adults Using Newly Developed Health-Related Quality of Life Tool for the Korean Population. Healthcare 2023, 11, 2192. [Google Scholar] [CrossRef] [PubMed]
- Jang, K.-A.; Kim, Y.-R. Effects of Muscular Strength Training on Oral Health and Quality of Life: Using Korean Panel Survey Data, a Cross-Sectional Study. Healthcare 2023, 11, 2250. [Google Scholar] [CrossRef] [PubMed]
- Global Recommendations on Physical Activity for Health. Available online: https://www.who.int/publications/i/item/9789241599979 (accessed on 1 October 2023).
- Warren, J.M.; Ekelund, U.; Besson, H.; Mezzani, A.; Geladas, N.; Vanhees, L. Assessment of physical activity—A review of methodologies with reference to epidemiological research: A report of the exercise physiology section of the European Association of Cardiovascular Prevention and Rehabilitation. Eur. J. Cardiovasc. Prev. Rehabil. 2010, 17, 127–139. [Google Scholar] [CrossRef]
- Sallis, J.F.; Saelens, B.E. Assessment of physical activity by self-report: Status, limitations, and future directions. Res. Q. Exerc. Sport. 2000, 71 (Suppl. S2), 1–14. [Google Scholar] [CrossRef]
- Prince, S.A.; Adamo, K.B.; Hamel, M.E.; Hardt, J.; Gorber, S.C. A comparison of direct versus self-report measures for assessing physical activity in adults: A systematic review. Int. J. Behav. Nutr. Phys. Act. 2008, 5, 56. [Google Scholar] [CrossRef]
- Ashe, M.C.; Miller, W.C.; Eng, J.J.; Noreau, L.; Physical Activity and Chronic Conditions Research Team. Older adults, chronic disease and leisure-time physical activity. Gerontology 2009, 55, 64–72. [Google Scholar] [CrossRef]
- Keats, M.R.; Cui, Y.; DeClercq, V.; Dummer, T.J.B.; Forbes, C.; Grandy, S.A.; Hicks, J.; Sweeney, E.; Yu, Z.M.; Parker, L. Multimorbidity in Atlantic Canada and association with low levels of physical activity. Prev. Med. 2017, 105, 326–331. [Google Scholar] [CrossRef]
- Buman, M.P.; Hekler, E.B.; Haskell, W.L.; Pruitt, L.; Conway, T.L.; Cain, K.L.; Sallis, J.F.; Saelens, B.E.; Frank, L.D.; King, A.C. Objective light-intensity physical activity associations with rated health in older adults. Am. J. Epidemiol. 2010, 172, 1155–1165. [Google Scholar] [CrossRef] [PubMed]


| Domains | Items | Levels of Responses |
|---|---|---|
| Physical health | Stair Climbing | 1. I had no difficulty climbing stairs. |
| 2. I had some difficulty climbing stairs. | ||
| 3. I had a lot of difficulty climbing stairs. | ||
| 4. I couldn’t climb stairs. | ||
| Pain | 1. I had no pain. | |
| 2. I had mild pain. | ||
| 3. I had severe pain. | ||
| 4. I had intense pain. | ||
| Vitality | 1. I always had energy. | |
| 2. I often had energy. | ||
| 3. I sometimes had energy. | ||
| 4. I had no energy at all. | ||
| Social health | Working | 1. I had no difficulty working. |
| 2. I had some difficulty working. | ||
| 3. I had a lot of difficulty working. | ||
| 4. I couldn’t work. | ||
| Mental health | Depression | 1. I was not depressed at all. |
| 2. I was occasionally depressed. | ||
| 3. I was frequently depressed. | ||
| 4. I was always depressed. | ||
| Memory | 1. I had no difficulty remembering. | |
| 2. I had some difficulty remembering. | ||
| 3. I had a lot of difficulty remembering. | ||
| 4. I couldn’t remember at all. | ||
| Sleep | 1. I had no difficulty sleeping. | |
| 2. I had some difficulty sleeping. | ||
| 3. I had a lot of difficulty sleeping. | ||
| 4. I couldn’t sleep well. | ||
| Positive health | Happiness | 1. I was always happy. |
| 2. I was often happy. | ||
| 3. I was occasionally happy. | ||
| 4. I was not happy at all. |
| Men (n = 1941) | Women (n = 2416) | Total (n = 4357) | ||
|---|---|---|---|---|
| Age (Years Old) | 44 (33–55) | 46 (35–55) | 45 (35–55) | |
| Age groups (range) | ||||
| Young adults (19–34 years) | 536 (27.6%) | 538 (22.3%) | 1074 (24.6%) | |
| Early middle-aged adults (35–49 years) | 698 (36%) | 892 (36.9%) | 1590 (36.5%) | |
| Late middle-aged adults (50–64 years) | 707 (36.4%) | 986 (40.8%) | 1693 (38.9%) | |
| Height (cm) | 172.8 (168.6–177) | 159.7 (155.5–163.5) | 165 (158.9–172.1) | |
| Weight (kg) | 72.8 (65.8–80.7) | 57.5 (52.5–64) | 63.8 (55.9–73.9) | |
| BMI (kg/m2) | 24.4 (22.4–26.7) | 22.7 (20.6–25.1) | 23.5 (21.3–26) | |
| <23 | 611 (31.5%) | 1327 (54.9%) | 1938 (44.5%) | |
| 23–25 | 487 (25.1%) | 463 (19.2%) | 950 (21.8%) | |
| >25 | 843 (43.4%) | 626 (25.9%) | 1469 (33.7%) | |
| Levels of education | ||||
| Elementary school graduates | 68 (3.5%) | 174 (7.2%) | 242 (5.6%) | |
| Middle school graduates | 125 (6.4%) | 181 (7.5%) | 306 (7%) | |
| High school graduates | 759 (39.1%) | 919 (38%) | 1678 (38.5%) | |
| ≥College or university graduates | 989 (51%) | 1142 (47.3%) | 2131 (48.9%) | |
| Monthly household income (KRW) | ||||
| Low | 165 (8.5%) | 238 (9.9%) | 403 (9.2%) | |
| Middle low | 452 (23.3%) | 609 (25.2%) | 1061 (24.4%) | |
| Middle high | 571 (29.4%) | 692 (28.6%) | 1263 (29%) | |
| High | 753 (38.8%) | 877 (36.3%) | 1630 (37.4%) | |
| Economic activities | ||||
| Yes | 1590 (81.9%) | 1452 (60.1%) | 3042 (69.8%) | |
| No | 351 (18.1%) | 964 (39.9%) | 1315 (30.2%) | |
| Marital status | ||||
| Married | 1360 (70.1%) | 1985 (82.2%) | 3345 (76.8%) | |
| Others | 581 (29.9%) | 431 (17.8%) | 1012 (23.2%) | |
| Smoking status | ||||
| Non-smokers | 488 (25.1%) | 2068 (85.6%) | 2556 (58.7%) | |
| Ex-smokers | 727 (37.5%) | 200 (8.3%) | 927 (21.3%) | |
| Smokers | 726 (37.4%) | 148 (6.1%) | 874 (20.1%) | |
| Alcohol intake | ||||
| Abstinent | 233 (12%) | 641 (26.5%) | 874 (20.1%) | |
| Low moderate | 479 (24.7%) | 926 (38.3%) | 1405 (32.2%) | |
| Occasional | 574 (29.6%) | 514 (21.3%) | 1088 (25%) | |
| Frequent | 655 (33.7%) | 335 (13.9%) | 990 (22.7%) | |
| Medical history | ||||
| Hypertension | 316 (16.3%) | 297 (12.3%) | 613 (14.1%) | |
| Diabetes mellitus | 136 (7%) | 105 (4.3%) | 241 (5.5%) | |
| Dyslipidemia | 241 (12.4%) | 343 (14.2%) | 584 (13.4%) | |
| Cerebrovascular diseases | 26 (1.3%) | 15 (0.6%) | 41 (0.9%) | |
| Ischemic heart diseases | 38 (2%) | 11 (0.5%) | 49 (1.1%) | |
| Adherence to PA guidelines | ||||
| MVPA (≥500 MET-min/week) | 516 (26.6%) | 346 (14.3%) | 862 (19.8%) | |
| Strengthening (≥2 days/week) | 631 (32.5%) | 372 (15.4%) | 1003 (23%) | |
| MVPA categories | ||||
| Inactive | 1154 (59.5%) | 1782 (73.8%) | 2936 (67.4%) | |
| Insufficiently active | 271 (14%) | 288 (11.9%) | 559 (12.8%) | |
| Active | 203 (10.5%) | 166 (6.9%) | 369 (8.5%) | |
| Highly active | 313 (16.1%) | 180 (7.5%) | 493 (11.3%) | |
| Unadjusted Model | ||||||||
|---|---|---|---|---|---|---|---|---|
| B | SE | Wald χ2 | Exp (β) | Percentile Difference (%) | 95% CI | p-Value | ||
| Leisure-related PA | ||||||||
| <500 MET-min/week | Ref. | |||||||
| ≥500 MET-min/week | 0.025 | 0.0038 | 41.8 | 1.025 | 2.510 | (1.017–1.033) | <0.001 | |
| Adjusted Model | ||||||||
|---|---|---|---|---|---|---|---|---|
| B | SE | Wald χ2 | Exp (β) | Percentile Difference (%) | 95% CI | p-Value | ||
| Leisure-related PA | ||||||||
| <500 MET-min/week | Ref. | |||||||
| ≥500 MET-min/week | 0.013 | 0.0037 | 11.5 | 1.013 | 1.27 | (1.005–1.02) | 0.001 | |
| Sex | ||||||||
| Men | Ref. | |||||||
| Women | −0.039 | 0.0039 | 97.6 | 0.962 | −3.82 | (0.954–0.969) | <0.001 | |
| Age (years old) | ||||||||
| 19–34 | Ref. | |||||||
| 35–49 | −0.014 | 0.0048 | 8.9 | 0.986 | −1.41 | (0.977–0.995) | 0.003 | |
| 50–64 | −0.022 | 0.0053 | 17.7 | 0.978 | −2.22 | (0.968–0.988) | <0.001 | |
| Levels of education | ||||||||
| Elementary school graduates | Ref. | |||||||
| Middle school graduates | 0.017 | 0.0083 | 4.0 | 1.017 | 1.67 | (1–1.033) | 0.046 | |
| High school graduates | 0.043 | 0.0070 | 37.8 | 1.044 | 4.37 | (1.03–1.058) | <0.001 | |
| ≥College or university graduates | 0.045 | 0.0072 | 38.4 | 1.046 | 4.56 | (1.031–1.06) | <0.001 | |
| Monthly household income | ||||||||
| Low | Ref. | |||||||
| Mid-low | 0.023 | 0.0057 | 16.8 | 1.024 | 2.37 | (1.012–1.035) | <0.001 | |
| Mid-high | 0.035 | 0.0057 | 38.5 | 1.036 | 3.59 | (1.024–1.047) | <0.001 | |
| High | 0.035 | 0.0057 | 37.6 | 1.035 | 3.53 | (1.024–1.047) | <0.001 | |
| Economic activities | ||||||||
| Yes | Ref. | |||||||
| No | −0.016 | 0.0034 | 22.6 | 0.984 | −1.59 | (0.978–0.991) | <0.001 | |
| Marital status | ||||||||
| Married | Ref. | |||||||
| Others | −0.013 | 0.0047 | 7.0 | 0.988 | −1.25 | (0.978–0.997) | 0.008 | |
| Smoking status | ||||||||
| Non-smokers | Ref. | |||||||
| Ex-smokers | −0.013 | 0.0044 | 8.6 | 0.987 | −1.27 | (0.979–0.996) | 0.003 | |
| Smokers | −0.029 | 0.0046 | 38.0 | 0.972 | −2.81 | (0.963–0.981) | <0.001 | |
| Alcohol intake | ||||||||
| Abstinent | Ref. | |||||||
| Low-moderate | 0.001 | 0.0042 | 0.1 | 1.001 | 0.14 | (0.993–1.01) | 0.734 | |
| Occasional | 0.009 | 0.0046 | 3.9 | 1.009 | 0.91 | (1–1.018) | 0.047 | |
| Frequent | 0.005 | 0.0048 | 1.1 | 1.005 | 0.51 | (0.996–1.014) | 0.287 | |
| BMI (kg/m2) | ||||||||
| <23 | Ref. | |||||||
| 23–25 | −0.005 | 0.0039 | 1.7 | 0.995 | −0.50 | (0.988–1.003) | 0.196 | |
| >25 | −0.009 | 0.0035 | 7.2 | 0.991 | −0.93 | (0.984–0.998) | 0.007 | |
| Medical history | ||||||||
| Hypertension | −0.006 | 0.0048 | 1.8 | 0.994 | −0.64 | (0.984–1.003) | 0.181 | |
| Diabetes mellitus | −0.011 | 0.0068 | 2.4 | 0.989 | −1.06 | (0.976–1.003) | 0.120 | |
| Dyslipidemia | −0.017 | 0.0049 | 12.5 | 0.983 | −1.71 | (0.974–0.992) | <0.001 | |
| Cerebrovascular diseases | −0.049 | 0.0151 | 10.6 | 0.952 | −4.81 | (0.924–0.981) | 0.001 | |
| Ischemic heart diseases | −0.023 | 0.0140 | 2.7 | 0.977 | −2.26 | (0.951–1.005) | 0.101 | |
| Unadjusted Model | ||||||||
|---|---|---|---|---|---|---|---|---|
| B | SE | Wald χ2 | Exp (β) | Percentile Difference (%) | 95% CI | p-Value | ||
| MSPA | ||||||||
| <2 days/week | Ref. | |||||||
| ≥2 days/week | 0.022 | 0.0036 | 37.8 | 1.023 | 2.26 | (1.015–1.03) | <0.001 | |
| Adjusted Model | ||||||||
|---|---|---|---|---|---|---|---|---|
| B | SE | Wald χ2 | Exp (β) | Percentile Difference (%) | 95% CI | p-Value | ||
| MSPA | ||||||||
| <2 days/week | Ref. | |||||||
| ≥2 days/week | 0.011 | 0.0035 | 9.0 | 1.011 | 1.06 | (1.004–1.018) | 0.003 | |
| Sex | ||||||||
| Men | Ref. | |||||||
| Women | −0.039 | 0.0040 | 94.9 | 0.962 | −3.79 | (0.955–0.97) | <0.001 | |
| Age (years old) | ||||||||
| 19–34 | Ref. | |||||||
| 35–49 | −0.014 | 0.0048 | 8.8 | 0.986 | −1.40 | (0.977–0.995) | 0.003 | |
| 50–64 | −0.023 | 0.0053 | 18.6 | 0.977 | −2.28 | (0.967–0.987) | <0.001 | |
| Levels of education | ||||||||
| Elementary school graduates | Ref. | |||||||
| Middle school graduates | 0.016 | 0.0083 | 3.5 | 1.016 | 1.57 | (0.999–1.032) | 0.060 | |
| High school graduates | 0.042 | 0.0070 | 36.9 | 1.043 | 4.32 | (1.029–1.058) | <0.001 | |
| ≥College or university graduates | 0.044 | 0.0072 | 37.6 | 1.045 | 4.51 | (1.03–1.06) | <0.001 | |
| Monthly household income | ||||||||
| Low | Ref. | |||||||
| Mid-low | 0.023 | 0.0057 | 16.6 | 1.024 | 2.35 | (1.012–1.035) | <0.001 | |
| Mid-high | 0.035 | 0.0057 | 39.0 | 1.036 | 3.61 | (1.025–1.048) | <0.001 | |
| High | 0.035 | 0.0057 | 38.8 | 1.036 | 3.58 | (1.024–1.047) | <0.001 | |
| Economic activities | ||||||||
| Yes | Ref. | |||||||
| No | −0.016 | 0.0034 | 21.9 | 0.984 | −1.56 | (0.978–0.991) | <0.001 | |
| Marital status | ||||||||
| Married | Ref. | |||||||
| Others | −0.013 | 0.0047 | 7.2 | 0.987 | −1.26 | (0.978–0.997) | 0.007 | |
| Smoking status | ||||||||
| Non-smokers | Ref. | |||||||
| Ex-smokers | −0.013 | 0.0044 | 8.6 | 0.987 | −1.27 | (0.979–0.996) | 0.003 | |
| Smokers | −0.029 | 0.0046 | 38.7 | 0.972 | −2.83 | (0.963–0.981) | <0.001 | |
| Alcohol intake | ||||||||
| Abstinent | Ref. | |||||||
| Low-moderate | 0.002 | 0.0042 | 0.2 | 1.002 | 0.17 | (0.994–1.01) | 0.683 | |
| Occasional | 0.009 | 0.0046 | 4.2 | 1.009 | 0.93 | (1–1.018) | 0.042 | |
| Frequent | 0.005 | 0.0048 | 1.2 | 1.005 | 0.53 | (0.996–1.015) | 0.265 | |
| BMI (kg/m2) | ||||||||
| <23 | Ref. | |||||||
| 23–25 | −0.005 | 0.0039 | 1.5 | 0.995 | −0.47 | (0.988–1.003) | 0.218 | |
| >25 | −0.009 | 0.0035 | 6.5 | 0.991 | −0.88 | (0.984–0.998) | 0.011 | |
| Medical history | ||||||||
| Hypertension | −0.007 | 0.0048 | 1.9 | 0.993 | −0.65 | (0.984–1.003) | 0.169 | |
| Diabetes mellitus | −0.010 | 0.0068 | 2.2 | 0.990 | −1.00 | (0.977–1.003) | 0.141 | |
| Dyslipidemia | −0.017 | 0.0049 | 12.3 | 0.983 | −1.70 | (0.974–0.992) | <0.001 | |
| Cerebrovascular diseases | −0.050 | 0.0151 | 10.8 | 0.952 | −4.84 | (0.924–0.98) | 0.001 | |
| Ischemic heart diseases | −0.021 | 0.0140 | 2.3 | 0.979 | −2.12 | (0.952–1.006) | 0.127 | |
Disclaimer/Publisher’s Note: The statements, opinions and data contained in all publications are solely those of the individual author(s) and contributor(s) and not of MDPI and/or the editor(s). MDPI and/or the editor(s) disclaim responsibility for any injury to people or property resulting from any ideas, methods, instructions or products referred to in the content. |
© 2023 by the authors. Licensee MDPI, Basel, Switzerland. This article is an open access article distributed under the terms and conditions of the Creative Commons Attribution (CC BY) license (https://creativecommons.org/licenses/by/4.0/).
Share and Cite
Jun, M.-G.; Han, S.-H. The Relationship between Physical Activity and Health-Related Quality of Life in Korean Adults: The Eighth Korea National Health and Nutrition Examination Survey. Healthcare 2023, 11, 2861. https://doi.org/10.3390/healthcare11212861
Jun M-G, Han S-H. The Relationship between Physical Activity and Health-Related Quality of Life in Korean Adults: The Eighth Korea National Health and Nutrition Examination Survey. Healthcare. 2023; 11(21):2861. https://doi.org/10.3390/healthcare11212861
Chicago/Turabian StyleJun, Mun-Gyu, and Se-Hyeon Han. 2023. "The Relationship between Physical Activity and Health-Related Quality of Life in Korean Adults: The Eighth Korea National Health and Nutrition Examination Survey" Healthcare 11, no. 21: 2861. https://doi.org/10.3390/healthcare11212861
APA StyleJun, M.-G., & Han, S.-H. (2023). The Relationship between Physical Activity and Health-Related Quality of Life in Korean Adults: The Eighth Korea National Health and Nutrition Examination Survey. Healthcare, 11(21), 2861. https://doi.org/10.3390/healthcare11212861