


A Comparative Study on Deep Learning Models for COVID-19 Forecast
Abstract
:1. Introduction
2. Methods
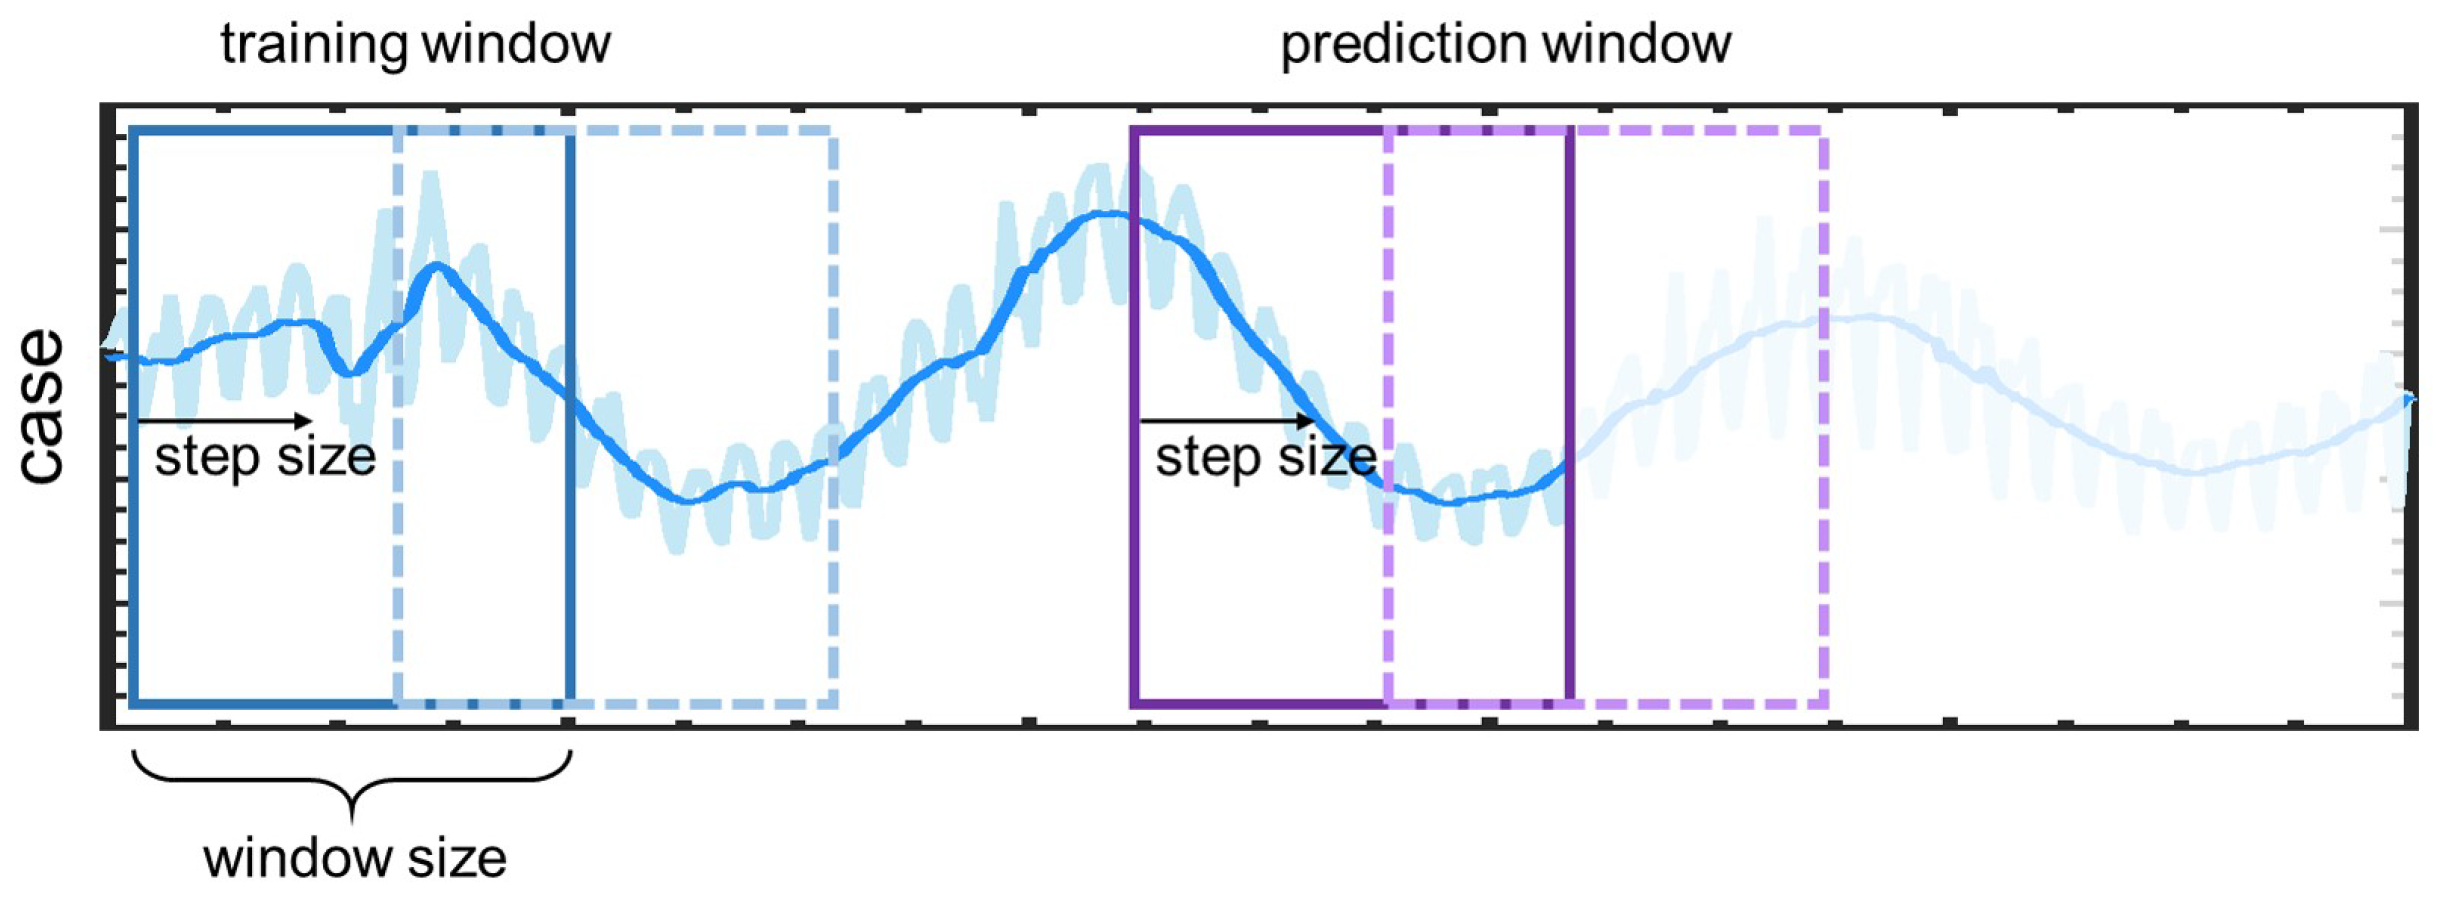
2.1. Problem Setup
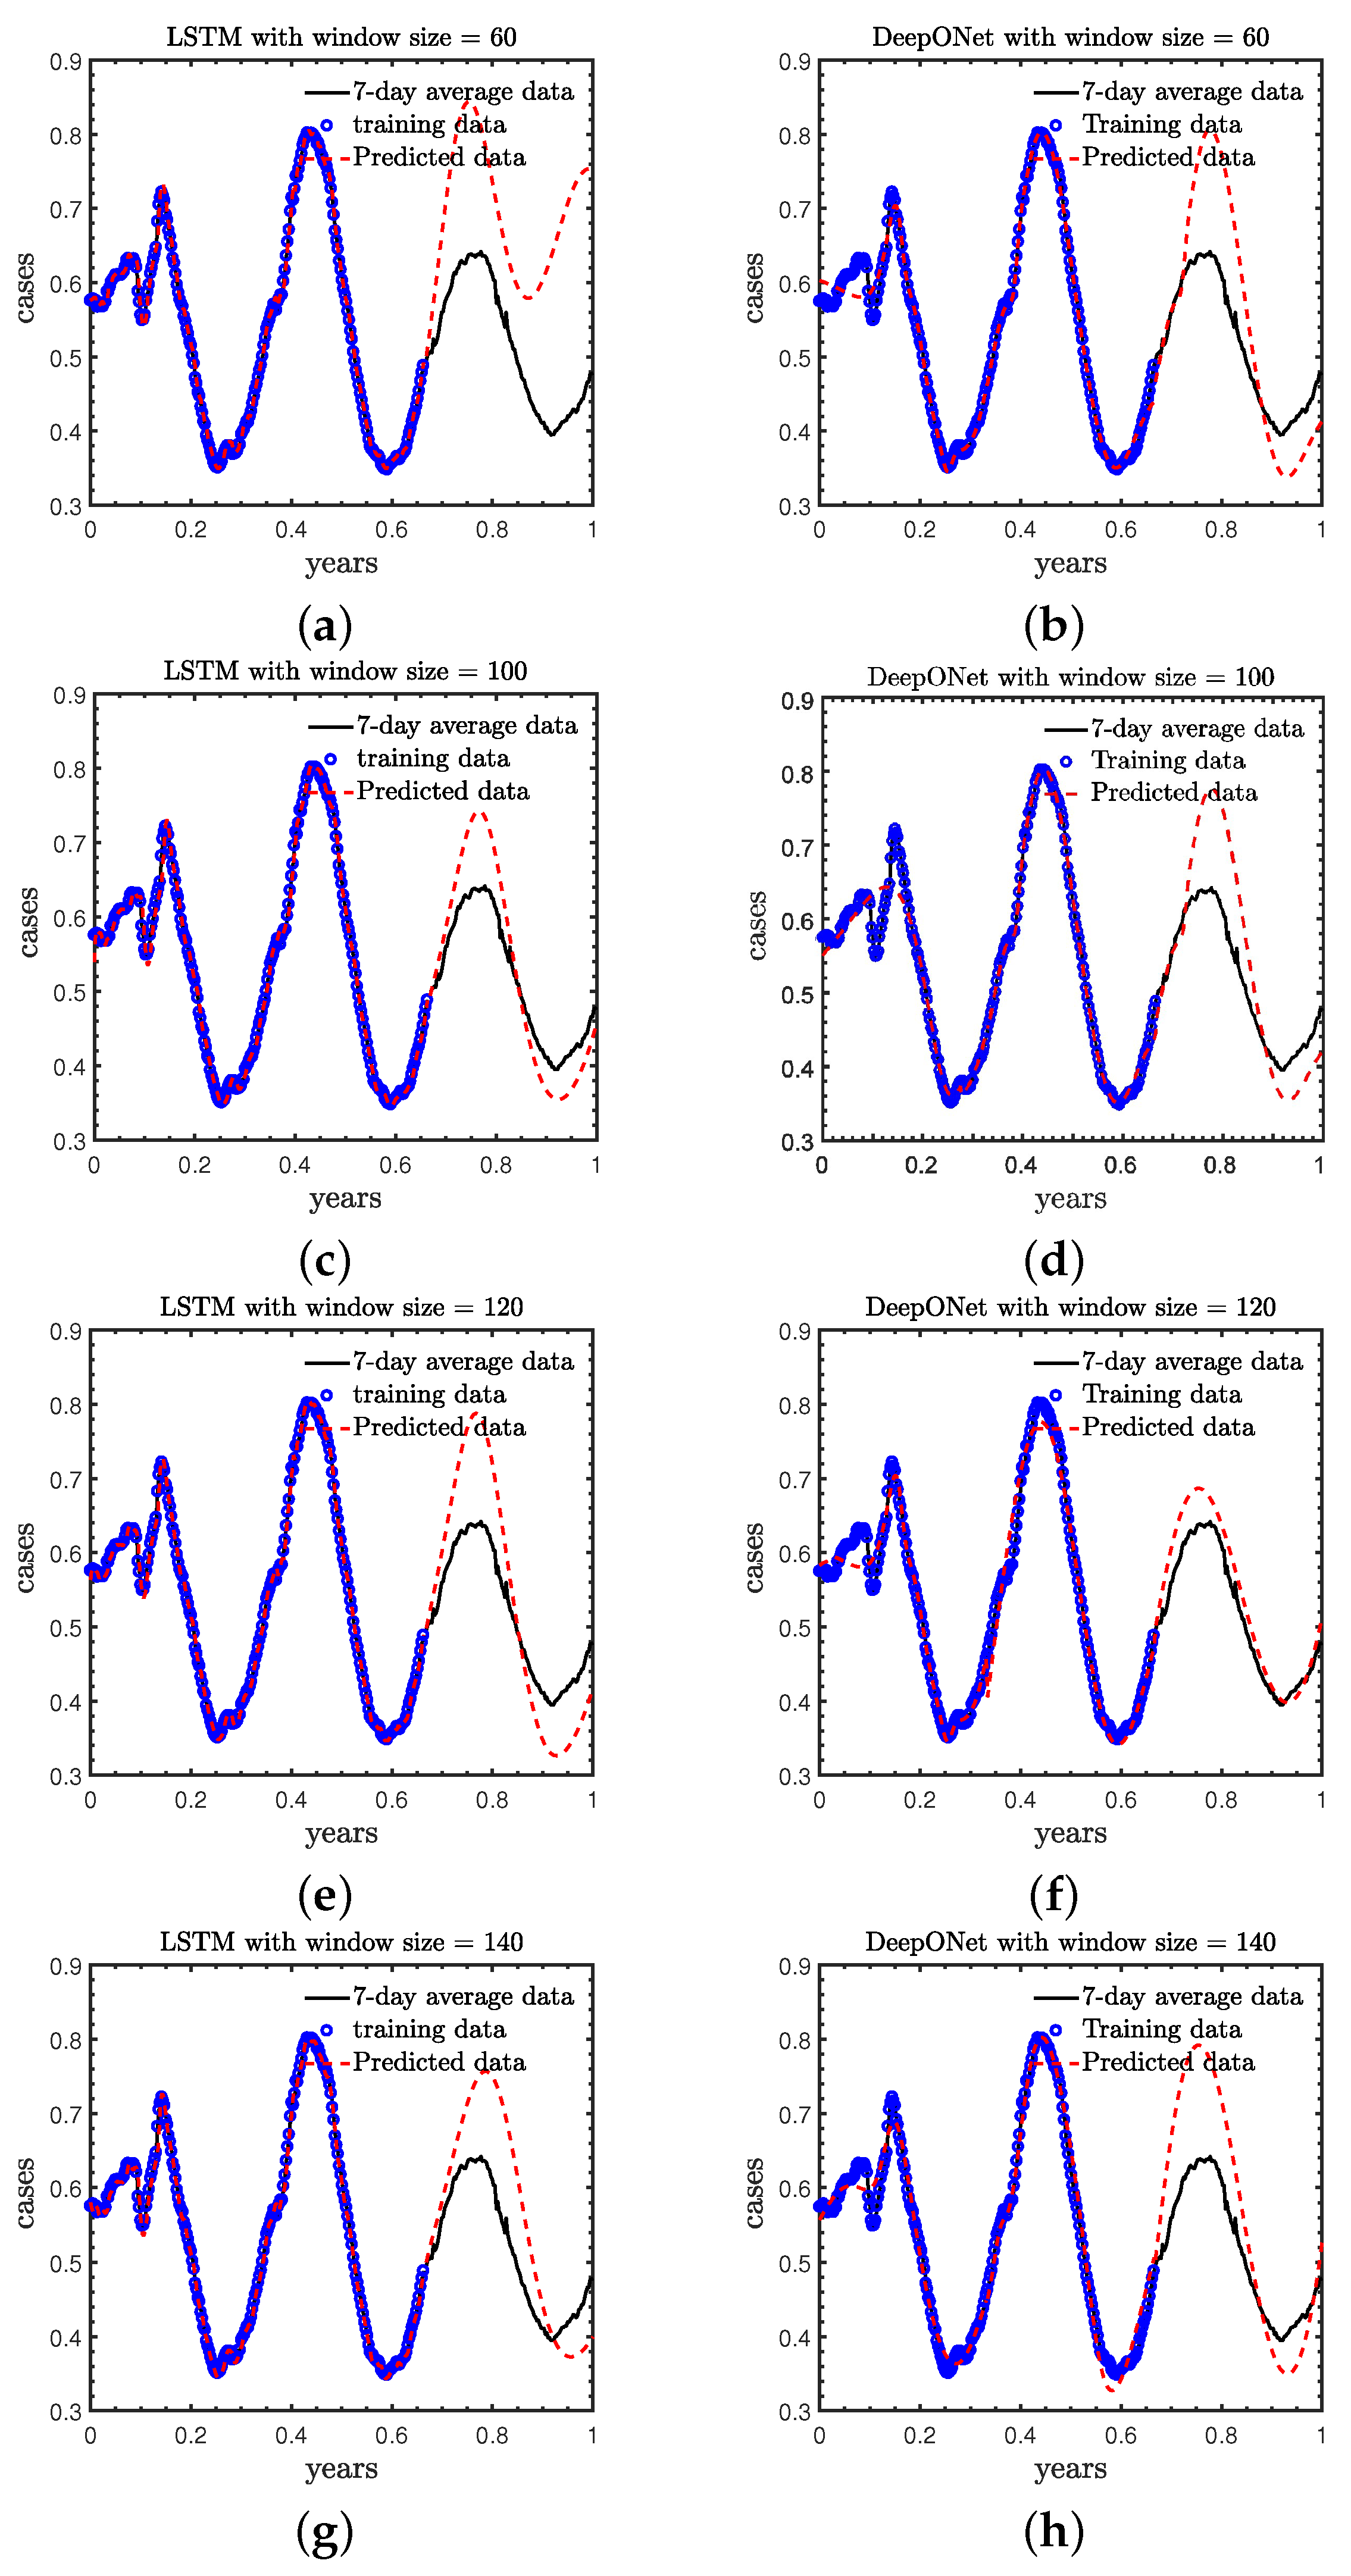
- Case A: we study the effect of the size of sliding windows in LSTM and DeepONet, laying the foundation for selecting window size in subsequent work;
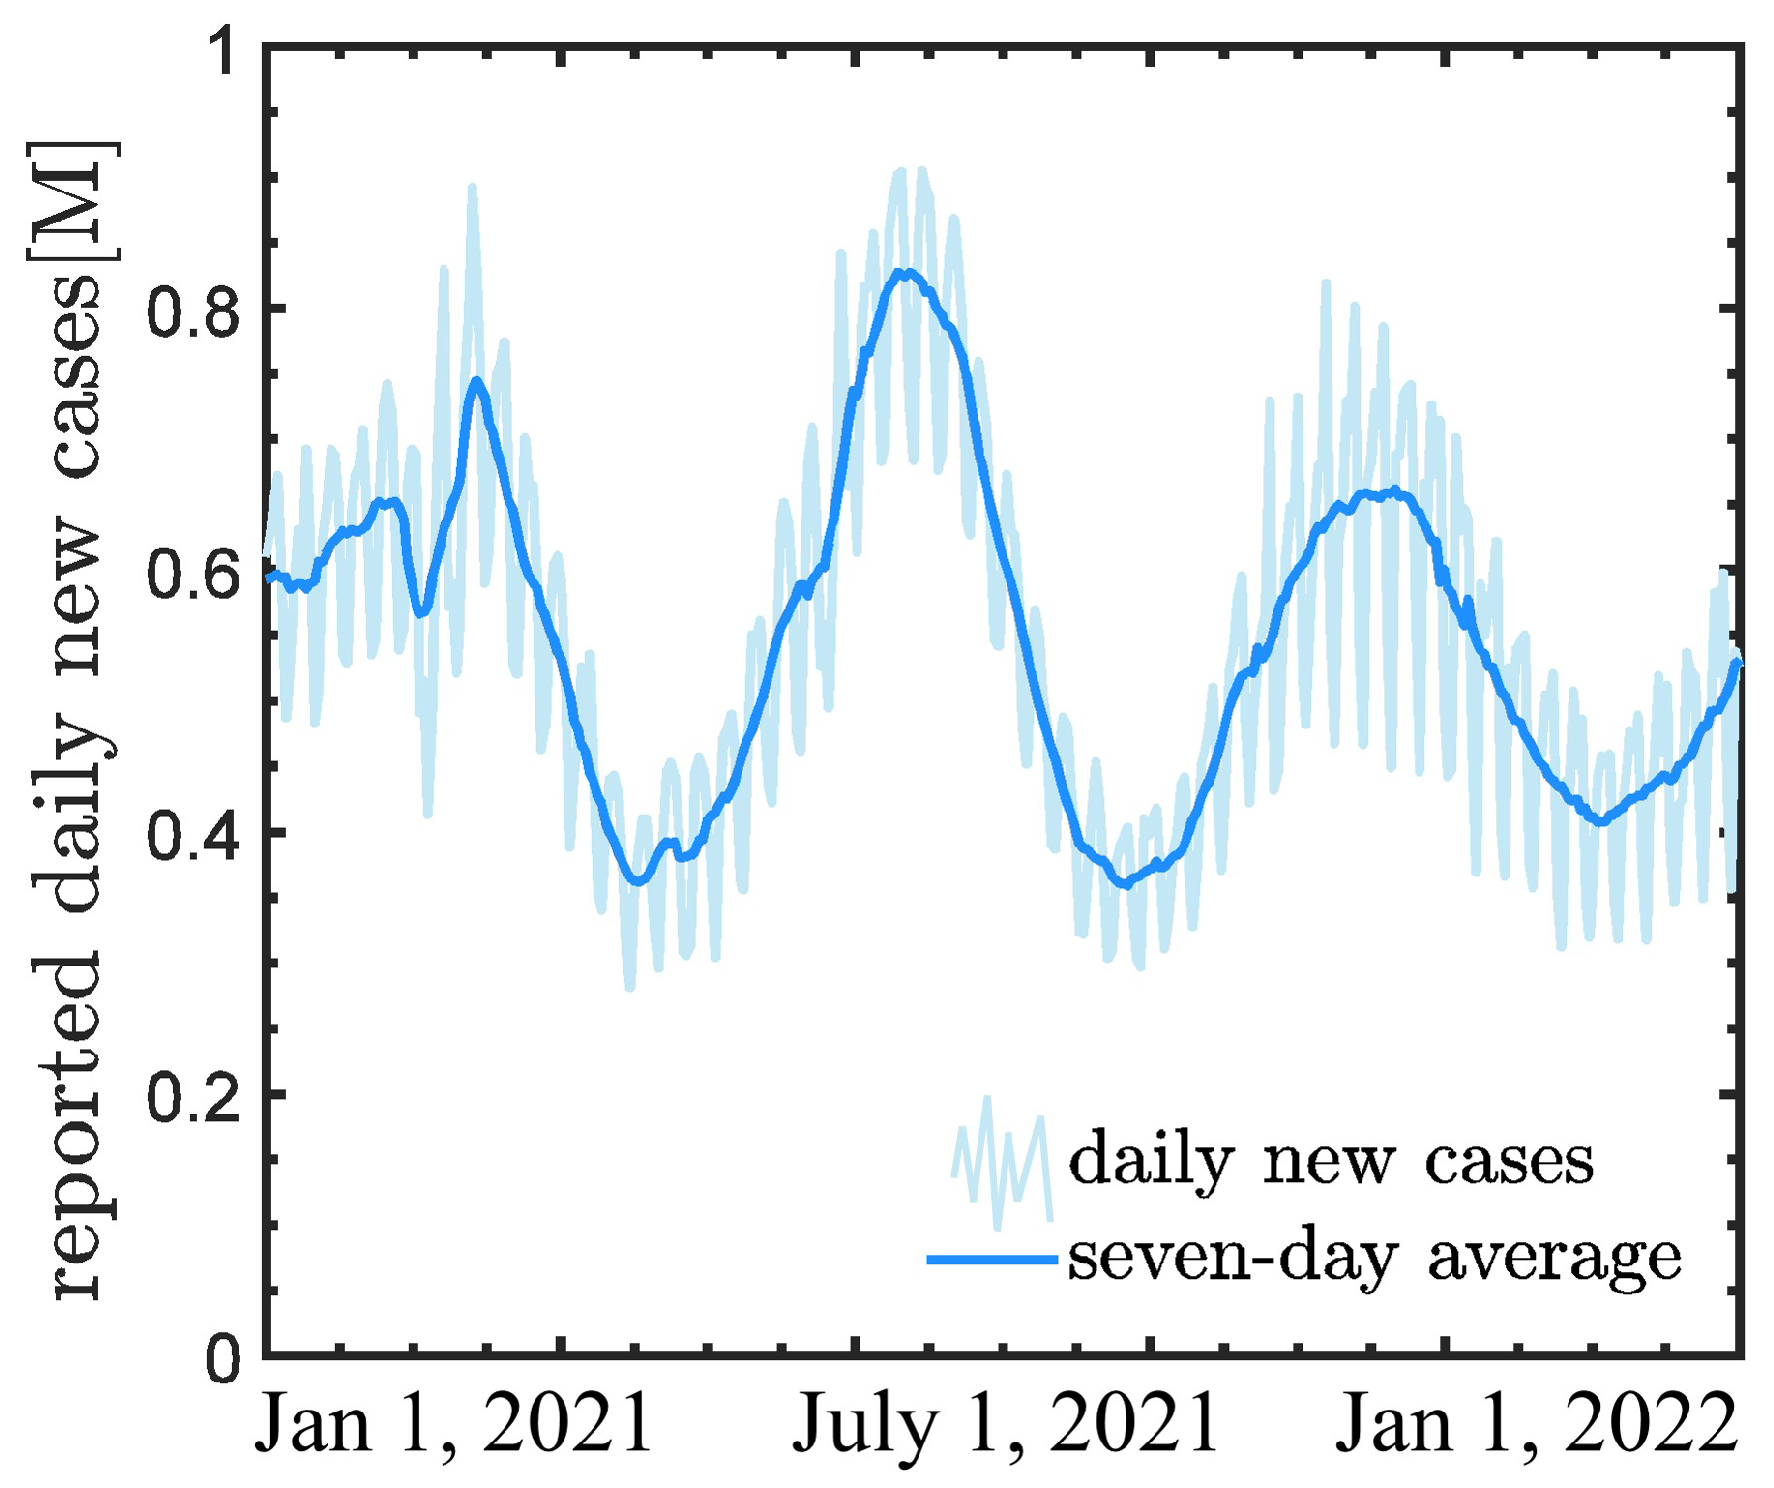
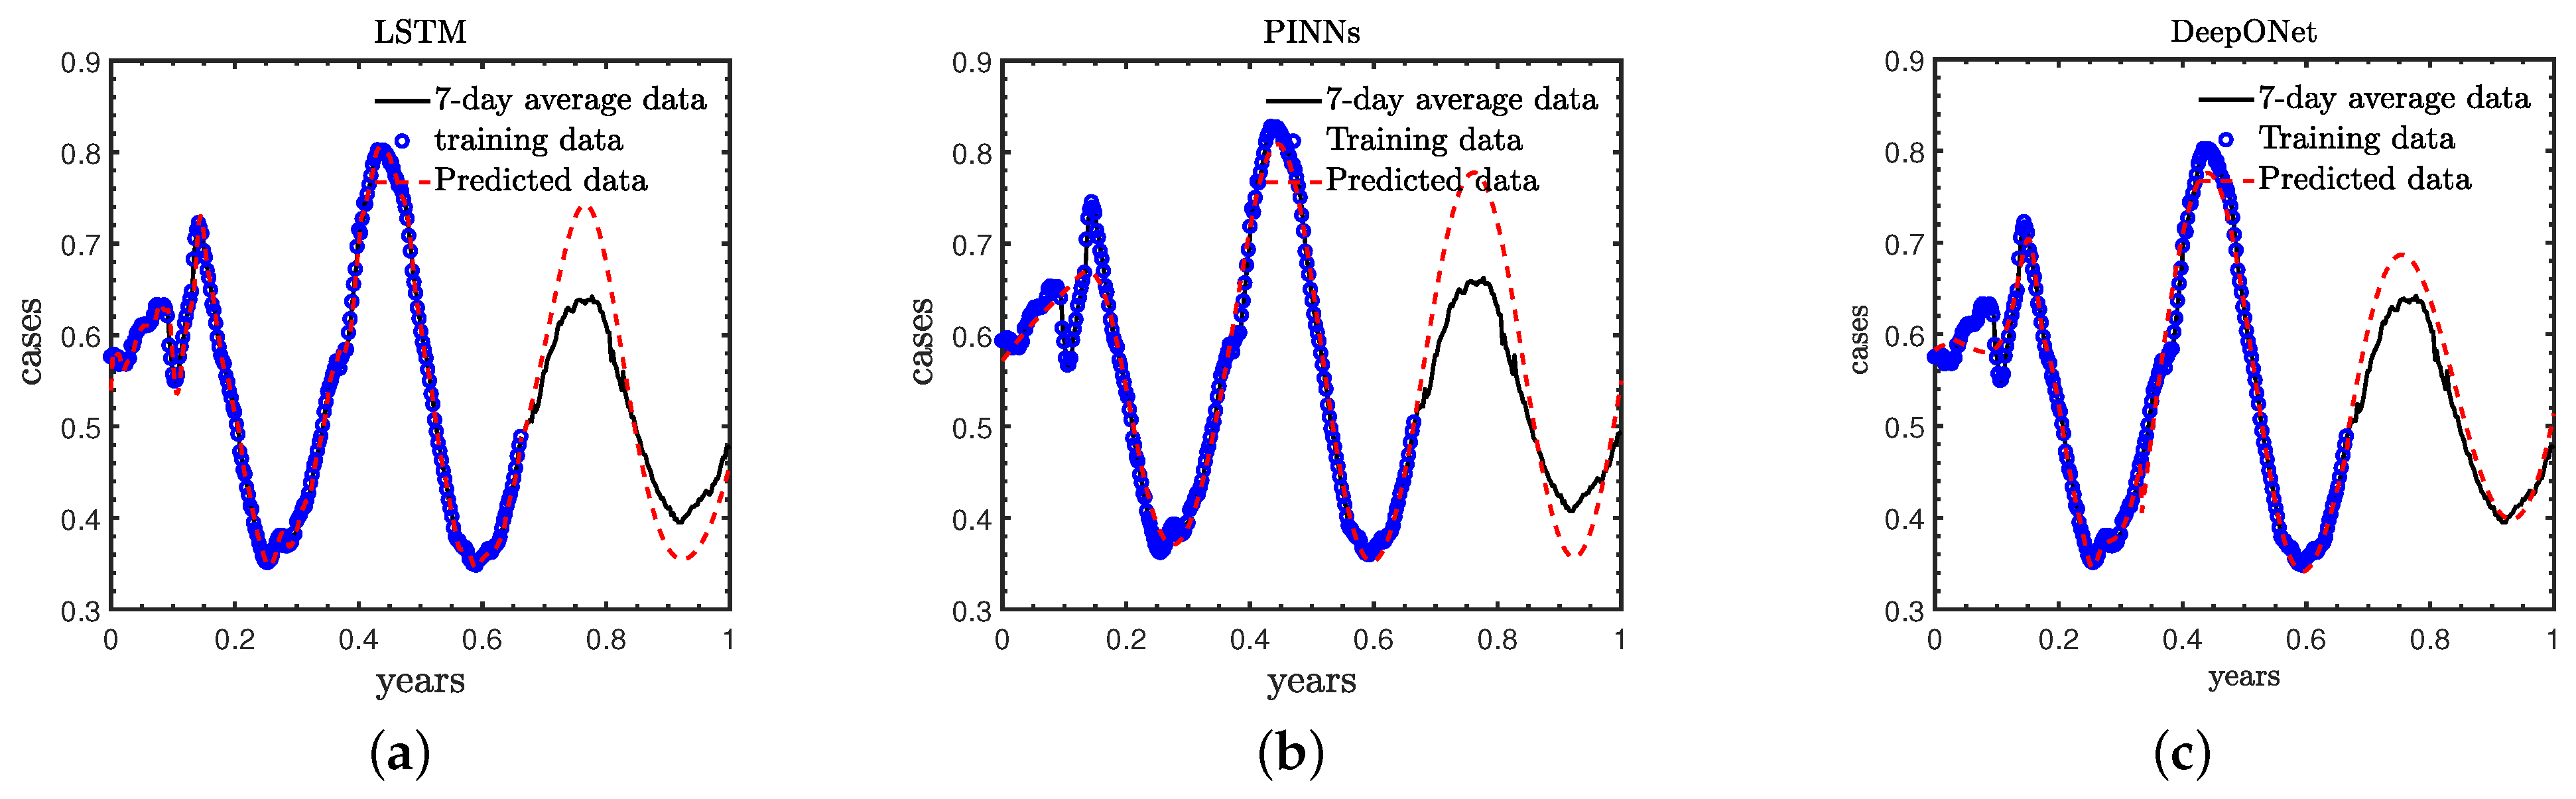
- Case B: We employ the daily new COVID-19 cases in the first 240 days of 2021 as training data, and forecast the new COVID-19 cases in the remaining 120 days, which is referred to as the standard case in this study for comparing the results of these three methods;
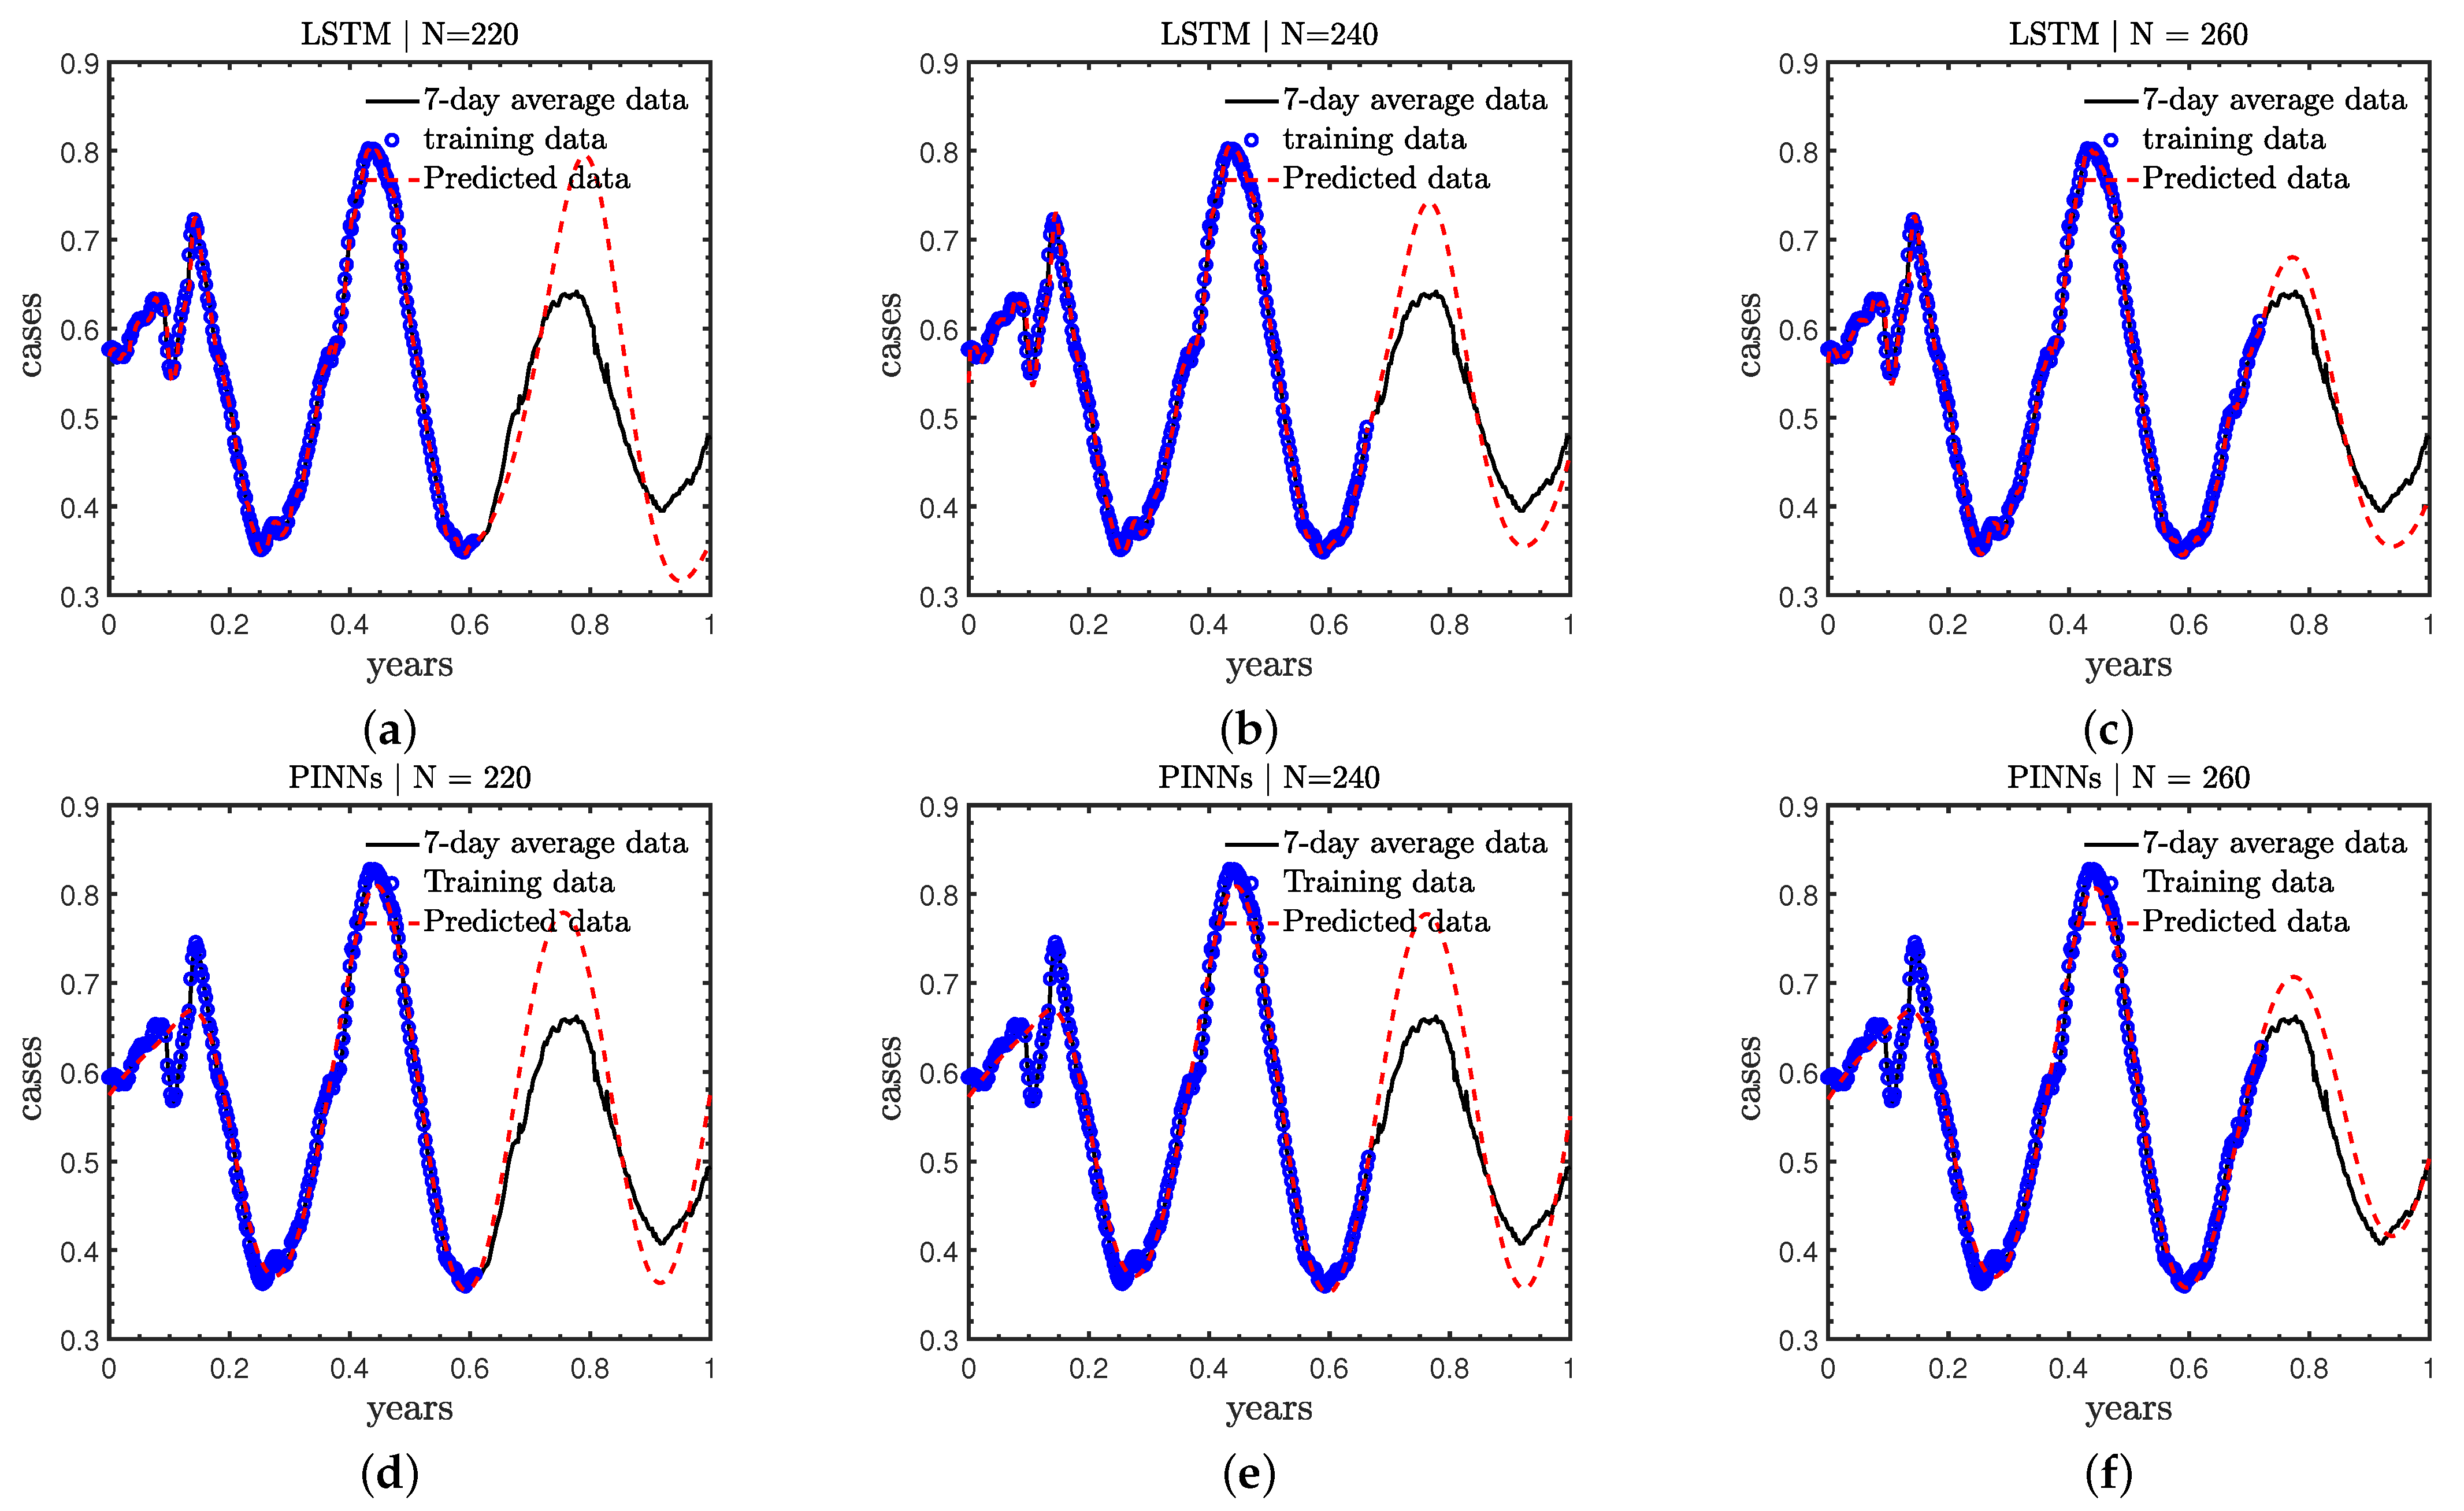
- Case C: The effect of of different numbers of training data on the predicted accuracy is investigated. Particularly, we use the first 220, 240, and 260 days’ new COVID-19 cases as the training data, respectively; and predict the new cases in the remaining days of 2021;
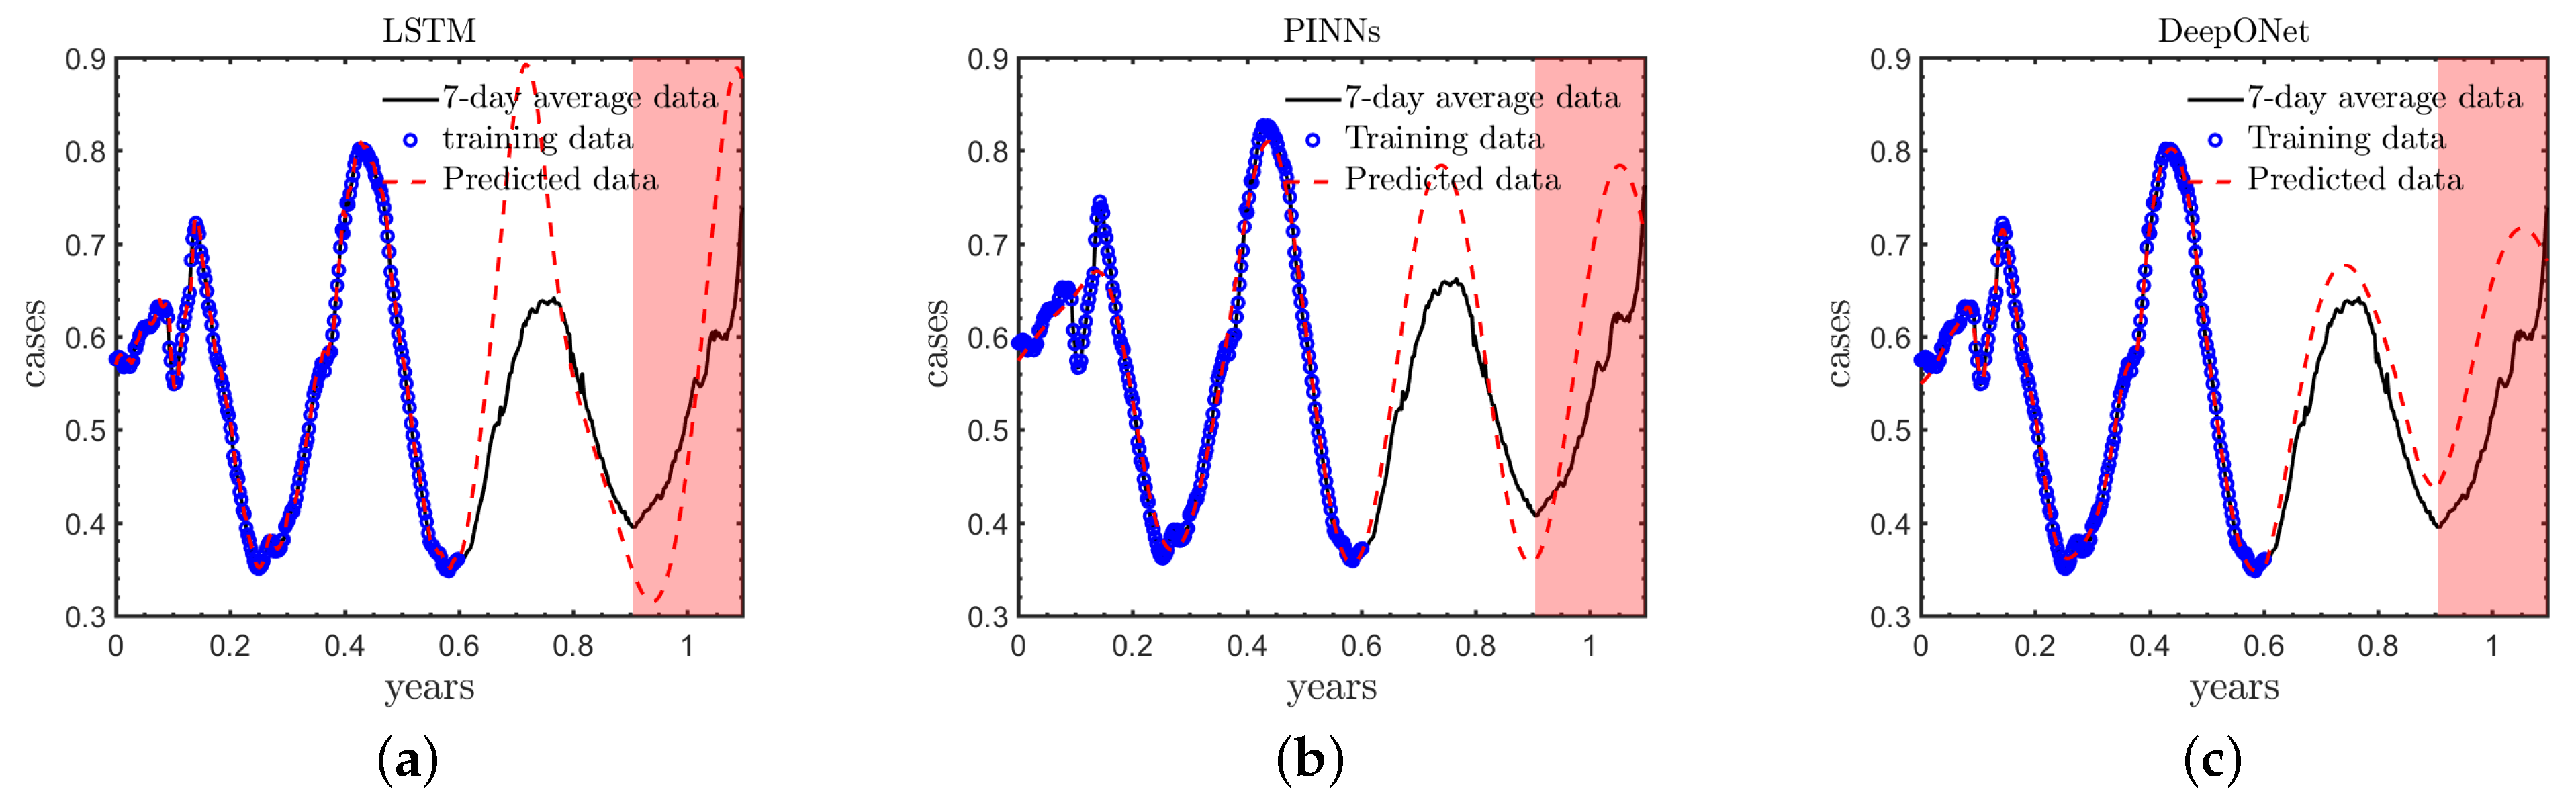
- Case D: This case focuses on the performance of long-term extrapolation in different methods. We employ the COVID-19 cases in the first 220 days of 2021 as the training data, and predict the new cases in the following 180 days rather than 120 days in Case A.
2.2. Deep Learning Models
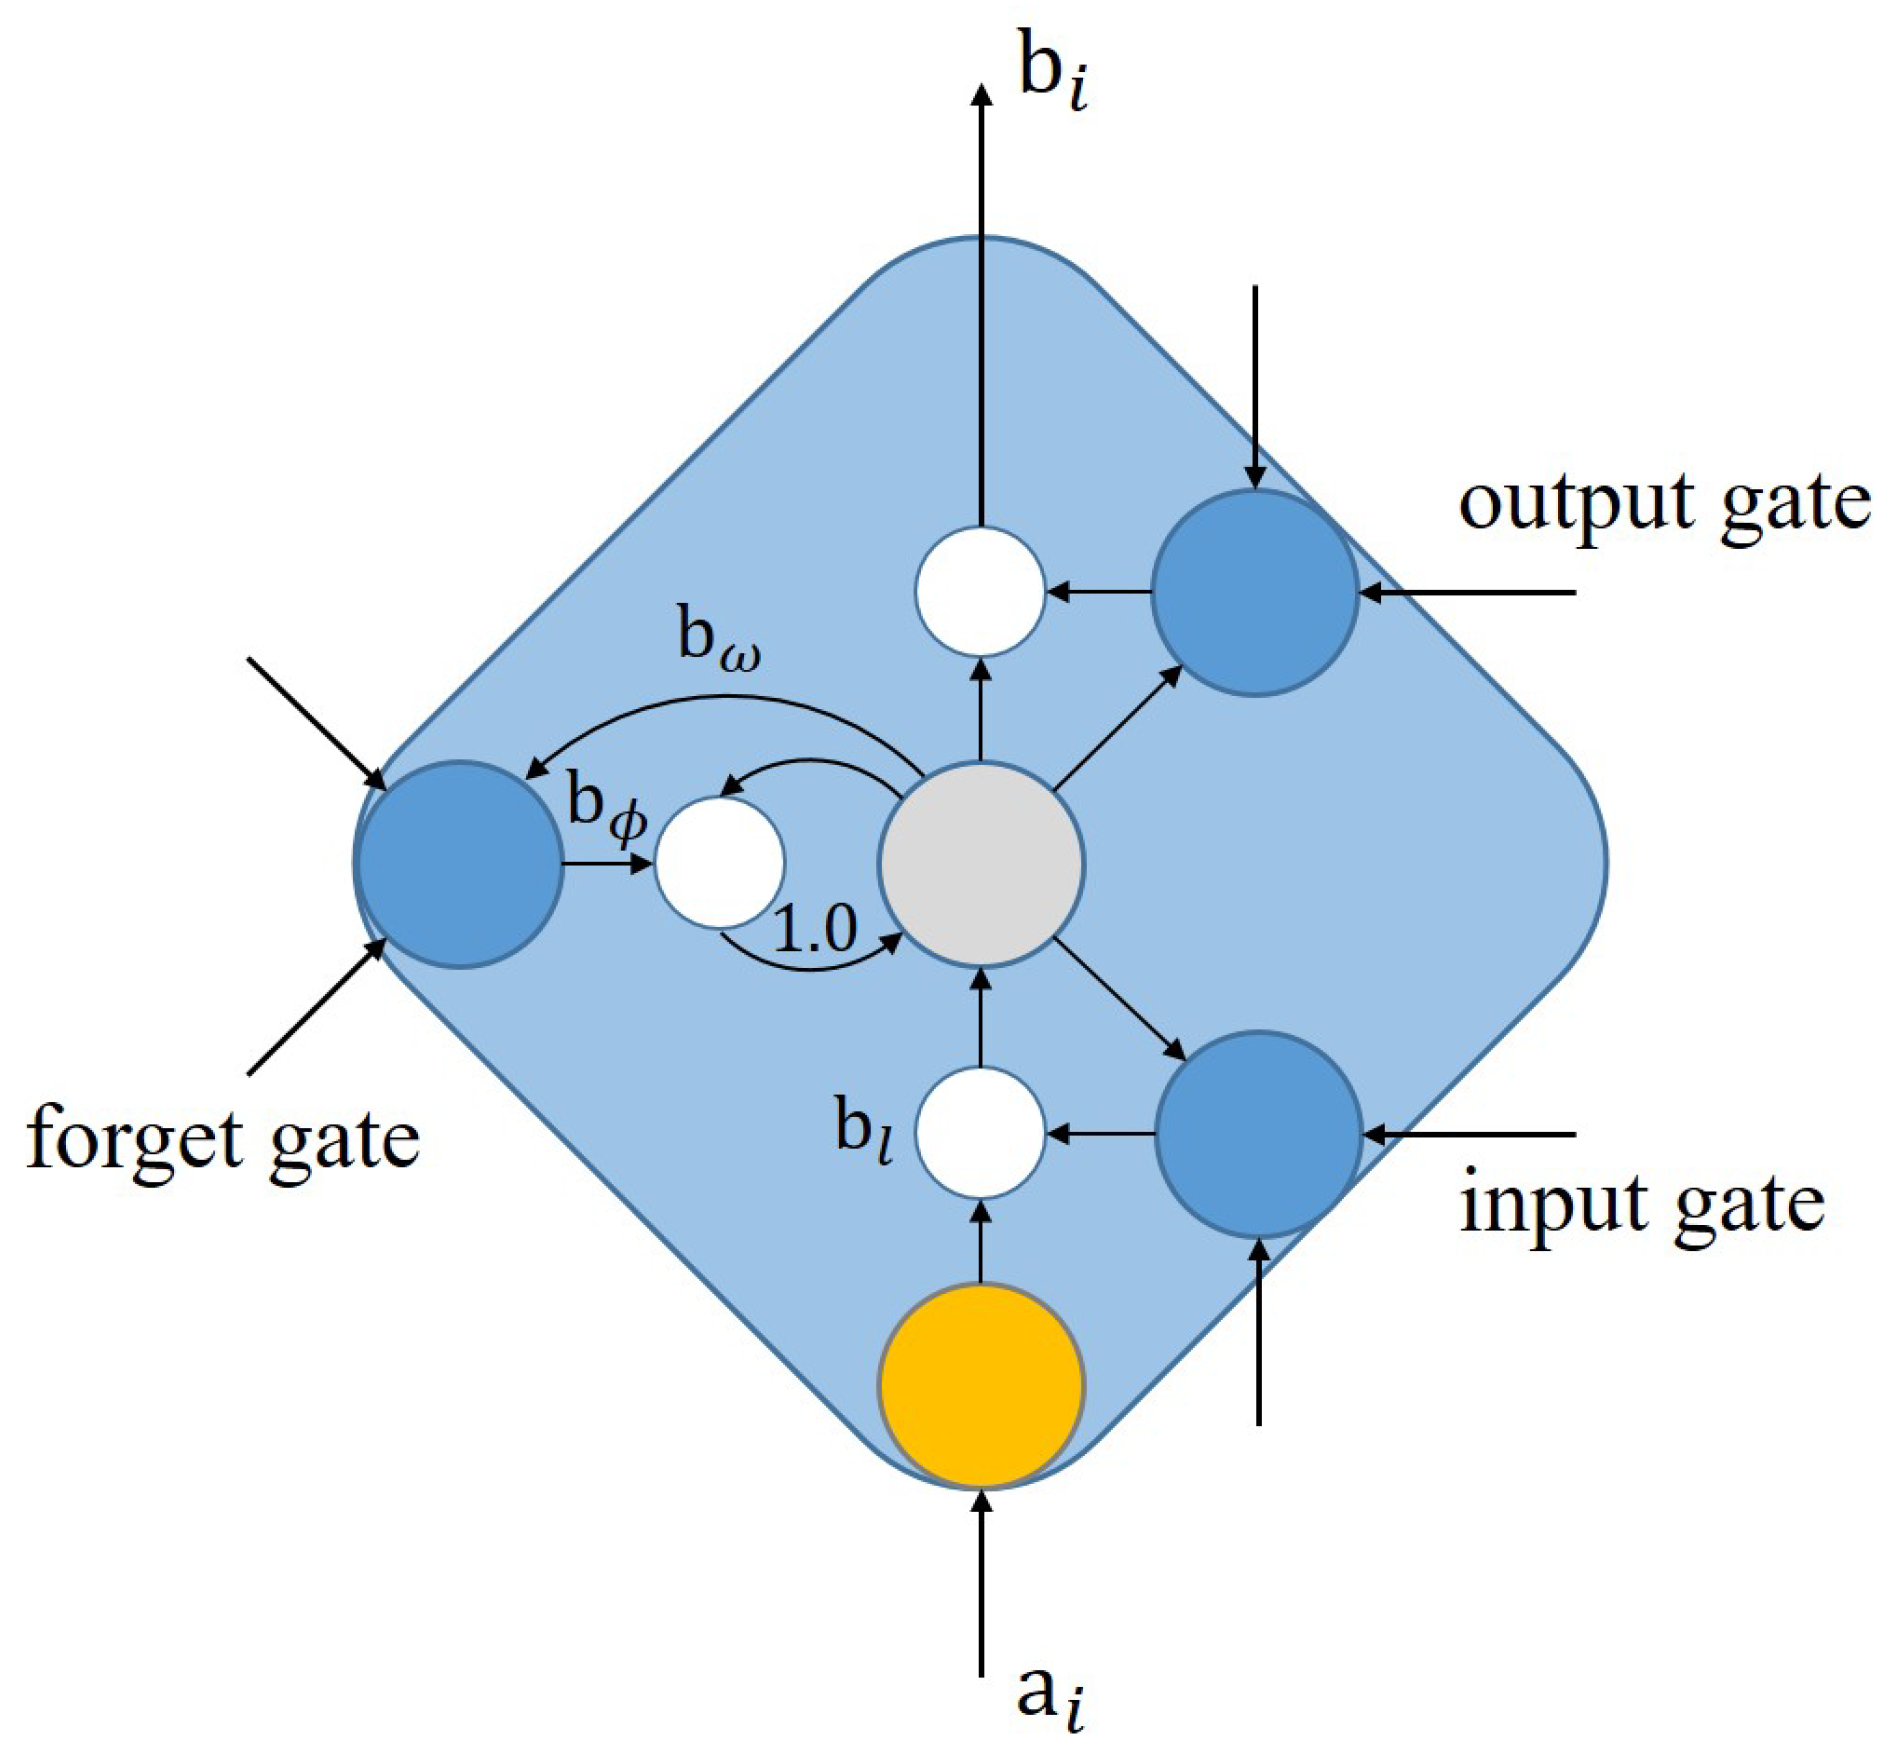
2.2.1. Long Short-Term Memory Model
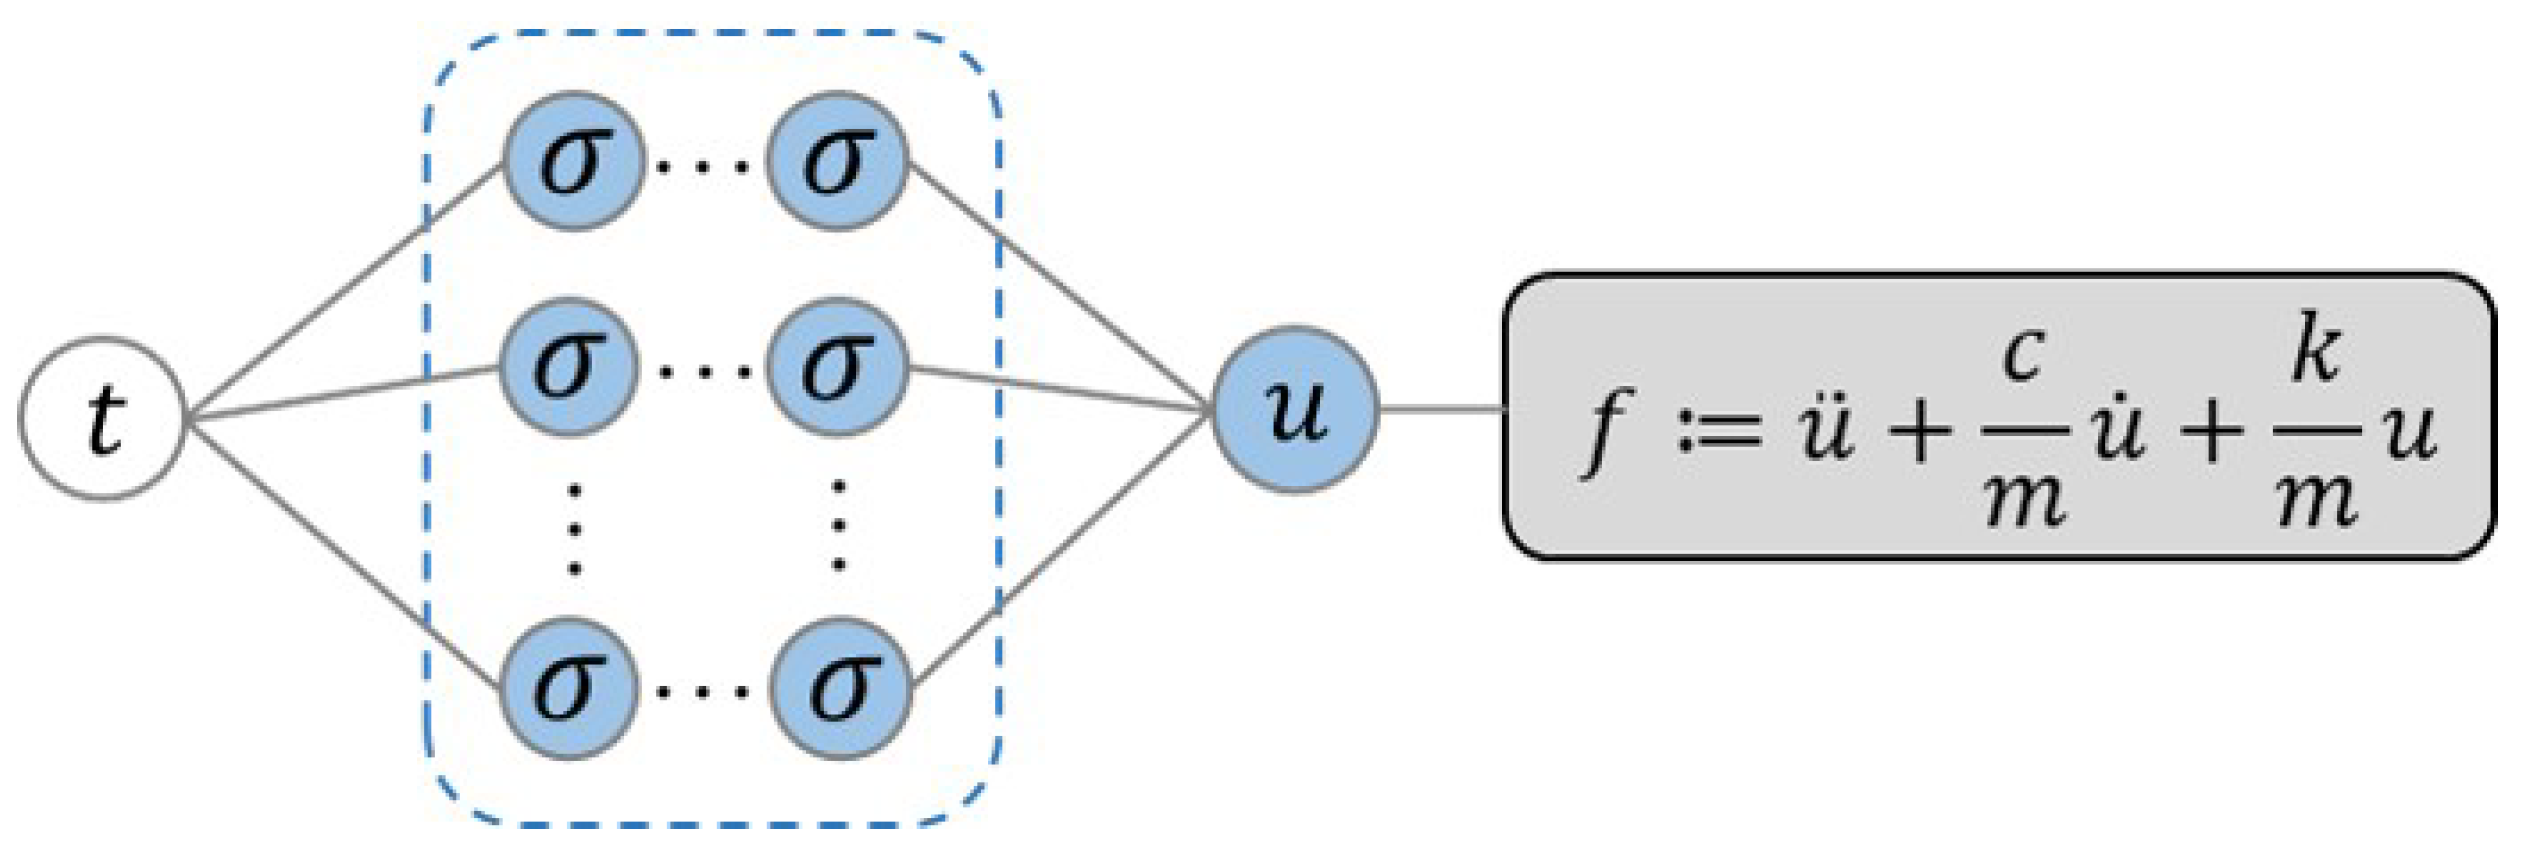
2.2.2. Physics-Informed Neural Networks
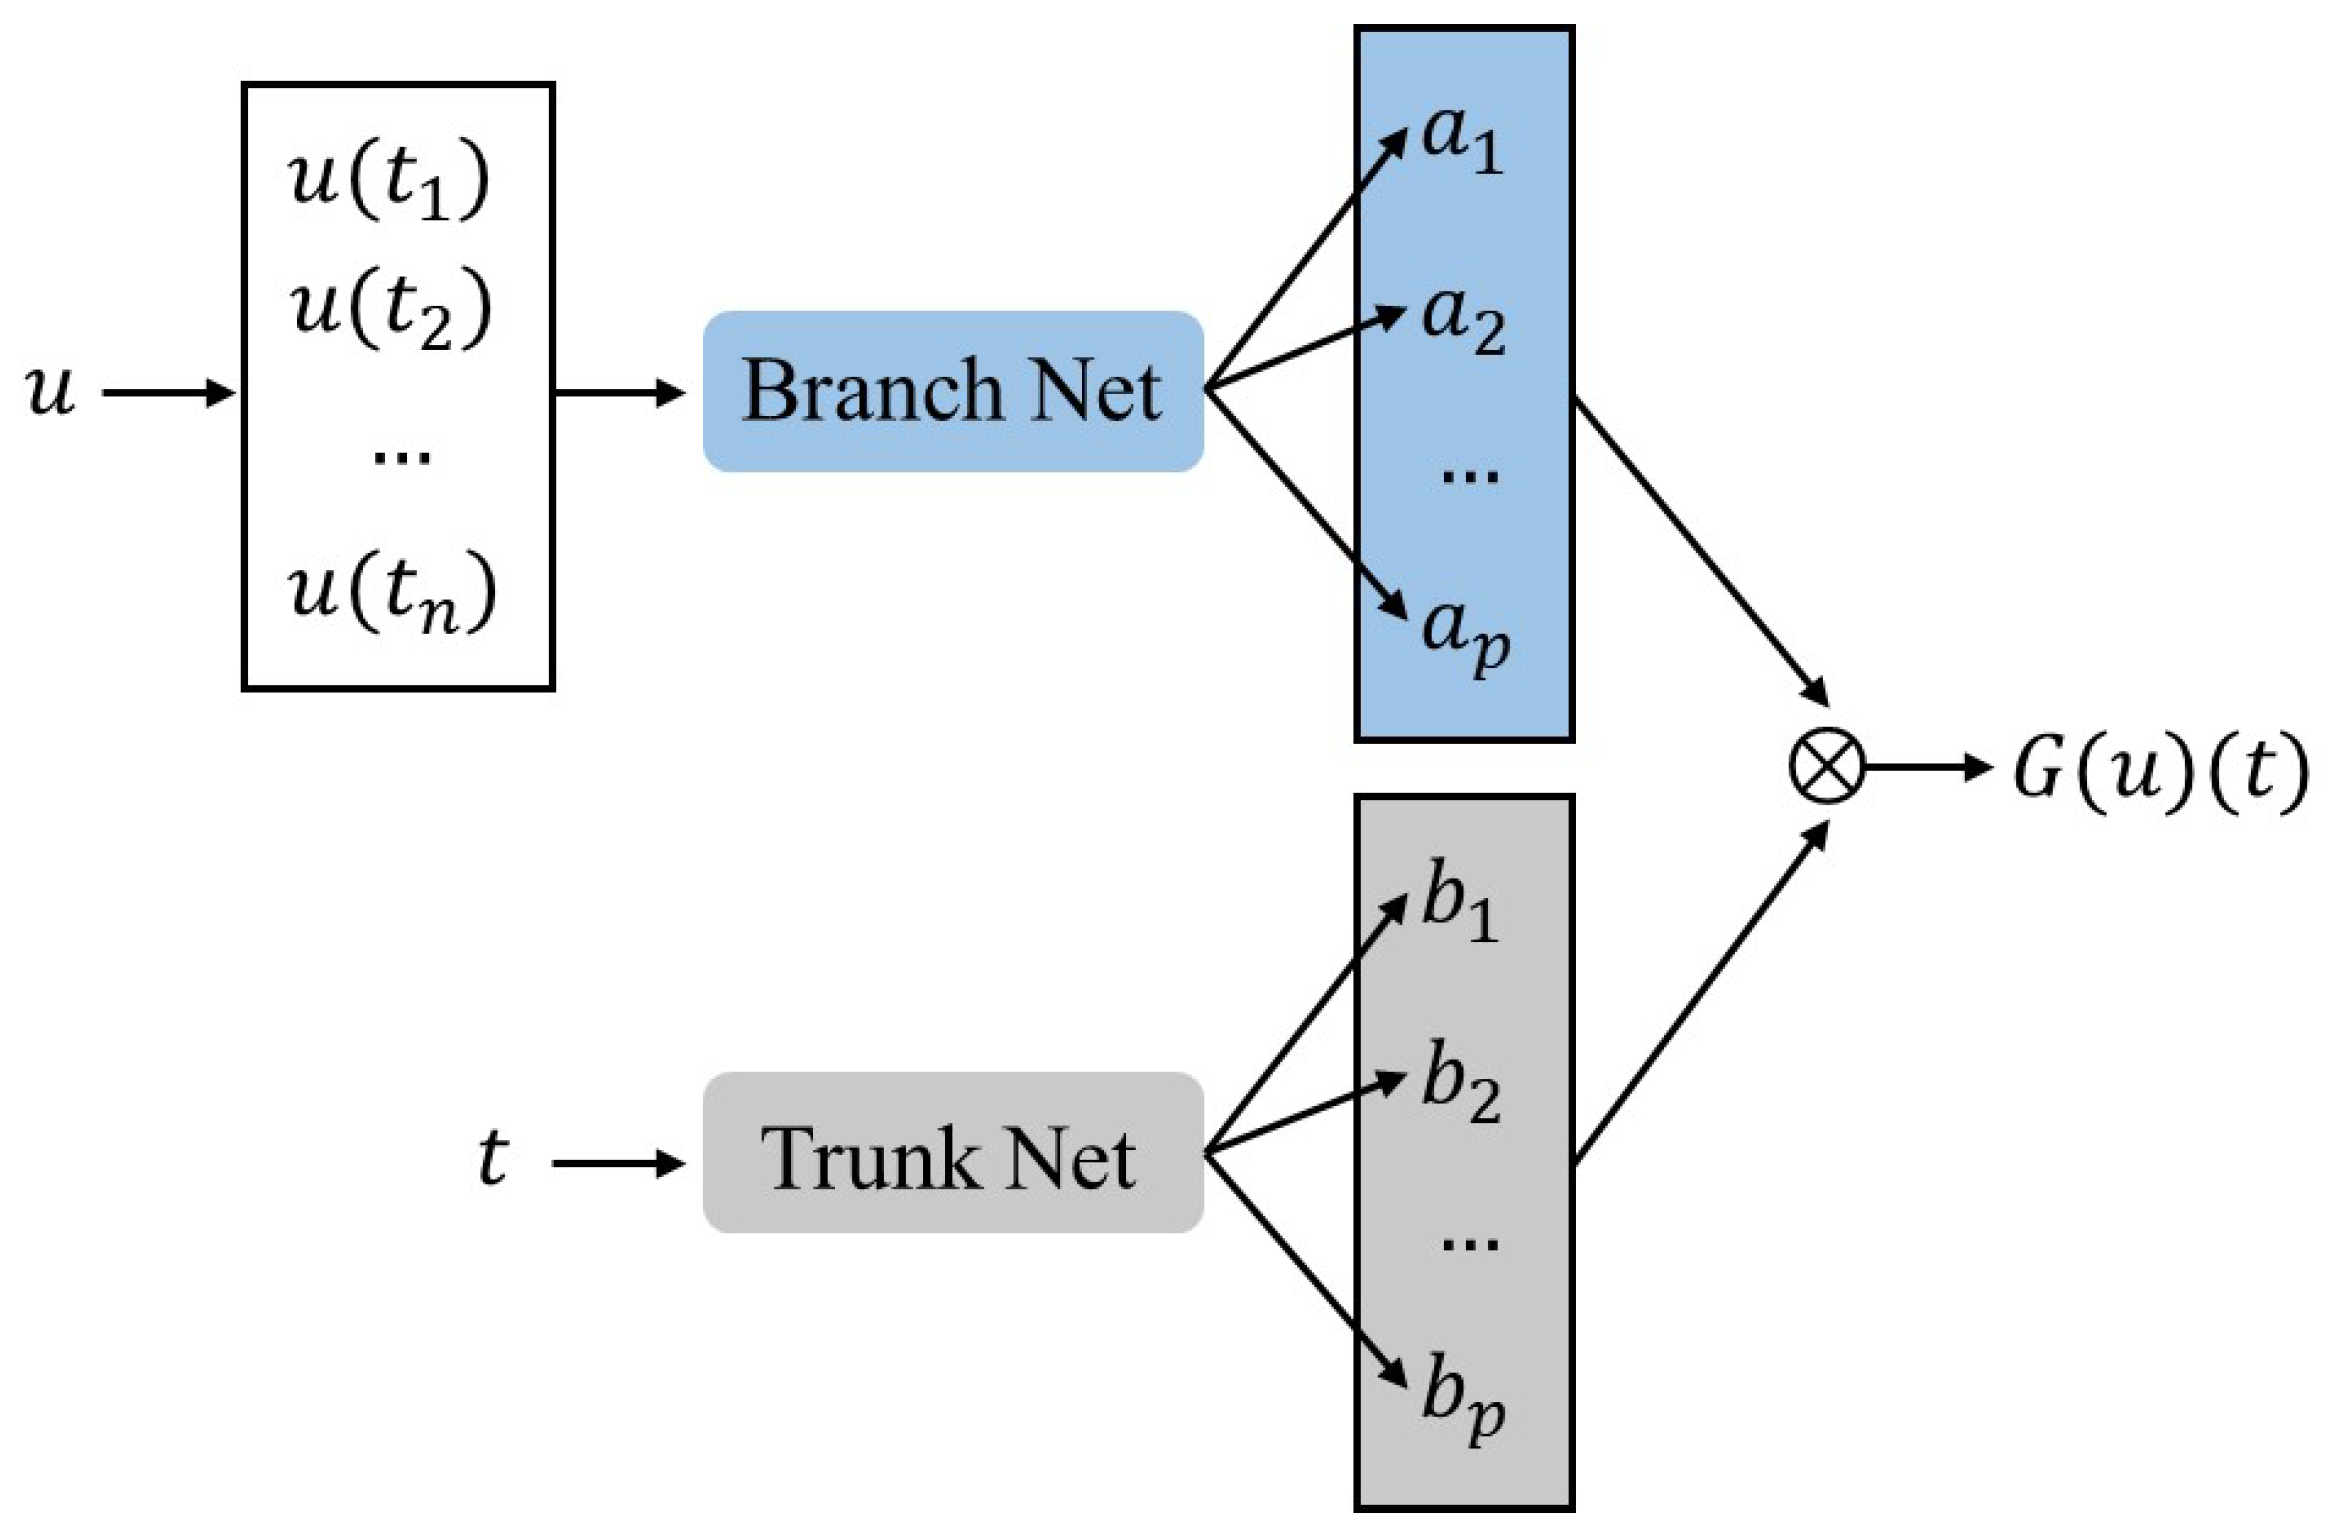
2.2.3. Deep Operator Networks
3. Results and Discussion
3.1. Case A: Effect of the Size of Sliding Window in LSTM and DeepONet
3.2. Case B: Standard Case
3.3. Case C: Effect of Number of Training Data
3.4. Case D: Performance for Long-Term Forecast
4. Conclusions
Author Contributions
Funding
Data Availability Statement
Acknowledgments
Conflicts of Interest
References
- Ciotti, M.; Ciccozzi, M.; Terrinoni, A.; Jiang, W.-C.; Wang, C.-B.; Bernardini, S. The COVID-19 pandemic. Crit. Rev. Clin. Lab. Sci. 2020, 57, 365–388. [Google Scholar] [CrossRef]
- Lal, A.; Erondu, N.A.; Heymann, D.L.; Gitahi, G.; Yates, R. Fragmented health systems in COVID-19: Rectifying the misalignment between global health security and universal health coverage. Lancet 2021, 397, 61–67. [Google Scholar] [CrossRef]
- Nicola, M.; Alsafi, Z.; Sohrabi, C.; Kerwan, A.; Al-Jabir, A.; Iosifidis, C.; Agha, M.; Agha, R. The socio-economic implications of the coronavirus pandemic (COVID-19): A review. Int. J. Surg. 2020, 78, 185–193. [Google Scholar] [CrossRef]
- Pokhrel, S.; Chhetri, R. A literature review on impact of COVID-19 pandemic on teaching and learning. High. Educ. Future 2021, 8, 133–141. [Google Scholar] [CrossRef]
- Ahmad, T.; Haroon, H.; Baig, M.; Hui, J. Coronavirus disease 2019 (COVID-19) pandemic and economic impact. Pak. J. Med. Sci. 2020, 36, S73. [Google Scholar] [CrossRef]
- Güner, H.R.; Hasanoğlu, İ.; Aktaş, F. COVID-19: Prevention and control measures in community. Turk. J. Med Sci. 2020, 50, 571–577. [Google Scholar] [CrossRef]
- Garzotto, F.; Ceresola, E.; Panagiotakopoulou, S.; Spina, G.; Menotto, F.; Benozzi, M.; Casarotto, M.; Lanera, C.; Bonavina, M.G.; Gregori, D.; et al. COVID-19: Ensuring our medical equipment can meet the challenge. Expert Rev. Med. Devices 2020, 17, 483–489. [Google Scholar]
- Fouda, A. The COVID-19 pandemic in Greece, Iceland, New Zealand, and Singapore: Health policies and lessons learned. Health Policy Technol. 2020, 9, 510–524. [Google Scholar] [CrossRef]
- Meyerowitz-Katz, G.; Merone, L. A systematic review and meta-analysis of published research data on COVID-19 infection fatality rates. Int. J. Infect. Dis. 2020, 101, 138–148. [Google Scholar]
- Yang, L.; Liu, S.; Liu, J.; Zhang, Z.; Wan, X.; Huang, B.; Chen, Y.; Zhang, Y. COVID-19: Immunopathogenesis and Immunotherapeutics. Signal Transduct. Target. Ther. 2020, 5, 128. [Google Scholar] [CrossRef]
- Tsai, P.-H.; Lai, W.-Y.; Luo, Y.-H.; Lin, Y.-T.; Chen, H.-K.; Chen, Y.-M.; Lai, Y.-C.; Kuo, L.-C.; Chen, S.-D.; Chang, K.-J.; et al. Clinical manifestation and disease progression in COVID-19 infection. J. Chin. Med. Assoc. 2021, 84, 3–8. [Google Scholar] [CrossRef] [PubMed]
- De Souza, T.H. Clinical manifestations of children with COVID-19: A systematic review. Pediatr. Pulmonol. 2020, 55, 1892–1899. [Google Scholar] [CrossRef]
- Vasileiou, E.; Simpson, C.R.; Shi, T.; Kerr, S.; Agrawal, U.; Akbari, A.; Bedston, S.; Beggs, J.; Bradley, D.; Chuter, A.; et al. Interim findings from first-dose mass COVID-19 vaccination roll-out and COVID-19 hospital admissions in Scotland: A national prospective cohort study. Lancet 2021, 397, 1646–1657. [Google Scholar] [CrossRef] [PubMed]
- Rees, E.M.; Nightingale, E.S.; Jafari, Y.; Waterlow, N.R.; Clifford, S.; Pearson, C.A.B.; Jombart, T.; Procter, S.R.; Knight, G.M.; CMMID Working Group. COVID-19 length of hospital stay: A systematic review and data synthesis. BMC Med. 2020, 18, 1–22. [Google Scholar] [CrossRef]
- Kumar, A.; Gupta, P.K.; Srivastava, A. A review of modern technologies for tackling COVID-19 pandemic. Diabetes Metab. Syndr. Clin. Res. Rev. 2020, 14, 569–573. [Google Scholar] [CrossRef]
- Tarfaoui, M.; Nachtane, M.; Goda, I.; Qureshi, Y.; Benyahia, H. 3D printing to support the shortage in personal protective equipment caused by COVID-19 pandemic. Materials 2020, 13, 3339. [Google Scholar] [CrossRef]
- Desai, A.N.; Kraemer, M.U.G.; Bhatia, S.; Cori, A.; Nouvellet, P.; Herringer, M.; Cohn, E.L.; Carrion, M.; Brownstein, J.S.; Madoff, L.C.; et al. Real-time epidemic forecasting: Challenges and opportunities. Health Secur. 2019, 17, 268–275. [Google Scholar] [CrossRef] [PubMed]
- Woolhouse, M. How to make predictions about future infectious disease risks. Philos. Trans. R. Soc. B Biol. Sci. 2011, 10, 2045–2054. [Google Scholar] [CrossRef]
- Bhopal, R.S. Ethnicity, Race, and Health in Multicultural Societies: Foundations for Better Epidemiology, Public Health, and Health Care; Oxford University Press: Oxford, UK, 2007; pp. 233–237. [Google Scholar]
- Jordan, M.I.; Mitchell, T.M. Machine learning: Trends, perspectives, and prospects. Science 2015, 349, 255–260. [Google Scholar] [CrossRef]
- Mitchell, T.M. Machine Learning; McGraw-Hill: New York, NY, USA, 2007; pp. 169–170. [Google Scholar]
- Nadkarni, P.M.; Ohno-Machado, L.; Chapman, W.W. Natural language processing: An introduction. J. Am. Med. Inform.Assoc. 2011, 18, 544–551. [Google Scholar] [CrossRef]
- Kim, T.Y.; Cho, S.B. Predicting residential energy consumption using CNN-LSTM neural networks. Energy 2019, 182, 72–81. [Google Scholar] [CrossRef]
- Kononenko, I. Machine learning for medical diagnosis: History, state of the art and perspective. Artif. Intell. Med. 2001, 23, 89–109. [Google Scholar] [CrossRef]
- Moghar, A.; Hamiche, M. Stock market prediction using LSTM recurrent neural network. Procedia Comput. Sci. 2020, 170, 1168–1173. [Google Scholar] [CrossRef]
- Sundermeyer, M.; Schlüter, R.; Ney, H. LSTM neural networks for language modeling. In Proceedings of the Thirteenth Annual Conference of the International Speech Communication Association, Portland, OR, USA, 9–13 September 2012. [Google Scholar]
- Aldhyani, T.H.H.; Alkahtani, H. A bidirectional long short-term memory model algorithm for predicting COVID-19 in gulf countries. Life 2021, 11, 1118. [Google Scholar] [CrossRef] [PubMed]
- Chimmula, V.K.R.; Zhang, L. Time series forecasting of COVID-19 transmission in Canada using LSTM networks. Chaos Solitons Fractals 2020, 135, 109864. [Google Scholar] [CrossRef] [PubMed]
- Yang, Z.; Zeng, Z.; Wang, K.; Wong, S.-S.; Liang, W.; Zanin, M.; Liu, P.; Cao, X.; Gao, Z.; Mai, Z.; et al. Modified SEIR and AI prediction of the epidemics trend of COVID-19 in China under public health interventions. J. Thorac. Dis. 2020, 12, 165. [Google Scholar] [CrossRef]
- Huang, C.-J.; Chen, Y.-H.; Ma, Y.; Kuo, P.-H. Multiple-input deep convolutional neural network model for COVID-19 forecasting in China. MedRxiv 2020. [Google Scholar] [CrossRef]
- Raissi, M.; Perdikaris, P.; Karniadakis, G.E. Physics-informed neural networks: A deep learning framework for solving forward and inverse problems involving nonlinear partial differential equations. J. Comput. Phys. 2019, 378, 686–707. [Google Scholar] [CrossRef]
- De Ryck, T.; Mishra, S. Generic bounds on the approximation error for physics-informed (and) operator learning. Adv. Neural Inf. Process. Syst. 2022, 35, 10945–10958. [Google Scholar]
- Linka, K.; Schäfer, A.; Meng, X.; Zou, Z.; Karniadakis, G.E.; Kuhl, E. Bayesian Physics Informed Neural Networks for real-world nonlinear dynamical systems. Comput. Methods Appl. Mech. Eng. 2022, 402, 115346. [Google Scholar] [CrossRef]
- Berkhahn, S.; Ehrhardt, M. A physics-informed neural network to model COVID-19 infection and hospitalization scenarios. Adv. Contin. Discret. Model. 2022, 2022, 61. [Google Scholar] [CrossRef]
- Cuomo, S.; Di Cola, V.S.; Giampaolo, F.; Rozza, G.; Raissi, M.; Piccialli, F. Scientific machine learning through physics-informed neural networks: Where we are and what’s next. J. Sci. Comput. 2022, 92, 88. [Google Scholar] [CrossRef]
- Lu, L.; Jin, P.; Karniadakis, G.E. Deeponet: Learning nonlinear operators for identifying differential equations based on the universal approximation theorem of operators. arXiv 2019, arXiv:1910.03193. [Google Scholar]
- Lanthaler, S.; Mishra, S.; Karniadakis, G.E. Error estimates for deeponets: A deep learning framework in infinite dimensions. Trans. Math. Its Appl. 2022, 6, tnac001. [Google Scholar] [CrossRef]
- Osorio, J.D.; Wang, Z.; Karniadakis, G.; Cai, S.; Chryssostomidis, C.; Panwar, M.; Hovsapian, R. Forecasting solar-thermal systems performance under transient operation using a data-driven machine learning approach based on the deep operator network architecture. Energy Convers. Manag. 2022, 10, 115063. [Google Scholar] [CrossRef]
- Coronavirus Resource Center. Available online: https://coronavirus.jhu.edu/map.html (accessed on 1 July 2023).
- Li, Z.; Zheng, H.; Kovachki, N.; Jin, D.; Chen, H.; Liu, B.; Azizzadenesheli, K.; Anandkumar, A. Physics-informed neural operator for learning partial differential equations. arXiv 2021, arXiv:2111.03794. [Google Scholar]
- Lu, L.; Meng, X.; Cai, S.; Mao, Z.; Goswami, S.; Zhang, Z.; Karniadakis, G.E. A comprehensive and fair comparison of two neural operators (with practical extensions) based on fair data. Comput. Methods Appl. Mech. Eng. 2022, 393, 114778. [Google Scholar] [CrossRef]
- Li, Z.; Kovachki, N.; Azizzadenesheli, K.; Liu, B.; Bhattacharya, K.; Stuart, A.; Anandkumar, A. Fourier neural operator for parametric partial differential equations. arXiv 2020, arXiv:2010.08895. [Google Scholar]
- Yu, J.; Lu, L.; Meng, X.; Karniadakis, G.E. Gradient-enhanced physics-informed neural networks for forward and inverse PDE problems. Comput. Methods Appl. Mech. Eng. 2022, 393, 114823. [Google Scholar] [CrossRef]
- Wang, Y.; Zhou, J.; Chen, K.; Wang, Y.; Liu, L. Water quality prediction method based on LSTM neural network. In Proceedings of the 12th International Conference on Intelligent Systems and Knowledge Engineering (ISKE), Nanjing, China, 24–26 November 2017. [Google Scholar]
- Yu, Y.; Si, X.; Hu, C.; Zhang, J. A review of recurrent neural networks: LSTM cells and network architectures. Neural Comput. 2019, 31, 1235–1270. [Google Scholar] [CrossRef]
- Meng, X.; Yang, L.; Mao, Z.; del Águila Ferrandis, J.; Karniadakis, G.E. Learning functional priors and posteriors from data and physics. J. Comput. Phys. 2022, 457, 111073. [Google Scholar] [CrossRef]
- Lin, C.; Li, Z.; Lu, L.; Cai, S.; Maxey, M.; Karniadakis, G.E. Operator learning for predicting multiscale bubble growth dynamics. J. Chem. Phys. 2021, 154, 104118. [Google Scholar] [CrossRef] [PubMed]


| E | Size = 60 | Size = 100 | Size = 120 | Size = 140 |
|---|---|---|---|---|
| LSTM | 37.1% | 10.3% | 15.7% | 16.3% |
| DeepONet | 17.4% | 16.1% | 6.2% | 17.2% |
| LSTM | PINNs | DeepONet | |
|---|---|---|---|
| E | 6.2% | 13.0% | 10.3% |
| E | |||
|---|---|---|---|
| LSTM | 18.7% | 10.3% | 8.2% |
| PINNs | 12.9% | 13.0% | 8.5% |
| LSTM | PINNs | DeepONet | |
|---|---|---|---|
| E | 25.4% | 17.6% | 14.7% |
Disclaimer/Publisher’s Note: The statements, opinions and data contained in all publications are solely those of the individual author(s) and contributor(s) and not of MDPI and/or the editor(s). MDPI and/or the editor(s) disclaim responsibility for any injury to people or property resulting from any ideas, methods, instructions or products referred to in the content. |
© 2023 by the authors. Licensee MDPI, Basel, Switzerland. This article is an open access article distributed under the terms and conditions of the Creative Commons Attribution (CC BY) license (https://creativecommons.org/licenses/by/4.0/).
Share and Cite
Guo, Z.; Lin, Q.; Meng, X. A Comparative Study on Deep Learning Models for COVID-19 Forecast. Healthcare 2023, 11, 2400. https://doi.org/10.3390/healthcare11172400
Guo Z, Lin Q, Meng X. A Comparative Study on Deep Learning Models for COVID-19 Forecast. Healthcare. 2023; 11(17):2400. https://doi.org/10.3390/healthcare11172400
Chicago/Turabian StyleGuo, Ziyuan, Qingyi Lin, and Xuhui Meng. 2023. "A Comparative Study on Deep Learning Models for COVID-19 Forecast" Healthcare 11, no. 17: 2400. https://doi.org/10.3390/healthcare11172400
APA StyleGuo, Z., Lin, Q., & Meng, X. (2023). A Comparative Study on Deep Learning Models for COVID-19 Forecast. Healthcare, 11(17), 2400. https://doi.org/10.3390/healthcare11172400