

Body Composition Is Related to Maximal Effort Treadmill Test Time in Firefighters

Abstract
1. Introduction
2. Materials and Methods
2.1. Participants and Study Design
2.2. Anthropometric Data
2.3. Aerobic Capacity Testing
2.4. Statistical Analysis
3. Results
4. Discussion
4.1. Submaximal WFI Treadmill Test
4.2. Maximal Treadmill Test
5. Conclusions
Author Contributions
Funding
Institutional Review Board Statement
Informed Consent Statement
Data Availability Statement
Acknowledgments
Conflicts of Interest
References
- Smith, D.L. Firefighter Fitness: Improving performance and preventing injuries and fatalities. Curr. Sports Med. Rep. 2011, 10, 167–172. [Google Scholar] [CrossRef] [PubMed]
- Dennison, K.J.; Mullineaux, D.R.; Yates, J.W.; Abel, M.G. The Effect of Fatigue and Training Status on Firefighter Performance. J. Strength Cond. Res. 2012, 26, 1101–1109. [Google Scholar] [CrossRef]
- Rhea, M.R.; Alvar, B.A.; Gray, R. Physical Fitness and Job Performance of Firefighters. J. Strength Cond. Res. 2004, 18, 348–352. [Google Scholar] [CrossRef] [PubMed]
- Williford, H.N.; Duey, W.J.; Olson, M.S.; Howard, R.; Wang, N. Relationship between fire fighting suppression tasks and physical fitness. Ergonomics 1999, 42, 1179–1186. [Google Scholar] [CrossRef] [PubMed]
- Michaelides, M.A.; Parpa, K.M.; Thompson, J.; Brown, B. Predicting Performance on a Firefghter’s Ability Test from Fitness Parameters. Res. Q. Exerc. Sport 2008, 79, 468–475. [Google Scholar] [CrossRef] [PubMed]
- Michaelides, M.A.; Parpa, K.M.; Henry, L.J.; Thompson, G.B.; Brown, B.S. Assessment of Physical Fitness Aspects and Their Relationship to Firefighters’ Job Abilities. J. Strength Cond. Res. 2011, 25, 956–965. [Google Scholar] [CrossRef] [PubMed]
- Phillips, D.B.; Scarlett, M.P.; Petersen, S.R. The Influence of Body Mass on Physical Fitness Test Performance in Male Firefighter Applicants. J. Occup. Environ. Med. 2017, 59, 1101–1108. [Google Scholar] [CrossRef]
- Gledhill, N.; Jamnik, V.K. Characterization of the physical demands of firefighting. Can. J. Sport Sci. 1992, 17, 207–213. [Google Scholar] [PubMed]
- Lindberg, A.-S.; Oksa, J.; Malm, C. Laboratory or Field Tests for Evaluating Firefighters’ Work Capacity? PLoS ONE 2014, 9, e91215. [Google Scholar] [CrossRef] [PubMed]
- Lindberg, A.-S.; Oksa, J.; Antti, H.; Malm, C. Multivariate Statistical Assessment of Predictors of Firefighters’ Muscular and Aerobic Work Capacity. PLoS ONE 2015, 10, e0118945. [Google Scholar] [CrossRef]
- Firoozeh, M.; Saremi, M.; Kavousi, A.; Maleki, A. Demographic and occupational determinants of the work ability of firemen. J. Occup. Health 2017, 59, 81–87. [Google Scholar] [CrossRef] [PubMed]
- Punakallio, A.; Lusa, S.; Luukkonen, R. Functional, postural and perceived balance for predicting the work ability of firefighters. Int. Arch. Occup. Environ. Health 2004, 77, 482–490. [Google Scholar] [CrossRef] [PubMed]
- Drain, J.; Billing, D.; Neesham-Smith, D.; Aisbett, B. Predicting physiological capacity of human load carriage—A review. Appl. Ergon. 2016, 52, 85–94. [Google Scholar] [CrossRef] [PubMed]
- National Fire Protection Association. NFPA 1582 Standard on Comprehensive Occupational Medical Program for Fire Departments, 2013th ed.; National Fire Protection Association: Quincy, MA, USA, 2013. [Google Scholar]
- Fahy, R.F.; Petrillo, J.T. Firefighter fatalities in the US in 2021; National Fire Protection Association: Quincy, MA, USA, 2022. [Google Scholar]
- International Association of Firefighters. The Fire Service Joint Labor Management Wellness-Fitness Initiative, 4th ed.; International Association of Firefighters: Washington, DC, USA, 2018. [Google Scholar]
- Drew-Nord, D.C.; Myers, J.; Nord, S.R.; Oka, R.K.; Hong, O.; Froelicher, E.S. Accuracy of peak VO2 assessments in career firefighters. J. Occup. Med. Toxicol. 2011, 6, 25. [Google Scholar] [CrossRef] [PubMed]
- Gaesser, G.A.; Poole, D.C. The slow component of oxygen uptake kinetics in humans. Exerc. Sport Sci. Rev. 1996, 24, 35–71. [Google Scholar] [CrossRef]
- Bergstrom, H.C.; Housh, T.J.; Cochrane-Snyman, K.C.; Jenkins, N.D.M.; Byrd, M.T.; Switalla, J.R.; Schmidt, R.J.; Johnson, G.O. A Model for Identifying Intensity Zones Above Critical Velocity. J. Strength Cond. Res. 2017, 31, 3260–3265. [Google Scholar] [CrossRef]
- Mielke, M.; Housh, T.J.; Hendrix, C.R.; Zuniga, J.; Camic, C.L.; Schmidt, R.J.; Johnson, G.O. A Test for Determining Critical Heart Rate Using the Critical Power Model. J. Strength Cond. Res. 2011, 25, 504–510. [Google Scholar] [CrossRef]
- Bergstrom, H.C.; Housh, T.J.; Cochrane, K.C.; Jenkins, N.D.; Buckner, S.L.; Goldsmith, J.A.; Zuniga, J.M.; Schmidt, R.J.; Johnson, G.O.; Cramer, J.T. Application of the Critical Heart Model to Treadmill Running. J. Strength Cond. Res. 2015, 29, 2237–2248. [Google Scholar] [CrossRef] [PubMed]
- Kuehl, K.S.; Kisbu-Sakarya, Y.; Elliot, D.L.; Moe, E.L.; DeFrancesco, C.A.; MacKinnon, D.P.; Lockhart, G.; Goldberg, L.; Kuehl, H.E. Body Mass Index As a Predictor of Firefighter Injury and Workers’ Compensation Claims. J. Occup. Environ. Med. 2012, 54, 579–582. [Google Scholar] [CrossRef] [PubMed]
- Jitnarin, N.; Poston, W.S.; Haddock, C.K.; Jahnke, S.; Tuley, B.C. Accuracy of body mass index-defined overweight in fire fighters. Occup. Med. 2013, 63, 227–230. [Google Scholar] [CrossRef]
- Cavuoto, L.A.; Nussbaum, M.A. The Influences of Obesity and Age on Functional Performance During Intermittent Upper Extremity Tasks. J. Occup. Environ. Hyg. 2014, 11, 583–590. [Google Scholar] [CrossRef]
- Davis, P.O.; Dotson, C.O.; Santa Maria, D.L. Relationship between simulated fire fighting tasks and physical performance measures. Med. Sci. Sports Exerc. 1982, 14, 65–71. [Google Scholar] [CrossRef]
- Jackson, A.S.; Pollock, M.L. Practical Assessment of Body Composition. Phys. Sportsmed. 1985, 13, 76–90. [Google Scholar] [CrossRef] [PubMed]
- Delisle, A.T.; Piazza-Gardner, A.K.; Cowen, T.L.; Huq, M.B.; Delisle, A.D.; Stopka, C.B.; Tillman, M.D. Validation of a Cardiorespiratory Fitness Assessment for Firefighters. J. Strength Cond. Res. 2014, 28, 2717–2723. [Google Scholar] [CrossRef] [PubMed]
- Schober, P.; Boer, C.; Schwarte, L.A. Correlation coefficients: Appropriate use and interpretation. Anesth. Analg. 2018, 126, 1763–1768. [Google Scholar] [CrossRef]
- Dolezal, B.A.; Barr, D.; Boland, D.M.; Smith, D.L.; Cooper, C.B. Validation of the firefighter WFI treadmill protocol for predicting VO2max. Occup. Med. 2015, 65, 143–146. [Google Scholar] [CrossRef]
- Tierney, M.T.; Lenar, D.; Stanforth, P.R.; Craig, J.N.; Farrar, R.P. Prediction of Aerobic Capacity in Firefighters Using Submaximal Treadmill and Stairmill Protocols. J. Strength Cond. Res. 2010, 24, 757–764. [Google Scholar] [CrossRef] [PubMed]
- Mier, C.M.; Gibson, A.L. Evaluation of a treadmill test for predicting the aerobic capacity of firefighters. Occup. Med. 2004, 54, 373–378. [Google Scholar] [CrossRef]
- Klaren, R.E.; Horn, G.P.; Fernhall, B.; Motl, R.W. Accuracy of the VO2peak prediction equation in firefighters. J. Occup. Med. Toxicol. 2014, 9, 17. [Google Scholar] [CrossRef]
- Norris, M.S.; McAllister, M.; Gonzalez, A.E.; Best, S.A.; Pettitt, R.; Keeler, J.M.; Abel, M.G. Predictors of Work Efficiency in Structural Firefighters. J. Occup. Environ. Med. 2021, 63, 622–628. [Google Scholar] [CrossRef]
- Perroni, F.; Tessitore, A.; Cortis, C.; Lupo, C.; D’Artibale, E.; Cignitti, L.; Capranica, L. Energy Cost and Energy Sources During a Simulated Firefighting Activity. J. Strength Cond. Res. 2010, 24, 3457–3463. [Google Scholar] [CrossRef]
- Barnard, R.J.; Duncan, H.W. Heart rate and ECG responses of fire fighters. J. Occup. Med. 1975, 17, 247–250. [Google Scholar]
- Sothmann, M.S.; Saupe, K.; Jasenof, D.; Blaney, J. Heart Rate Response of Firefighters to Actual Emergencies. Implications for cardiorespiratory fitness. J. Occup. Med. 1992, 34, 797–800. [Google Scholar] [CrossRef]
- Angerer, P.; Kadlez-Gebhardt, S.; Delius, M.; Raluca, P.; Nowak, D. Comparison of Cardiocirculatory and Thermal Strain of Male Firefighters During Fire Suppression to Exercise Stress Test and Aerobic Exercise Testing. Am. J. Cardiol. 2008, 102, 1551–1556. [Google Scholar] [CrossRef]
- Windisch, S.; Seiberl, W.; Schwirtz, A.; Hahn, D. Relationships between strength and endurance parameters and air depletion rates in professional firefighters. Sci. Rep. 2017, 7, 44590. [Google Scholar] [CrossRef]
- Elsner, K.L.; Kolkhorst, F.W. Metabolic demands of simulated firefighting tasks. Ergonomics 2008, 51, 1418–1425. [Google Scholar] [CrossRef]
- Gendron, P.; Freiberger, E.; Laurencelle, L.; Trudeau, F.; Lajoie, C. Greater physical fitness is associated with better air ventilation efficiency in firefighters. Appl. Ergon. 2015, 47, 229–235. [Google Scholar] [CrossRef]
- Skinner, T.L.; Kelly, V.G.; Boytar, A.N.; Peeters, G.G.; Rynne, S.B. Aviation Rescue Firefighters physical fitness and predictors of task performance. J. Sci. Med. Sport 2020, 23, 1228–1233. [Google Scholar] [CrossRef]
- Storer, T.W.; Dolezal, B.A.; Abrazado, M.L.; Smith, D.L.; Batalin, M.A.; Tseng, C.-H.; Cooper, C.B. PHASER Study Group Firefighter Health and Fitness Assessment: A call to action. J. Strength Cond. Res. 2014, 28, 661–671. [Google Scholar] [CrossRef]
- Kiss, P.; De Meester, M.; Maes, C.; De Vriese, S.; Kruse, A.; Braeckman, L. Cardiorespiratory fitness in a representative sample of Belgian firefighters. Occup. Med. 2014, 64, 589–594. [Google Scholar] [CrossRef][Green Version]
- McKinney, Z.J.; Bovard, R.S.; Starchook-Moore, M.N.; Ronneberg, K.; Xi, M.; Bredeson, D.M.; Schwartz, E.C.; Thelen, S.L.; Nash, T.L.; Dickinson, M.; et al. Cardiorespiratory Fitness of Firefighters. J. Occup. Environ. Med. 2021, 63, 57–63. [Google Scholar] [CrossRef]
- Fahy, R.; Evarts, B.; Stein, G.P. US Fire Department Profile 2020; National Fire Protection Association: Quincy, MA, USA, 2022. [Google Scholar]
- Haisman, M.F. Determinants of load carrying ability. Appl. Ergon. 1988, 19, 111–121. [Google Scholar] [CrossRef]
- Lyons, J.; Allsopp, A.; Bilzon, J. Influences of body composition upon the relative metabolic and cardiovascular demands of load-carriage. Occup. Med. 2005, 55, 380–384. [Google Scholar] [CrossRef] [PubMed]
- Ryan, E.D.; Laffan, M.R.; Trivisonno, A.J.; Gerstner, G.R.; Mota, J.A.; Giuliani, H.K.; Pietrosimone, B.G. Neuromuscular determinants of simulated occupational performance in career firefighters. Appl. Ergon. 2022, 98, 103555. [Google Scholar] [CrossRef]
- Mehta, R.K.; Cavuoto, L.A. Relationship Between BMI and Fatigability Is Task Dependent. Hum. Factors 2017, 59, 722–733. [Google Scholar] [CrossRef]
- Mayer, J.M.; Nuzzo, J.L.; Chen, R.; Quillen, W.S.; Verna, J.L.; Miro, R.; Dagenais, S. The Impact of Obesity on Back and Core Muscular Endurance in Firefighters. J. Obes. 2012, 2012, 729283. [Google Scholar] [CrossRef]


| Mean ± SD | Range | |
|---|---|---|
| Age (yrs) | 35.27 ± 8.28 | 22.00–49.00 |
| Height (m) | 1.79 ± 0.07 | 1.70–1.91 |
| Weight (kg) | 89.14 ± 16.09 | 64.18–122.56 |
| BMI (kg/m2) | 27.64 ± 4.76 | 22.00–39.90 |
| Body Fat (%) | 20.19 ± 3.49 | 15.25–25.42 |
| Max HR (bpm) | 186.0 ± 9.65 | 168.00–199.00 |
| P-VO2peak (mL/kg/min) | 44.09 ± 4.61 | 33.43–49.35 |
| VO2peak (mL/kg/min) | 45.11 ± 5.12 | 35.90–54.20 |
| WFIsub Test Time (min) | 7.54 ± 1.38 | 4.83–10.75 |
| WFImax Test Time (min) | 12.23 ± 1.58 | 8.68–14.75 |
| Tdiff (min) | 4.69 ± 0.82 | 3.38–6.27 |
| VO2peak | MHR | WFIsub Test Time | WFImax Test Time | Tdiff | |
|---|---|---|---|---|---|
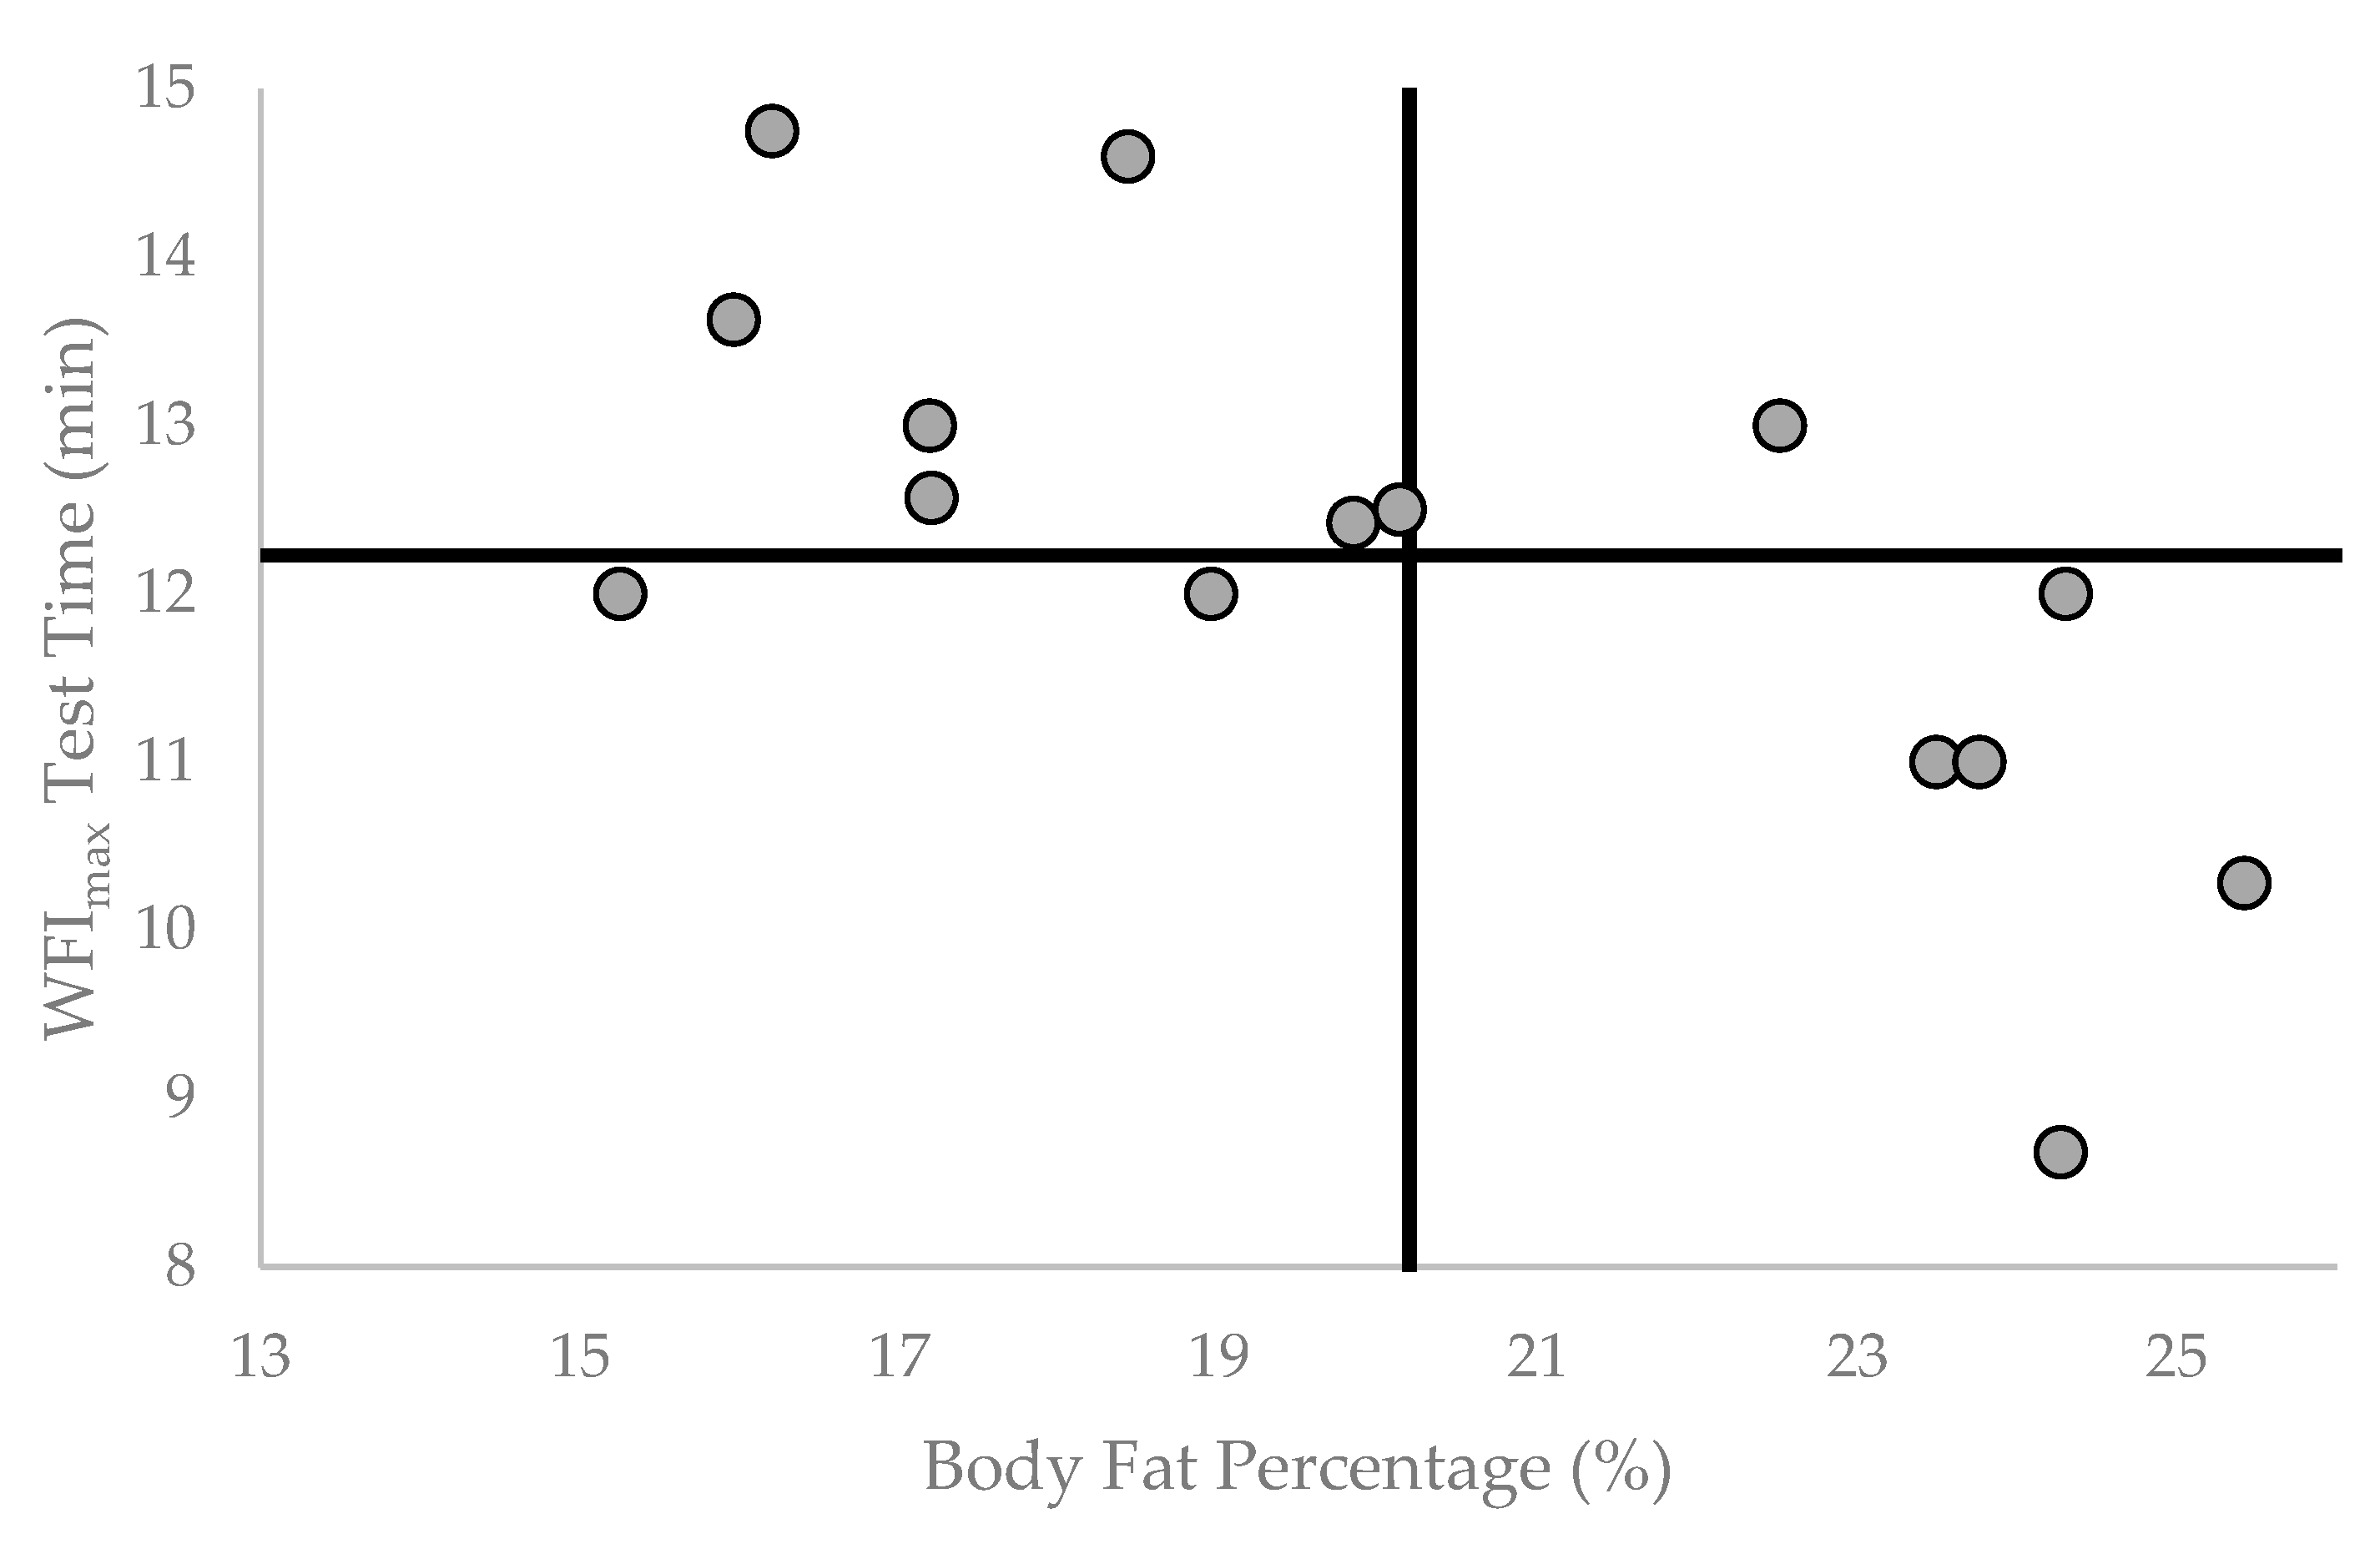
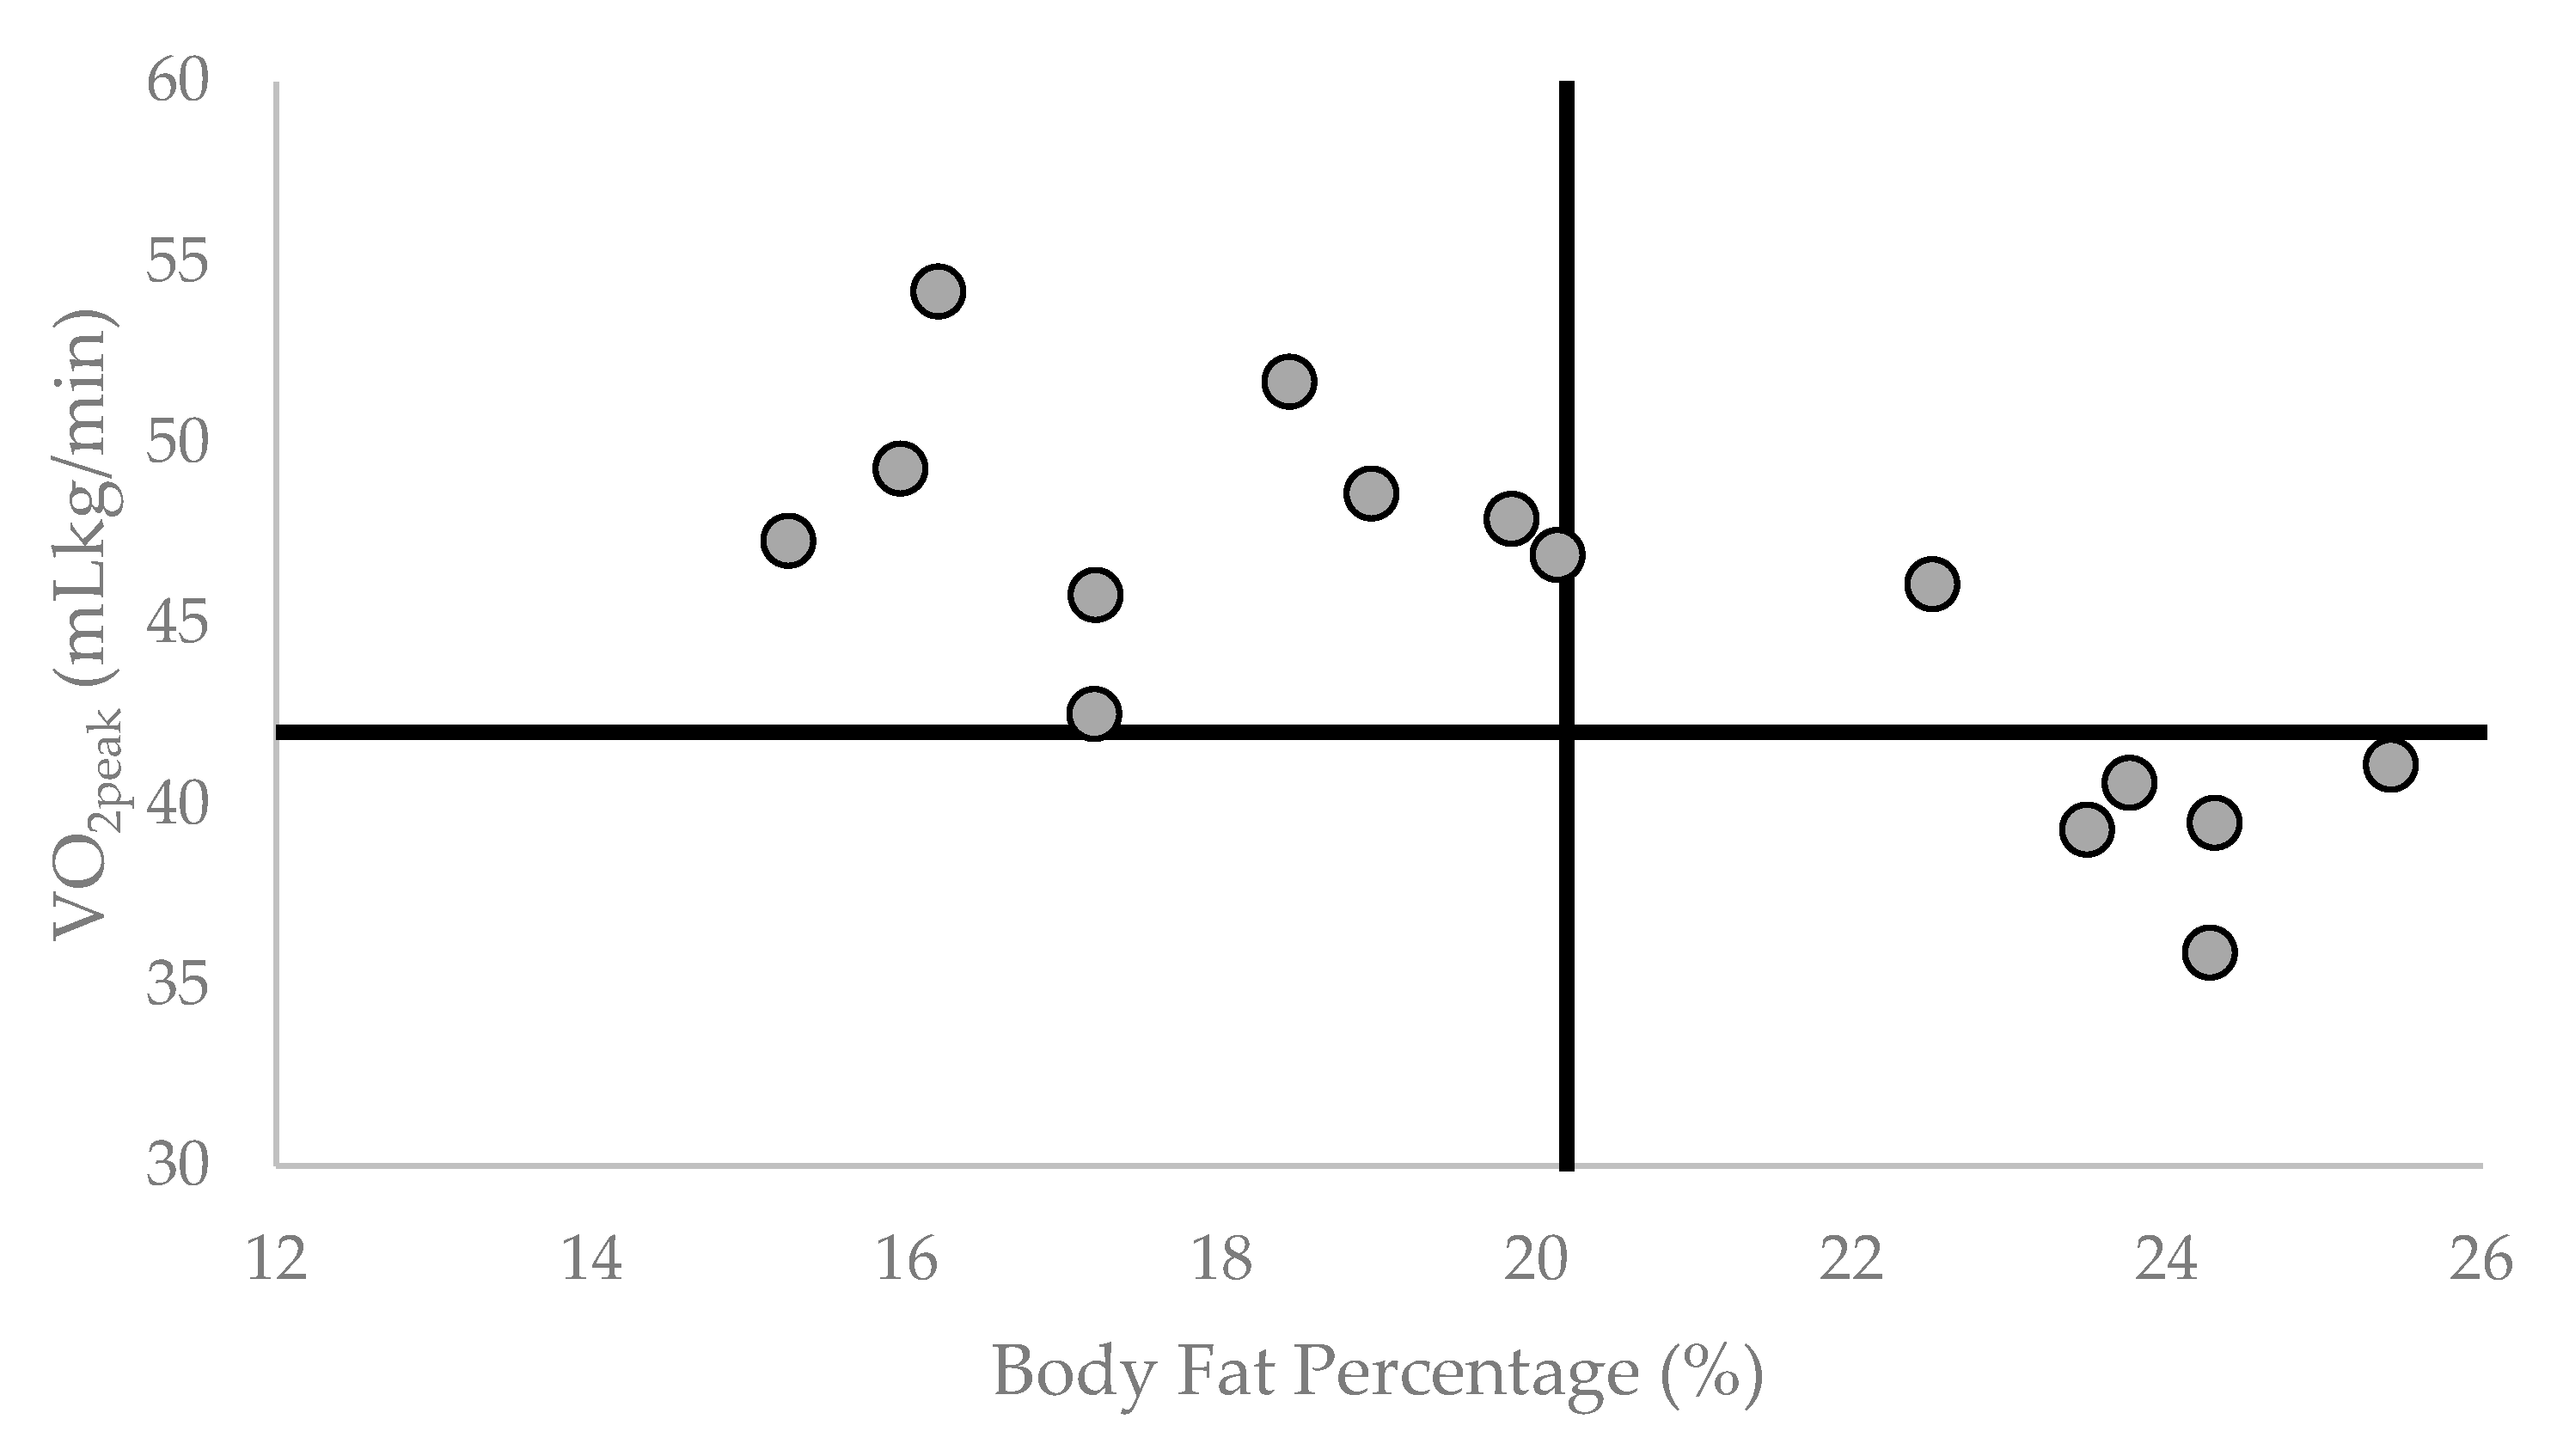
| BF% | −0.762 ** | 0.053 | −0.426 | −0.704 ** | −0.636 * |
| VO2peak | −0.093 | 0.711 ** | 0.863 ** | 0.462 | |
| MHR | −0.173 | −0.085 | 0.127 | ||
| WFIsub Test Time | 0.853 ** | −0.040 | |||
| WFImax Test Time | 0.487 |
Disclaimer/Publisher’s Note: The statements, opinions and data contained in all publications are solely those of the individual author(s) and contributor(s) and not of MDPI and/or the editor(s). MDPI and/or the editor(s) disclaim responsibility for any injury to people or property resulting from any ideas, methods, instructions or products referred to in the content. |
© 2023 by the authors. Licensee MDPI, Basel, Switzerland. This article is an open access article distributed under the terms and conditions of the Creative Commons Attribution (CC BY) license (https://creativecommons.org/licenses/by/4.0/).
Share and Cite
Mendelson, B.J.; Marciniak, R.A.; Wahl, C.A.; Ebersole, K.T. Body Composition Is Related to Maximal Effort Treadmill Test Time in Firefighters. Healthcare 2023, 11, 1607. https://doi.org/10.3390/healthcare11111607
Mendelson BJ, Marciniak RA, Wahl CA, Ebersole KT. Body Composition Is Related to Maximal Effort Treadmill Test Time in Firefighters. Healthcare. 2023; 11(11):1607. https://doi.org/10.3390/healthcare11111607
Chicago/Turabian StyleMendelson, Benjamin J., Rudi A. Marciniak, Carly A. Wahl, and Kyle T. Ebersole. 2023. "Body Composition Is Related to Maximal Effort Treadmill Test Time in Firefighters" Healthcare 11, no. 11: 1607. https://doi.org/10.3390/healthcare11111607
APA StyleMendelson, B. J., Marciniak, R. A., Wahl, C. A., & Ebersole, K. T. (2023). Body Composition Is Related to Maximal Effort Treadmill Test Time in Firefighters. Healthcare, 11(11), 1607. https://doi.org/10.3390/healthcare11111607