Analysis of Medico-Legal Complaint Data: A Retrospective Study of Three Large Italian University Hospitals

 , , , ,
  ,
,  , and
, and
Abstract
1. Introduction
- Scientific and research purposes;
- Internal evaluation and improvement within an organization (continuous quality improvement and internal evaluation of healthcare organizations);
- Structure indicators;
- Process indicators;
- Outcome indicators.
2. Materials and Methods
- they were all categorized according to the International Classification for Patient Safety (ICPS) system [63], with particular attention to the following parameters: age, gender, unit involved, event date and type, outcome (for patient and structure involved);
- economic quantification of the request, technical opinion, risk of loss, eventual amount paid;
- chronological specification of the judicial (or extrajudicial) phase.
2.1. Indicators Set
- Phase I—Overview of the claims. During this phase, all files were examined;
- Phase II—Definition of performance in claims management, established as the contribution in terms of results of a subject to the achievement of an objective;
- Phase III—Setting system limits. The spatial criterion consisted of all claims based on civil and health liability, while the temporal one was the limitation of claims to the period 2013–2020;
- Phase IV—Setting up the performance scoreboard. In this phase, a set of indicators was selected and standardized for name, definition, and calculation formula. Notably, all indicators were validated against internationally recognized benchmarks, such as the Agency for Healthcare Research and Quality (AHRQ);
- Phase V—Verification by reviewing all data, measures, and indicators.
2.2. Bias Risk Assessment
3. Results
4. Discussion
5. Conclusions
Author Contributions
Funding
Institutional Review Board Statement
Informed Consent Statement
Data Availability Statement
Conflicts of Interest
References
- Pollitt, C.; Harrison, S.; Dowswell, G.; Jerak-Zuiderent, S.; Bal, R. Performance regimes in health care: Institutions, critical junctures and the logic of escalation in England and the Netherlands. Evaluation 2010, 16, 13–29. [Google Scholar] [CrossRef]
- Del Fante, Z.; Di Fazio, N.; Papale, A.; Tomao, P.; Del Duca, F.; Frati, P.; Fineschi, V. Evaluation of Physical Risk during Necropsy and Morgue Activities as Risk Management Strategy. Int. J. Environ. Res. Public Health 2021, 18, 8266. [Google Scholar] [CrossRef]
- Carrin, G.; James, C. Key performance indicators for the Implementation of social health insurance. Appl. Health Econ. Health Policy 2005, 4, 15–22. [Google Scholar] [CrossRef] [PubMed]
- Ferracuti, S.; Barchielli, B.; Napoli, C.; Fineschi, V.; Mandarelli, G. Evaluation of official procedures for suicide prevention in hospital from a forensic psychiatric and a risk management perspective. Int. J. Psychiatry Clin. Pract. 2020, 24, 245–249. [Google Scholar] [CrossRef]
- Young, M.; Smith, M.A. Standards and evaluation of healthcare quality, safety, and person centered care. In StatPearls [Internet]; StatPearls Publishing: Treasure Island, FL, USA, 2022. [Google Scholar]
- Sisk, R.; Lin, L.; Sperrin, M.; Barrett, J.K.; Tom, B.; Diaz-Ordaz, K.; Martin, G.P. Informative presence and observation in routine health data: A review of methodology for clinical risk prediction. J. Am. Med. Inf. Assoc. 2021, 28, 155–166. [Google Scholar] [CrossRef]
- Guiñón, L.; Soler, A.; Gisell Díaz, M.; Fernández, R.M.; Rico, N.; Bedini, J.L.; Mira, A.; Alvarez, L. Analytical performance assessment and improvement by means of the Failure mode and effect analysis (FMEA). Biochem. Med. 2020, 30, 250–256. [Google Scholar] [CrossRef] [PubMed]
- Braithwaite, J.; Hibbert, P.; Blakely, B.; Plumb, J.; Hannaford, N.; Long, J.C.; Marks, D. Health system frameworks and performance indicators in eight countries: A comparative international analysis. SAGE Open Med. 2017, 5, 2050312116686516. [Google Scholar] [CrossRef]
- Allen, T.; Walshe, K.; Proudlove, N.; Sutton, M. Do performance indicators predict regulator ratings of healthcare providers? Cross-sectional study of acute hospitals in England. Int. J. Qual. Health Care 2020, 32, 113–119. [Google Scholar] [CrossRef]
- Mainz, J. Defining and classifying clinical indicators for quality improvement. Int. J. Qual. Health Care 2003, 15, 523–530. [Google Scholar] [CrossRef]
- Beaussier, A.-L.; Demeritt, D.; Griffiths, A.; Rothstein, H. Steering by their own lights: Why regulators across Europe use different indicators to measure healthcare quality. Health Policy 2020, 124, 501–510. [Google Scholar] [CrossRef]
- Berg, M.; Meijerink, Y.; Gras, M.; Goossensen, A.; Schellekens, W.; Haeck, J.; Kingma, H. Feasibility first: Developing public performance indicators on patient safety and clinical effectiveness for Dutch hospitals. Health Policy 2005, 75, 59–73. [Google Scholar] [CrossRef] [PubMed]
- Albolino, S.; Bellandi, T.; Cappelletti, S.; Di Paolo, M.; Fineschi, V.; Frati, P.; Turillazzi, E. New Rules on Patient’s Safety and Professional Liability for the Italian Health Service. Curr. Pharm. Biotechnol. 2019, 20, 615–624. [Google Scholar] [CrossRef] [PubMed]
- Mossialos, E.; Wenzl, M.; Osborn, R.; Sarnak, D. International profiles of health care systems. CADTH 2015, 97–106. [Google Scholar] [CrossRef]
- Mohammadfam, I.; Kamalinia, M.; Momeni, M.; Golmohammadi, R.; Hamidi, Y.; Soltanian, A. Evaluation of the quality of occupational health and safety management systems based on key performance indicators in certified organizations. Saf. Health Work. 2017, 8, 156–161. [Google Scholar] [CrossRef] [PubMed]
- Agrizzi, D.; Jaafaripooyan, E.; Akbarihaghighi, F. Key Performance Indicators (KPIs) for Healthcare Accreditation System. 2010. Available online: https://eprints.soton.ac.uk/79297/1/CRAAG-10-01.pdf (accessed on 4 May 2022).
- Murphy, A.; Wakai, A.; Walsh, C.; Cummins, F.; O’Sullivan, R. Development of key performance indicators for prehospital emergency care. Emerg. Med. 2016, 33, 286–292. [Google Scholar] [CrossRef] [PubMed]
- D’errico, S.; Pennelli, S.; Colasurdo, A.P.; Frati, P.; Sicuro, L.; Fineschi, V. The right to be informed and fear of disclosure: Sustainability of a full error disclosure policy at an Italian cancer centre/clinic. BMC Health Serv. Res. 2015, 15, 130. [Google Scholar] [CrossRef]
- Azami-Aghdash, S.; Tabrizi, J.S.; Sadeghi-Bazargani, H.; Hajebrahimi, S.; Naghavi-Behzad, M. Developing performance indicators for clinical governance in dimensions of risk management and clinical effectiveness. Int. J. Qual. Health Care 2015, 27, 110–116. [Google Scholar] [CrossRef]
- Kelley, E.; Hurst, J. Health Care Quality Indicators Project: Conceptual Framework Paper; OECD Health Working Papers: Paris, France, 2006. [Google Scholar]
- El Sayed, M.J. Measuring quality in emergency medical services: A review of clinical performance indicators. Emerg. Med. Int. 2011, 2012, 161630. [Google Scholar] [CrossRef]
- Gu, X.; Itoh, K. Performance indicators: Healthcare professionals’ views. Int. J. Health Care Qual. Assur. 2016, 29, 801–815. [Google Scholar] [CrossRef]
- Nuti, S.; Seghieri, C.; Vainieri, M. Assessing the effectiveness of a performance evaluation system in the public health care sector: Some novel evidence from the Tuscany region experience. J. Manag. Gov. 2013, 17, 59–69. [Google Scholar] [CrossRef]
- Khalifa, M.; Khalid, P. Developing strategic health care key performance indicators: A case study on a tertiary care hospital. Procedia Comput. Sci. 2015, 63, 459–466. [Google Scholar] [CrossRef]
- Botje, D.; Asbroek, G.T.; Plochg, T.; Anema, H.; Kringos, D.S.; Fischer, C.; Klazinga, N.S. Are performance indicators used for hospital quality management: A qualitative interview study amongst health professionals and quality managers in The Netherlands. BMC Health Serv. Res. 2016, 16, 574. [Google Scholar] [CrossRef] [PubMed]
- Cinaroglu, S.; Baser, O. Understanding the relationship between effectiveness and outcome indicators to improve quality in healthcare. Total. Qual. Manag. Bus. Excel. 2018, 29, 1294–1311. [Google Scholar] [CrossRef]
- Sheldon, T. Promoting health care quality: What role performance indicators? Qual. Health Care 1998, 7, 45–50. [Google Scholar]
- Sinelnikov, S.; Inouye, J.; Kerper, S. Using leading indicators to measure occupational health and safety performance. Saf. Sci. 2015, 72, 240–248. [Google Scholar] [CrossRef]
- Magee, H.; Davis, L.J.; Coulter, A. Public views on healthcare performance indicators and patient choice. J. R. Soc. Med. 2003, 96, 338–342. [Google Scholar] [CrossRef]
- Bein, M.A.; Unlucan, D.; Olowu, G.; Kalifa, W. Healthcare spending and health outcomes: Evidence from selected East African countries. Afr. Health Sci. 2017, 17, 247–254. [Google Scholar] [CrossRef]
- Burlea-Schiopoiu, A.; Ferhati, K. The Managerial Implications of the Key Performance Indicators in Healthcare Sector: A Cluster Analysis. Healthcare 2021, 9, 19. [Google Scholar] [CrossRef]
- Chae, Y.M.; Kim, H.S.; Tark, K.C.; Park, H.J.; Ho, S.H. Analysis of healthcare quality indicator using data mining and decision support system. Expert Syst. Appl. 2003, 24, 167–172. [Google Scholar] [CrossRef]
- NICE. Indicator Process Guide. 2019. Available online: https://www.nice.org.uk/media/default/Get-involved/Meetings-In-Public/indicator-advisory-committee/ioc-process-guide.pdf (accessed on 15 February 2023).
- Madsen, M.; Kiuru, S.; Castrèn, M.; Kurland, L. The level of evidence for emergency department performance indicators: Systematic review. Eur. J. Emerg. Med. 2015, 22, 298–305. [Google Scholar] [CrossRef]
- Powell, A.; Davies, H.; Thompson, R. Using routine comparative data to assess quality of health care. Qual. Saf. Health Care 2003, 12, 122–128. [Google Scholar] [CrossRef] [PubMed]
- Rahimi, H.; Kavosi, Z.; Shojaei, P.; Kharazmi, E. Key performance indicators in hospital based on balanced scorecard model. J. Health Man. Inf. 2017, 4, 17–24. [Google Scholar]
- Palmer, R.H. Quality health care. JAMA 1996, 275, 1851–1852. [Google Scholar] [CrossRef] [PubMed]
- Hofer, T.P.; Bernstein, S.J.; Hayward, R.A.; DeMonner, S. Validating Quality Indicators for Hospital Care. Jt. Comm. J. Qual. Patient Saf. 1997, 23, 455–467. [Google Scholar] [CrossRef]
- Campbell, S.M.; Braspenning, J.; Hutchinson, A.; Marshall, M. Research methods used in developing and applying quality indicators in primary care. Qual. Saf. Health Care 2002, 11, 358–364. [Google Scholar] [CrossRef]
- Magnan, S.; Solberg, L.I.; Giles, K.; Kottke, T.E.; Wheeler, J.W. Primary care, process improvement, and turmoil. J. Ambul. Care Manag. 1997, 20, 32–38. [Google Scholar] [CrossRef]
- Arah, O.A.; Westert, G.P.; Hurst, J.; Klazinga, N.S. A conceptual framework for the OECD health care quality indicators project. Int. J. Qual. Health Care 2006, 18, 5–13. [Google Scholar] [CrossRef]
- Kelley, E.T.; Arispe, I.; Holmes, J. Beyond the initial indicators: Lessons from the OECD health care quality indicators project and the US national healthcare quality report. Int. J. Qual. Health Care 2006, 18, 45–51. [Google Scholar] [CrossRef]
- Fineschi, V. Healthcare-Associated Infections: Antibiotic Poly-therapies, Antibiotic Prophylaxis and Appropriate Policy for the Risk Management to Fight Adverse Events. Curr. Pharm. Biotechnol. 2019, 20, 606–608. [Google Scholar] [CrossRef]
- Alsharf, I.A. Performance Management in Healthcare. J. Appl. Manag. Invest. 2015, 4, 45–52. [Google Scholar]
- Giraldi, G.; Montesano, M.; Napoli, C.; Frati, P.; La Russa, R.; Santurro, A.; Scopetti, M.; Orsi, G.B. Healthcare-Associated Infections Due to Multidrug-Resistant Organisms: A Surveillance Study on Extra Hospital Stay and Direct Costs. Curr. Pharm. Biotechnol. 2019, 20, 643–652. [Google Scholar] [CrossRef] [PubMed]
- Fineschi, V.; Arcangeli, M.; Di Fazio, N.; Del Fante, Z.; Fineschi, B.; Santoro, P.; Frati, P. Associazione Consulcesi Health And Onlus Futura Ricerca. Defensive Medicine in the Management of Cesarean Delivery: A Survey among Italian Physicians. Healthcare 2021, 9, 1097. [Google Scholar] [CrossRef]
- Bankauskaite, V.; Dargent, G. Health systems performance indicators: Methodological issues. Presup. Y Gasto Publico 2007, 49, 125–137. [Google Scholar]
- Scopetti, M.; Santurro, A.; Tartaglia, R.; Frati, P.; Fineschi, V. Expanding frontiers of risk management: Care safety in nursing home during COVID-19 pandemic. Int. J. Qual. Health Care 2021, 33, mzaa085. [Google Scholar] [CrossRef] [PubMed]
- Van den Heuvel, J.; Niemeijer, G.C.; Does, R.J. Measuring healthcare quality: The challenges. Int. J. Health Care Qual. Assur. 2013, 26, 269–278. [Google Scholar] [CrossRef] [PubMed]
- Pourmohammadi, K.; Hatam, N.; Shojaei, P.; Bastani, P. A comprehensive map of the evidence on the performance evaluation indicators of public hospitals: A scoping study and best fit framework synthesis. Cost Eff. Resour. Alloc. 2018, 16, 64. [Google Scholar] [CrossRef]
- Bevan, G.; Evans, A.; Nuti, S. Reputations count: Why benchmarking performance is improving health care across the world. Health Econ. Policy Law 2018, 14, 141–161. [Google Scholar] [CrossRef]
- Van der Geer, E.; van Tuijl, H.F.; Rutte, C.G. Performance management in healthcare: Performance indicator development, task uncertainty, and types of performance indicators. Soc. Sci. Med. 2009, 69, 1523–1530. [Google Scholar] [CrossRef]
- Donabedian, A. An Introduction to Quality Assurance in Health Care; Oxford University Press: Oxford, UK, 2002. [Google Scholar]
- Hejduková, P.; Kureková, L. National health systems’ performance: Evaluation WHO indicators. Procedia Soc. Behav. Sci. 2016, 230, 240–248. [Google Scholar] [CrossRef]
- Rademakers, J.; Delnoij, D.; de Boer, D. Structure, process or outcome: Which contributes most to patients’ overall assessment of healthcare quality? BMJ Qual. Saf. 2011, 20, 326–331. [Google Scholar] [CrossRef]
- Donabedian, A. The quality of care: How can it be assessed? JAMA 1998, 260, 1743–1748. [Google Scholar] [CrossRef]
- Podgórski, D. Measuring operational performance of OSH management system–A demonstration of AHP-based selection of leading key performance indicators. Saf. Sci. 2015, 73, 146–166. [Google Scholar] [CrossRef]
- Pronovost, P.; Nolan, T.; Zeger, S.; Miller, M.; Rubin, H. How can clinicians measure safety and quality in acute care? Lancet 2004, 363, 1061–1067. [Google Scholar] [CrossRef] [PubMed]
- Martin, S.; Smith, P.C. Multiple public service performance indicators: Toward an integrated statistical approach. J. Public Adm. Res. Theory 2005, 15, 599–613. [Google Scholar] [CrossRef]
- Boulkedid, R.; Abdoul, H.; Loustau, M.; Sibony, O.; Alberti, C. Using and Reporting the Delphi Method for Selecting Healthcare Quality Indicators: A Systematic Review. PLoS ONE 2011, 6, e20476. [Google Scholar] [CrossRef]
- Northcott, H.C.; Harvey, M.D. Public perceptions of key performance indicators of healthcare in Alberta, Canada. Int. J. Qual. Health Care 2012, 24, 214–223. [Google Scholar] [CrossRef]
- Mainz, J. Developing evidence-based clinical indicators: A state of the art methods primer. Int. J. Qual. Health Care 2003, 15, i5–i11. [Google Scholar] [CrossRef]
- Runciman, W.; Hibbert, P.; Thomson, R.; Van Der Schaaf, T.; Sherman, H.; Lewalle, P. Towards an International Classification for Patient Safety: Key concepts and terms. Int. J. Qual. Health Care 2009, 21, 18–26. [Google Scholar] [CrossRef]
- Tahir, A.C.; Darton, R. The Process Analysis Method of selecting indicators to quantify the sustainability performance of a business operation. J. Clean. Prod. 2010, 18, 1598–1607. [Google Scholar] [CrossRef]
- Scopetti, M.; Padovano, M.; Manetti, F.; Gatto, V.; D’errico, S.; Santurro, A.; Frati, P.; Fineschi, V. Key Performance Indicators in Claims Management: Definition of a Set of Indicators for the Evaluation of the Medico-Legal Activity. Curr. Pharm. Biotechnol. 2021, 22, 1971–1984. [Google Scholar] [CrossRef]
- Mant, J. Process versus outcome indicators in the assessment of quality of health care. Int. J. Qual. Health Care 2001, 13, 475–480. [Google Scholar] [CrossRef] [PubMed]
- La Russa, R.; Viola, R.V.; D’errico, S.; Aromatario, M.; Maiese, A.; Anibaldi, P.; Napoli, C.; Frati, P.; Fineschi, V. Analysis of Inadequacies in Hospital Care through Medical Liability Litigation. Int. J. Environ. Res. Public Health 2021, 18, 3425. [Google Scholar] [CrossRef] [PubMed]
- Foti, F.; De-Giorgio, F.; Vetrugno, G. Let us learn from litigation claims: Actuarial tools can improve safety. BMJ 2021, 373, n1480. [Google Scholar] [CrossRef]
- Santurro, A.; Vullo, A.M.; Borro, M.; Gentile, G.; LA Russa, R.; Simmaco, M.; Frati, P.; Fineschi, V. Personalized Medicine Applied to Forensic Sciences: New Advances and Perspectives for a Tailored Forensic Approach. Curr. Pharm. Biotechnol. 2017, 18, 263–273. [Google Scholar] [CrossRef] [PubMed]
- Mandarelli, G.; Parmigiani, G.; Tarsitani, L.; Frati, P.; Biondi, M.; Ferracuti, S. The Relationship Between Executive Functions and Capacity to Consent to Treatment in Acute Psychiatric Hospitalization. J. Empir. Res. Hum. Res. Ethic 2012, 7, 63–70. [Google Scholar] [CrossRef] [PubMed]
- Toccafondi, G.; Dagliana, G.; Fineschi, V.; Frati, P.; Tartaglia, R. Proactive Risk Assessment through FMEA of Home Parenteral Nutrition Care Processes: A Survey Analysis. Curr. Pharm. Biotechnol. 2021, 22, 433–441. [Google Scholar] [CrossRef]
- Vetrugno, G.; Foti, F.; Grassi, V.M.; De-Giorgio, F.; Cambieri, A.; Ghisellini, R.; Clemente, F.; Marchese, L.; Sabatelli, G.; Delogu, G.; et al. Malpractice Claims and Incident Reporting: Two Faces of the Same Coin? Int. J. Environ. Res. Public Health 2022, 19, 16253. [Google Scholar] [CrossRef]


| Structure | Umberto I General Hospital | Agostino Gemelli University Hospital Foundation | Campus Bio-Medico University Hospital Foundation |
|---|---|---|---|
| Ordinary beds (no.) | 1235 | 1536 | 296 |
| No. of hospitalizations in the last year | 41,000 | 94,509 | 28,700 hospitalizations |
| No. of accesses to the emergency room | Over 140,000 | 83,419 | 11,600 |
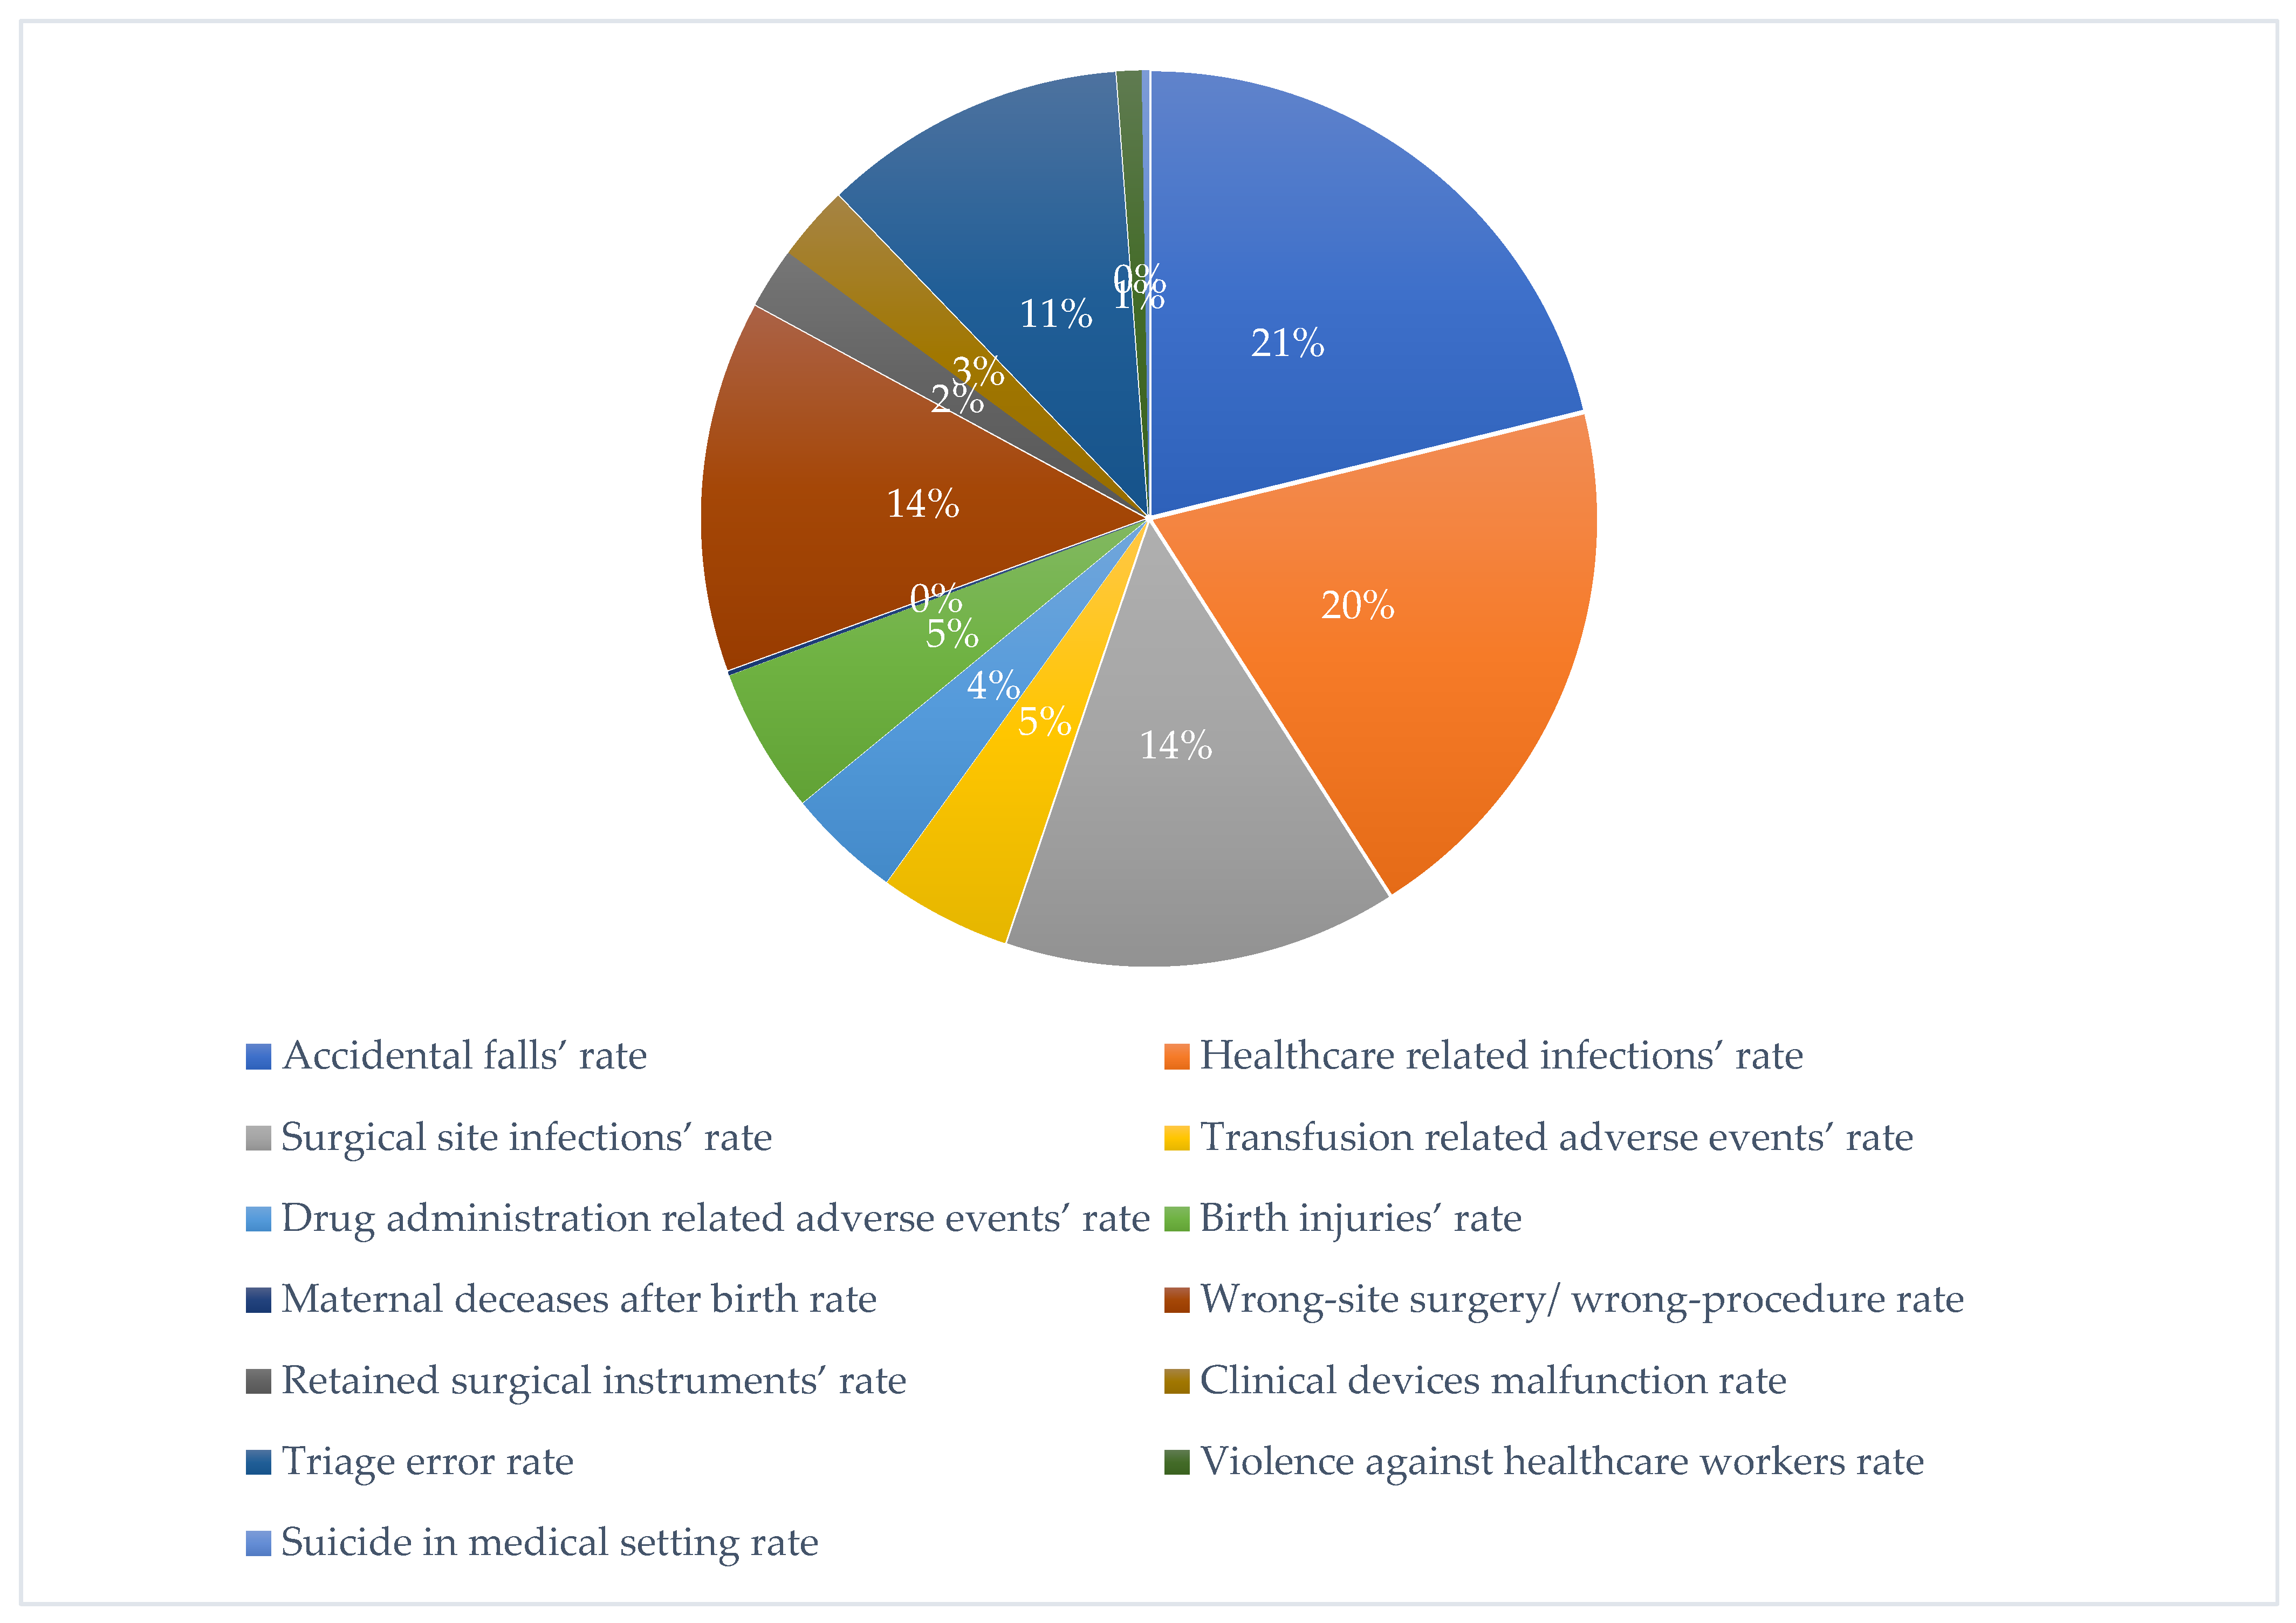
| Dimension | Index | Outcome indicator | Description |
|---|---|---|---|
| Clinical setting | Quality of care | Accidental falls rate | Number of accidental falls/total of claims |
| Healthcare-related infections rate | Number of healthcare-related infections/total of claims | ||
| Surgical site infections rate | Number of surgical site infections/total of claims | ||
| Transfusion-related adverse events rate | Number of transfusions-related adverse events/total of claims | ||
| Drug administration-related adverse events rate | Number of drug administration-related adverse events/total of claims | ||
| Birth injuries rate | Number of maternal birth injuries/total of claims | ||
| Maternal deceases after birth rate | Number of maternal deceases after birth/total of claims | ||
| Wrong-site surgery/wrong procedure rate | Number of wrong procedures and wrong-site surgeries/total of claims | ||
| Retained surgical instruments’ rate | Number of cases of retained surgical instruments/total of claims | ||
| Clinical devices malfunction rate | Number of cases related to clinical devices malfunction/total of claims | ||
| Triage error rate | Number of cases related to triage errors/total of claims | ||
| Violence against healthcare workers rate | Number of cases related to violence against healthcare workers/total of claims | ||
| Suicide in medical setting rate | Number of suicides in medical setting/total of claims |
Disclaimer/Publisher’s Note: The statements, opinions and data contained in all publications are solely those of the individual author(s) and contributor(s) and not of MDPI and/or the editor(s). MDPI and/or the editor(s) disclaim responsibility for any injury to people or property resulting from any ideas, methods, instructions or products referred to in the content. |
© 2023 by the authors. Licensee MDPI, Basel, Switzerland. This article is an open access article distributed under the terms and conditions of the Creative Commons Attribution (CC BY) license (https://creativecommons.org/licenses/by/4.0/).
Share and Cite
Di Fazio, N.; Scopetti, M.; Delogu, G.; La Russa, R.; Foti, F.; Grassi, V.M.; Vetrugno, G.; De Micco, F.; De Benedictis, A.; Tambone, V.; et al. Analysis of Medico-Legal Complaint Data: A Retrospective Study of Three Large Italian University Hospitals. Healthcare 2023, 11, 1406. https://doi.org/10.3390/healthcare11101406
Di Fazio N, Scopetti M, Delogu G, La Russa R, Foti F, Grassi VM, Vetrugno G, De Micco F, De Benedictis A, Tambone V, et al. Analysis of Medico-Legal Complaint Data: A Retrospective Study of Three Large Italian University Hospitals. Healthcare. 2023; 11(10):1406. https://doi.org/10.3390/healthcare11101406
Chicago/Turabian StyleDi Fazio, Nicola, Matteo Scopetti, Giuseppe Delogu, Raffaele La Russa, Federica Foti, Vincenzo M. Grassi, Giuseppe Vetrugno, Francesco De Micco, Anna De Benedictis, Vittoradolfo Tambone, and et al. 2023. "Analysis of Medico-Legal Complaint Data: A Retrospective Study of Three Large Italian University Hospitals" Healthcare 11, no. 10: 1406. https://doi.org/10.3390/healthcare11101406
APA StyleDi Fazio, N., Scopetti, M., Delogu, G., La Russa, R., Foti, F., Grassi, V. M., Vetrugno, G., De Micco, F., De Benedictis, A., Tambone, V., Rinaldi, R., Frati, P., & Fineschi, V. (2023). Analysis of Medico-Legal Complaint Data: A Retrospective Study of Three Large Italian University Hospitals. Healthcare, 11(10), 1406. https://doi.org/10.3390/healthcare11101406