Abstract
Celiac disease is a common immune-related inflammatory disease of the small intestine caused by gluten in genetically predisposed individuals. This research is a proof-of-concept exercise focused on using Artificial Intelligence (AI) and an autoimmune discovery gene panel to predict and model celiac disease. Conventional bioinformatics, gene set enrichment analysis (GSEA), and several machine learning and neural network techniques were used on a publicly available dataset (GSE164883). Machine learning and deep learning included C5, logistic regression, Bayesian network, discriminant analysis, KNN algorithm, LSVM, random trees, SVM, Tree-AS, XGBoost linear, XGBoost tree, CHAID, Quest, C&R tree, random forest, and neural network (multilayer perceptron). As a result, the gene panel predicted celiac disease with high accuracy (95–100%). Several pathogenic genes were identified, some of the immune checkpoint and immuno-oncology pathways. They included CASP3, CD86, CTLA4, FASLG, GZMB, IFNG, IL15RA, ITGAX, LAG3, MMP3, MUC1, MYD88, PRDM1, RGS1, etc. Among them, B and T lymphocyte associated (BTLA, CD272) was highlighted and validated at the protein level by immunohistochemistry in an independent series of cases. Celiac disease was characterized by high BTLA, expressed by inflammatory cells of the lamina propria. In conclusion, artificial intelligence predicted celiac disease using an autoimmune discovery gene panel.
1. Introduction
Celiac disease is a frequent type of immune-mediated inflammatory disease of the small intestine. This gluten-sensitive enteropathy is caused by higher sensitivity of the gut and immune system to gluten of the diet and to gluten-related proteins [1].
The pathogenesis of celiac disease depends on genetic factors and mucosal immune response. This immune disorder occurs in genetically predisposed patients after induction by an environmental factor, which is gluten in the diet, found in cereals. More than 99% of the patients have HLA DR3-DQ2 and/or the DR4-DQ8 [2,3,4], but other non-HLA locus genes may also be involved in the disease pathogenesis, such as TNFAIP3 (A20), REL, NKG2D, MICA, CTLA4, MMP3, MIF, and etcetera [5,6,7,8,9,10,11,12,13,14,15]. Celiac disease is associated with several autoimmune disorders, such as type 1 diabetes mellitus and autoimmune thyroid disease [16,17]. The mucosal immune response also participates in the disease pathogenesis. An inflammatory reaction develops in response to gliadin fractions, and a result there is inflammation of the lamina propria and epithelium, with disruption of the epithelial layer and villous atrophy. Both the innate and adaptive immune responses are activated in celiac disease, including gliadin reactive T cells, autoantibodies, intraepithelial lymphocytes, macrophages, monocytes, and dendritic cells.
A detailed description of the pathogenesis of celiac disease is shown in Table 1.

Table 1.
Pathogenesis of Celiac Disease.
Celiac disease has an estimated prevalence of 1% in the general population based on serologic studies, although in many cases the disease is asymptomatic [52,53]. The most relevant clinical manifestation is due to malabsorption, and includes diarrhea, weight loss, anemia, and other metabolic disturbances. Of note is that celiac disease can have diverse extraintestinal presentations such as delayed puberty, hepatitis, iron-deficiency anemia, arthralgia and arthritis, peripheral neuropathy, epilepsy and seizures, cerebellar ataxia, and dermatitis herpetiformis (among others) [1,29]. The diagnosis is made by a combination of clinical signs and symptoms, serology testing, and small intestine biopsy. Additional diagnostic tools include HLA typing, quantification of inflammatory cells in the small intestine biopsy such as increased CD3-positive lymphocytes in the villus tips or the quantification of intra-epithelial lymphocytes (IELs), and detection of TG2-targeted celiac IgA isotype autoantibodies in the intestinal mucosa, and detection of gluten-specific T cells in the circulation by ELISPOT [29].
Celiac disease has associated conditions including selective IgA deficiency, autoimmune disease, gastrointestinal disease (reflux disease, eosinophil esophagitis, inflammatory bowel disease, microscopic colitis, liver disease, and pancreatitis), menstrual and reproductive issues, idiopathic pulmonary hemosiderosis, and cardiovascular and kidney diseases [1].
Celiac disease is associated with several autoimmune diseases including diabetes mellitus type 1 [54,55,56,57], autoimmune thyroid disease (hypothyroidism) [58,59], and atopic dermatitis [60,61]. Other manifestations related to serological autoantibodies includes neurological disorders (peripheral neuropathy and ataxia) [62], and neurodegeneration via apoptosis [63].
Patients with untreated celiac disease are at increased risk of lymphoma and gastrointestinal cancer [1]. Patients with refractory celiac disease type II may be associated with enteropathy-associated T-cell lymphoma (EATL) [64,65,66,67,68,69].
Due to the clinical relevance of this disease, a better understanding of the pathogenesis is needed, and using non-linear analysis may provide a different approach. This research was a proof-of-concept exercise to determine whether artificial intelligence analysis was a feasible approach to model celiac disease using an autoimmune discovery gene panel.
2. Materials and Methods
2.1. Celiac Disease GSE164883 Dataset
A suitable gene expression dataset was searched at the Gene Expression Omnibus (GEO) database search engine of the National Library of Medicine, National Center for Biotechnology Information (NIH): https://www.ncbi.nlm.nih.gov/ (last accessed 11 July 2022). A public dataset from 24 March 2021, the GSE164883, was selected and downloaded [70]. This dataset, published by Dr. Worf J et al., includes a high-resolution analysis of transcriptomes obtained from 48 duodenal biopsies of 26 children and adolescents diagnosed with celiac disease, and 22 children without celiac disease as controls. Biopsies were obtained from the descending duodenum and snap frozen using liquid nitrogen. After homogenization (TissueLyzer, Qiagen, Hilden, Germany), total RNA was extracted using AllPrep® DNA/RNA Microkit (Qiagen). The Illumina HumanHT-12 V4.0 gene expression beadchip was used [70].
The clinical characteristics were as follows: in the celiac disease group, the age ranged from 3 to 17 years, with a median of 9.5, and a mean of 9.0 ± 4.5. Based on the Marsh classification, the stage was 3 in all cases, A in 6 of 26 (23.1%), B in 13 of 26 (50%), and C in 7 of 26 (26.9%). In the control group, the age ranged from 1 to 17 years, with a median of 12.5, and a mean of 11.4 ± 4.8 years. Based on the Marsh classification, 0 in 19 of 22 (86.4%), and 1 in 3 of 22 (13.6%) [70].
2.2. GEOR Analysis
The GEO2R software was used to compare two groups of samples (celiac disease versus control) to identify genes that were differentially expressed across experimental conditions. The adjustment to the p values was Benjamini & Hochberg (false discovery rate), apply transformation to the data (auto-detect), no application of limma precision weights (wooma), no force normalization. The significance level cut-off was set at 0.05. The software runs in R 3.2.2 (R Foundation for Statistical Computing, Vienna, Austria), Biobase 2.30.0, GEOquery 2.40.0, and limma 3.26.8.
2.3. Transcriptome Panels
The autoimmune discovery transcriptome panel contains 755 genes that are either closely associated with germline variants across nine different autoimmune diseases or are relevant to the immune response. The nine autoimmune diseases are celiac disease (n = 249), ulcerative colitis (n = 201) and Crohn’s disease (i.e., inflammatory bowel disease, n = 253), multiple sclerosis (n = 104), rheumatoid arthritis (n = 95), systemic lupus erythematosus (n = 55), type 1 diabetes mellitus (n = 44), psoriasis (n = 48), and ankylosing spondylitis (n = 43). Of note, some genes overlap in different categories. That panel was curated from studies that were available from the ImmunoBase database or from genome-wide association (GWAS) studies. The database can be explored at the following link: https://genetics.opentargets.org/immunobase; https://www.opentargets.org/; https://docs.google.com/spreadsheets/d/1YYbxC1NhtbYuBYe2gYZNcxO0a0S4oTxHfoYtZrqKsrM/edit#gid=1589938306 (accessed on 11 July 2022). The list of 755 genes can be accessed at the following link: https://doi.org/10.5281/zenodo.6976192 (accessed on 9 August 2022).
Additional panels were also included in the analysis, including the metabolic pathways (n = 751 genes), immune exhaustion (n = 803), human inflammation (n = 250), host response (n = 790), autoimmune (n = 756), organ transplantation (n = 765), cancer transcriptomic atlas (n = 1794), pan-cancer human (n = 755), pan-cancer immune profiling (n = 730), pan-cancer progression (n = 742), and pan-cancer pathways (n = 730). These panels were previously used in the mantle cell lymphoma and artificial intelligence project [71].
2.4. Gene Set Enrichment Analysis (GSEA)
The GSEA software (GSEA v4.2.3) was downloaded from the Broad Institute, Inc., Massachusetts Institute of Technology, and Regents of the University of California webpage: http://www.gsea-msigdb.org/gsea/index.jsp (accessed on 11 July 2022).
The following molecular signatures, divided into nine major collections of gene sets (database v7.5.1), were downloaded: H (hallmark), C1 (positional), C2 (curated), C3 (regulatory target), C4 (computational), C5 (ontology), C6 (oncogenic signature), C7 (immunologic signature), and C8 (cell type signature gene sets).
Four types of files were created, the gene expression dataset (gct), the phenotype labels (cls), the gene sets (gmx), and the annotations (chip). As parameters, the number of permutations was set at 1000. Phenotype labels: celiac disease versus control. Collapse to gene symbols using max. probe. Permutation type: phenotype. Enrichment statistic: weighted. Metric for ranking genes: sinal2noise. Gene list sorting mode: descending. Normalization mode: meandiv. Seed of permutation: timestamp. Randomization mode: no balance. Of note, the autoimmune discovery panel and the other additional panels were also coded into gmx gene sets.
2.5. Statistical Analyses
All analyses were performed using a desktop equipped with the following hardware: AMD RyzenTM 9 5900X processor (12 CPU cores, L2 cache 6 MB, L3 cache 64 MB), an Nvidia GEFORCE RTX 3060 Ti graphic card, and 16.0 GB of RAM.
IBM SPSS version 27.0.1.0 (64-bit edition) was used for the basic statistical analyses (IBM Corporation, New Orchard Road Armonk, New York, NY, USA). Additionally, several software applications were used for acquisition, processing, analysis, and validation/confirmation of results. The software included Microsoft excel 2016 (Microsoft Corporation, One Microsoft Way, Redmond, WA, USA), EditPad Lite (Just Great Software Co., Ltd., Rawai Phuket, Thailand), GSEA v4.2.3 (UC San Diego, Broad Institute, Merkin Building, 415 Main St., Cambridge, MA, USA), JMP Pro 14 (JMP Statistical Discovery LLC, SAS Institute Japan Ltd., Roppongi, Minato-ku, Tokyo, Japan), Minitab 21 (Minitab, LLC, State College, PA, USA), IBM SPSS modeler 18 (IBM), and RapidMiner Studio 9 (RapidMiner, Inc., Boston, MA, USA). GEO2R ran on R 3.2.3, Biobase 2.30.0, GEOquery 2.40.0, and limma 3.26.8. All the analyses were performed as previously described in our previous publications [72,73,74,75,76,77,78,79,80,81]. The multilayer perceptron analysis is described in references [72,76,78]. Immunohistochemical procedures are described in references [73,74,75,77]. Machine learning techniques are shown in references [75,79,80]. The method of analysis of this research is equivalent to the one recently published in ulcerative colitis [81].
2.6. Immunohistochemical Analysis of BTLA in an Independent Series
BTLA was analyzed at protein level by immunohistochemistry using an automated stainer (Leica BOND-MAX) following the manufacturer’s instructions. The primary antibody was obtained from Dr. Giovanna Roncador (Monoclonal Antibodies Laboratory, Spanish National Cancer Research Institute, CNIO, Madrid, Spain). The primary antibody, mouse monoclonal, targeted BTLA (B and T lymphocyte associated protein), clone name FLO67B. The antigen used was BTLA-HIS recombinant protein (full-length protein without signal peptide 25–289aa). IgG1 isotype. Species reactivity, human. Localization, membrane/cytoplasm. Positive control, tonsil. The recommended dilution, 1:5 (supernatant) or 1:100 (purified antibody, 1 mg/mL). Antigen retrieval, 20 min ER2 (Tris-EDTA). Antibody incubation, 15 min. The detection system, BOND Polymer Refine Detection (BOND-MAX, Leica).
Immunohistochemistry was performed in 16 celiac disease patients (57 biopsies), and 16 control cases (16 small intestine biopsies). The cases were selected from the Department of Pathology, Hospital Clinic of Barcelona, Spain. The cases were diagnosed in patients with positive celiac serology, based on histological criteria using biopsies of the small intestine: the presence of increased intraepithelial lymphocytes with crypt hyperplasia (Marsh type 2) or with villous atrophy (Marsh type 3) (Appendix A, Table A1).
3. Results
Summary of the results.
- A conventional analysis using GEO2R highlighted the genes differentially expressed between celiac disease and control.
- Gene set enrichment analysis (GSEA) identified the gene sets (pathways) that were associated with celiac disease, including the autoimmune discovery panel.
- Several Machine learning and artificial neural network analyses predicted celiac disease using the autoimmune discovery panel with high accuracy.
- Celiac disease was characterized by high expression of BTLA both at the gene expression level, and at protein level by immunohistochemistry in a validation series.
3.1. Gene Expression Analysis Using the GEO2R Software
The differential gene expression across celiac disease and control cases was analyzed using a conventional method (NCBI GEO2R software), and the result is shown in Figure 1. In this analysis, all the genes of the Illumina HumanHT-12 V4.0 gene expression beadchip were used to explore broadly the expression of celiac disease. The most significantly up-regulated genes in celiac disease were TAP1, HLA-E, HCP5, STAT1, GBP1, STAT1, LOC100419583, and GBP4 and the down-regulated ones were IDS, PKIB, FBXO2, OXT, and ADI1.
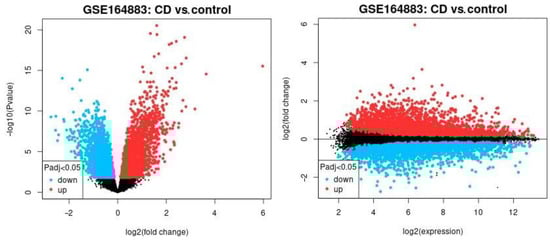
Figure 1.
The differential gene expression between celiac disease and control cases. The gene expression of the groups of celiac disease and control samples were compared using GEO2R software. The up-regulated genes are highlighted in red, the down-regulated in blue, and the non–significant in black. Left, the volcano plot. Right, mean difference plot.
3.2. Gene Set Enrichment Analysis (GSEA)
To improve the analysis of GEO2R software, a pathway analysis was performed using the gene set enrichment analysis (GSEA). GSEA is a computational method that determines whether a priori set of genes shows statistically significant, concordant differences between two groups.
The analysis using all gene sets of all collections of the Molecular Signatures Database (MSigDB version 7.5.1) was successful. In the nine major collections, a total of 5600 sets were significantly enriched at a nominal p value of <1%.
Among the C2 curated gene sets, one of the most significant was the M16004 KEGG antigen processing and presentation set (in the leading edge of the core enrichment, TAP1, HLA-E, RFX5, IFI30, CD8A, etc.) (Figure 2). Other relevant pathways within the C2 set were the M15615 interferon gamma response (IFNG), M543, M7963, and M16647 cell cycle, M15381 TCR signaling, M11884 antigen response, and M1060 cytokine signaling.
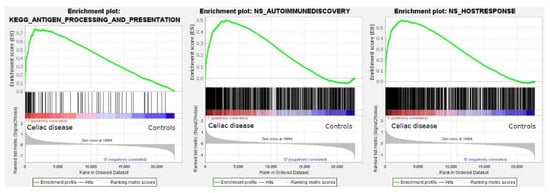
Figure 2.
Gene set enrichment analysis (GSEA). GSEA analysis was performed to identify gene sets (i.e., pathways) associated with celiac disease. All the sets of the nine major collections of the Molecular Signatures Databases were tested and 5600 sets were significantly enriched at a nominal p value of <1%. Among them, the antigen processing and presentation is highlighted (left). The autoimmune discovery transcriptome panel and additional panels were also tested, and showed an enrichment (association) toward celiac disease (autoimmune discovery panel, center; host immune response panel, right).
The GSEA analysis using the autoimmune discovery panel and additional panels such as the host immune response were also statistically significant and enriched the celiac disease group (Figure 2). The most significant genes at the leading edge of the core enrichment of the autoimmune discovery panel were STAT1, GBP1, IFNG, IRF1, RIPK2, CXCL10, CXCR6, BATF, ITGAL, and GFI. Additional markers relevant to the pathogenesis (with the immune microenvironment) of celiac disease were also found within the core enrichment, including LAG3, MICB, RUNX3, CASP3, IL15RA, FASLG, CTLA4, IL10RA, GZMA, RGS1, IRF4, XBP1, CD69, NFKB1, BTLA, TIGIT, ICOS, CD86, ITGAX, CD274, TNFAIP3, MMP3, MIF, BTK, and MYD88.
3.3. Artificial Intelligence Analysis
Based on the autoimmune discovery panel, celiac disease prediction and modeling was performed using several machine learning and artificial neural networks. In total, 737 genes from the panel were used as predictors (inputs, fields) of celiac disease (dependent variable: celiac disease versus control). Among the 15 different techniques, the overall accuracy for prediction was 100% in 11 (73%), 96% in 2 (13%), 86% in 1 (7%), and 0% in 1 (7%) (Table 2 and Table 3, Figure 3 and Figure 4). Of note is that each type of analysis used a specific number of genes, and the type of information and data interpretation was different. Generally, all methods managed to highlight genes characteristic of celiac disease, and some genes were selected in different models. The relevant genes that were identified and that play a role in the pathogenesis of celiac disease were IFNG, CASP3, MIF, PRDM1, GZMB, LAG3, MUC1, CD226, BTLA, and BTK (among others).
Table 2.
Machine learning and artificial neural network analysis for predicting celiac disease.
Table 3.
Logistic regression.
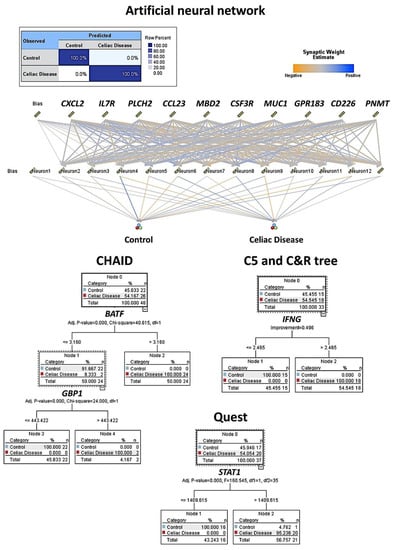
Figure 3.
Machine learning and artificial neural network analysis for predicting celiac disease. This figure shows the results of the modeling of celiac disease using an artificial neural network, CHAID, C5, C & R, and Quest decision trees. The overall accuracy ranged from 96% to 100% using as predictors the gene expression (transcriptomic) data of the autoimmune discovery panel.
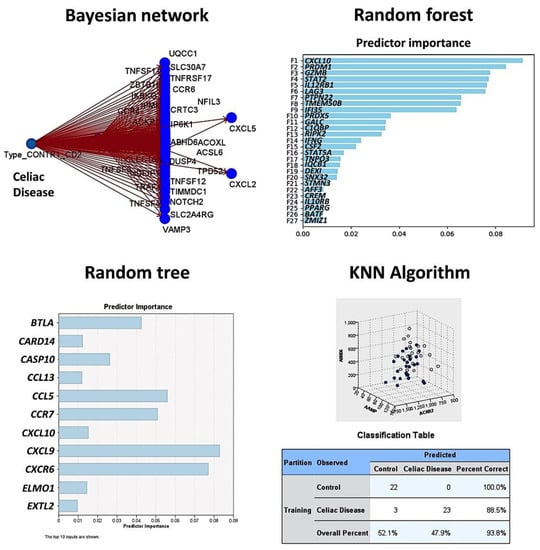
Figure 4.
Prediction of celiac disease using the Bayesian network, random forest and tree, and the KNN algorithm. This figure shows the results of the modeling of celiac disease using the autoimmune discovery panel. The Bayesian network shows the genes (nodes) and the probabilistic, or conditional, independencies between them. The causal relationships may be represented, but the links (arcs) of the network do not necessarily represent direct cause and effect. The random forest plot and tree show the genes of the model, ranked according to their predicted importance. The KNN chart is a lower-dimensional projection of the predictor space, which contains 737 predictors (genes of the autoimmune discovery panel).
The artificial neural network was a multilayer perceptron. The network architecture had three layers. The input layer included the predictors (737 nodes, one for each gene). The hidden layer had 12 neurons (the number of units was automatically computed). The stopping rule used was the minimum error ratio achieved. The output layer had two nodes (celiac disease and control). Other build options were the following: overfit prevention set (30%), replicate results (true), random seed (229176228), and missing values in predictors (delete listwise). The accuracy of the model was 100%.
The build settings for each technique are available upon request.
3.4. Differential Gene Expression of BTLA between Celiac Disease and Control Samples
In the GSE164883, BTLA was identified as a relevant marker in several techniques, including gene set enrichment analysis (GSEA), logistic regression, random trees, and artificial neural networks. A direct comparison of the gene expression of BTLA between celiac disease and control was statistically significant: 7.8 ± 4.4 vs. 3.7 ± 2.8 (p < 0.001) (Figure 5).
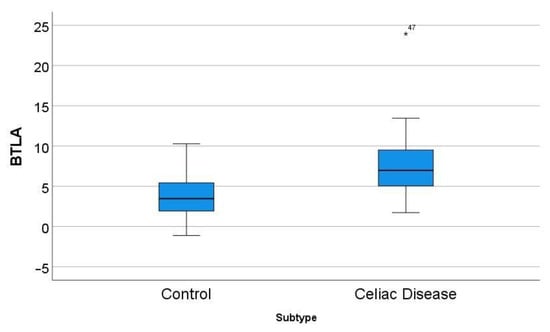
Figure 5.
Differential gene expression of BTLA between celiac disease and control in the series GSE164883. A direct comparison was statistically significant: 7.8 ± 4.4 vs. 3.7 ± 2.8 (p < 0.001). The icon “*” corresponds to a far outlier, and the number “47” is the case number (i.e. the BTLA expression value for case 47 was 23.94).
3.5. Validation of BTLA by Immunohistochemistry in an Independent Series
BTLA was analyzed at protein level by immunohistochemistry in an independent series of 16 celiac disease patients (with a total of 57 biopsies) and 16 small intestine controls (16 biopsies). The digital images of BTLA are uploaded to zenodo platform as a zip file (https://doi.org/10.5281/zenodo.6837120, accessed on 13 July 2022) (see Supplementary Materials). In the celiac disease cases, four biopsies were excluded from the analysis as BTLA expression was completely absent (0% of positive cells in the inflammatory infiltrate of the lamina propria) without the presence of internal controls.
The BTLA protein expression was evaluated in the inflammatory infiltrate of the lamina propria, and the percentage of positive cells estimated. The results showed that celiac disease was characterized by a higher frequency of BTLA-positive cells than controls: 70% ± 22.2 vs. 45.6% ± 12.6, respectively (p < 0.001) (Figure 6 and Figure 7). Additional immunophenotipic characterization is shown in Figure 8, which confirmed that BTLA mainly identified B lymphocytes of the lamina propria.
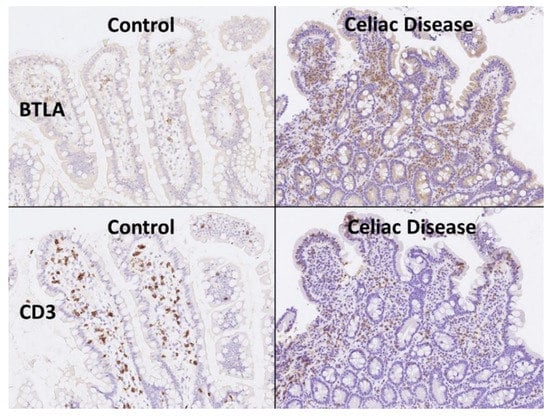
Figure 6.
BTLA protein expression by immunohistochemistry. Celiac disease cases were characterized by chronic inflammation of the lamina propria that was BTLA-positive. Using CD3 the T-cell lymphocytes are highlighted, including the higher presence of intraepitheal lymphocytes (IELs that characterize celiac disease). BTLA, B and T lymphocyte attenuator, is an inhibitory receptor with similarities to CTLA and PD-1. BTLA-deficient mice have increased specific antibody responses and enhanced sensitivity to experimental autoimmune encephalomyelitis (Uniprot).
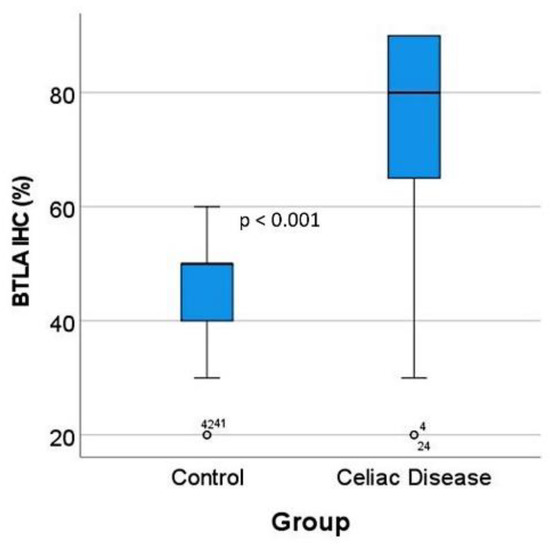
Figure 7.
BTLA protein expression by immunohistochemistry in the validation series. After BTLA immunohistochemistry and quantification, celiac disease cases were characterized by high BTLA protein expression (p < 0.001). The outliers are marked with a circle, next to the icon there is a number that corresponds to the case number.
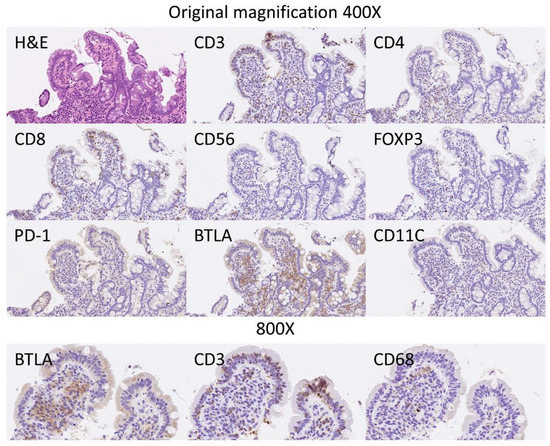
Figure 8.
BTLA protein expression by immunohistochemistry in relationship with other markers. Hematoxylin & Eosin staining confirmed the histological diagnosis of celiac disease, with increased intraepithelial lymphocytes (IELs) and with villous atrophy. The IELs were CD3+, CD4−, CD8+ and CD56−. Scarce FOXP3+regulatory T lymphocytes (Tregs) could be identified in the lamina propria. PD-1 staining was negative. The staining with BTLA was high in the lamina propria, and had a pattern of B lymphocytes. BTLA, B and T lymphocyte attenuator, is an inhibitory receptor with similarities to CTLA and PD-1. BTLA-deficient mice have increased specific antibody responses and enhanced sensitivity to experimental autoimmune encephalomyelitis (Uniprot).
3.6. Differential Gene Expression of LAG3 between Celiac Disease and Control Samples
In the GSE164883, LAG3 was identified as a relevant marker in several techniques, including gene set enrichment analysis (GSEA), random forest, and artificial neural networks. A direct comparison of the gene expression of LAG3 between celiac disease and control was statistically significant: 30.7 ± 17.9 vs. 4.6 ± 4.9 (p < 0.001) (Figure 9).
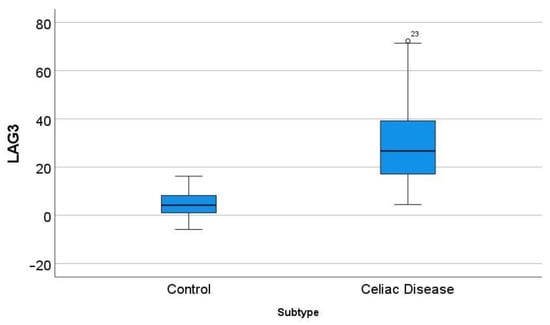
Figure 9.
Differential gene expression of LAG3 between celiac disease and control in the series GSE164883. A direct comparison was statistically significant: 30.7 ± 17.9 vs. 4.6 ± 4.9 (p < 0.001). The outliers are marked with a circle, next to the icon there is a number that corresponds to the case number.
This marker was also analyzed by immunohistochemistry. Despite the fact that the external and internal histological controls were positive, no staining of LAG3 was found in the lamina propria of celiac disease cases.
4. Discussion
This research performed a comprehensive analysis of celiac disease. First, artificial intelligence analysis predicted and modeled celiac disease using gene expression data, and as a result, several pathogenic candidates were highlighted. Additionally, other known pathogenic players were identified, which proved the validity of this type of proof-of-concept approach. Then, one of the highlighted markers was validated at protein level by immunohistochemistry in an independent series. BTLA was identified as a maker of the lymphocytes that form part of the chronic inflammatory infiltrate of the lamina propria.
Figure 10 shows a part of the pathogenesis of celiac disease. Despite harboring the genetic susceptibility and gluten (gliadin) consumption, in most cases the disease is latent and histologically normal. Nevertheless, in around 1% of the cases the patients are diagnosed because of clear clinical symptoms and histological criteria [1,2,3,4,5,6,7,8,9,10,11,12,13,14]. The immunological model suggests that gluten-specific CD4+T-cells and cytotoxic intraepithelial T lymphocytes (IEL) play a key role in the development of celiac disease [82,83,84], as defined by the presence of anti-TG2 antibodies and villous atrophy [85]. TGFB, retinoic acid (RA) and IL10, mucosal immune regulatory molecules, regulate the lamina propria inflammation by inducing the generation of regulatory T lymphocytes (Treg), a process regulated by CD11C (ITGAX)-positive dendritic cells (DC) [1,2,3,4,5,6,7,8,9,10,11,12,13,14]. Thus, Tregs will increase as a response to dampen the activation of effector mechanisms, both innate and humoral that destroy the mucosa [86]. Additionally, part of the epithelial damage is mediated by cytotoxic IELs that express activating NK cell receptors (mediated by IL15), which recognize stress- and inflammation-induced ligands on intestinal epithelial cells [1,2,3,4,5,6,7,8,9,10,11,12,13,14]. In this research, celiac disease was characterized by increased expression of BTLA in the lamina propria. The immunohistochemical pattern was a mixture of T and B lymphocytes. This result suggests that the immune checkpoint mechanism of BTLA is up-regulated during disease, and highlights the importance of suppression mechanisms. BTLA, B and T lymphocyte attenuator, is an inhibitory receptor with similarities to CTLA and PD-1. BTLA-deficient mice have increased specific antibody responses and enhanced sensitivity to experimental autoimmune encephalomyelitis (Uniprot).
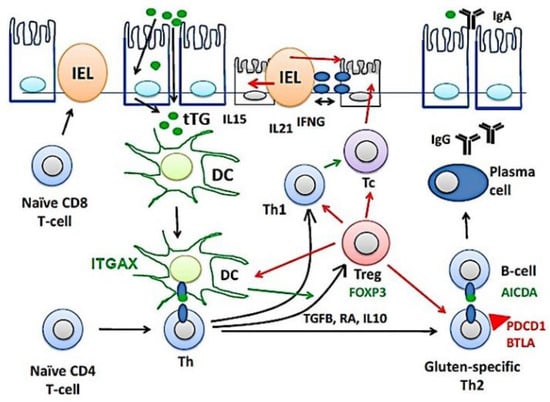
Figure 10.
The pathogenesis of celiac disease. The pathogenesis of celiac disease depends on genetic susceptibility and environmental factors (dietary gluten, gliadin). An abnormal immune response in the lamina propria will lead to the chronic inflammation of the mucosa, increased intraepithelial lymphocytes (IELs), and disruption of the epithelial layer. BTLA, B and T lymphocyte associated; DC, dendritic cell; Th, T-helper lymphocyte; IFNG, interferon gamma; Tc, cytotoxic T lymphocyte; tTG, tissue transglutaminase; Treg, regulatory T lymphocyte.
Machine learning is a branch of artificial intelligence (AI) that specializes in the application of data and algorithms to simulate the way that humans learn, gradually improving its accuracy [87,88,89]. Presently, machine learning is an important tool in the field of data science, and is becoming more important in biomedical research. This research also used artificial neural networks, which are a subfield of machine learning. Neural networks are composed of node layers, and input, one or more hidden layers, and an output layer [87,88,89]. In this study, we used a basic neural network to produce reliable results. This proof-of-concept exercise based on gene expression of celiac disease highlighted many markers, some known and other news.
Apart from BTLA, other markers were noted.
CASP3, caspase-3, belongs to the apoptotic signaling process and it is responsible for executing apoptosis. In celiac disease, apoptosis is an important mechanism for the epithelial and villous atrophy [90,91].
PRDM1, PR domain zinc finger protein 1, also known as BLIMP-1, is a transcription factor that mediates the function of T and NK cells in innate and adaptive immune responses. It also drives the maturation of B lymphocytes into immunoglobulin secreting cells (plasma cells) [92]. Plasma cells play an important role in the pathogenesis of celiac disease and are the most abundant gluten peptide MHC-expressing cells [93].
GZMB, granzyme B, is a protease present in the cytosolic granules of cytotoxic T lymphocytes (Tc) and natural killer (NK) cells, which activates caspase-independent pyroptosis into the target cells. In celiac disease, decreased expression of protease inhibitor 9, a GZMB inhibitor, is a potential mechanism of enterocyte destruction and villous atrophy [94].
LAG3, lymphocyte activation gene 3 protein, is an inhibitory receptor on antigen-activated T-cells [95]. It is present in type 1 T regulatory (Tr1) cells [96], which play a role in colitis [97]. Gliadin-specific type 1 regulatory T cells from the intestinal mucosa of treated celiac patients inhibit pathogenic T cells [98]. Endopeptidase mediated gliadin degradation by macrophages and concomitant IL-27 production drive differentiation of splenic gliadin-specific Tr1-like cells [99].
STAT5A, signal transducer and activator of transcription 5A, has dual functions including signal transduction and activation of transcription. STAT5A mediates cellular responses to cytokines and plays a role in homeostasis and in the function of innate lymphoid cells (ILCs) [100]. During gut inflammation, STAT5 promotes mucosal wound healing [101].
The classic celiac disease or gluten-sensitive enteropathy is clinically characterized by symptoms of malabsorption or diarrhea, histological changes in the small intestine consisting of villous atrophy, antibodies against tissue transglutaminase, and resolution following a gluten-free diet [1,102]. Additionally, there are other terms including atypical celiac disease, subclinical or asymptomatic disease, potential celiac disease, latent celiac disease, and refractory celiac disease [1]. The subtype of refractory celiac disease is of special interest because of the association with Enteropathy-Associated T-cell lymphoma (EATL) [103]. Nevertheless, this research focused on the “classic” variant or the “not otherwise specified (NOS)”.
In conclusion, this proof-of-concept exercise managed to model and predict celiac disease based on an autoimmune discovery panel; and highlighted pathogenic markers. Among these, we confirmed that celiac disease is characterized by increased BTLA expression.
Supplementary Materials
The following supporting information can be downloaded at https://doi.org/10.5281/zenodo.6837120, Histological images of BTLA.
Funding
This research was funded to J.C. by the Ministry of Education, Culture, Sports, Science and Technology (MEXT) and Japan Society for the Promotion of Science (JSPS), grant numbers KAKEN 15K19061 and 18K15100; Tokai University School of Medicine, research incentive assistant plan, grant number 2021-B04.
Institutional Review Board Statement
The study was conducted in accordance with the Declaration of Helsinki, and approved by the Institutional Review Board of TOKAI UNIVERSITY, SCHOOL OF MEDICINE (protocol code IRB14R-080 and IRB20-156).
Informed Consent Statement
Informed consent was obtained from all subjects involved in the study.
Data Availability Statement
All the data, including methodology, are available upon reasonable request to Dr. Joaquim Carreras (joaquim.carreras@tokai-u.jp). The digital images and the list of 755 of the autoimmune discovery panel are uploaded to Zenodo platform, links: https://doi.org/10.5281/zenodo.6837120 and https://doi.org/10.5281/zenodo.6976192 (accessed on 9 August 2022).
Acknowledgments
I want to thank all the researchers who contributed to the generation of the dataset GSE164883 and made it publicly available. I want to thank Giovanna Roncador from CNIO (Spain) for providing the BTLA antibody and Josep A. Bombi from the Department of Pathology, Hospital Clinic of Barcelona (Spain) for the celiac disease cases.
Conflicts of Interest
The author declares no conflict.
Appendix A
The clinicopathological characteristics of the cases are shown in the Appendix A Table A1 including age, sex, biopsy location, diagnosis and the histological grade using the Marsh-Oberhuber classification [104,105].
Table A1.
Clinicopatholgical characteristics.
Table A1.
Clinicopatholgical characteristics.
| Age | Sex | Biopsy Location | Diagnosis | Marsh-Oberhuber Classification |
|---|---|---|---|---|
| 70 | Male | Duodenum | Celiac Disease | 3a |
| 62 | Male | Pylorus/duodenum | Celiac Disease/Chronic gastritis | 2 |
| 62 | Male | Duodenum | Celiac Disease | 2 |
| 78 | Female | Duodenum | Celiac Disease | 3b |
| 59 | Male | Duodenum | Celiac Disease | 3a |
| 44 | Female | Duodenum | Celiac Disease | 2 |
| 17 | Female | Duodenum | Celiac Disease | 3b |
| 56 | Female | Duodenum | Celiac Disease | 3a |
| 54 | Female | Duodenum | Celiac Disease | 2 |
| 58 | Female | Duodenum | Celiac Disease | 3b |
| 61 | Female | Duodenum | Celiac Disease | 3c |
| 45 | Male | Duodenum | Celiac Disease | 3a |
| 70 | Female | Duodenum | Celiac Disease | 2 |
| 40 | Female | Duodenum | Celiac Disease | 3a |
| 61 | Female | Duodenum | Celiac Disease | 3c |
| 44 | Female | Duodenum | Celiac Disease | 3a |
References
- Schuppan, D.; Dieterich, W. Epidemiology, Pathogenesis, and Clinical Manifestations of Celiac Disease in Adults. Available online: https://www.uptodate.com/contents/epidemiology-pathogenesis-and-clinical-manifestations-of-celiac-disease-in-adults?source=history_widget (accessed on 13 July 2022).
- Al-Toma, A.; Goerres, M.S.; Meijer, J.W.; Peña, A.S.; Crusius, J.B.; Mulder, C.J. Human Leukocyte Antigen–DQ2 Homozygosity and the Development of Refractory Celiac Disease and Enteropathy-Associated T-Cell Lymphoma. Clin. Gastroenterol. Hepatol. 2006, 4, 315–319. [Google Scholar] [CrossRef] [PubMed]
- Pietzak, M.M.; Schofield, T.C.; McGinniss, M.J.; Nakamura, R.M. Stratifying Risk for Celiac Disease in a Large At-Risk United States Population by Using HLA Alleles. Clin. Gastroenterol. Hepatol. 2009, 7, 966–971. [Google Scholar] [CrossRef] [PubMed]
- Liu, E.; Lee, H.-S.; Aronsson, C.A.; Hagopian, W.A.; Koletzko, S.; Rewers, M.J.; Eisenbarth, G.S.; Bingley, P.J.; Bonifacio, E.; Simell, V.; et al. Risk of Pediatric Celiac Disease According to HLA Haplotype and Country. N. Engl. J. Med. 2014, 371, 42–49. [Google Scholar] [CrossRef] [PubMed]
- Houlston, R.S.; Ford, D. Genetics of coeliac disease. QJM Int. J. Med. 1996, 89, 737–744. [Google Scholar] [CrossRef]
- Houlston, R.S.; Tomlinson, I.P.; Ford, D.; Seal, S.; Marossy, A.M.; Ferguson, A.; Holmes, G.K.; Hosie, K.B.; Howdle, P.D.; Jewell, D.P.; et al. Linkage analysis of candidate regions for coeliac disease genes. Hum. Mol. Genet. 1997, 6, 1335–1339. [Google Scholar] [CrossRef][Green Version]
- Greco, L.; Corazza, G.; Babron, M.-C.; Clot, F.; Fulchignoni-Lataud, M.-C.; Percopo, S.; Zavattari, P.; Bouguerra, F.; Dib, C.; Tosi, R.; et al. Genome Search in Celiac Disease. Am. J. Hum. Genet. 1998, 62, 669–675. [Google Scholar] [CrossRef]
- Romanos, J.; van Diemen, C.C.; Nolte, I.M.; Trynka, G.; Zhernakova, A.; Fu, J.; Bardella, M.T.; Barisani, D.; McManus, R.; van Heel, D.; et al. Analysis of HLA and Non-HLA Alleles Can Identify Individuals at High Risk for Celiac Disease. Gastroenterology 2009, 137, 834–840.e3. [Google Scholar] [CrossRef]
- Trynka, G.; Zhernakova, A.; Romanos, J.; Franke, L.; Hunt, K.A.; Turner, G.; Bruinenberg, M.; Heap, G.A.; Platteel, M.; Ryan, A.W.; et al. Coeliac disease-associated risk variants in TNFAIP3 and REL implicate altered NF-kappa B signalling. Gut 2009, 58, 1078–1083. [Google Scholar] [CrossRef]
- Leonard, M.M.; Sapone, A.; Catassi, C.; Fasano, A. Celiac Disease and Nonceliac Gluten Sensitivity: A Review. JAMA 2017, 318, 647–656. [Google Scholar] [CrossRef]
- Caio, G.; Volta, U.; Sapone, A.; Leffler, D.A.; de Giorgio, R.; Catassi, C.; Fasano, A. Celiac disease: A comprehensive current review. BMC Med. 2019, 17, 142. [Google Scholar] [CrossRef]
- Oxentenko, A.S.; Rubio-Tapia, A. Celiac Disease. Mayo Clin. Proc. 2019, 94, 2556–2571. [Google Scholar] [CrossRef] [PubMed]
- Green, P.H.; Lebwohl, B.; Greywoode, R. Celiac disease. J. Allergy Clin. Immunol. 2015, 135, 1099–1106. [Google Scholar] [CrossRef]
- Lebwohl, B.; Sanders, D.S.; Green, P.H.R. Coeliac disease. Lancet 2018, 391, 70–81. [Google Scholar] [CrossRef]
- Naluai, A.T.; Ascher, H.; Nilsson, S.; Wahlström, J. Searching for genes influencing a complex disease: The case of coeliac disease. Eur. J. Hum. Genet. 2008, 16, 542–553. [Google Scholar] [CrossRef] [PubMed]
- Kahaly, G.J.; Frommer, L.; Schuppan, D. Celiac disease and endocrine autoimmunity—The genetic link. Autoimmun. Rev. 2018, 17, 1169–1175. [Google Scholar] [CrossRef]
- Kahaly, G.J.; Frommer, L.; Schuppan, D. Celiac Disease and Glandular Autoimmunity. Nutrients 2018, 10, 814. [Google Scholar] [CrossRef] [PubMed]
- Shewry, P.R.; Halford, N.G.; Belton, P.S.; Tatham, A.S. The structure and properties of gluten: An elastic protein from wheat grain. Philos. Trans. R. Soc. London Ser. B Biol. Sci. 2002, 357, 133–142. [Google Scholar] [CrossRef]
- Shan, L.; Molberg, Ø.; Parrot, I.; Hausch, F.; Filiz, F.; Gray, G.M.; Sollid, L.M.; Khosla, C. Structural Basis for Gluten Intolerance in Celiac Sprue. Science 2002, 297, 2275–2279. [Google Scholar] [CrossRef]
- Sollid, L.M. Coeliac disease: Dissecting a complex inflammatory disorder. Nat. Rev. Immunol. 2002, 2, 647–655. [Google Scholar] [CrossRef]
- Caminero, A.; Galipeau, H.J.; McCarville, J.L.; Johnston, C.W.; Bernier, S.P.; Russell, A.K.; Jury, J.; Herran, A.R.; Casqueiro, J.; Tye-Din, J.A.; et al. Duodenal Bacteria from Patients with Celiac Disease and Healthy Subjects Distinctly Affect Gluten Breakdown and Immunogenicity. Gastroenterology 2016, 151, 670–683. [Google Scholar] [CrossRef]
- van Heel, D.A.; Franke, L.; Hunt, K.A.; Gwilliam, R.; Zhernakova, A.; Inouye, M.; Wapenaar, M.C.; Barnardo, M.C.; Bethel, G.; Holmes, G.K.; et al. A genome-wide association study for celiac disease identifies risk variants in the region harboring IL2 and IL21. Nat. Genet. 2007, 39, 827–829. [Google Scholar] [CrossRef] [PubMed]
- Trynka, G.; Hunt, K.A.; Bockett, N.A.; Romanos, J.; Mistry, V.; Szperl, A.; Bakker, S.F.; Bardella, M.T.; Bhaw-Rosun, L.; Castillejo, G.; et al. Dense genotyping identifies and localizes multiple common and rare variant association signals in celiac disease. Nat. Genet. 2011, 43, 1193–1201. [Google Scholar] [CrossRef] [PubMed]
- Gutierrez-Achury, J.; Zhernakova, A.; Pulit, S.; Trynka, G.; Hunt, K.A.; Romanos, J.; Raychaudhuri, S.; Van Heel, D.A.; Wijmenga, C.; De Bakker, P.I. Fine mapping in the MHC region accounts for 18% additional genetic risk for celiac disease. Nat. Genet. 2015, 47, 577–578. [Google Scholar] [CrossRef] [PubMed]
- Hunt, K.A.; Zhernakova, A.; Turner, G.; Heap, G.A.; Franke, L.; Bruinenberg, M.; Romanos, J.; Dinesen, L.C.; Ryan, A.W.; Panesar, D.; et al. Newly identified genetic risk variants for celiac disease related to the immune response. Nat. Genet. 2008, 40, 395–402. [Google Scholar] [CrossRef]
- Dubois, P.C.; Trynka, G.; Franke, L.; Hunt, K.A.; Romanos, J.; Curtotti, A.; Zhernakova, A.; Heap, G.A.; Adány, R.; Aromaa, A.; et al. Multiple common variants for celiac disease influencing immune gene expression. Nat. Genet. 2010, 42, 295–302. [Google Scholar] [CrossRef]
- Mansour, H.; Banaganapalli, B.; Nasser, K.K.; Al-Aama, J.Y.; Shaik, N.A.; Saadah, O.I.; Elango, R. Genome-Wide Association Study-Guided Exome Rare Variant Burden Analysis Identifies IL1R1 and CD3E as Potential Autoimmunity Risk Genes for Celiac Disease. Front. Pediatr. 2022, 10, 837957. [Google Scholar] [CrossRef]
- Wijmenga, C.; Zhernakova, A. The importance of cohort studies in the post-GWAS era. Nat. Genet. 2018, 50, 322–328. [Google Scholar] [CrossRef]
- Lindfors, K.; Ciacci, C.; Kurppa, K.; Lundin, K.E.A.; Makharia, G.K.; Mearin, M.L.; Murray, J.A.; Verdu, E.F.; Kaukinen, K. Coeliac disease. Nat. Rev. Dis. Prim. 2019, 5, 3. [Google Scholar] [CrossRef]
- Dieterich, W.; Ehnis, T.; Bauer, M.; Donner, P.; Volta, U.; Riecken, E.O.; Schuppan, D. Identification of tissue transglutaminase as the autoantigen of celiac disease. Nat. Med. 1997, 3, 797–801. [Google Scholar] [CrossRef]
- Di Niro, R.; Snir, O.; Kaukinen, K.; Yaari, G.; Lundin, K.E.; Gupta, N.T.; Kleinstein, S.H.; Cols, M.; Cerutti, A.; Mäki, M.; et al. Responsive population dynamics and wide seeding into the duodenal lamina propria of transglutaminase-2-specific plasma cells in celiac disease. Mucosal Immunol. 2016, 9, 254–264. [Google Scholar] [CrossRef]
- Iversen, R.; Snir, O.; Stensland, M.; Kroll, J.E.; Steinsbø, Ø.; Korponay-Szabó, I.R.; Lundin, K.E.A.; de Souza, G.A.; Sollid, L.M. Strong Clonal Relatedness between Serum and Gut IgA despite Different Plasma Cell Origins. Cell Rep. 2017, 20, 2357–2367. [Google Scholar] [CrossRef] [PubMed]
- Rauhavirta, T.; Hietikko, M.; Salmi, T.; Lindfors, K. Transglutaminase 2 and Transglutaminase 2 Autoantibodies in Celiac Disease: A Review. Clin. Rev. Allergy Immunol. 2019, 57, 23–38. [Google Scholar] [CrossRef] [PubMed]
- Malamut, G.; El Machhour, R.; Montcuquet, N.; Martin-Lannerée, S.; Dusanter-Fourt, I.; Verkarre, V.; Mention, J.-J.; Rahmi, G.; Kiyono, H.; Butz, E.A.; et al. IL-15 triggers an antiapoptotic pathway in human intraepithelial lymphocytes that is a potential new target in celiac disease–associated inflammation and lymphomagenesis. J. Clin. Investig. 2010, 120, 2131–2143. [Google Scholar] [CrossRef]
- Salvati, V.M.; MacDonald, T.T.; Bajaj-Elliott, M.; Borrelli, M.; Staiano, A.; Auricchio, S.; Troncone, R.; Monteleone, G. Interleukin 18 and associated markers of T helper cell type 1 activity in coeliac disease. Gut 2002, 50, 186–190. [Google Scholar] [CrossRef]
- Kutlu, T.; Brousse, N.; Rambaud, C.; Le Deist, F.; Schmitz, J.; Cerf-Bensussan, N. Numbers of T cell receptor (TCR) alpha beta+ but not of TcR gamma delta+ intraepithelial lymphocytes correlate with the grade of villous atrophy in coeliac patients on a long term normal diet. Gut 1993, 34, 208–214. [Google Scholar] [CrossRef] [PubMed]
- Maiuri, L.; Ciacci, C.; Raia, V.; Vacca, L.; Ricciardelli, I.; Raimondi, F.; Auricchio, S.; Quaratino, S.; Londei, M. FAS engagement drives apoptosis of enterocytes of coeliac patients. Gut 2001, 48, 418–424. [Google Scholar] [CrossRef] [PubMed]
- Oberhuber, G.; Vogelsang, H.; Stolte, M.; Muthenthaler, S.; Kummer, J.A.; Radaszkiewicz, T. Evidence that intestinal intraepithelial lymphocytes are activated cytotoxic T cells in celiac disease but not in giardiasis. Am. J. Pathol. 1996, 148, 1351–1357. [Google Scholar]
- Hüe, S.; Mention, J.-J.; Monteiro, R.C.; Zhang, S.; Cellier, C.; Schmitz, J.; Verkarre, V.; Fodil, N.; Bahram, S.; Cerf-Bensussan, N.; et al. A Direct Role for NKG2D/MICA Interaction in Villous Atrophy during Celiac Disease. Immunity 2004, 21, 367–377. [Google Scholar] [CrossRef]
- Bhagat, G.; Naiyer, A.J.; Shah, J.G.; Harper, J.; Jabri, B.; Wang, T.C.; Green, P.H.; Manavalan, J.S. Small intestinal CD8+TCRgammadelta+NKG2A+ intraepithelial lymphocytes have attributes of regulatory cells in patients with celiac disease. J. Clin. Investig. 2008, 118, 281–293. [Google Scholar] [CrossRef]
- Abadie, V.; Discepolo, V.; Jabri, B. Intraepithelial lymphocytes in celiac disease immunopathology. Semin. Immunopathol. 2012, 34, 551–566. [Google Scholar] [CrossRef]
- Perez, F.; Ruera, C.N.; Miculan, E.; Carasi, P.; Chirdo, F.G. Programmed Cell Death in the Small Intestine: Implications for the Pathogenesis of Celiac Disease. Int. J. Mol. Sci. 2021, 22, 7426. [Google Scholar] [CrossRef] [PubMed]
- Setty, M.; Discepolo, V.; Abadie, V.; Kamhawi, S.; Mayassi, T.; Kent, A.; Ciszewski, C.; Maglio, M.; Kistner, E.; Bhagat, G.; et al. Distinct and Synergistic Contributions of Epithelial Stress and Adaptive Immunity to Functions of Intraepithelial Killer Cells and Active Celiac Disease. Gastroenterology 2015, 149, 681–691.e10. [Google Scholar] [CrossRef] [PubMed]
- Krzystek-Korpacka, M.; Kempiński, R.; Bromke, M.A.; Neubauer, K. Oxidative Stress Markers in Inflammatory Bowel Diseases: Systematic Review. Diagnostics 2020, 10, 601. [Google Scholar] [CrossRef] [PubMed]
- Wacklin, P.; Laurikka, P.; Lindfors, K.; Collin, P.; Salmi, T.; Lähdeaho, M.-L.; Saavalainen, P.; Mäki, M.; Mättö, J.; Kurppa, K.; et al. Altered Duodenal Microbiota Composition in Celiac Disease Patients Suffering from Persistent Symptoms on a Long-Term Gluten-Free Diet. Am. J. Gastroenterol. 2014, 109, 1933–1941. [Google Scholar] [CrossRef]
- Sánchez, E.; Donat, E.; Ribes-Koninckx, C.; Fernández-Murga, M.L.; Sanz, Y. Duodenal-Mucosal Bacteria Associated with Celiac Disease in Children. Appl. Environ. Microbiol. 2013, 79, 5472–5479. [Google Scholar] [CrossRef]
- D’Argenio, V.; Casaburi, G.; Precone, V.; Pagliuca, C.; Colicchio, R.; Sarnataro, D.; Discepolo, V.; Kim, S.M.; Russo, I.; Del Vecchio Blanco, G.; et al. Metagenomics Reveals Dysbiosis and a Potentially Pathogenic N. flavescens Strain in Duodenum of Adult Celiac Patients. Am. J. Gastroenterol. 2016, 111, 879–890. [Google Scholar] [CrossRef]
- Girbovan, A.; Sur, G.; Samasca, G.; Lupan, I. Dysbiosis a risk factor for celiac disease. Med. Microbiol. Immunol. 2017, 206, 83–91. [Google Scholar] [CrossRef]
- Chibbar, R.; Dieleman, L.A. The Gut Microbiota in Celiac Disease and Probiotics. Nutrients 2019, 11, 2375. [Google Scholar] [CrossRef]
- Nomura, K.; Ishikawa, D.; Okahara, K.; Ito, S.; Haga, K.; Takahashi, M.; Arakawa, A.; Shibuya, T.; Osada, T.; Kuwahara-Arai, K.; et al. Bacteroidetes Species Are Correlated with Disease Activity in Ulcerative Colitis. J. Clin. Med. 2021, 10, 1749. [Google Scholar] [CrossRef]
- Austin, A.S.; Logan, R.F.; Thomason, K.; Holmes, G.K. Cigarette smoking and adult coeliac disease. Scand. J. Gastroenterol. 2002, 37, 978–982. [Google Scholar] [CrossRef]
- Rubio-Tapia, A.; Ludvigsson, J.F.; Brantner, T.L.; Murray, J.A.; Everhart, J.E. The Prevalence of Celiac Disease in the United States. Am. J. Gastroenterol. 2012, 107, 1538–1544. [Google Scholar] [CrossRef] [PubMed]
- Choung, R.S.; Larson, S.A.; Khaleghi, S.; Rubio-Tapia, A.; Ovsyannikova, I.G.; King, K.S.; Larson, J.J.; Lahr, B.D.; Poland, G.A.; Camilleri, M.J.; et al. Prevalence and Morbidity of Undiagnosed Celiac Disease from a Community-Based Study. Gastroenterology 2017, 152, 830–839.e5. [Google Scholar] [CrossRef] [PubMed]
- Schuppan, D.; Hahn, E.G. Celiac disease and its link to type 1 diabetes mellitus. J. Pediatr. Endocrinol. Metab. 2001, 14 (Suppl. S1), 597–605. [Google Scholar] [CrossRef] [PubMed]
- Acerini, C.L.; Ahmed, M.L.; Ross, K.M.; Sullivan, P.B.; Bird, G.; Dunger, D.B. Coeliac disease in children and adolescents with IDDM: Clinical characteristics and response to gluten-free diet. Diabet. Med. 1998, 15, 38–44. [Google Scholar] [CrossRef]
- Cronin, C.C.; Feighery, A.; Ferriss, J.B.; Liddy, C.; Shanahan, F.; Feighery, C. High prevalence of celiac disease among patients with insulin-dependent (type I) diabetes mellitus. Am. J. Gastroenterol. 1997, 92, 2210–2212. [Google Scholar]
- Talal, A.H.; Murray, J.A.; Goeken, J.A.; Sivitz, W.I. Celiac disease in an adult population with insulin-dependent diabetes mellitus: Use of endomysial antibody testing. Am. J. Gastroenterol. 1997, 92, 1280–1284. [Google Scholar]
- Counsell, C.E.; Taha, A.; Ruddell, W.S. Coeliac disease and autoimmune thyroid disease. Gut 1994, 35, 844–846. [Google Scholar] [CrossRef]
- Badenhoop, K.; Dieterich, W.; Segni, M.; Hofmann, S.; Hüfner, M.; Usadel, K.H.; Hahn, E.G.; Schuppan, D. HLA DQ2 and/or DQ8 Is Associated With Celiac Disease–Specific Autoantibodies to Tissue Transglutaminase in Families With Thyroid Autoimmunity. Am. J. Gastroenterol. 2001, 96, 1648–1649. [Google Scholar] [CrossRef]
- Ciacci, C.; Cavallaro, R.; Iovino, P.; Sabbatini, F.; Palumbo, A.; Amoruso, D.; Tortora, R.; Mazzacca, G. Allergy prevalence in adult celiac disease. J. Allergy Clin. Immunol. 2004, 113, 1199–1203. [Google Scholar] [CrossRef]
- Zauli, D.; Grassi, A.; Granito, A.; Foderaro, S.; De Franceschi, L.; Ballardini, G.; Bianchi, F.; Volta, U. Prevalence of silent coeliac disease in atopics. Dig. Liver Dis. 2000, 32, 775–779. [Google Scholar] [CrossRef]
- Volta, U.; De Giorgio, R.; Granito, A.; Stanghellini, V.; Barbara, G.; Avoni, P.; Liguori, R.; Petrolini, N.; Fiorini, E.; Montagna, P.; et al. Anti-ganglioside antibodies in coeliac disease with neurological disorders. Dig. Liver Dis. 2006, 38, 183–187. [Google Scholar] [CrossRef] [PubMed]
- Cervio, E.; Volta, U.; Verri, M.; Boschi, F.; Pastoris, O.; Granito, A.; Barbara, G.; Parisi, C.; Felicani, C.; Tonini, M.; et al. Sera of Patients With Celiac Disease and Neurologic Disorders Evoke a Mitochondrial-Dependent Apoptosis In Vitro. Gastroenterology 2007, 133, 195–206. [Google Scholar] [CrossRef] [PubMed]
- Wierdsma, N.J.; Nijeboer, P.; de van der Schueren, M.A.; Berkenpas, M.; van Bodegraven, A.A.; Mulder, C.J. Refractory celiac disease and EATL patients show severe malnutrition and malabsorption at diagnosis. Clin. Nutr. 2016, 35, 685–691. [Google Scholar] [CrossRef] [PubMed]
- García-Hoz, C.; Crespo, L.; Lopez, N.; De Andrés, A.; Ríos León, R.; Santón, A.; Garriga, M.; Butz, E.; León, F.; Roy Ariño, G. The Intracellular Intensity of CD3 on Aberrant Intraepithelial Lymphocytes Is a Prognostic Factor of the Progression to Overt Lymphoma in Refractory Celiac Disease Type II (Pre-Enteropathy-Associated T Cell Lymphoma). Dig. Dis. 2020, 38, 490–499. [Google Scholar] [CrossRef]
- Soderquist, C.R.; Lewis, S.K.; Gru, A.A.; Vlad, G.; Williams, E.S.; Hsiao, S.; Mansukhani, M.M.; Park, D.C.; Bacchi, C.E.; Alobeid, B.; et al. Immunophenotypic Spectrum and Genomic Landscape of Refractory Celiac Disease Type II. Am. J. Surg. Pathol. 2021, 45, 905–916. [Google Scholar] [CrossRef]
- Chibbar, R.; Nostedt, J.; Mihalicz, D.; Deschenes, J.; McLean, R.; Dieleman, L.A. Refractory Celiac Disease Type II: A Case Report and Literature Review. Front. Med. 2020, 7, 564875. [Google Scholar] [CrossRef]
- Liu, H.; Brais, R.; Lavergne-Slove, A.; Jeng, Q.; Payne, K.; Ye, H.; Liu, Z.; Carreras, J.; Huang, Y.; Bacon, C.M.; et al. Continual monitoring of intraepithelial lymphocyte immunophenotype and clonality is more important than snapshot analysis in the surveillance of refractory coeliac disease. Gut 2010, 59, 452–460. [Google Scholar] [CrossRef]
- Mulder, C.J.; Wahab, P.J.; Moshaver, B.; Meijer, J.W. Refractory coeliac disease: A window between coeliac disease and enteropathy associated T cell lymphoma. Scand. J. Gastroenterol. Suppl. 2000, 232, 32–37. [Google Scholar]
- Wolf, J.; Willscher, E.; Loeffler-Wirth, H.; Schmidt, M.; Flemming, G.; Zurek, M.; Uhlig, H.H.; Händel, N.; Binder, H. Deciphering the Transcriptomic Heterogeneity of Duodenal Coeliac Disease Biopsies. Int. J. Mol. Sci. 2021, 22, 2551. [Google Scholar] [CrossRef]
- Carreras, J.; Nakamura, N.; Hamoudi, R. Artificial Intelligence Analysis of Gene Expression Predicted the Overall Survival of Mantle Cell Lymphoma and a Large Pan-Cancer Series. Healthcare 2022, 10, 155. [Google Scholar] [CrossRef]
- Carreras, J.; Hamoudi, R.; Nakamura, N. Artificial Intelligence Analysis of Gene Expression Data Predicted the Prognosis of Patients with Diffuse Large B-Cell Lymphoma. Tokai J. Exp. Clin. Med. 2020, 45, 37–48. [Google Scholar] [PubMed]
- Carreras, J.; Kikuti, Y.Y.; Miyaoka, M.; Hiraiwa, S.; Tomita, S.; Ikoma, H.; Kondo, Y.; Ito, A.; Nakamura, N.; Hamoudi, R. A Combination of Multilayer Perceptron, Radial Basis Function Artificial Neural Networks and Machine Learning Image Segmentation for the Dimension Reduction and the Prognosis Assessment of Diffuse Large B-Cell Lymphoma. AI 2021, 2, 106–134. [Google Scholar] [CrossRef]
- Carreras, J.; Kikuti, Y.Y.; Miyaoka, M.; Hiraiwa, S.; Tomita, S.; Ikoma, H.; Kondo, Y.; Ito, A.; Shiraiwa, S.; Hamoudi, R.; et al. A Single Gene Expression Set Derived from Artificial Intelligence Predicted the Prognosis of Several Lymphoma Subtypes; and High Immunohistochemical Expression of TNFAIP8 Associated with Poor Prognosis in Diffuse Large B-Cell Lympho-ma. AI 2020, 1, 342–360. [Google Scholar] [CrossRef]
- Carreras, J.; Kikuti, Y.Y.; Roncador, G.; Miyaoka, M.; Hiraiwa, S.; Tomita, S.; Ikoma, H.; Kondo, Y.; Ito, A.; Shiraiwa, S.; et al. High Expression of Caspase-8 Associated with Improved Survival in Diffuse Large B-Cell Lymphoma: Machine Learning and Artificial Neural Networks Analyses. BioMedInformatics 2021, 1, 18–46. [Google Scholar] [CrossRef]
- Carreras, J.; Hiraiwa, S.; Kikuti, Y.Y.; Miyaoka, M.; Tomita, S.; Ikoma, H.; Ito, A.; Kondo, Y.; Roncador, G.; Garcia, J.F.; et al. Artificial Neural Networks Predicted the Overall Survival and Molecular Subtypes of Diffuse Large B-Cell Lymphoma Using a Pancancer Immune-Oncology Panel. Cancers 2021, 13, 6384. [Google Scholar] [CrossRef]
- Carreras, J.; Kikuti, Y.Y.; Miyaoka, M.; Roncador, G.; Garcia, J.F.; Hiraiwa, S.; Tomita, S.; Ikoma, H.; Kondo, Y.; Ito, A.; et al. Integrative Statistics, Machine Learning and Artificial Intelligence Neural Network Analysis Correlated CSF1R with the Prognosis of Diffuse Large B-Cell Lymphoma. Hemato 2021, 2, 182–206. [Google Scholar] [CrossRef]
- Carreras, J.; Hamoudi, R. Artificial Neural Network Analysis of Gene Expression Data Predicted Non-Hodgkin Lymphoma Subtypes with High Accuracy. Mach. Learn. Knowl. Extr. 2021, 3, 720–739. [Google Scholar] [CrossRef]
- Carreras, J.; Kikuti, Y.Y.; Miyaoka, M.; Hiraiwa, S.; Tomita, S.; Ikoma, H.; Kondo, Y.; Ito, A.; Nakamura, N.; Hamoudi, R. Artificial Intelligence Analysis of the Gene Expression of Follicular Lymphoma Predicted the Overall Survival and Correlated with the Immune Microenvironment Response Signatures. Mach. Learn. Knowl. Extr. 2020, 2, 647–671. [Google Scholar] [CrossRef]
- Carreras, J.; Kikuti, Y.Y.; Miyaoka, M.; Hiraiwa, S.; Tomita, S.; Ikoma, H.; Kondo, Y.; Ito, A.; Hamoudi, R.; Nakamura, N. The Use of the Random Number Generator and Artificial Intelligence Analysis for Dimensionality Reduction of Follicular Lymphoma Transcriptomic Data. BioMedInformatics 2022, 2, 268–280. [Google Scholar] [CrossRef]
- Carreras, J. Artificial Intelligence Analysis of Ulcerative Colitis Using an Autoimmune Discovery Transcriptomic Panel. Healthcare 2022, 10, 1476. [Google Scholar] [CrossRef]
- Uhde, M.; Yu, X.; Bunin, A.; Brauner, C.; Lewis, S.K.; Lebwohl, B.; Krishnareddy, S.; Alaedini, A.; Reizis, B.; Ghosh, S.; et al. Phenotypic shift of small intestinal intra-epithelial type 1 innate lymphoid cells in celiac disease is associated with enhanced cytotoxic potential. Clin. Exp. Immunol. 2020, 200, 163–175. [Google Scholar] [CrossRef] [PubMed]
- van Wanrooij, R.L.; Müller, D.M.; Neefjes-Borst, E.A.; Meijer, J.; Koudstaal, L.G.; Heideman, D.A.; Bontkes, H.J.; von Blomberg, B.M.; Bouma, G.; Mulder, C.J. Optimal Strategies to Identify Aberrant Intra-Epithelial Lymphocytes in Refractory Coeliac Disease. J. Clin. Immunol. 2014, 34, 828–835. [Google Scholar] [CrossRef] [PubMed]
- Verbeek, W.H.; Goerres, M.S.; von Blomberg, B.M.; Oudejans, J.J.; Scholten, P.E.; Hadithi, M.; Al-Toma, A.; Schreurs, M.W.; Mulder, C.J. Flow cytometric determination of aberrant intra-epithelial lymphocytes predicts T-cell lymphoma development more accurately than T-cell clonality analysis in Refractory Celiac Disease. Clin. Immunol. 2008, 126, 48–56. [Google Scholar] [CrossRef] [PubMed]
- Müller, L.; Szaflarska-Popławska, A. Immunologiczne mechanizmy w chorobie trzewnej [Immunological mechanisms of celiac disease]. Przegl. Lek. 2005, 62, 123–127. (In Polish) [Google Scholar] [PubMed]
- Mazzarella, G. Effector and suppressor T cells in celiac disease. World J. Gastroenterol. 2015, 21, 7349–7356. [Google Scholar] [CrossRef]
- IBM Cloud Education. Machine Learning. 15 July 2020. IBM Cloud Learn Hub. IBM Corporation. Available online: https://www.ibm.com/cloud/learn/machine-learning (accessed on 13 July 2022).
- IBM. IBM SPSS Neural Networks 26; IBM: Armonk, NY, USA, 2019. [Google Scholar]
- IBM. IBM SPSS Neural Networks; New Tools for Building Predictive Models; YTD03119-GBEN-01; IBM: Somers, NY, USA, 2012. [Google Scholar]
- Schumann, M.; Siegmund, B.; Schulzke, J.D.; Fromm, M. Celiac Disease: Role of the Epithelial Barrier. Cell. Mol. Gastroenterol. Hepatol. 2017, 3, 150–162. [Google Scholar] [CrossRef]
- Shalimar, D.M.; Das, P.; Sreenivas, V.; Gupta, S.D.; Panda, S.K.; Makharia, G.K. Mechanism of Villous Atrophy in Celiac Disease: Role of Apoptosis and Epithelial Regeneration. Arch. Pathol. Lab. Med. 2013, 137, 1262–1269. [Google Scholar] [CrossRef]
- Györy, I.; Fejér, G.; Ghosh, N.; Seto, E.; Wright, K.L. Identification of a Functionally Impaired Positive Regulatory Domain I Binding Factor 1 Transcription Repressor in Myeloma Cell Lines. J. Immunol. 2003, 170, 3125–3133. [Google Scholar] [CrossRef]
- Høydahl, L.S.; Richter, L.; Frick, R.; Snir, O.; Gunnarsen, K.S.; Landsverk, O.J.B.; Iversen, R.; Jeliazkov, J.; Gray, J.J.; Bergseng, E.; et al. Plasma Cells Are the Most Abundant Gluten Peptide MHC-expressing Cells in Inflamed Intestinal Tissues From Patients with Celiac Disease. Gastroenterology 2019, 156, 1428–1439.e10. [Google Scholar] [CrossRef]
- Pohjanen, V.M.; Kokkonen, T.S.; Arvonen, M.; Augustin, M.A.; Patankar, M.; Turunen, S.; Vähäsalo, P.; Karttunen, T.J. Decreased Expression of Protease Inhibitor 9, a Granzyme B Inhibitor, in Celiac Disease: A Potential Mechanism in Enterocyte Destruction and Villous Atrophy. Int. J. Immunopathol. Pharmacol. 2013, 26, 897–905. [Google Scholar] [CrossRef]
- Huard, B.; Tournier, M.; Hercend, T.; Triebel, F.; Faure, F. Lymphocyte-activation gene 3/major histocompatibility complex class II interaction modulates the antigenic response of CD4+ T lymphocytes. Eur. J. Immunol. 1994, 24, 3216–3221. [Google Scholar] [CrossRef] [PubMed]
- Gagliani, N.; Magnani, C.F.; Huber, S.; Gianolini, M.E.; Pala, M.; Licona-Limon, P.; Guo, B.; Herbert, D.R.; Bulfone, A.; Trentini, F.; et al. Coexpression of CD49b and LAG-3 identifies human and mouse T regulatory type 1 cells. Nat. Med. 2013, 19, 739–746. [Google Scholar] [CrossRef] [PubMed]
- Bauché, D.; Joyce-Shaikh, B.; Jain, R.; Grein, J.; Ku, K.S.; Blumenschein, W.M.; Ganal-Vonarburg, S.C.; Wilson, D.C.; McClanahan, T.K.; Malefyt, R.W.; et al. LAG3+ Regulatory T Cells Restrain Interleukin-23-Producing CX3CR1+ Gut-Resident Macrophages during Group 3 Innate Lymphoid Cell-Driven Colitis. Immunity 2018, 49, 342–352.e5. [Google Scholar] [CrossRef] [PubMed]
- Gianfrani, C.; Levings, M.K.; Sartirana, C.; Mazzarella, G.; Barba, G.; Zanzi, D.; Camarca, A.; Iaquinto, G.; Giardullo, N.; Auricchio, S.; et al. Gliadin-specific type 1 regulatory T cells from the intestinal mucosa of treated celiac patients inhibit pathogenic T cells. J. Immunol. 2006, 177, 4178–4186. [Google Scholar] [CrossRef] [PubMed]
- van Leeuwen, M.A.; Costes, L.M.M.; van Berkel, L.A.; Simons-Oosterhuis, Y.; du Pré, M.F.; Kozijn, A.E.; Raatgeep, H.C.; Linden-bergh-Kortleve, D.J.; van Rooijen, N.; Koning, F.; et al. Macrophage-mediated gliadin degradation and concomitant IL-27 production drive IL-10- and IFN-γ-secreting Tr1-like-cell differentiation in a murine model for gluten tolerance. Mucosal Immunol. 2017, 10, 635–649. [Google Scholar] [CrossRef]
- Villarino, A.V.; Sciumè, G.; Davis, F.P.; Iwata, S.; Zitti, B.; Robinson, G.W.; Hennighausen, L.; Kanno, Y.; O’Shea, J.J. Subset- and tissue-defined STAT5 thresholds control homeostasis and function of innate lymphoid cells. J. Exp. Med. 2017, 214, 2999–3014. [Google Scholar] [CrossRef]
- Gilbert, S.; Zhang, R.; Denson, L.; Moriggl, R.; Steinbrecher, K.; Shroyer, N.; Lin, J.; Han, X. Enterocyte STAT5 promotes mucosal wound healing via suppression of myosin light chain kinase-mediated loss of barrier function and inflammation. EMBO Mol. Med. 2012, 4, 109–124. [Google Scholar] [CrossRef]
- Rubin, C.E.; Brandborg, L.L.; Phelps, P.C.; Taylor, H.C., Jr. Studies of celiac disease I. The apparent identical and specific nature of the duodenal and proximal jejunal lesion in celiac disease and idiopathic sprue. Gastroenterology 1960, 38, 28–49. [Google Scholar] [CrossRef]
- Hujoel, I.A.; Murray, J.A. Refractory Celiac Disease. Curr. Gastroenterol. Rep. 2020, 22, 18. [Google Scholar] [CrossRef]
- Oberhuber, G.; Granditsch, G.; Vogelsang, H. The histopathology of coeliac disease: Time for a standardized report scheme for pathologists. Eur. J. Gastroenterol. Hepatol. 1999, 11, 1185–1194. [Google Scholar] [CrossRef]
- Kelly, C.P.; Lamont, J.T.; Grover, S. Diagnosis of Celiac Disease in Adults. UpToDate. 7 April 2022. Available online: https://www.uptodate.com/contents/diagnosis-of-celiac-disease-in-adults?search=celiac%20disease&source=search_result&selectedTitle=1~150&usage_type=default&display_rank=1#H3181992152 (accessed on 13 July 2022).


Publisher’s Note: MDPI stays neutral with regard to jurisdictional claims in published maps and institutional affiliations. |
© 2022 by the author. Licensee MDPI, Basel, Switzerland. This article is an open access article distributed under the terms and conditions of the Creative Commons Attribution (CC BY) license (https://creativecommons.org/licenses/by/4.0/).